


 Экономика
Похожие презентации:


")


ASB-1300 (CORE Economics). Unit 1. The capitalist revolution
1.
ASB-1300 (CORE Economics)Unit 1
THE CAPITALIST REVOLUTION
2.
OUTLINEA. Introduction - “Hockey-stick” growth
B. Measuring living standards
C. Technological change
D. Capitalism
E. Inequality and environmental degradation
3.
A. Introduction4.
Hans Rosling's 200 Countries, 200 Years, 4Minutes
5.
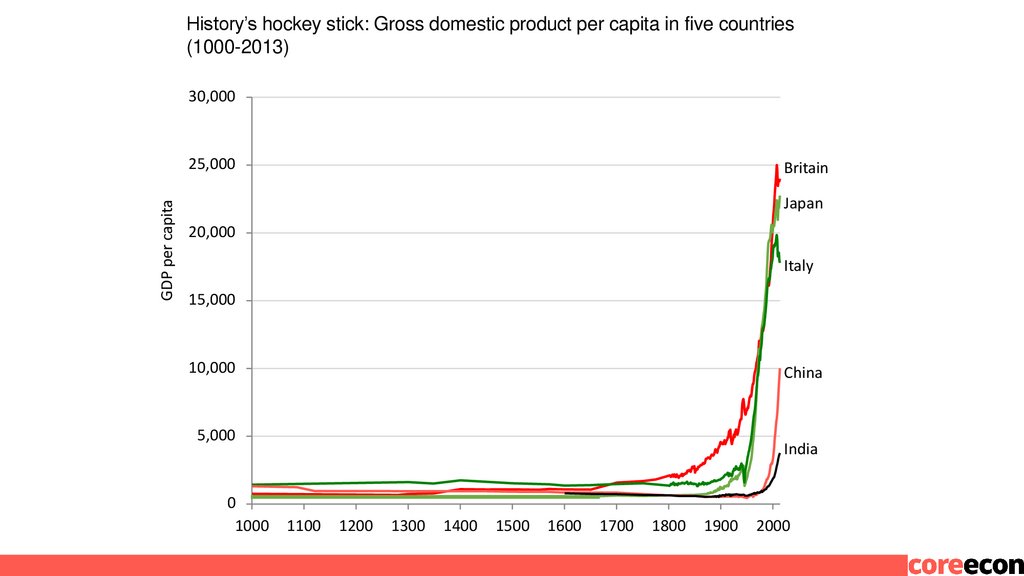
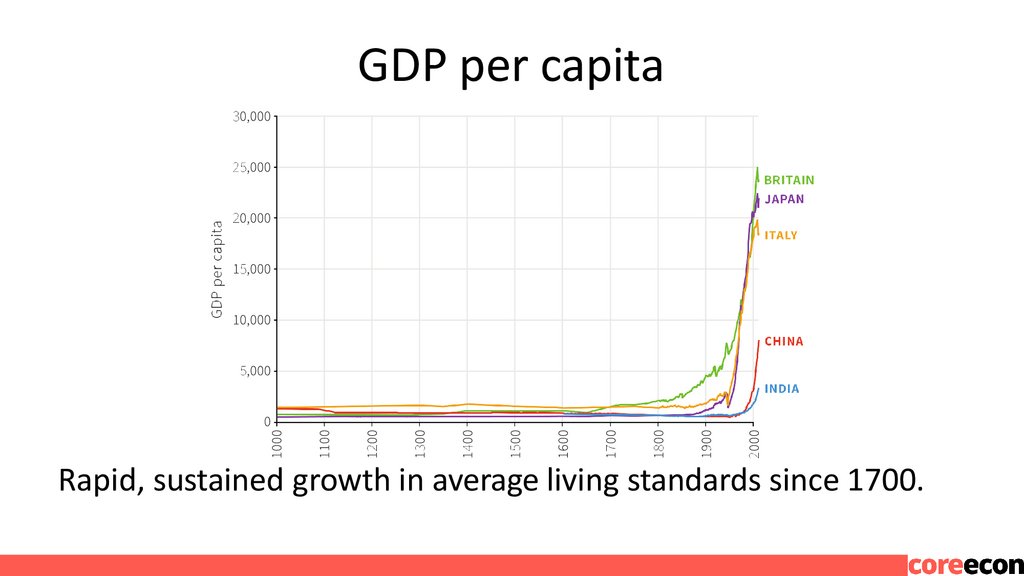
History’s hockey stick: Gross domestic product per capita in five countries(1000-2013)
30,000
GDP per capita
25,000
Britain
Japan
20,000
Italy
15,000
10,000
China
5,000
0
1000
India
1100
1200
1300
1400
1500
1600
1700
1800
1900
2000
6.
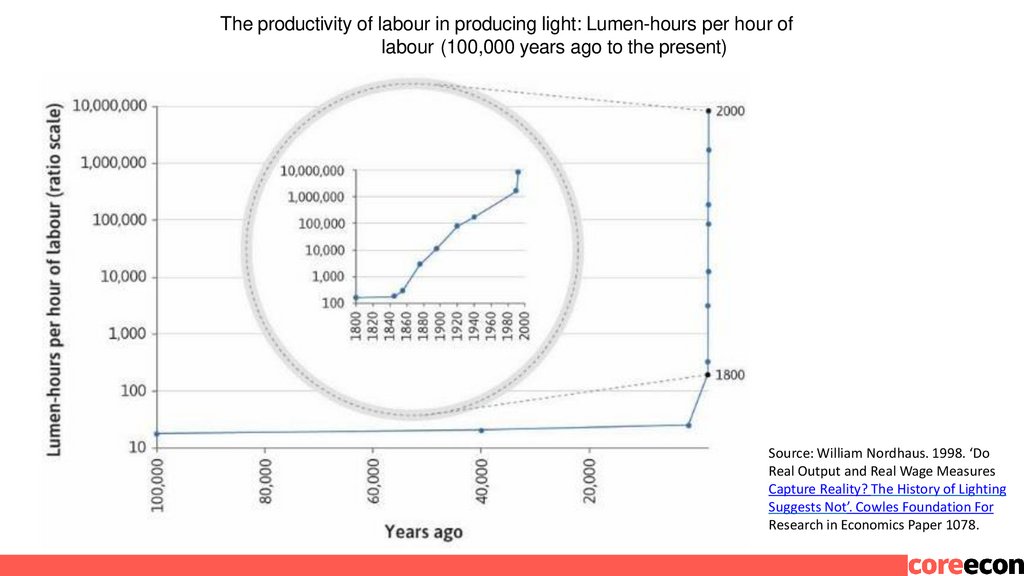
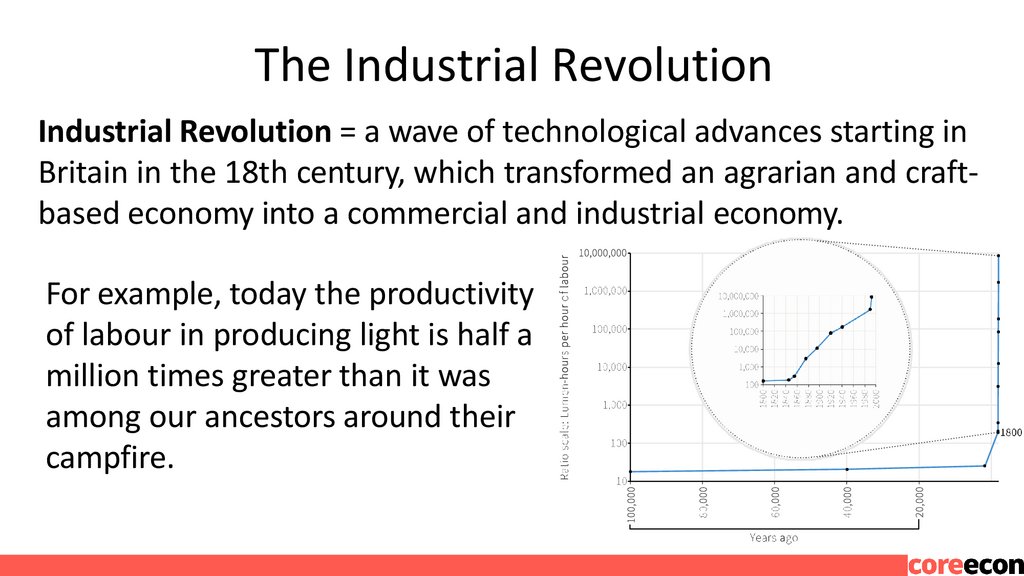
The productivity of labour in producing light: Lumen-hours per hour oflabour (100,000 years ago to the present)
Source: William Nordhaus. 1998. ‘Do
Real Output and Real Wage Measures
Capture Reality? The History of Lighting
Suggests Not’. Cowles Foundation For
Research in Economics Paper 1078.
7.
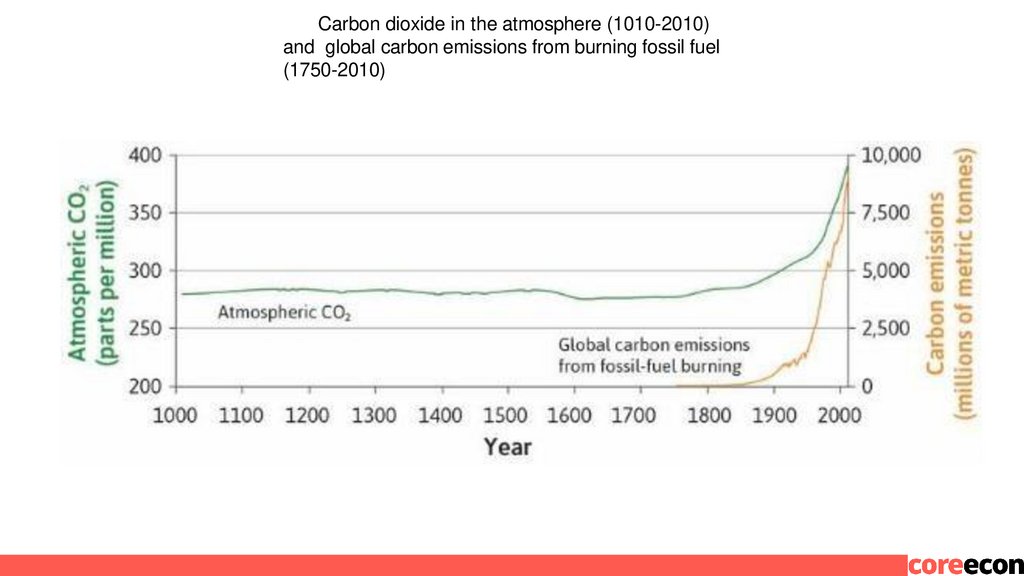
Carbon dioxide in the atmosphere (1010-2010)and global carbon emissions from burning fossil fuel
(1750-2010)
8.
This Unit’s Big Question:What has happened in the last 200 years that
makes this period special in history?
9.
What the empirical evidence shows us:• Increased income and living standards in many
countries
• Improvements in technology
• Impact on the environment
• Economic inequality and divergence
10.
B. Measuring living standards11.
GDP per capitaRapid, sustained growth in average living standards since 1700.
12.
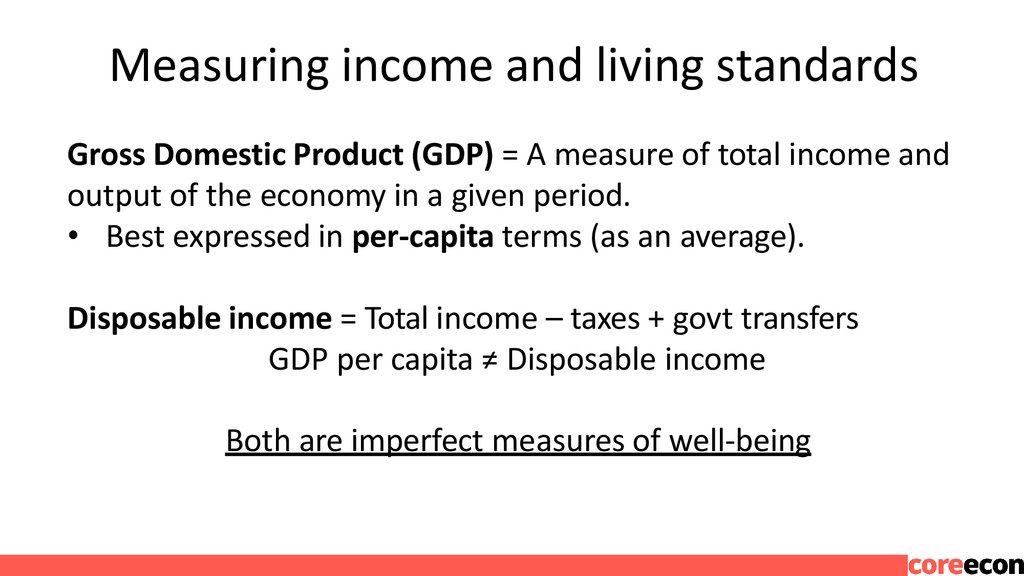
Measuring income and living standardsGross Domestic Product (GDP) = A measure of total income and
output of the economy in a given period.
• Best expressed in per-capita terms (as an average).
Disposable income = Total income – taxes + govt transfers
GDP per capita ≠ Disposable income
Both are imperfect measures of well-being
13.
Measuring income and living standardsacross time and across countries
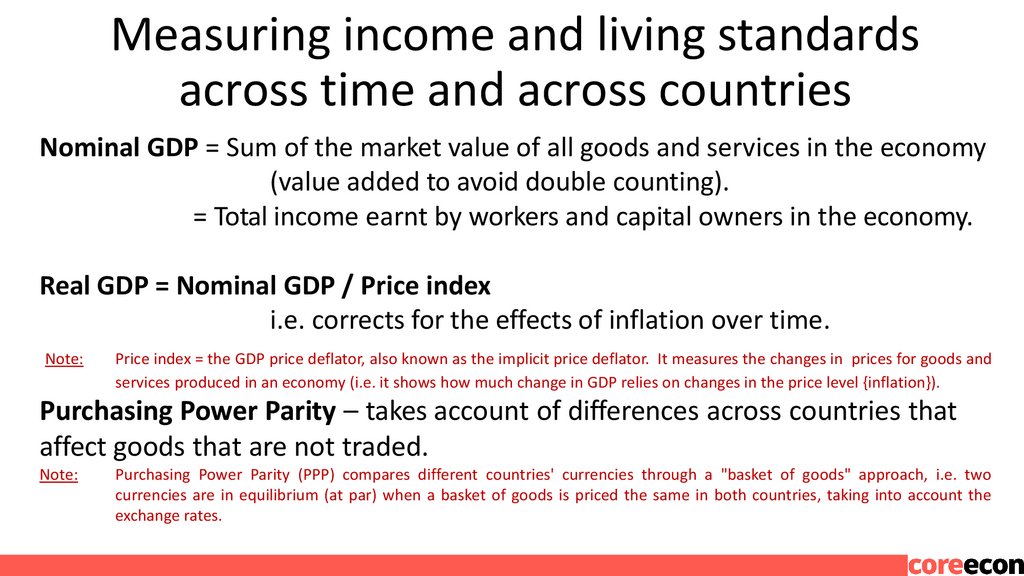
Nominal GDP = Sum of the market value of all goods and services in the economy
(value added to avoid double counting).
= Total income earnt by workers and capital owners in the economy.
Real GDP = Nominal GDP / Price index
i.e. corrects for the effects of inflation over time.
Note:
Price index = the GDP price deflator, also known as the implicit price deflator. It measures the changes in prices for goods and
services produced in an economy (i.e. it shows how much change in GDP relies on changes in the price level {inflation}).
Purchasing Power Parity – takes account of differences across countries that
affect goods that are not traded.
Note:
Purchasing Power Parity (PPP) compares different countries' currencies through a "basket of goods" approach, i.e. two
currencies are in equilibrium (at par) when a basket of goods is priced the same in both countries, taking into account the
exchange rates.
14.
15.
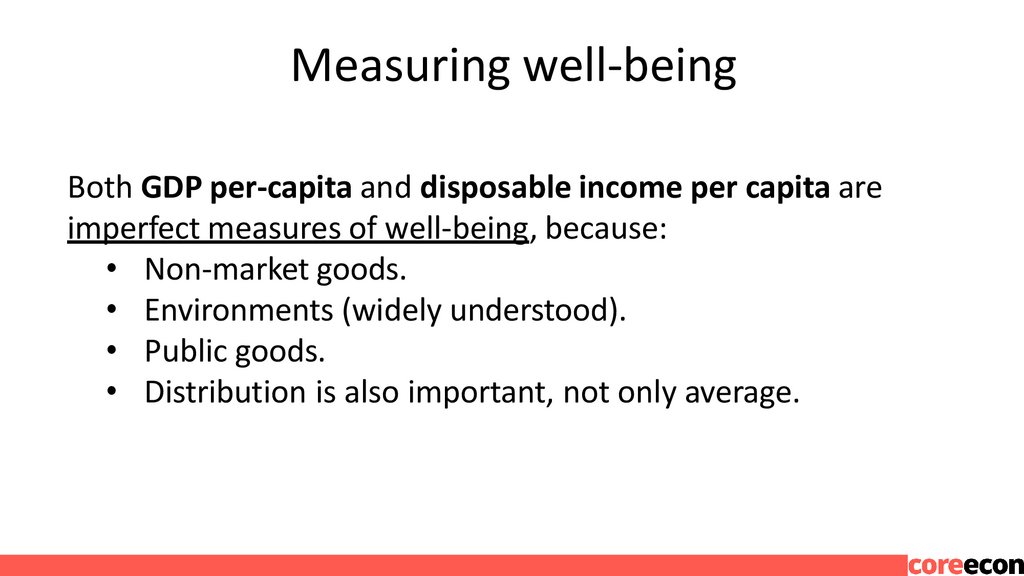
Measuring well-beingBoth GDP per-capita and disposable income per capita are
imperfect measures of well-being, because:
• Non-market goods.
• Environments (widely understood).
• Public goods.
• Distribution is also important, not only average.
16.
C. Technological change17.
The Technological RevolutionTechnology = A process that uses inputs to produce output(s)
through the use of machinery and equipment developed from
the application of scientific knowledge
By reducing the amount of work-time it takes to produce the
things we need, technological changes allowed significant
increases in living standards.
Remarkable scientific and technological advances occurred more
or less at the same time as the upward kink in the hockey stick in
Britain in the middle of the 18th century.
18.
The Industrial RevolutionIndustrial Revolution = a wave of technological advances starting in
Britain in the 18th century, which transformed an agrarian and craftbased economy into a commercial and industrial economy.
For example, today the productivity
of labour in producing light is half a
million times greater than it was
among our ancestors around their
campfire.
19.
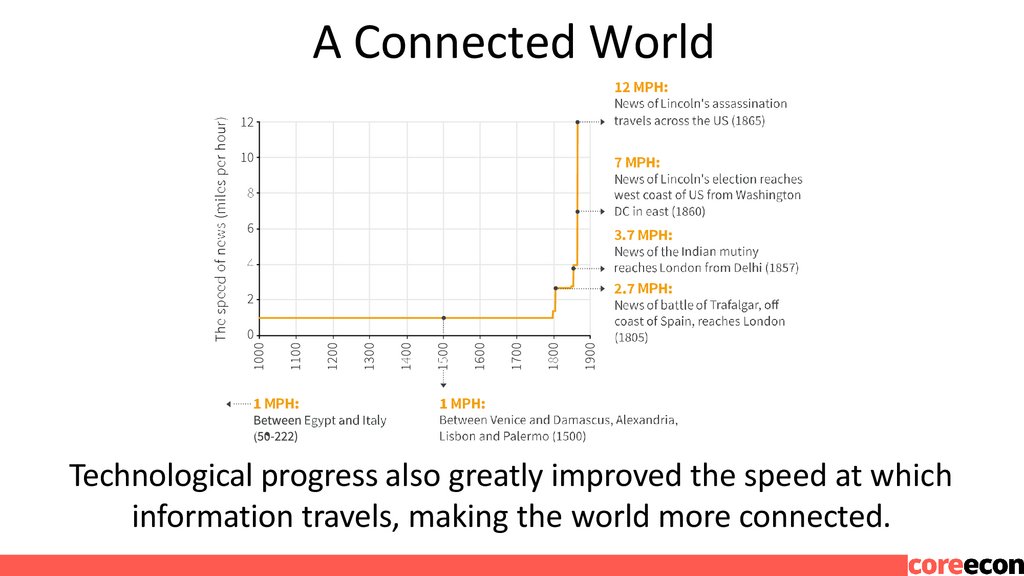
A Connected WorldTechnological progress also greatly improved the speed at which
information travels, making the world more connected.
20.
So…Did technology cause the increase in living standards?
OR
Did improved living standards cause improvements in technology?
OR
Did something else cause both?
21.
D. Capitalism22.
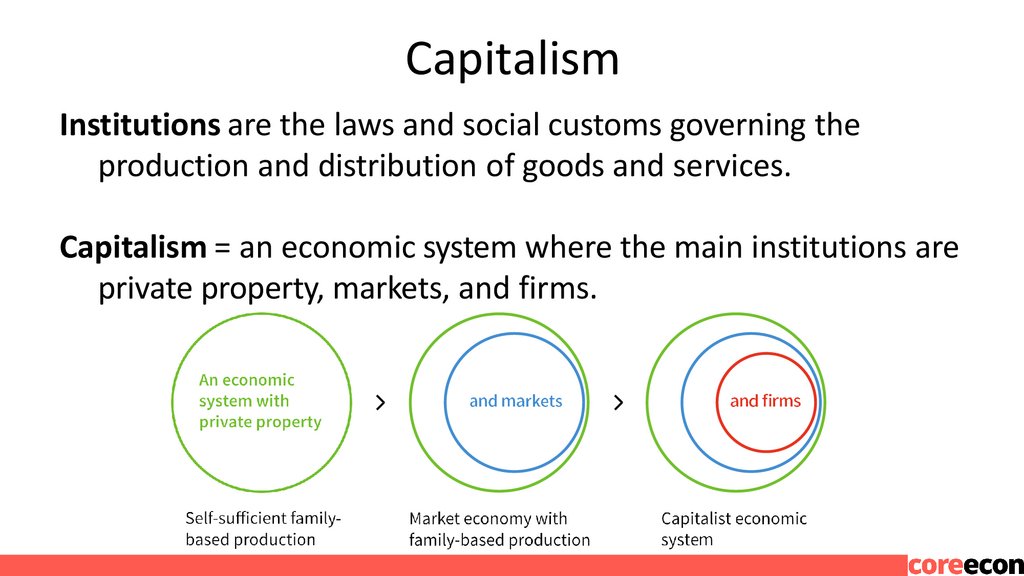
CapitalismInstitutions are the laws and social customs governing the
production and distribution of goods and services.
Capitalism = an economic system where the main institutions are
private property, markets, and firms.
23.
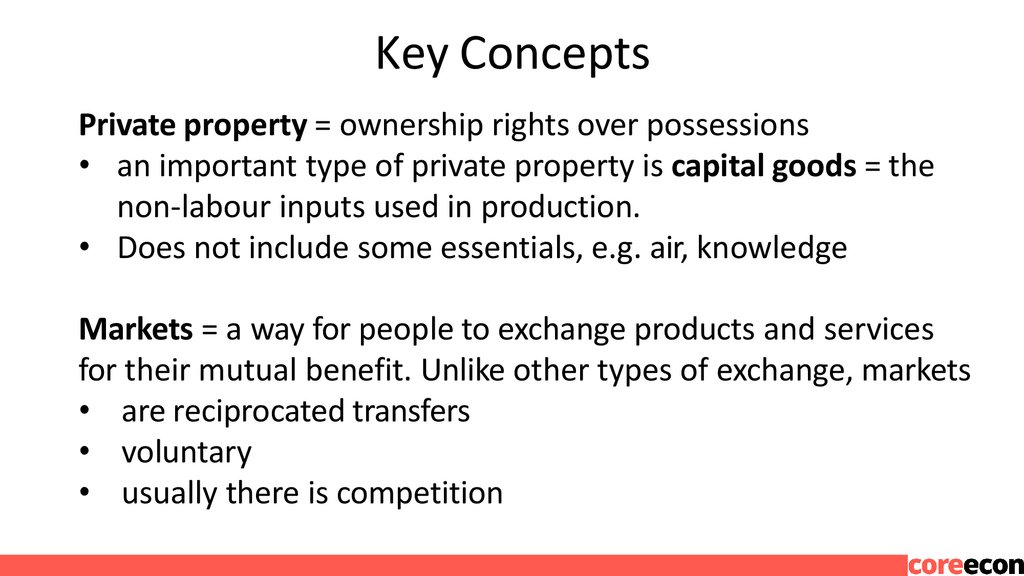
Key ConceptsPrivate property = ownership rights over possessions
• an important type of private property is capital goods = the
non-labour inputs used in production.
• Does not include some essentials, e.g. air, knowledge
Markets = a way for people to exchange products and services
for their mutual benefit. Unlike other types of exchange, markets
• are reciprocated transfers
• voluntary
• usually there is competition
24.
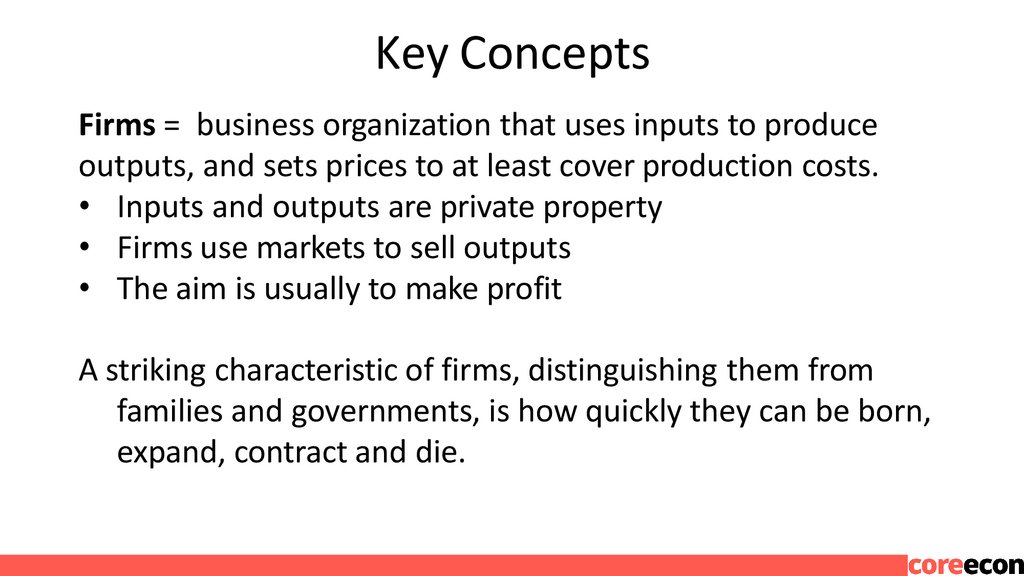
Key ConceptsFirms = business organization that uses inputs to produce
outputs, and sets prices to at least cover production costs.
• Inputs and outputs are private property
• Firms use markets to sell outputs
• The aim is usually to make profit
A striking characteristic of firms, distinguishing them from
families and governments, is how quickly they can be born,
expand, contract and die.
25.
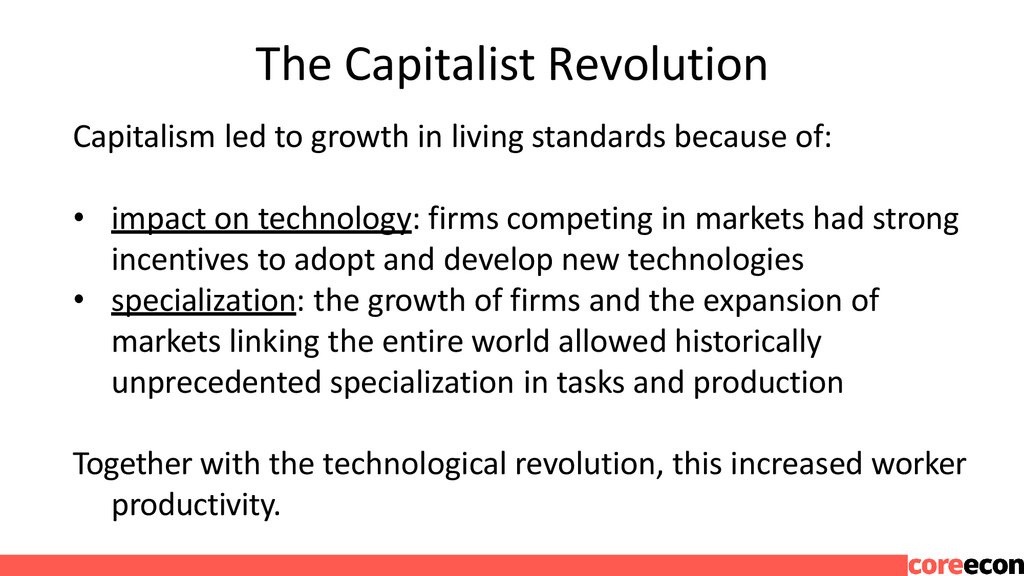
The Capitalist RevolutionCapitalism led to growth in living standards because of:
• impact on technology: firms competing in markets had strong
incentives to adopt and develop new technologies
• specialization: the growth of firms and the expansion of
markets linking the entire world allowed historically
unprecedented specialization in tasks and production
Together with the technological revolution, this increased worker
productivity.
26.
The gains from specializationSpecialization increases productivity of labour because we
become better at producing things when we each focus on a
limited range of activities
• learning by doing
• taking advantage of natural differences in skill and talent
• economies of scale
People can only specialize if they have a way to acquire the other
goods they need. In a capitalist society, this is done via markets.
27.
Did capitalism cause the hockey-stick growth?28.
Correlation vs. Causality: FreakonomicsMovie
29.
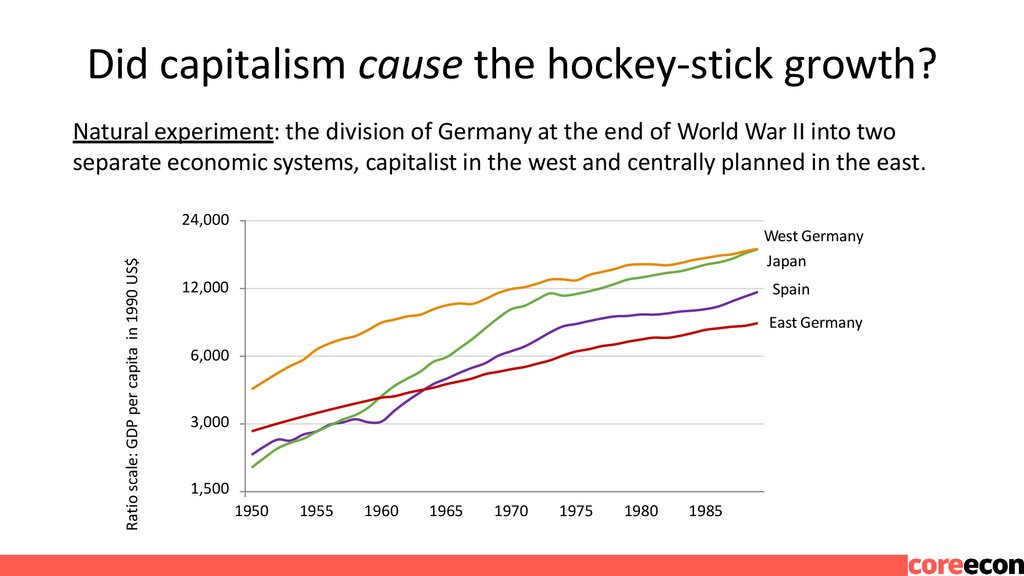
Did capitalism cause the hockey-stick growth?Natural experiment: the division of Germany at the end of World War II into two
separate economic systems, capitalist in the west and centrally planned in the east.
Ratio scale: GDP per capita in 1990 US$
24,000
West Germany
Japan
12,000
Spain
East Germany
6,000
3,000
1,500
1950
1955
1960
1965
1970
1975
1980
1985
30.
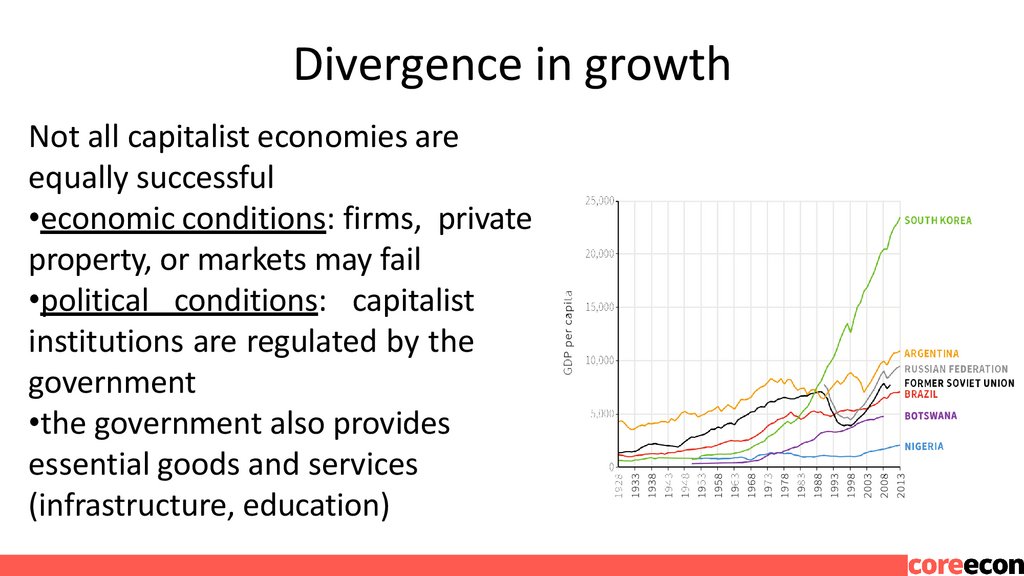
Divergence in growthNot all capitalist economies are
equally successful
•economic conditions: firms, private
property, or markets may fail
•political conditions: capitalist
institutions are regulated by the
government
•the government also provides
essential goods and services
(infrastructure, education)
31.
Political systemsCapitalism coexists with many political systems.
A political system determines how governments will be selected,
and how those governments will make and implement decisions.
In most countries today, capitalism coexists with democracy
• individual rights of citizens (e.g. freedom of speech)
• fair elections
But capitalism has coexisted with non-democratic systems, too.
32.
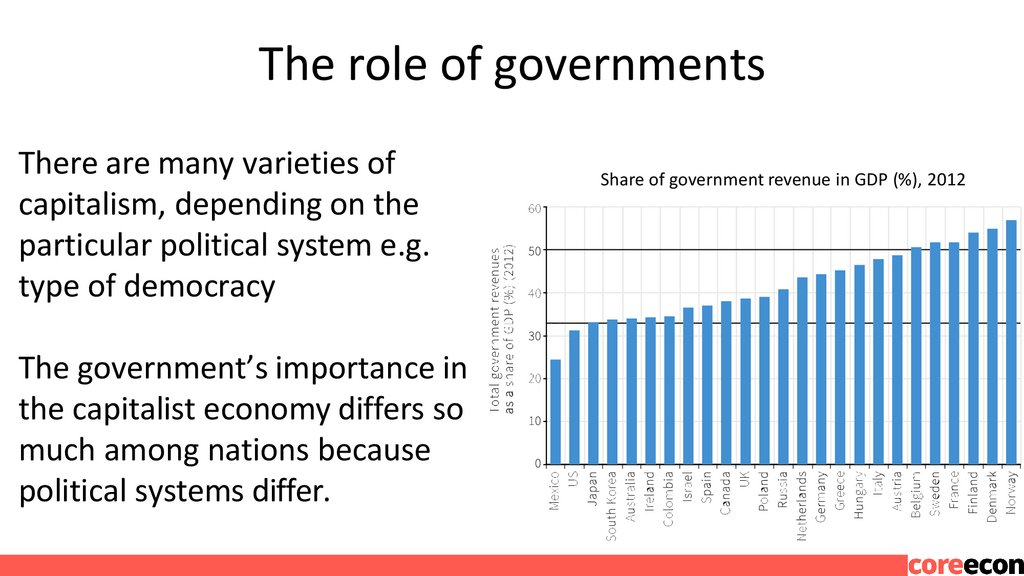
The role of governmentsThere are many varieties of
capitalism, depending on the
particular political system e.g.
type of democracy
The government’s importance in
the capitalist economy differs so
much among nations because
political systems differ.
Share of government revenue in GDP (%), 2012
33.
E. Inequality andenvironmental degradation
34.
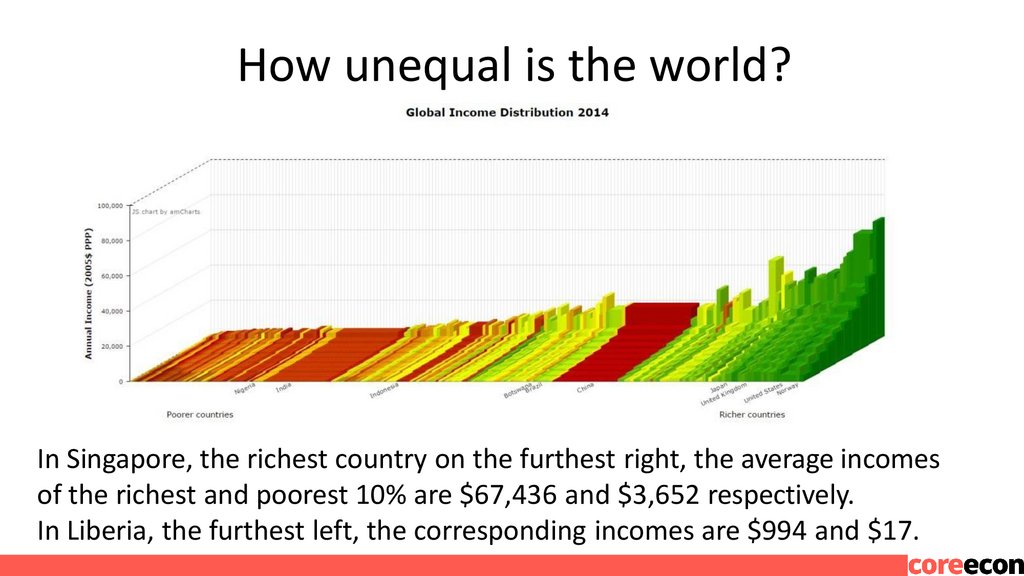
How unequal is the world?In Singapore, the richest country on the furthest right, the average incomes
of the richest and poorest 10% are $67,436 and $3,652 respectively.
In Liberia, the furthest left, the corresponding incomes are $994 and $17.
35.
Within and between country inequality1,000 years ago, the world was “flat”. Today, there are large
differences both within and across countries.
While both types of inequality seemed to have increased,
differences in average income between countries are much
larger today than they were in the past.
We can link growing between-country inequality to the hockeystick diagram.
36.
Inequality and growthFor a very long time, living standards did not grow in any
sustained way. When sustained growth occurred it began at
different times in different places.
•The countries that took off economically a century or more
ago—UK, Japan, Italy—are now rich.
•The countries that took off only recently, or not at all, are in
the flatlands.
37.
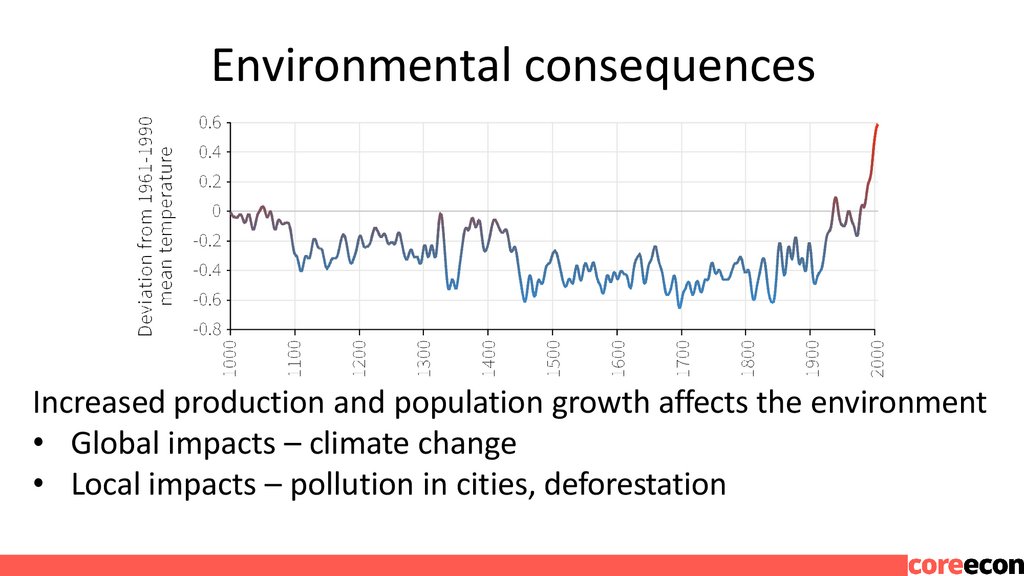
Environmental consequencesIncreased production and population growth affects the environment
• Global impacts – climate change
• Local impacts – pollution in cities, deforestation
38.
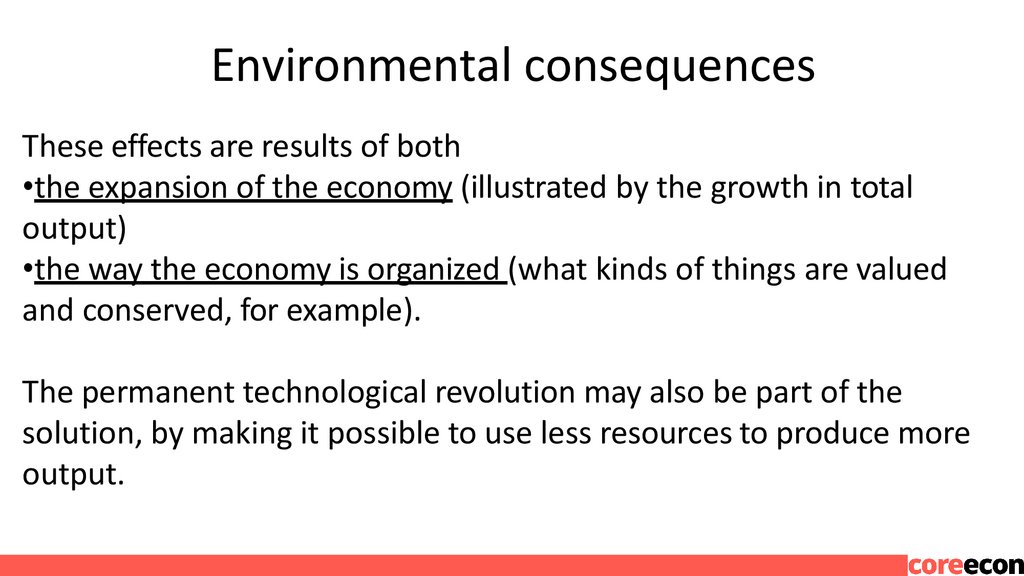
Environmental consequencesThese effects are results of both
•the expansion of the economy (illustrated by the growth in total
output)
•the way the economy is organized (what kinds of things are valued
and conserved, for example).
The permanent technological revolution may also be part of the
solution, by making it possible to use less resources to produce more
output.
39.
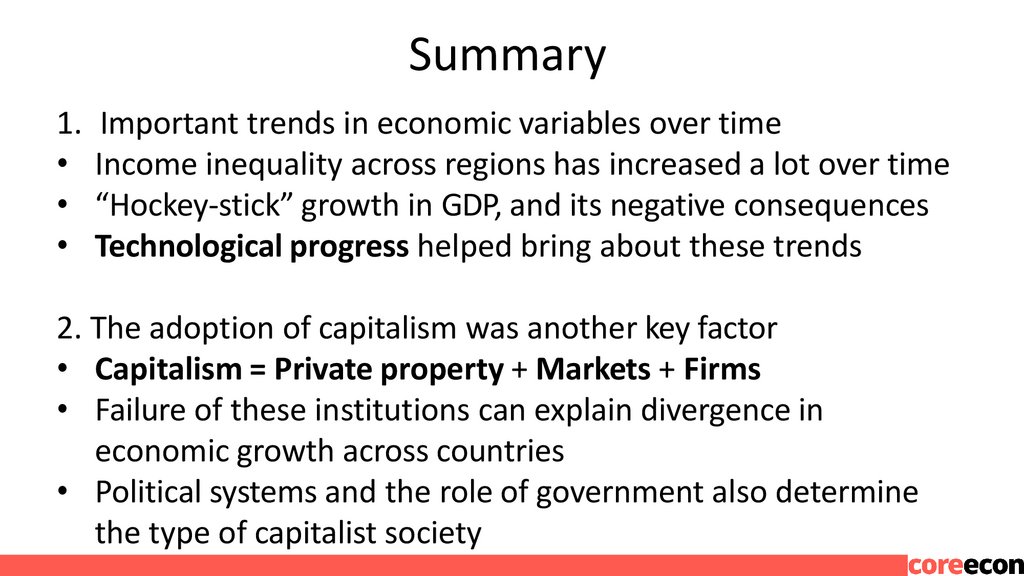
Summary1. Important trends in economic variables over time
• Income inequality across regions has increased a lot over time
• “Hockey-stick” growth in GDP, and its negative consequences
• Technological progress helped bring about these trends
2. The adoption of capitalism was another key factor
• Capitalism = Private property + Markets + Firms
• Failure of these institutions can explain divergence in
economic growth across countries
• Political systems and the role of government also determine
the type of capitalist society
40.
41.
In the next unit• Using economic models to explain the trends in
technological growth over time
• The role of firms in technological development
• Malthusian economics: studying the interaction
between population, technology, and economic growth