


 Экономика
Похожие презентации:


World economics intro
1.
WORLDECONOMICS
INTRO
Prof. Zharova Liubov
Zharova_l@ua.fm
2.
3.
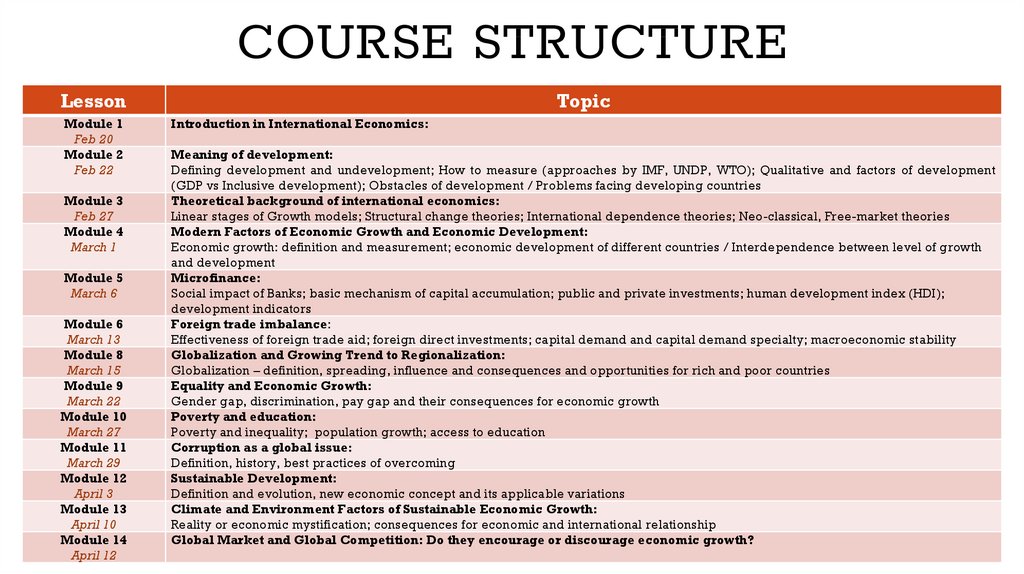
COURSE STRUCTURELesson
Module 1
Feb 20
Module 2
Feb 22
Module 3
Feb 27
Module 4
March 1
Module 5
March 6
Module 6
March 13
Module 8
March 15
Module 9
March 22
Module 10
March 27
Module 11
March 29
Module 12
April 3
Module 13
April 10
Module 14
April 12
Topic
Introduction in International Economics:
Meaning of development:
Defining development and undevelopment; How to measure (approaches by IMF, UNDP, WTO); Qualitative and factors of development
(GDP vs Inclusive development); Obstacles of development / Problems facing developing countries
Theoretical background of international economics:
Linear stages of Growth models; Structural change theories; International dependence theories; Neo-classical, Free-market theories
Modern Factors of Economic Growth and Economic Development:
Economic growth: definition and measurement; economic development of different countries / Interdependence between level of growth
and development
Microfinance:
Social impact of Banks; basic mechanism of capital accumulation; public and private investments; human development index (HDI);
development indicators
Foreign trade imbalance:
Effectiveness of foreign trade aid; foreign direct investments; capital demand and capital demand specialty; macroeconomic stability
Globalization and Growing Trend to Regionalization:
Globalization – definition, spreading, influence and consequences and opportunities for rich and poor countries
Equality and Economic Growth:
Gender gap, discrimination, pay gap and their consequences for economic growth
Poverty and education:
Poverty and inequality; population growth; access to education
Corruption as a global issue:
Definition, history, best practices of overcoming
Sustainable Development:
Definition and evolution, new economic concept and its applicable variations
Climate and Environment Factors of Sustainable Economic Growth:
Reality or economic mystification; consequences for economic and international relationship
Global Market and Global Competition: Do they encourage or discourage economic growth?
4.
PROGNOSIS OF COUNTRIESDEVELOPMENT IN 1990S AND
REALITY
5.
NEW▪ The Gross Domestic Product (GDP) of an economy is a measure of total production.
More precisely, it is the monetary value of all goods and services produced within
a country or region in a specific time period. While the definition of GDP is
straightforward, accurately measuring it is a surprisingly difficult undertaking.
Moreover, any attempts to make comparisons over time and across borders are
complicated by price, quality and currency differences. This article covers the
basics of GDP data and highlights many of the pitfalls associated with
intertemporal and spatial comparisons.
6.
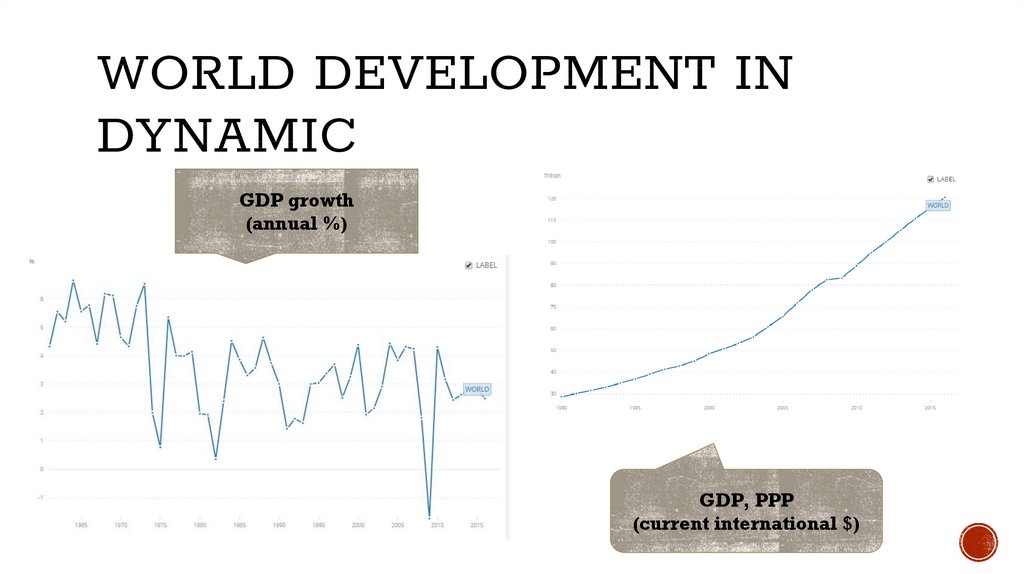
WORLD DEVELOPMENT INDYNAMIC
GDP growth
(annual %)
GDP, PPP
(current international $)
7.
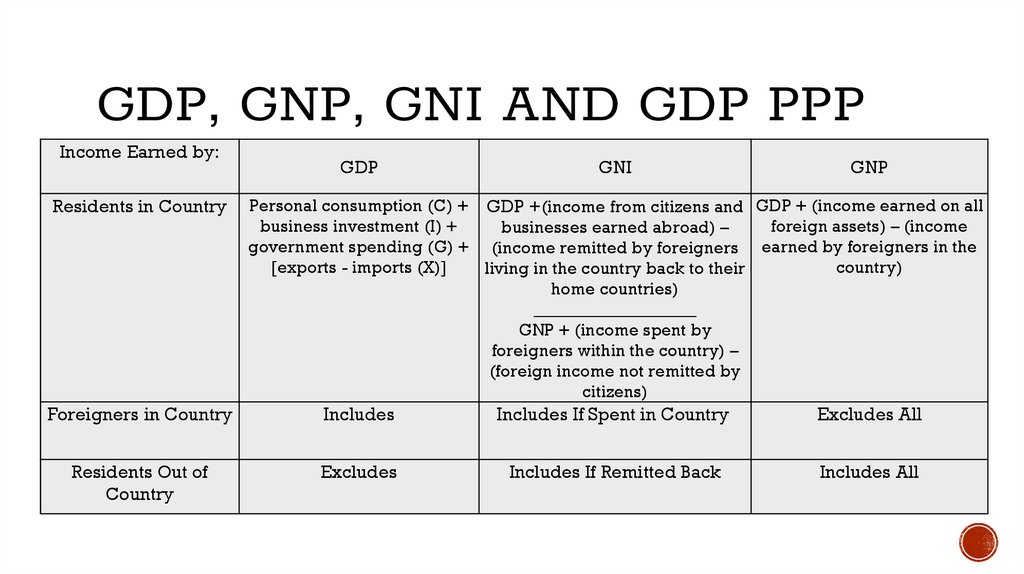
GDP, GNP, GNI AND GDP PPPIncome Earned by:
Residents in Country
GDP
GNI
GNP
Personal consumption (C) + GDP +(income from citizens and GDP + (income earned on all
business investment (I) +
foreign assets) – (income
businesses earned abroad) –
government spending (G) + (income remitted by foreigners earned by foreigners in the
[exports - imports (X)]
country)
living in the country back to their
home countries)
___________________
GNP + (income spent by
foreigners within the country) –
(foreign income not remitted by
citizens)
Foreigners in Country
Includes
Includes If Spent in Country
Excludes All
Residents Out of
Country
Excludes
Includes If Remitted Back
Includes All
8.
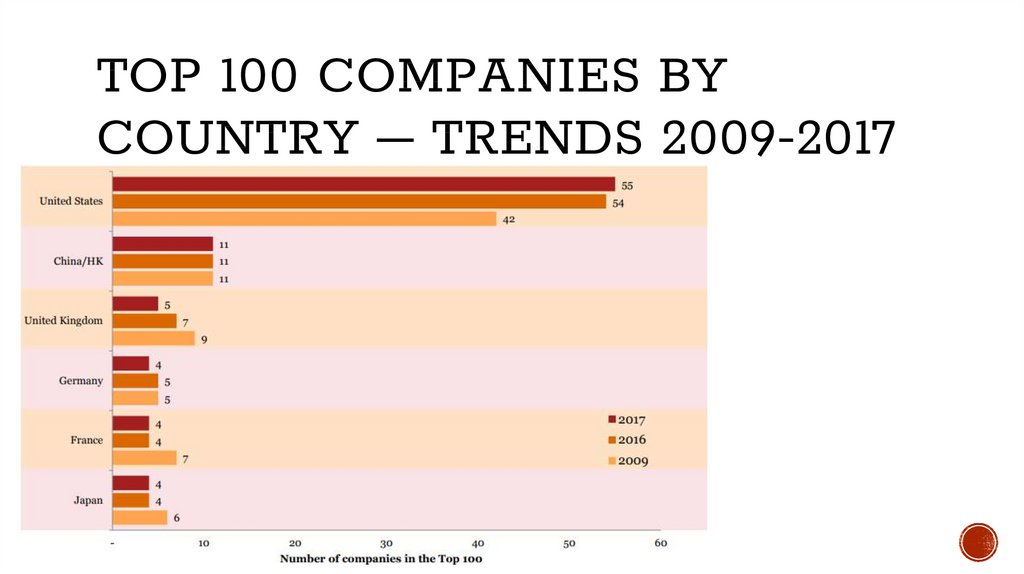
TOP 100 COMPANIES BYCOUNTRY – TRENDS 2009-2017
9.
10.
11.
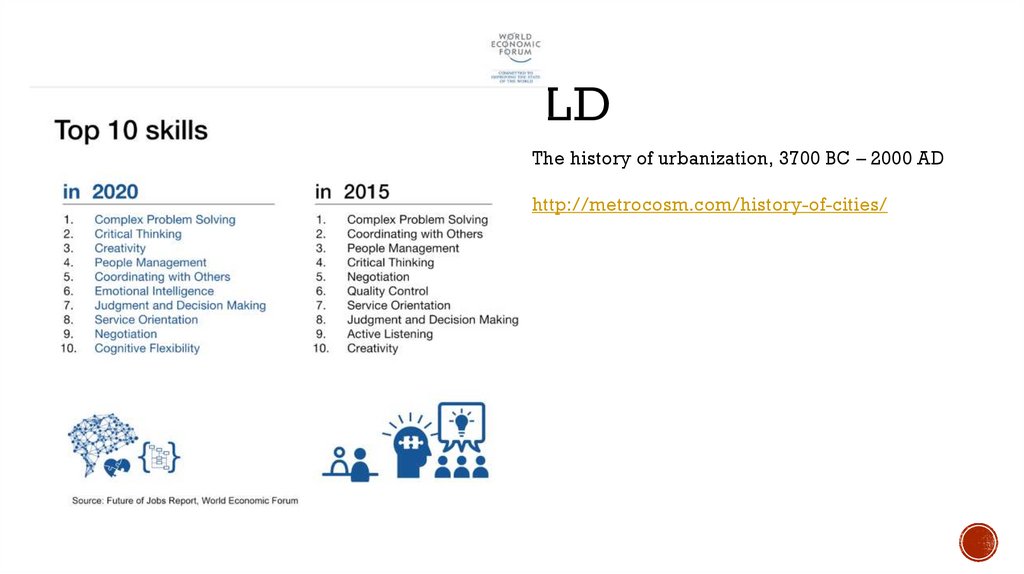
CHANGING WORLDThe history of urbanization, 3700 BC – 2000 AD
http://metrocosm.com/history-of-cities/
12.
The economy of theUnited States is the
largest in the
world. At $18
trillion, it
represents a
quarter share of the
global economy
(24.3%), according
to the latest World
Bank figures.
13.
FASTEST-GROWING ECONOMY▪ The US may not dominate for much longer, however.
▪ Although China trails the US by $7 trillion, it’s catching up. China’s economy grew by
▪
▪
▪
▪
▪
6.7% in 2016, compared with America’s 1.6%, according to the IMF.
China has also overtaken India as the fastest-growing large economy. The IMF’s World
Economic Outlook estimated China’s economy grew at 6.7% in 2016, compared with
India’s 6.6%.
Brazil’s economy has contracted in the last year by 3.5%, the only one in the top 10 to do
so.
The Asian bloc clearly has a larger share than anywhere else, representing just over a
third (33.84%) of global GDP. That’s compared to North America, which represents just
over a quarter, at 27.95%.
Europe comes third with just over one-fifth of global GDP (21.37%).
Together, these three blocs generate more than four-fifths (83.16%) of the world’s total
output.
14.
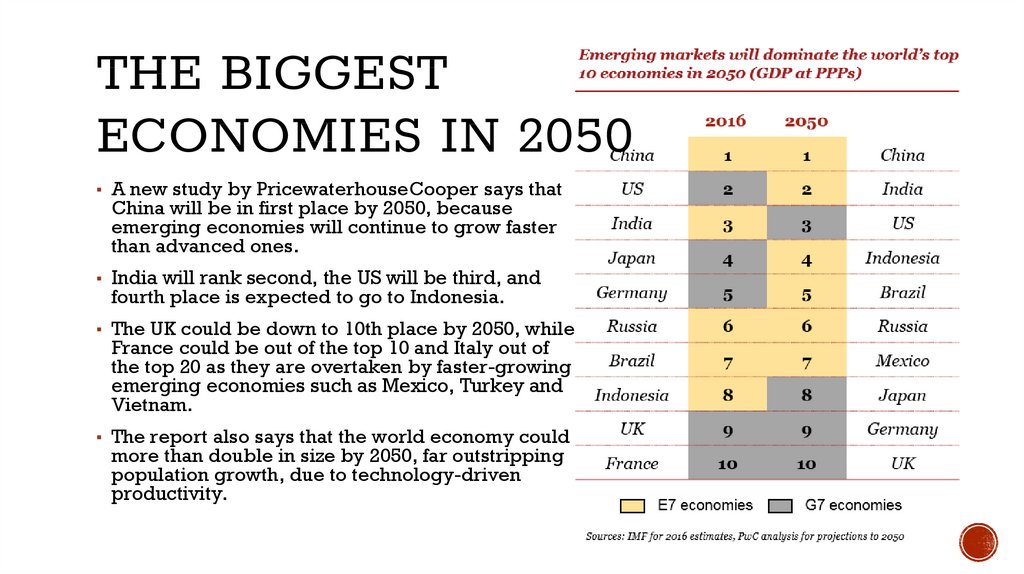
THE BIGGESTECONOMIES IN 2050
▪ A new study by PricewaterhouseCooper says that
China will be in first place by 2050, because
emerging economies will continue to grow faster
than advanced ones.
▪ India will rank second, the US will be third, and
fourth place is expected to go to Indonesia.
▪ The UK could be down to 10th place by 2050, while
France could be out of the top 10 and Italy out of
the top 20 as they are overtaken by faster-growing
emerging economies such as Mexico, Turkey and
Vietnam.
▪ The report also says that the world economy could
more than double in size by 2050, far outstripping
population growth, due to technology-driven
productivity.
15.
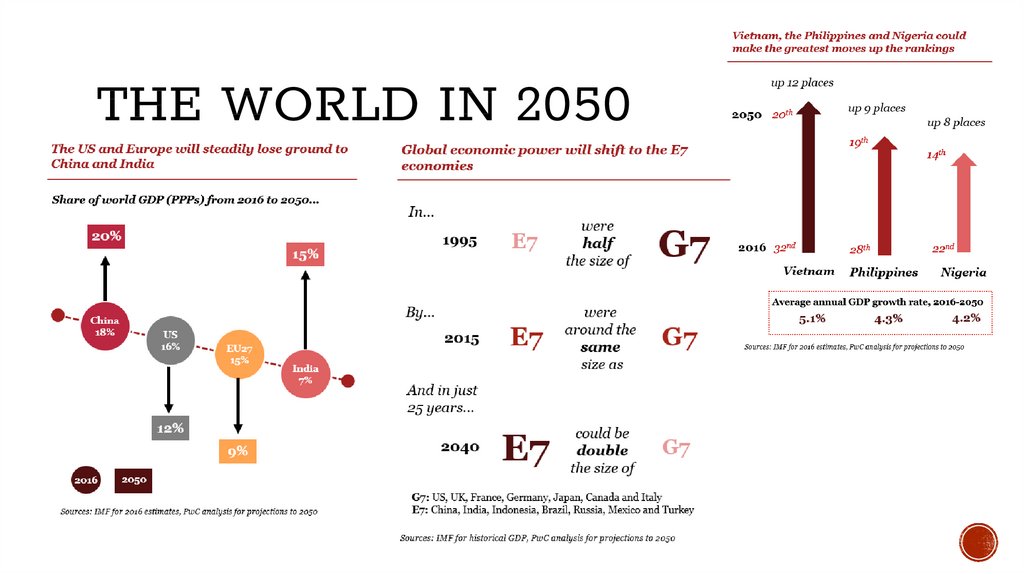
THE WORLD IN 205016.
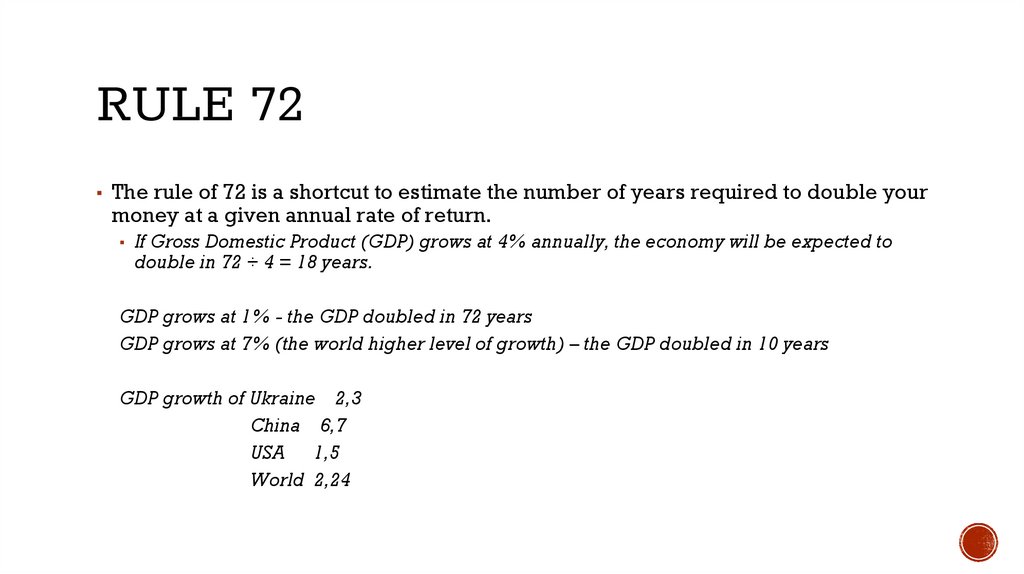
RULE 72▪ The rule of 72 is a shortcut to estimate the number of years required to double your
money at a given annual rate of return.
▪
If Gross Domestic Product (GDP) grows at 4% annually, the economy will be expected to
double in 72 ÷ 4 = 18 years.
GDP grows at 1% - the GDP doubled in 72 years
GDP grows at 7% (the world higher level of growth) – the GDP doubled in 10 years
GDP growth of Ukraine 2,3
China 6,7
USA 1,5
World 2,24
17.
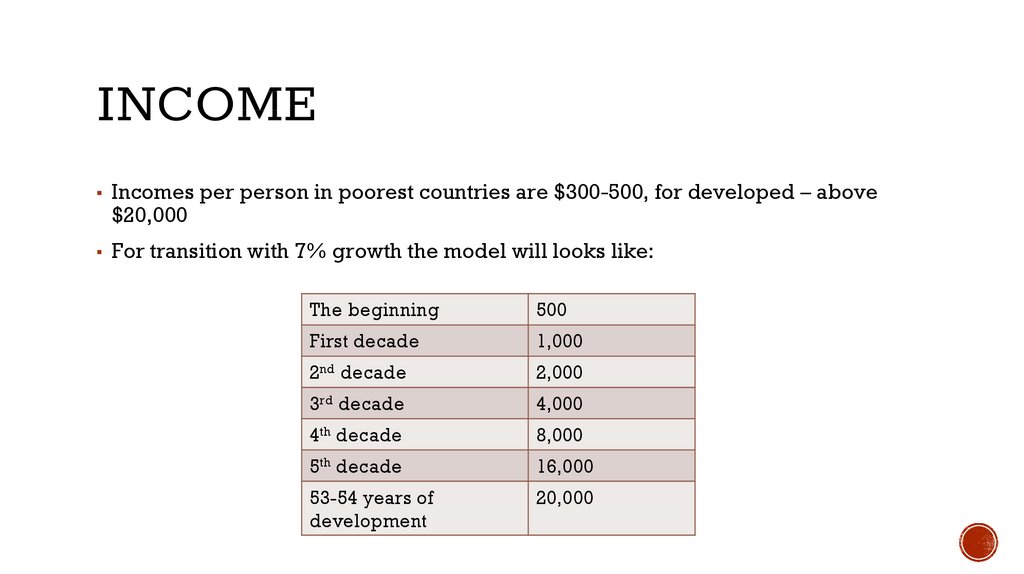
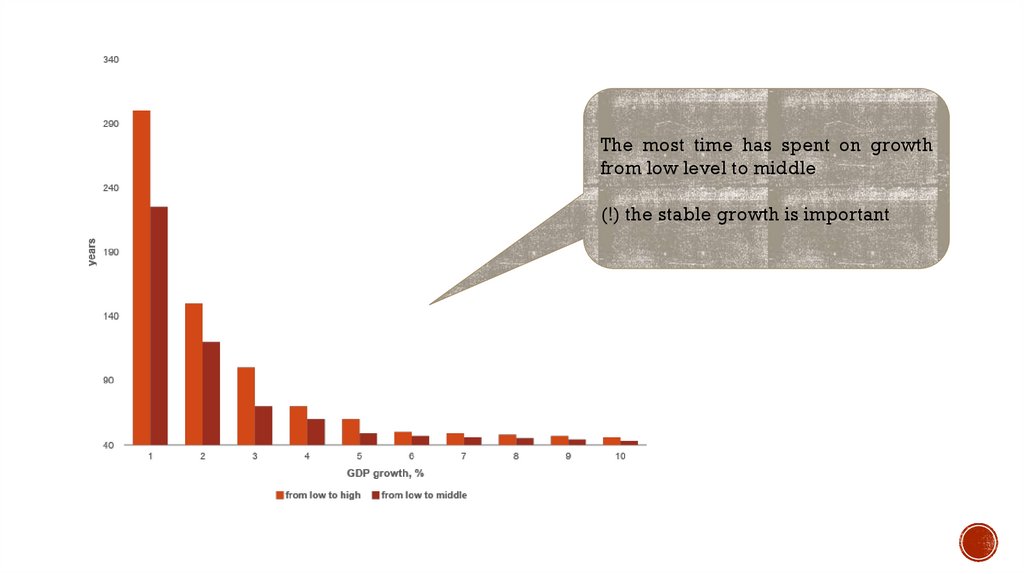
INCOME▪ Incomes per person in poorest countries are $300-500, for developed – above
$20,000
▪ For transition with 7% growth the model will looks like:
The beginning
500
First decade
1,000
2nd decade
2,000
3rd decade
4,000
4th decade
8,000
5th decade
16,000
53-54 years of
development
20,000
18.
The most time has spent on growthfrom low level to middle
(!) the stable growth is important
19.
20.
MEGATRENDS: 5 GLOBALSHIFTS CHANGING THE WAY
WE LIVE AND DO BUSINESS
▪ Rapid urbanization
▪ Climate change & resource scarcity
▪ Shift in global economic power
▪ Demographic and social change
▪ Technological breakthroughs
21.
WORLDECONOMICS:
MEANING OF
DEVELOPMENT
Prof. Zharova Liubov
Zharova_l@ua.fm
22.
DEVELOPMENT▪ What is the difference between growth and development?
▪ Economic growth means an increase in real national income / national output.
▪ Economic development means an improvement in the quality of life and living
standards, e.g. measures of literacy, life-expectancy and health care.
▪ Ceteris paribus, we would expect economic growth to enable more economic
development. Higher real GDP enables more to be spent on health care and
education.
▪ However, the link is not guaranteed. The proceeds of economic growth could be
wasted or retained by a small wealthy elite.
23.
DEVELOPED AND DEVELOPINGCOUNTRIES
▪ The primary factor used to distinguish developed countries from developing
countries is gross domestic product (GDP) per capita, a figure calculated by
dividing a country's GDP by its population.
▪ One unofficial threshold for a country with a developed economy is a GDP per
capita of $12,000. Some economists prefer to see a per capita GDP of at least
$25,000 to be comfortable declaring a country as developed, however. Many
highly developed countries, including the United States, have high per capita
GDPs of $40,000 or above.
24.
DIFFERENCES BETWEENDEVELOPED AND DEVELOPING
COUNTRIES
Exceeding even the $12,000 GDP does not automatically qualify a country as being
developed. Developed countries share several other characteristics:
▪ They are highly industrialized.
▪ Their birth and death rates are stable. They do not have excessively high birth rates
because, thanks to quality medical care and high living standards, infant mortality rates are
low. Families do not feel the need to have high numbers of children with the expectation
that some will not survive. No developed country has an infant mortality rate higher than 10
per 1,000 live births. In terms of life expectancy, all developed countries boast numbers
greater than 70 years; many average 80.
▪ They have more women working, particularly in high-ranking executive positions.
These career-oriented women frequently choose to have smaller families or eschew having
children altogether.
▪ They use a disproportionate amount of the world's resources, such as oil. In developed
countries, more people drive cars, fly on airplanes, and power their homes with electricity
and gas. Inhabitants of developing countries often do not have access to technologies that
require the use of these resources.
▪ They have higher levels of debt. Nations with developing economies cannot obtain the kind
of seemingly bottomless financing that more developed nations can.
25.
HOW TO MEASUREDEVELOPMENT
Institutions measure a country's level of development in many different ways. For instance, the
United Nations has few conventions for distinguishing between "developed" and "developing"
countries, while the World Bank makes specific distinctions using gross national income (GNI)
per capita, although other analytical tools may be used in the process.
▪ The International Monetary Fund's (IMF) definition is often considered to be the most
comprehensive measure since it takes into account per capita income, export
diversification, and the degree of integration into the global financial system. In 2011, the
organization published a research report on the topic of classification
titled "Classification of Countries Based on Their Level of Development" that outlines its
methodologies for classifying a country's level of development.
▪ The World Bank has a much more concrete methodology as it considers countries with
per capita income of less than US$12,275 as "developing" countries. But the organization
also divides these developing countries into numerous income classes, ranging from lowincome to upper-middle-income countries, meaning there are other gray areas for
international investors to consider.
▪ There are no WTO definitions of “developed” and “developing” countries. Members
announce for themselves whether they are “developed” or “developing” countries.
26.
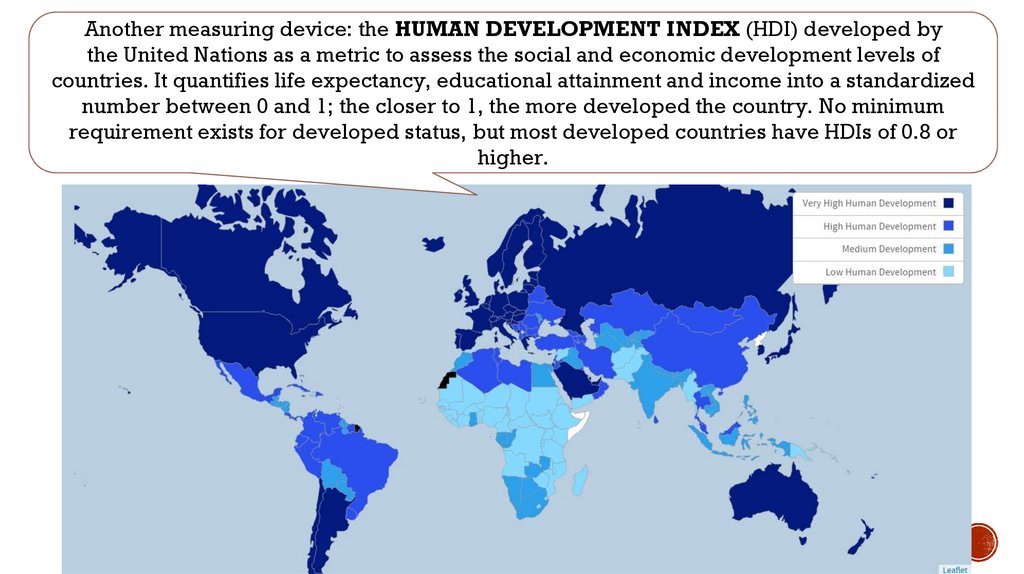
Another measuring device: the HUMAN DEVELOPMENT INDEX (HDI) developed bythe United Nations as a metric to assess the social and economic development levels of
countries. It quantifies life expectancy, educational attainment and income into a standardized
number between 0 and 1; the closer to 1, the more developed the country. No minimum
requirement exists for developed status, but most developed countries have HDIs of 0.8 or
higher.
27.
TYPICALLY RECOGNIZEDDEVELOPING COUNTRIES
▪ Different organizations use different measures to determine how companies are
classified, but a few common denominators appear in the mix. For instance, the socalled BRICS are generally considered developing countries and comprise Brazil,
Russia, India, China, and South Africa, but examples of common developing
countries go far beyond these popular emerging markets.
▪ Some other countries that appear on include the following:
o
o
o
o
o
Argentina.
Chile.
Malaysia.
Mexico.
Pakistan.
28.
WHO NEEDS CLASSIFICATIONSOF COUNTRIES TO DEVELOP
AND DEVELOPING
International investors often classify countries around the world based on their level
of economic development. These classifications are based on a number of economic
and social criteria, ranging from per capita income to life expectancy to literacy
rates.
These classifications are
▪ Developed countries,
▪ Developing countries,
▪ Less developed countries and
▪ Emerging markets
29.
WHAT ARE FRONTIER &EMERGING MARKETS?
Frontier and emerging markets
▪ spanning from Africa to Latin America and beyond
▪ represent some of the fastest growing economies in the world.
▪ Emerging markets is a term that was coined in the 1980s to represent countries
transitioning from developing to developed status. While the term is commonly
used among investors, there is no universally accepted definition of emerging
markets.
▪ When emerging market economies began to mature, the term frontier markets
was coined to represent investable countries with lower market capitalizations and
liquidity. These countries are widely considered to be the up-and-coming
emerging markets, but are a bit more hazardous to investors in terms of political
risk, market maturity, and transparency.
30.
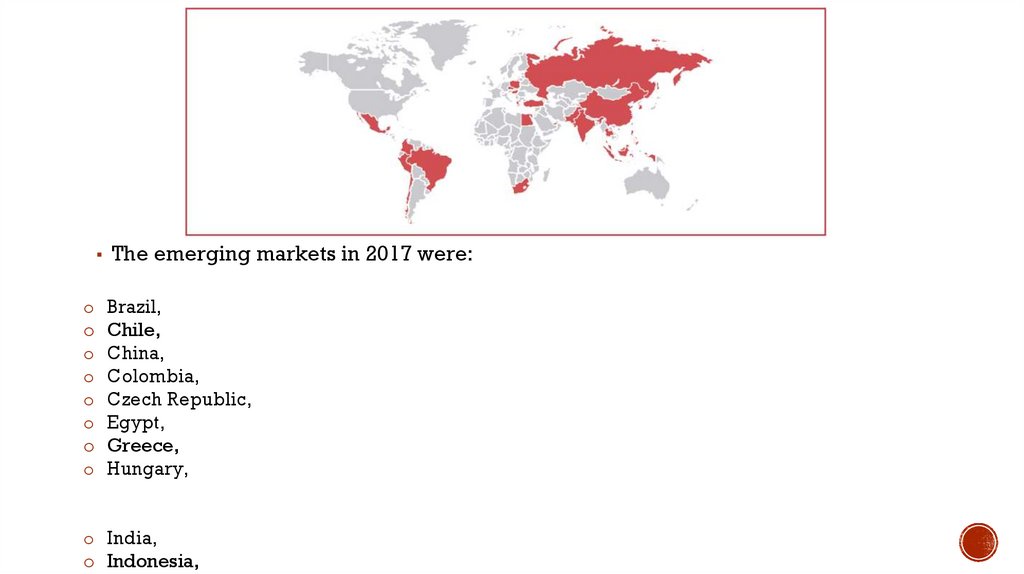
▪ The emerging markets in 2017 were:o
o
o
o
o
o
o
o
Brazil,
Chile,
China,
Colombia,
Czech Republic,
Egypt,
Greece,
Hungary,
o India,
o Indonesia,
31.
FRONTIER MARKETS▪ Frontier and emerging markets offer investors higher potential returns, but they
also involve greater risk than developed countries like the United States. This
attributes make them ideal for investors with a medium to long-term time horizon.
▪ There is no single definition of a frontier market or emerging market, but instead,
there are several different indices. Many of these indices have ETFs that offer
investors a quick way to diversify in these high growth markets.
▪ Investors looking for either more specific exposure or broader exposure have
several alternatives to all-world funds.
32.
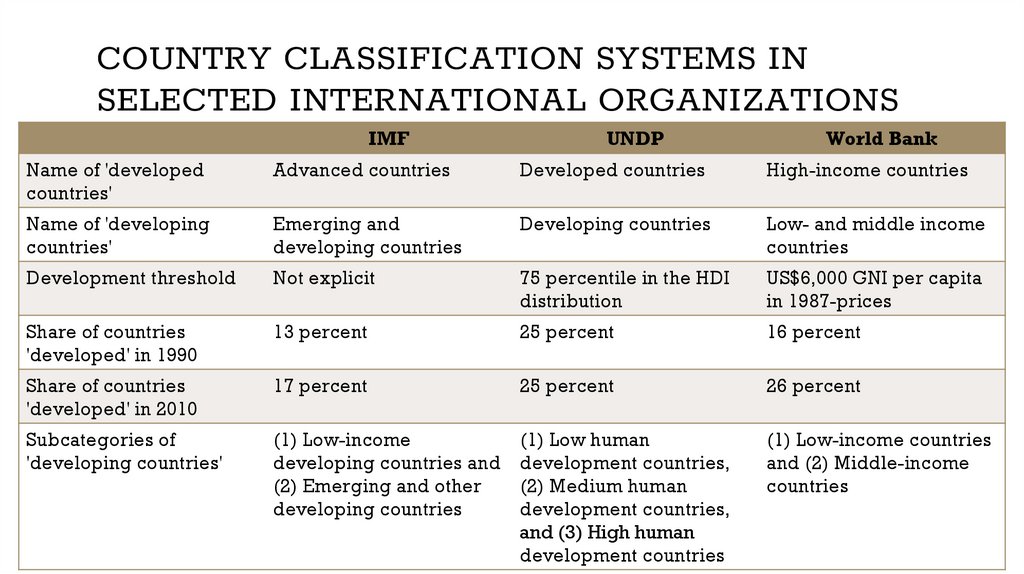
COUNTRY CLASSIFICATION SYSTEMS INSELECTED INTERNATIONAL ORGANIZATIONS
IMF
UNDP
World Bank
Name of 'developed
countries'
Advanced countries
Developed countries
High-income countries
Name of 'developing
countries'
Emerging and
developing countries
Developing countries
Low- and middle income
countries
Development threshold
Not explicit
75 percentile in the HDI
distribution
US$6,000 GNI per capita
in 1987-prices
Share of countries
'developed' in 1990
13 percent
25 percent
16 percent
Share of countries
'developed' in 2010
17 percent
25 percent
26 percent
Subcategories of
'developing countries'
(1) Low-income
developing countries and
(2) Emerging and other
developing countries
(1) Low human
development countries,
(2) Medium human
development countries,
and (3) High human
development countries
(1) Low-income countries
and (2) Middle-income
countries
33.
34.
35.
36.
37.
TRENDS OF MODERNECONOMICS
Arcelor Mittal (Krivirizhstal)
The most expensive Ukrainian
privatization - $ 5 billions
Company founded by Jan Koum
(borne in Kyiv)
At the time of privatization – 52,000
workers
Sold for $19 billions
At the time f sale – 57 workers
38.
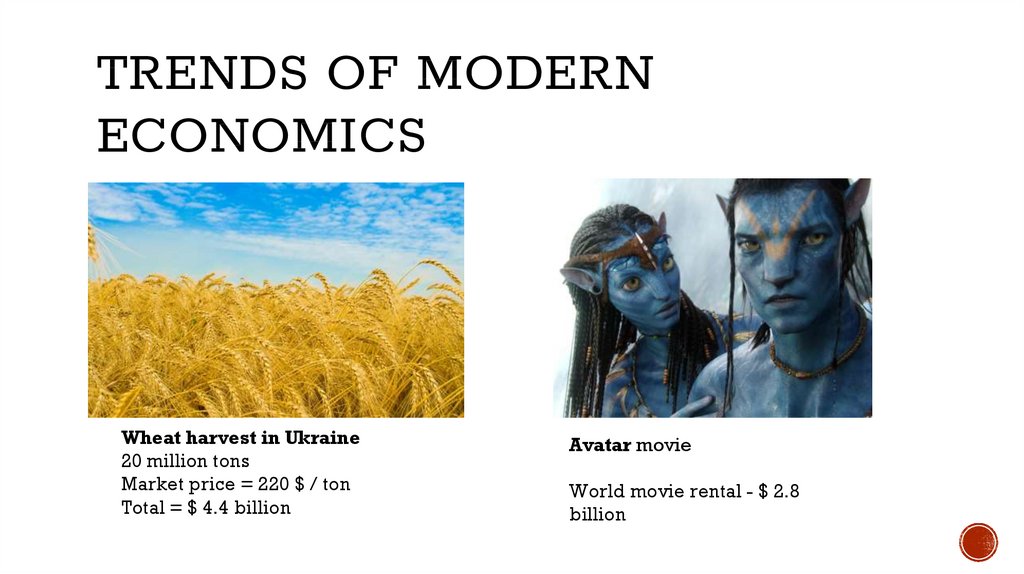
TRENDS OF MODERNECONOMICS
Wheat harvest in Ukraine
20 million tons
Market price = 220 $ / ton
Total = $ 4.4 billion
Avatar movie
World movie rental - $ 2.8
billion
39.
WORLDECONOMICS:
THEORETICAL
BACKGROUND OF
INTERNATIONAL
ECONOMICS
Prof. Zharova Liubov
Zharova_l@ua.fm
40.
LINEAR-STAGES-OF-GROWTHMODELS
▪ Development theory is a conglomeration of theories about how desirable change
in society is best achieved.
▪ The Linear Stages of Growth model is an economic model which is heavily inspired
by the Marshall Plan of the US which was used to rehabilitate Europe’s economy
after the Post-World War II Crisis.
▪ The linear stages of growth models are the oldest and most traditional of all
development plans. It was an attempt by economists to come up with a suitable
concept as to how underdeveloped countries of Asia, Africa and Latin America can
transform their agrarian economy into an industrialized one.
▪ The most popular of the linear stage models are Rostow’s Stages of Growth Model
and the Harrod-Domar Growth Model.
41.
ROSTOW - FIVE STAGES OFECONOMIC GROWTH MODEL
1.
Traditional society. This is an agricultural economy of mainly subsistence farming, little of which is traded.
The size of the capital stock is limited and of low quality resulting in very low labour productivity and little
surplus output left to sell in domestic and overseas markets
2.
Pre-conditions for take-off. Agriculture becomes more mechanised and more output is traded. Savings and
investment grow although they are still a small percentage of national income (GDP). Some external funding is
required - for example in the form of overseas aid or perhaps remittance incomes from migrant workers living
overseas
3.
Take-off. Manufacturing industry assumes greater importance, although the number of industries remains
small. Political and social institutions start to develop - external finance may still be required. Savings and
investment grow, perhaps to 15% of GDP. Agriculture assumes lesser importance in relative terms although the
majority of people may remain employed in the farming sector. There is often a dual economy apparent with
rising productivity and wealth in manufacturing and other industries contrasted with stubbornly low
productivity and real incomes in rural agriculture.
4.
Drive to maturity. Industry becomes more diverse. Growth should spread to different parts of the country as
the state of technology improves - the economy moves from being dependent on factor inputs for growth
towards making better use of innovation to bring about increases in real per capita incomes
5.
Age of mass consumption. Output levels grow, enabling increased consumer expenditure. There is a shift
towards tertiary sector activity and the growth is sustained by the expansion of a middle class of consumers.
42.
HARROD-DOMAR MODEL▪ This model was developed independently by Roy F. Harrod in 1939 and Evsey Domar
in 1946.
▪ Model is an early post-Keynesian model of economic growth. It is used in development
economics to explain an economy's growth rate in terms of the level of saving and
productivity of capital.
▪ The Harrod-Domar Model is based on a linear function and can also be referred to as
the AK model where A is a constant and K is capital stock. This model shows how
sufficient investment through savings can accelerate growth. Investments generate
income and supplements productivity of the economy by increasing the capital stock.
▪ The Harrod-Domar model is based on the following assumptions:
✓ Laissez-faire; where
there is no government intervention
✓ A closed economy; no participation in foreign trade
✓ Capital goods do not depreciate as they possess a boundless timeline
✓ Constant marginal propensity to save
✓ Interest rate remains unchanged, etc.
43.
HARROD-DOMAR MODELThe Harrod-Domar model makes use of a Capital-output Ratio (COR). If the COR is
low a country can produce more with little capital but if it is high, more capital is
required for production and value of output is less. This can be denoted in a simple
formula of K/Y=COR; where K is the Capital stock and Y is Output because there is a
direct proportional relationship between both variables.
Rate of growth of GDP = Savings Ratio / Capital Output Ratio
Numerical examples:
▪ If the savings rate is 10% and the capital output ratio is 2, then a country would
grow at 5% per year.
▪ If the savings rate is 20% and the capital output ratio is 1.5, then a country would
grow at 13.3% per year.
▪ If the savings rate is 8% and the capital output ratio is 4, then the country would
grow at 2% per year.
44.
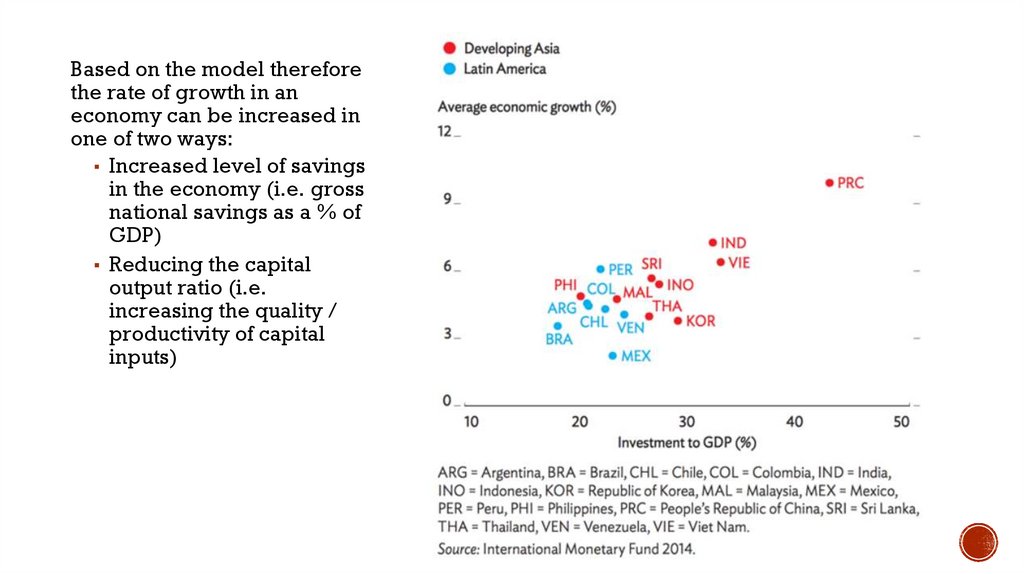
Based on the model thereforethe rate of growth in an
economy can be increased in
one of two ways:
▪ Increased level of savings
in the economy (i.e. gross
national savings as a % of
GDP)
▪ Reducing the capital
output ratio (i.e.
increasing the quality /
productivity of capital
inputs)
45.
SOME OF THE KEY LIMITATIONS /PROBLEMS OF THE HARROD-DOMAR
GROWTH MODEL
▪ Increasing the savings ratio in lower-income countries is not easy. Many developing countries have
low marginal propensities to save. Extra income gained is often spent on increased consumption
rather than saved. Many countries suffer from a persistent domestic savings gap.
▪ Many developing countries lack a sound financial system. Increased saving by households does not
necessarily mean there will be greater funds available for firms to borrow to invest.
▪ Efficiency gains that reduce the capital/output ratio are difficult to achieve in developing countries
due to weaknesses in human capital, causing capital to be used inefficiently
▪ Research and development (R&D) needed to improve the capital/output ratio is often under-funded
- this is a cause of market failure
▪ Borrowing from overseas to fill the savings gap causes external debt repayment problems later.
▪ The accumulation of capital will increase if the economy starts growing dynamically – a rise in
capital spending is not necessarily a pre-condition for economic growth and development – as a
country gets richer, incomes rise, so too does saving, and the higher income fuels rising demand
which itself prompts a rise in capital investment spending.
46.
LEWIS 2-SECTORS MODEL▪ Arthur Lewis put forward a development model of a DUALISTIC economy,
consisting of rural agricultural and urban manufacturing sectors
▪ Initially, the majority of labour is employed upon the land, which is a fixed
resource. Labour is a variable resource and, as more labour is put to work on the
land, diminishing marginal returns eventually set in: there may be insufficient
tasks for the marginal worker to undertake, resulting in reduced marginal product
(output produced by an additional worker) and underemployment.
▪ Urban workers, engaged in manufacturing, tend to produce a higher value of
output than their agricultural counterparts. The resultant higher urban wages
(Lewis stated that a 30% premium was required) might therefore tempt surplus
agricultural workers to migrate to cities and engage in manufacturing activity.
High urban profits would encourage firms to expand and hence result in further
rural-urban migration.
47.
THE LEWIS MODEL IS A MODEL OFSTRUCTURAL CHANGE SINCE IT
OUTLINES THE DEVELOPMENT FROM A
TRADITIONAL ECONOMY TO AN
China provides a good example: official Chinese statistics place the number of internal
INDUSTRIALIZED
ONE
migrants over the past 20 years at over
10% of the 1.3bn population. 45% were aged 16▪
25 and two-thirds were male. Urban incomes are around 3.5 times those of rural workers.
▪ A Marxist criticism states that profits will be retained by the capitalist entrepreneur, at
the expense of workers. In addition, urban expansion might be driven by increases in
capital rather than labour.
▪ Evidence suggests that surplus labour is as likely in the urban sector as in the agricultural
sector. Migrating workers may possess insufficient information about job vacancies, pay
and working conditions. This results in high unemployment levels in towns and cities.
▪ Towns and cities may also be fixed in size and unable to accommodate large numbers of
immigrants. This gives rise to slums and shanty towns, which are often illegal, built on
flood planes or areas vulnerable to landslides and without sanitation or clean water. Cape
Town provides a good example. Globally 1bn people live in slums.
48.
PATTERNS OF DEMANDTHEORY
▪ Chenery’s model defines economic development as a set of interrelated changes in the
structure of an underdeveloped economy that are required for its transformation from
an agricultural economy into an industrial economy for continued growth in addition to
accumulation of capital both human and physical.
▪ Chenery’s model requires an altering of the existing structures within an
underdeveloped economy to pave way for the penetration of new industries and
modern structures to attain the status of an industrial nation. It is quite similar to Lewis’
model but in its opinion investment and savings although necessary are not enough to
drive the degree of growth that is required. Chenery’s model adopts four main
strategies to achieve economic growth:
➢Transformation of
production from agricultural to industrial production
➢Changing composition of the consumer demand from emphasis on food commodities and
other consumables to desire for multiple manufactured goods and services
➢International trade; creating a market for its exports
➢Using resources as well as changes in socio-economic factors as the distribution of the
country’s population.
49.
LIMITATIONS▪ One of the criticisms against the Chenery’s structural change model is that it
shortchanges critical valuables judgement.
▪ Again, in his analysis of Chenery’s theory, Krueger identified areas of market
failure emanating from exploitation of static comparative advantage inferior for
less developed countries to a more protective or interventionist approach which
merely focuses on producing dynamic comparative advantages. This observation
bears some relevance to the protection mechanism established under the
‘Common Exchange Tariff (CET)’ mechanism for ECOWAS member countries.
Here, there is clause in the CET that allows Nigeria to use tariffs to protect some
local industries
▪ In spite of these limitations, Chenery’s model is useful for economic growth where
different countries with varying economic systems are able to support each other
in terms of economic relations. On this note, this model suits the economic
development efforts of developing countries against the backdrop of globalization
50.
NEO-COLONIAL DEPENDENCEMODEL
▪ The neocolonial dependence model is basically a Marxist approach.
▪ Underdevelopment is due to the historical evolution of a highly unequal international capitalist
system of rich country-poor country relationships.
▪ Developed nations are intentionally exploitative or unintentionally neglectful towards
developing countries. Underdevelopment is thus externally induced.
▪ Developing countries are destined to be the sweatshops of the rich nations (through their
multinationals for example) and depend on developed nations for manufacturing goods that are
high-value-added.
Many developing countries were forced to become exporters of primary commodities by
their colonial masters. Many of these countries still depend on primary commodities after
independence. However, with average prices of primary commodities falling
substantially (by half in many cases) since 1950s, dependence on primary commodities
export is impoverishing to these countries. The economies of Zambia and Nigeria had
been negatively affected by falling prices for their commodities exports. However,
countries like Thailand and Malaysia who used to depend heavily on tin, rubber and
palm oil are able to diversified into manufacturing exports. These countries went on to
develop strong manufacturing sector.
51.
FALSE PARADIGM MODEL▪ underdevelopment is due to faulty and inappropriate advice provided by well-
meaning but often uninformed, biased, and ethnocentric international (often
western) expert advisers to developing countries.
▪ IMF and World Banks took a lot of blame from the advocators of this model.
Joseph Stiglitz in Making Globalization Works and Jeffrey Sachs in The End of
Poverty documented some cases where inappropriate advices were given by
expert advisers from developed countries to developing nations.
▪ If the advice of these international advisers were helpful they usually benefit the
urban elites. Some economists argue that loans provided to developing countries
in the 1960s and 1970s contribute to debt crisis in some developing countries in
the 1980s.
An Case of Misdirection. Eucalyptus is a fast growing tree in favorable conditions and its wood
has good commercial value. Encouraged by international advisers, this tree was introduced to
many parts of India indiscriminately in the 1970s. In Bangalore, a dry zone, yields were only 20%
of the projected figure by the government. In Western Ghats, eucalyptus plantations were taken
up on a large scale by clear-felling of excellent rainforest. Unfortunately, these eucalyptus trees
were attack by fungus called pink disease and rendered the plantation useless. The losers in this
case were the local Indian farmers and environmental quality of India.
52.
THE DUALISTIC DEVELOPMENTTHEORIES
▪ This thesis recognizes the existence and persistence of increasing divergences between
rich and poor nations, and between rich and poor people at various levels. The urban
elites in developing countries will remain rich and become richer. The wealth of these
elite will not trickle down to the rest of the society. According to the World Bank, the
average for the richest twenty countries in the world was 15 times the average for the
poorest twenty countries in 1960, and in 2000 it is 30 times — twice as high.
▪ However, case studies of Taiwan, South Korea, China, Costa Rica, Sri Lanka, and Hong
Kong demonstrated that higher income levels can be accompanied by falling and not
rising inequality. The inverted Kuznet Curve shows that as income per capita continues to
increase inequality of income can be reduced.
▪ Basically, dependency theories highlight the need for major new policies to eradicate
poverty, to provide more diversified employment opportunities, and to reduce income
inequalities. The Marxist approach to growth would recommend nationalization of
industries that are controlled by foreign companies (especially those from the western
colonists and multinationals ) and implement state-run production to reduce foreign
controls on local economy.
53.
DEPENDENCY THEORIES▪ Dependency theories offer little explanation for economic growth and sustainable
development. They tell us little on how to obtain economic growth.
▪ The actual economic experience of developing countries that pursued
nationalization and introduced state-run production had been mostly negative.
Nationalized companies were usually badly managed. Consequently, the
operations were inefficient and productivity fell. Falling output led to falling export
earnings. This was bad news for growth.
54.
NEOCLASSICAL GROWTHMODEL
▪ Neoclassical Growth Model owed its origin to Robert Solow (in 1956) and Trevor Swan (in 1956). The
neoclassical growth model says that grow due to increased capital stock as in Harrod-Domar Model can
only be temporary because capital is subjected to diminishing marginal returns. The economy can achieve
a higher long-run growth path only with a grow in labor supply, labor productivity or capital productivity.
Variation in growth rate is explained by difference in the rate of technological change which affects labor
and capital productivity. Advances in technology however is independent of the rate of investment, that is
technology is exogenous to the model.
▪ In the 1980s, Reaganomics and Thatcherism were the buzzwords. These policies recommended small
government with little government intervention in the market, reduced distortions in the market, promoted
free markets, encouraged competition and regarded multinationals in favorable lights.
▪ Underdevelopment is seen as the product of poor resource allocation, incorrect pricing policies and too
much state interventions that cause market distortion.
▪ The answer is promotion of free markets and laissez-faire economics through privatization and
deregulation.
▪ Governments should also have market-friendly approaches to address externality problems. Governments
should invest in physical and social infrastructure, health care facilities, education and provide suitable
climate for private enterprises. Governments should also be friendly towards multinationals and attract
Foreign Direct Investment (FDI) as this policy brings injection into the economy.
55.
NEOCLASSICAL GROWTHMODEL
Criticisms:
▪ Economic growth does not means development. Policies that promote economic growth
may benefit the rich in the expense of the poor and the environmental qualities (more
environmental degradation). A smaller government could also mean less social facilities
for the poor.
▪ South Korea, Singapore, Japan, and China do not have genuine free market economies
but are economic success stories. In fact, governments in these countries play active
roles in directing their respective economies.
▪ Solow-Swan Model suggests that low capital to labor ratio in developing countries means
that the rate of return on investment is high but this is not supported by historical data.
▪ The residual in Solow-Swan Model which is attributed to technology only explains 50% of
historical growth in developed nations. There is much room for improvement in this
model.
56.
ENDOGENOUS GROWTHMODEL
▪ This model is called Endogenous growth model because it makes technology a part of the model and not as a residual.
This model tries to explain the rate of technological change.
▪ Persistent economic growth is determined by the system governing the production process as technology is now part
of the model. Economic growth is a natural consequence of long run equilibrium.
▪ The model allows potentially increasing return to scale from higher level of capital investment, especially investment
that has positive externalities. Capital is expanded to encompass human capital .
▪ Human productivity could increase due to higher skill attainment and learning-by-doing. The latter suggests that
experience allows a worker to have higher productivity.
▪ Human capital can be encouraged through education and skill-training programmers.
▪ The rate of technological change can increase due to higher investment in R&D. R&D may also confer positive
externality to knowledge-intensive industries.
▪ Protection of intellectual property rights is important because this legal monopoly gives incentive to carry out R&D.
▪ The model implies an active role for government to promote human capital formation (through education, better
access to health care, and better nutrition) and encourage knowledge-intensive industries. To achieve the latter, some
government even took the trouble to pick future industrial winners. Japan in the past promoted chemical and heavyindustry. More recently it promoted biochemical industry. Malaysia, for example, established a whole new town
called Cyberjaya to attract knowledge-intensive industries and R&D into the country.
57.
▪ Criticisms:Developing countries cannot take full advantage from the recommendation of this model
that is based on neoclassical principles of efficient free market because of poor
infrastructure, inadequate institutional structures, and imperfect capital and good
markets. Many developing countries, for instance, do not have adequate protection for
intelligent property rights and insurance markets that encourage entrepreneurship.
▪ The model fails to explain why low-income countries where capital is scarce have low
rates of factory capacity utilization.
▪
58.
WORLDECONOMICS:
MODERN FACTORS OF
ECONOMIC GROWTH AND
Prof. Zharova Liubov
ECONOMIC
DEVELOPMENT
Zharova_l@ua.fm
59.
FACTORS THAT AFFECTECONOMIC GROWTH
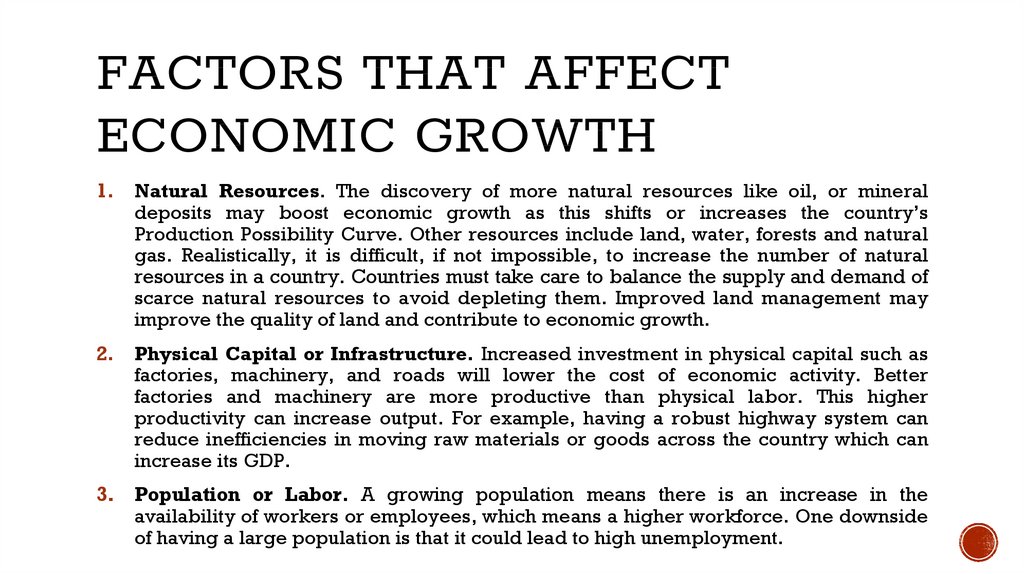
1. Natural Resources. The discovery of more natural resources like oil, or mineral
deposits may boost economic growth as this shifts or increases the country’s
Production Possibility Curve. Other resources include land, water, forests and natural
gas. Realistically, it is difficult, if not impossible, to increase the number of natural
resources in a country. Countries must take care to balance the supply and demand of
scarce natural resources to avoid depleting them. Improved land management may
improve the quality of land and contribute to economic growth.
2. Physical Capital or Infrastructure. Increased investment in physical capital such as
factories, machinery, and roads will lower the cost of economic activity. Better
factories and machinery are more productive than physical labor. This higher
productivity can increase output. For example, having a robust highway system can
reduce inefficiencies in moving raw materials or goods across the country which can
increase its GDP.
3. Population or Labor. A growing population means there is an increase in the
availability of workers or employees, which means a higher workforce. One downside
of having a large population is that it could lead to high unemployment.
60.
FACTORS THAT AFFECTECONOMIC GROWTH
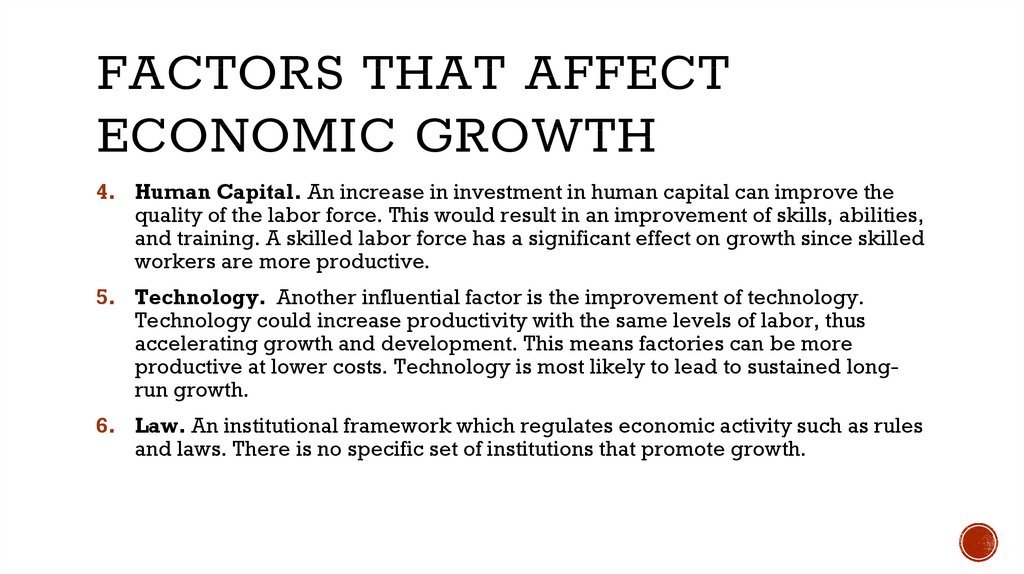
4. Human Capital. An increase in investment in human capital can improve the
quality of the labor force. This would result in an improvement of skills, abilities,
and training. A skilled labor force has a significant effect on growth since skilled
workers are more productive.
5. Technology. Another influential factor is the improvement of technology.
Technology could increase productivity with the same levels of labor, thus
accelerating growth and development. This means factories can be more
productive at lower costs. Technology is most likely to lead to sustained longrun growth.
6. Law. An institutional framework which regulates economic activity such as rules
and laws. There is no specific set of institutions that promote growth.
61.
FACTORS THAT LIMITECONOMIC GROWTH
1. Poor health and low levels of education. People who don’t have access to healthcare
or education have lower levels of productivity. This means the labor force is not as
productive as it could be. Therefore, the economy does not reach the productivity it
could otherwise.
2. Lack of necessary infrastructure. Developing nations often suffer from inadequate
infrastructures such as roads, schools, and hospitals. This lack of infrastructure makes
transportation more expensive and slows the overall efficiency of the country.
3. Flight of Capital. If the country is not delivering the returns expected from investors,
then investors will pull out their money. Money often flows out the country to seek
higher rates of returns.
4. Political Instability. Similarly, political instability in the government scares investors
and hinders investment. For example, Zimbabwe has been plagued with political
uncertainty and laws favoring indigenous ownership. This has scared off many
investors who prefer smaller but surer returns elsewhere.
5. Institutional Framework. Often local laws don’t adequately protect rights. Lack of an
institutional framework can severely impact progress and investment.
62.
FACTORS OF ECONOMICGROWTH
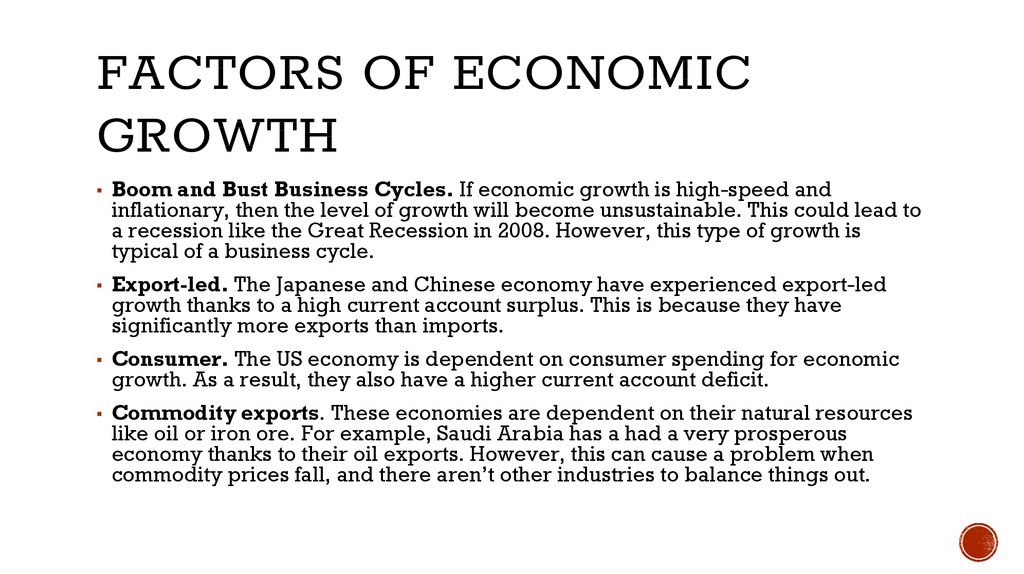
▪ Boom and Bust Business Cycles. If economic growth is high-speed and
inflationary, then the level of growth will become unsustainable. This could lead to
a recession like the Great Recession in 2008. However, this type of growth is
typical of a business cycle.
▪ Export-led. The Japanese and Chinese economy have experienced export-led
growth thanks to a high current account surplus. This is because they have
significantly more exports than imports.
▪ Consumer. The US economy is dependent on consumer spending for economic
growth. As a result, they also have a higher current account deficit.
▪ Commodity exports. These economies are dependent on their natural resources
like oil or iron ore. For example, Saudi Arabia has a had a very prosperous
economy thanks to their oil exports. However, this can cause a problem when
commodity prices fall, and there aren’t other industries to balance things out.
63.
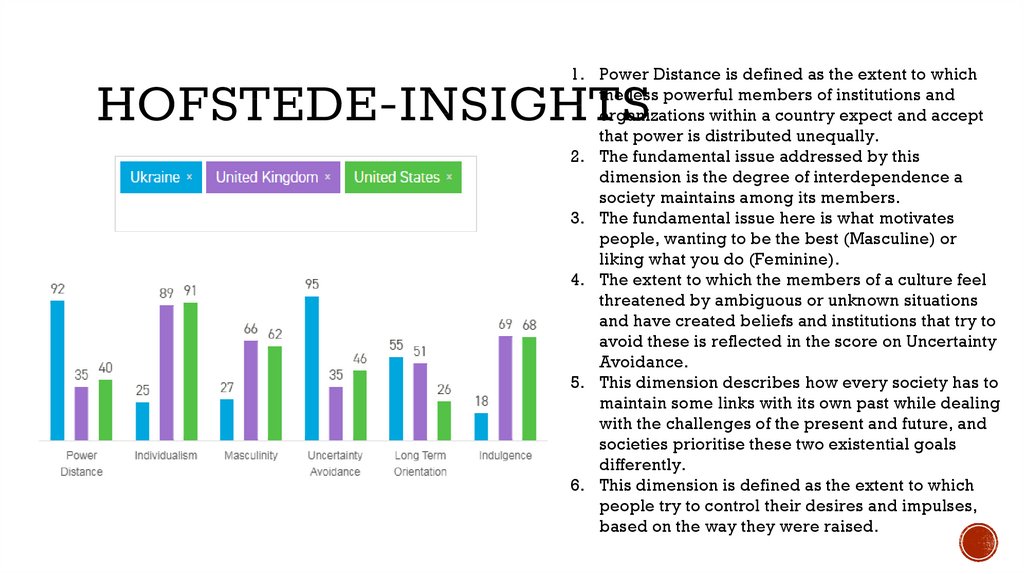
1. Power Distance is defined as the extent to whichthe less powerful members of institutions and
organizations within a country expect and accept
that power is distributed unequally.
2. The fundamental issue addressed by this
dimension is the degree of interdependence a
society maintains among its members.
3. The fundamental issue here is what motivates
people, wanting to be the best (Masculine) or
liking what you do (Feminine).
4. The extent to which the members of a culture feel
threatened by ambiguous or unknown situations
and have created beliefs and institutions that try to
avoid these is reflected in the score on Uncertainty
Avoidance.
5. This dimension describes how every society has to
maintain some links with its own past while dealing
with the challenges of the present and future, and
societies prioritise these two existential goals
differently.
6. This dimension is defined as the extent to which
people try to control their desires and impulses,
based on the way they were raised.
HOFSTEDE-INSIGHTS
64.
PATH DEPENDENCY▪ Path dependency is an idea that tries to explain the continued use of a product or
practice based on historical preference or use. This holds true even if newer, more
efficient products or practices are available due to the previous commitment
made. Path dependency occurs because it is often easier or more cost effective to
simply continue along an already set path than to create an entirely new one.
▪
An example of path dependency would be a town that is built around a factory. It makes
more sense for a factory to be located a distance away from residential areas for various
reasons. However, it is often the case that the factory was built first, and the workers needed
homes and amenities built close by for them. It would be far too costly to move the factory
once it has already been established, even though it would better serve the community from
the outskirts of town.
65.
MIDDLE CLASS▪ Different, partly overlapping concepts of ‘class’
Statistical partitioning of distribution in discrete, partly arbitrary, groups
▪ Sociological perspective (position in division of labour, occupations, education)
▪ Political (capacity to forge identities and articulate common demands)
▪
'Middle Class'
Middle class is a description given to individuals and households who fall between the
working class and the upper class within a societal hierarchy. In Western cultures, persons
in the middle class tend to have a higher proportion of college degrees than those in the
working class, have more income available for consumption and may own property. Those
in the middle class often are employed as professionals, managers and civil servants.
66.
MIDDLE CLASS▪ no single OECD definition of the ‘middle-class’ analogue that what we use for
income poverty (40, 50, 60% of median household disposable income), i.e. various
OECD studies used different definitions
▪ general definition of the middle class used here: people in 5th to 9th decile of the
distribution (Palma ratio). At this stage, not much evidence that alternative
definitions would lead to similar conclusions
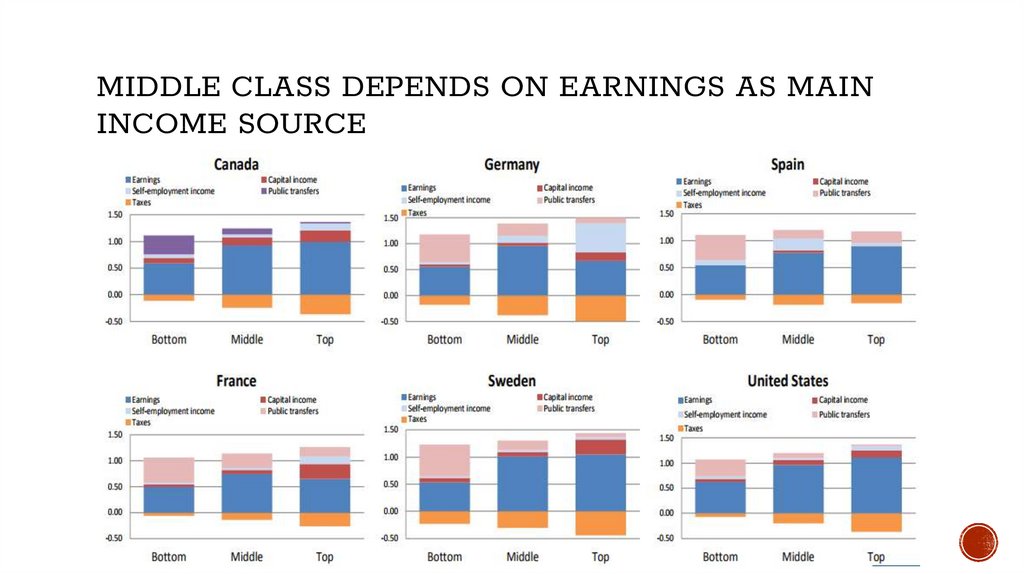
67.
MIDDLE CLASS DEPENDS ON EARNINGS AS MAININCOME SOURCE
68.
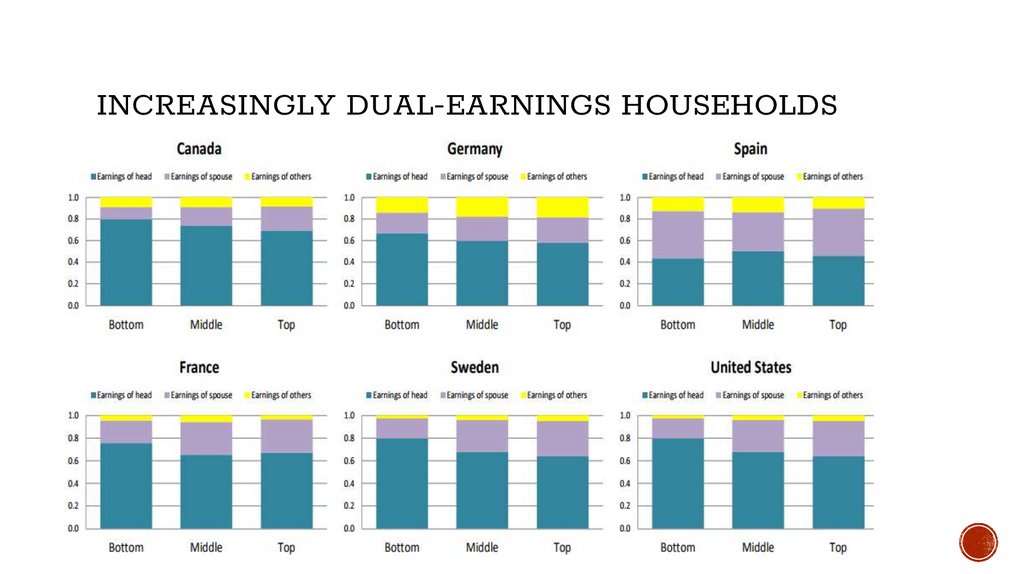
INCREASINGLY DUAL-EARNINGS HOUSEHOLDS69.
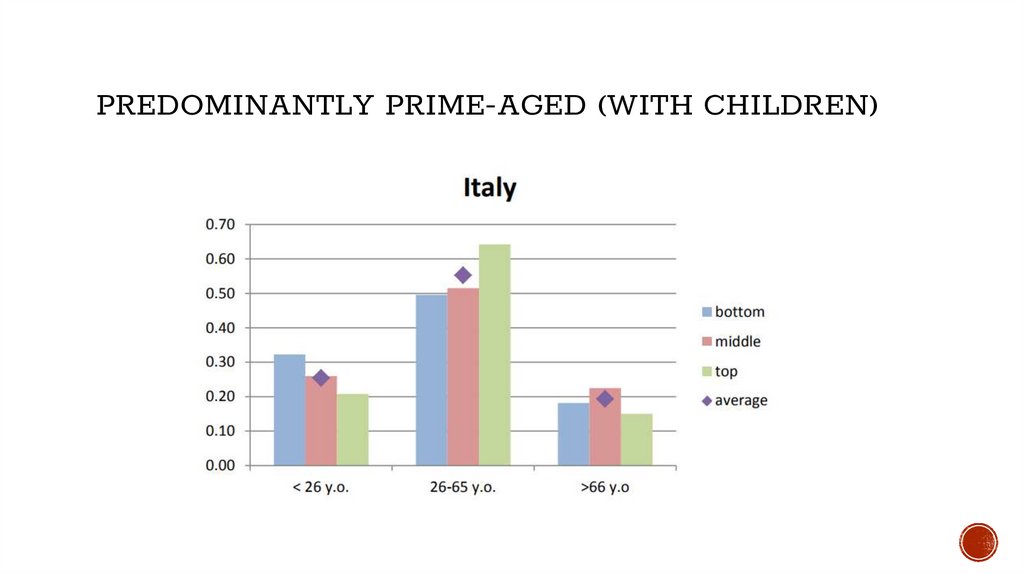
PREDOMINANTLY PRIME-AGED (WITH CHILDREN)70.
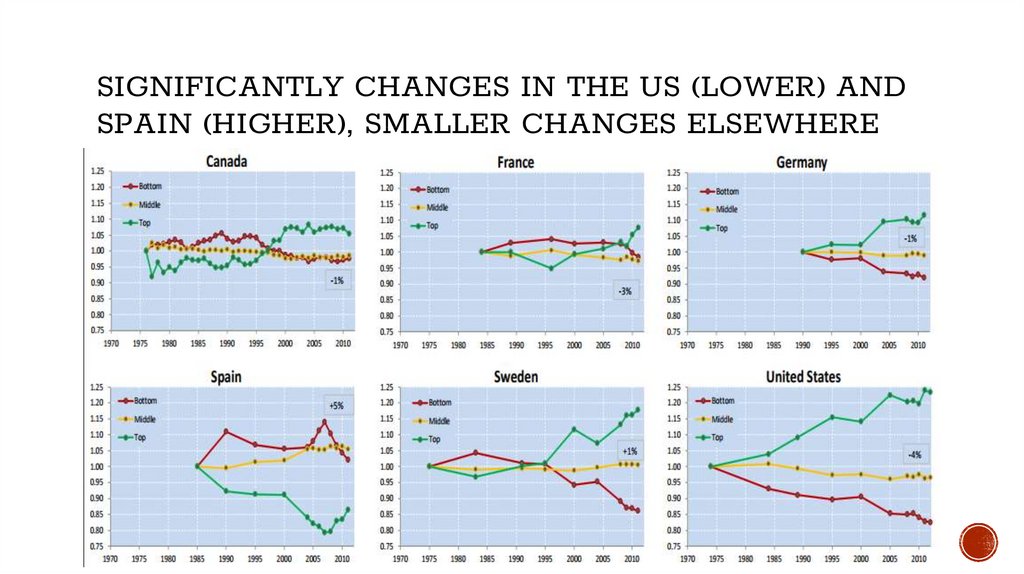
SIGNIFICANTLY CHANGES IN THE US (LOWER) ANDSPAIN (HIGHER), SMALLER CHANGES ELSEWHERE
71.
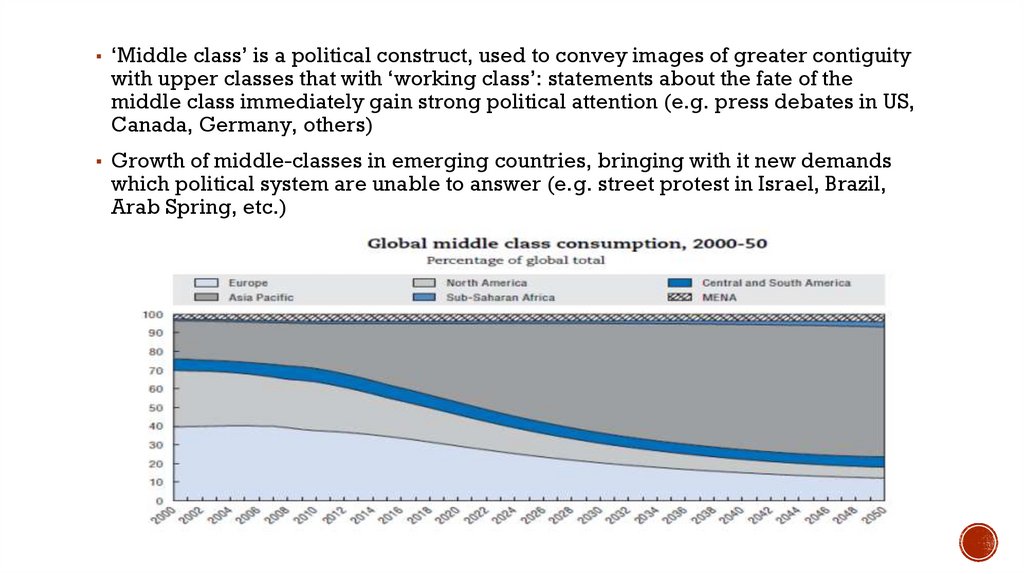
▪ ‘Middle class’ is a political construct, used to convey images of greater contiguitywith upper classes that with ‘working class’: statements about the fate of the
middle class immediately gain strong political attention (e.g. press debates in US,
Canada, Germany, others)
▪ Growth of middle-classes in emerging countries, bringing with it new demands
which political system are unable to answer (e.g. street protest in Israel, Brazil,
Arab Spring, etc.)
72.
FINANCIAL CRISESThe amount of subprime mortgage debt, which was guaranteed by Freddie
Mac and Fannie Mae, continued to expand into the early 2000s, about the time
the Federal Reserve Board began to cut interest rates drastically to fend off a
recession. The combination of loose credit requirements and cheap money
spurred a housing boom, which drove speculation, which in turn drove up housing
prices.
73.
THE GREAT RECESSION▪ The Great Recession is a term that represents the sharp decline in
economic activity during the late 2000s, which is generally
considered the largest downturn since the Great Depression.
▪ The term Great Recession is a play on the term Great Depression
▪ Great Recession applies to both the U.S. recession, officially
lasting from December 2007 to June 2009, and the ensuing global
recession in 2009. The economic slump began when the U.S.
housing market went from boom to bust and large amounts
of mortgage-backed securities and derivatives lost significant
value.
74.
BEFORE GREATRECESSION
▪ The investment banks, looking for easy profits in the wake of the dotcom
bust and 2001 recession, created collateralized debt obligations (CDOs) out
of mortgages purchased on the secondary market.
▪
Because subprime mortgages were bundled with prime mortgages, there
was no way for investors to understand the risks associated with the product.
▪
Around the time when the market for CDOs was heating up, the housing
bubble that had been building up for several years was beginning to burst.
▪
As housing prices fell, subprime borrowers began to default on loans that
were worth more than their homes, accelerating the decline in prices.
▪
When investors realized the CDOs were becoming worthless due to the toxic
debt they represented, they tried to unload them, but there was no market
for them.
▪
This caused a cascade of subprime lender failures, which created a liquidity
contagion that worked its way to the upper tiers of the banking system.
▪
Two major investment banks, Lehman Brothers and Bear Stearns, collapsed
under the weight of their exposure to the subprime debt, and more than 450
banks failed over the next 5 years.
75.
DOTCOM BUBBLE▪ The dotcom bubble occurred in the late 1990s and was
characterized by a rapid rise in equity markets fueled by
investments in Internet-based companies. During
the dotcom bubble, the value of equity markets grew exponentially, with
the technology-dominated NASDAQ index rising from under 1,000 to more
than 5,000 between 1995 and 2000.
▪ The dotcom bubble grew out of a combination of the presence of
speculative or fad-based investing, the abundance of venture capital
funding for startups and the failure of dotcoms to turn a profit.
Investors poured money into Internet startups during the 1990s in the
hope that those companies would one day become profitable, and
many investors and venture capitalists abandoned a cautious
approach for fear of not being able to cash in on the growing use of
the Internet.
The 1990s was a period of rapid technological advancement in many
areas, but it was the commercialization of the Internet that led to the
greatest expansion of capital growth the country had ever seen. Although
high-tech standard bearers, such as Intel, Cisco, and Oracle were driving
the organic growth in the technology sector, it was the upstart dotcom
companies that fueled the stock market surge that began in 1995.
76.
From IMFLESSONS
▪ Originators need to be "incentivized" to make loans to high-quality borrowers and
to monitor loan performance more carefully.
▪ The governance structure of the risk management system needs to be improved in
financial firms in which the incentives are biased toward returns rather than the
risks involved in attaining them.
▪ The incentives to use credit rating agencies and the incentive structures within
credit rating agencies themselves need to be reexamined
▪ Investors need to perform their own due diligence and ask the right questions
about the riskiness of the securities they are purchasing
77.
EIU GLOBAL FORECAST HIGHER INTEREST RATES ARECOMING
▪ The US economy will continue to motor along; the euro area will absorb more of
labour market slack; the Chinese government will manage its economic slowdown
carefully; and Japan's economy will grow by 1.5%.
▪ Higher commodity prices will prove a fillip for emerging-market exporters, as will
strong external demand from developed markets.
▪ However, 2018 will also be characterised by tightening monetary policy and credit
conditions. On balance, the global economy is forecast to expand by 3% in 2018
and 2.9% in 2019, from an estimated 3% in 2017.
78.
DEVELOPED WORLD▪ The US economy is in good shape, and we have revised up economic growth in 2018 to
2.5%, from 2.3% previously. Wage growth is showing signs of accelerating, and the
unemployment rate is at its lowest level since 2000.
▪ Expects the US economy to show signs of overheating in the next two years, as a result of
which the Fed will quicken the pace of monetary tightening, especially given the recent
tax changes. Unable to cope with this, the economy will face a downturn in early 2020.
▪ The recent revival of the euro zone economy is likely to be sustained, but political risk
will remain high. EU leaders are currently boosting the region's resilience to shocks, in
part by renewing their push for further integration of the economic and monetary union.
▪ A decision on reform proposals will be made at the EU summit in June 2018. Following the
renewed landslide secured by the ruling Liberal Democratic Party (LDP) in Japan, Shinzo
Abe is in a strong position to secure another term as LDP leader when the party votes in
late 2018. This comes in the context of the country's mild economic recovery under the
prime minister's recovery plan.
79.
EMERGING MARKETS▪ Conditions for emerging markets to become more challenging in the first half of the
forecast period as US interest rates continue to rise. India will be Asia's fastest-growing
large economy in 2018-22, expanding at an average annual rate of 7.9%. Growth will also
remain on track in the Association of South-East Asian Nations (ASEAN) member states,
with an average annual expansion of 4.8%. Vietnam, Cambodia and Myanmar, in
particular, will continue to record growth rates above 6%, owing to relatively low wage
costs and advantageous geographic locations.
▪ the Chinese economy to slowly slightly in 2018, to 6.4%, from an estimated 6.9% in 2017.
The government's long-held target of doubling real GDP between 2010 and 2020 is within
its grasp; it requires annual average GDP growth of 6.3% in 2018-20. We believe that it
will meet this target without requiring significant economic stimulus. We expect China to
move away from GDP targeting in the next decade. This is ideologically consistent with
the call of the president, Xi Jinping, for more inclusive growth in his landmark speech at
the party congress at the end of 2017. As such, we expect growth to continue to slow
steadily in the forecast period, reaching 5.2% in 2022.
80.
EMERGING MARKETS▪ The ongoing economic recovery in Latin America is forecast to gather momentum in 2018-19, after several
years dominated by macroeconomic policy adjustments to the end of the commodities boom of the
previous decade. Sustained Chinese growth will continue to provide a favourable external environment for
the region, particularly for commodity exporters such as Brazil and Argentina. This, combined with a rise
in global risk appetite, as reflected in lower sovereign credit default swap rates (except for Venezuela,
which defaulted on some external debt obligations in late 2017, taking the country further into economic
and financial crisis), has generated strong growth in local stockmarkets.
▪ At present, seven countries in the Middle East that collectively account for a quarter of the regional
population are either torn by civil war or destabilised by Shia-Sunni rivalry. Geopolitical risk has also risen
rapidly within the Gulf Co-operation Council (GCC). We expect the boycott of Qatar by some of the GCC
countries and Egypt to continue until at least 2021. In this period divisions will harden between Qatar,
Turkey and Iran on one side, and Saudi Arabia, the UAE and Egypt on the other. The long-term rivalry
between Saudi Arabia and Iran is likely to destabilise a group of other countries in the Middle East,
including Iraq, Syria, Lebanon and Yemen. Tensions are likely to increase rather than diminish in the
region in the coming months.
▪ Following a dismal performance in Sub-Saharan Africa over 2016-17, we expect a lacklustre recovery to
take hold from 2018. This will be driven by a favourable external environment as export prices strengthen
and trade gathers pace. However, policy mismanagement, unsupportive political dynamics and gradual
tightening of credit conditions in developed economies will weigh on future prospects. On balance, the
region is forecast to grow by 3.3% a year in 2018-22.
81.
COMMODITIES▪ The price of crude oil is likely to remain range-bound, at US$60-70/barrel in
2018-19 for dated Brent Blend, despite the efforts of OPEC and its partners, notably
Russia, to constrain global supply by extending the existing production-cut deal
until the end of 2018. These efforts will be largely offset by US shale, which will
provide both a price ceiling and a floor.
▪ Industrial raw materials prices are set to rise for a second successive year in 2018
on the back of strong growth in China and strict environmental controls restricting
supply. We expect marginal growth in food, feedstuffs and beverages prices,
reflecting rising population, incomes and rapid urbanisation.
82.
WORLDECONOM
Y:
FORECAS
T
SUMMAR
Y
83.
84.
WORLDECONOMICS:
MICROFINANCE
Prof. Zharova Liubov
Zharova_l@ua.fm
85.
INTRO▪ MICROFINANCE
❑ Social impact of
Banks;
❑ basic mechanism of capital accumulation;
❑ public and private investments;
❑ human development index (HDI);
❑ development indicators
86.
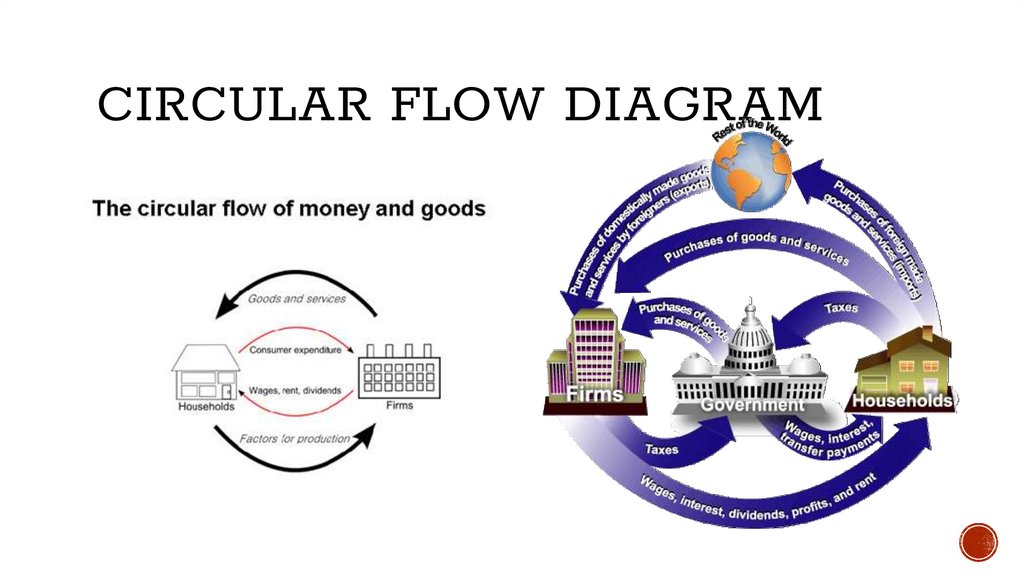
CIRCULAR FLOW DIAGRAM87.
MIDDLE CLASS▪ Different, partly overlapping concepts of ‘class’
Statistical partitioning of distribution in discrete, partly arbitrary, groups
▪ Sociological perspective (position in division of labour, occupations, education)
▪ Political (capacity to forge identities and articulate common demands)
▪
'Middle Class'
Middle class is a description given to individuals and households who fall between the
working class and the upper class within a societal hierarchy. In Western cultures, persons
in the middle class tend to have a higher proportion of college degrees than those in the
working class, have more income available for consumption and may own property. Those
in the middle class often are employed as professionals, managers and civil servants.
88.
MIDDLE CLASS▪ no single OECD definition of the ‘middle-class’ analogue that what we use for
income poverty (40, 50, 60% of median household disposable income), i.e. various
OECD studies used different definitions
▪ general definition of the middle class used here: people in 5th to 9th decile of the
distribution (Palma ratio). At this stage, not much evidence that alternative
definitions would lead to similar conclusions
89.
MIDDLE CLASS DEPENDS ON EARNINGS AS MAININCOME SOURCE
90.
INCREASINGLY DUAL-EARNINGS HOUSEHOLDS91.
PREDOMINANTLY PRIME-AGED (WITH CHILDREN)92.
SIGNIFICANTLY CHANGES IN THE US (LOWER) ANDSPAIN (HIGHER), SMALLER CHANGES ELSEWHERE
93.
▪ ‘Middle class’ is a political construct, used to convey images of greater contiguitywith upper classes that with ‘working class’: statements about the fate of the
middle class immediately gain strong political attention (e.g. press debates in US,
Canada, Germany, others)
▪ Growth of middle-classes in emerging countries, bringing with it new demands
which political system are unable to answer (e.g. street protest in Israel, Brazil,
Arab Spring, etc.)
94.
CAPITAL ACCUMULATION▪ Capital accumulation is a product of capital investment. Capital accumulation also
increases with return from an investment. An individual or company can
accumulate capital in various ways some of which include investment purchases
and investment savings. Return from an investment can also lead to capital
accumulation, specifically from occurrences such as investment profits, rent,
interest, royalties or capital gains. Entities often increase their holdings in
profitable assets to provide for greater capital accumulation. Investors can also
regularly contribute to a capital base to accumulate capital and generate capital
gains.
95.
SOLOW MODEL▪ Robert Solow developed the neo-classical theory of economic growth and Solow
won the Nobel Prize in Economics in 1987. He has made a huge contribution to our
understanding of the factors that determine the rate of economic growth for
different countries.
▪ Growth comes from adding more capital and labour inputs and also
from ideas and new technology.
96.
WHAT ARE THE BASIC POINTS ABOUTTHE SOLOW ECONOMIC GROWTH
MODEL?
▪ The Solow model believes that a sustained rise in capital investment increases the
▪
▪
▪
▪
▪
growth rate only temporarily: because the ratio of capital to labour goes up.
However, the marginal product of additional units of capital may decline (there are
diminishing returns) and thus an economy moves back to a long-term growth path, with
real GDP growing at the same rate as the growth of the workforce plus a factor to reflect
improving productivity.
A 'steady-state growth path' is reached when output, capital and labour are all growing
at the same rate, so output per worker and capital per worker are constant.
Neo-classical economists believe that to raise the trend rate of growth requires
an increase in the labour supply + a higher level of productivity of labour and
capital.
Differences in the pace of technological change between countries are said to explain
much of the variation in growth rates that we see.
97.
CATCH UP GROWTH / CUTTINGEDGE GROWTH
▪ The Solow Model features the idea of catch-up growth when a poorer country is
catching up with a richer country – often because a higher marginal rate of
return on invested capital in faster-growing countries.
▪ The Solow model predicts some convergence of living standards (measured by
per capita incomes) but the extent of catch up in living standards is questioned –
not least the existence of the middle-income trap when growing economies find it
hard to sustain growth and rising per capita incomes beyond a certain level.
98.
MICROFINANCE▪ also called microcredit, is a type of
banking service that is provided to
unemployed or low-income individuals or
groups who otherwise have no other
access to financial services.
▪ While institutions participating in the area
of microfinance are most often associated
with lending (microloans can be
anywhere from $100 to $25,000), many
offer additional services, including bank
accounts and micro-insurance products,
and provide financial and business
education.
▪ Ultimately, the goal of microfinance is
to give impoverished people an
opportunity to become self-sufficient.
Microfinance services are provided to unemployed or
low-income individuals because most of those
trapped in poverty or with limited resources do not
have enough income to do business with traditional
financial institutions. Despite being excluded from
banking services, however, those who live off of as
little as $2 a day do attempt to save, borrow, acquire
credit or insurance and make payments on their
debts. As a result, many look for help from family,
friends and even loan sharks, who often charge
exorbitant interest rates.
Microfinance allows people to safely take on
reasonable small business loans in a manner that is
consistent with ethical lending practices. Although
they exist all around the world, the majority of
microfinancing operations occur in developing
nations, such as Uganda, Indonesia, Serbia and
Honduras. Many microfinance institutions (MFIs) focus
on helping women in particular.
99.
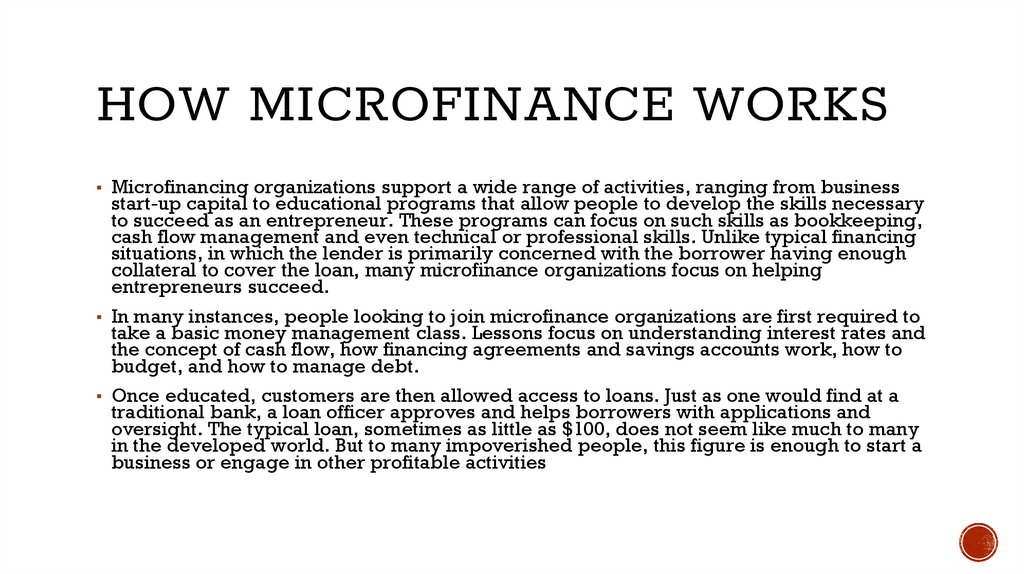
HOW MICROFINANCE WORKS▪ Microfinancing organizations support a wide range of activities, ranging from business
start-up capital to educational programs that allow people to develop the skills necessary
to succeed as an entrepreneur. These programs can focus on such skills as bookkeeping,
cash flow management and even technical or professional skills. Unlike typical financing
situations, in which the lender is primarily concerned with the borrower having enough
collateral to cover the loan, many microfinance organizations focus on helping
entrepreneurs succeed.
▪ In many instances, people looking to join microfinance organizations are first required to
take a basic money management class. Lessons focus on understanding interest rates and
the concept of cash flow, how financing agreements and savings accounts work, how to
budget, and how to manage debt.
▪ Once educated, customers are then allowed access to loans. Just as one would find at a
traditional bank, a loan officer approves and helps borrowers with applications and
oversight. The typical loan, sometimes as little as $100, does not seem like much to many
in the developed world. But to many impoverished people, this figure is enough to start a
business or engage in other profitable activities
100.
MICROFINANCE LOAN TERMS▪ Like conventional lenders, microfinanciers must charge interest on loans, and they
institute specific repayment plans with payments due at regular intervals. Some require
loan recipients to set aside parts of their income in a savings account used as insurance in
case of default; if the borrower repays the loan successfully, he has use of this account, of
course.
▪ Because many applicants cannot offer any collateral, microlenders often pool borrowers
together, as a buffer. After receiving loans, recipients repay their debts together.
Because the success of the program depends on everyone's contributions, a form of peer
pressure helps ensure loan repayment. For example, if an individual is having trouble
using his or her money to start a business, that person can seek help from other group
members or from the loan officer. Through repayment, loan recipients start to develop a
good credit history, allowing them to obtain larger loans down the line.
▪ Interestingly, even though the borrowers often qualify as very poor, repayment rates on
microloans are often higher than the average rate on more conventional forms of
financing. For example, the microfinancing institution Opportunity International reported
repayment rates of approximately 98.9% in 2016.
101.
HISTORY OF MICROFINANCE▪ Microfinance is not a new concept: Small operations have existed since the 18th
century. The first occurrence of microlending is attributed to the Irish Loan Fund
system, introduced by Jonathan Swift, which sought to improve conditions for
impoverished Irish citizens.
▪ But in its modern form, microfinancing became popular on a large scale in the
1970s. The first organization to receive attention was the Grameen Bank, which
was started in 1976 by Muhammad Yunus in Bangladesh. On top of providing loans
to its clients, the Grameen Bank also suggests its customers subscribe to its "16
Decisions," a basic list of ways the poor can improve their lives. The "16
Decisions" touch on a wide variety of subjects ranging from a request to stop the
practice of issuing dowries upon a couple's marriage to ensuring drinking water is
kept sanitary. In 2006, the Nobel Peace Prize was awarded to both Yunus and the
Grameen Bank for their efforts in developing the microfinance system.
102.
http://www.grameen.com/16decisions/1.0 We shall follow and advance the four principles of Grameen Bank – Discipline, Unity, Courage and Hard work
– in all walks of our lives.
2.0 Prosperity we shall bring to our families.
3.0 We shall not live in dilapidated houses. We shall repair our houses and work towards constructing new
houses at the earliest.
4.0 We shall grow vegetables all the year round. We shall eat plenty of them and sell the surplus.
5.0 During the plantation seasons, we shall plant as many seedlings as possible.
6.0 We shall plan to keep our families small. We shall minimize our expenditures. We shall look after our health.
7.0 We shall educate our children and ensure that they can earn to pay for their education.
8.0 We shall always keep our children and the environment clean.
9.0 We shall build and use pit-latrines.
10.0 We shall drink water from tubewells. If it is not available, we shall boil water or use alum.
11.0 We shall not take any dowry at our sons' weddings, neither shall we give any dowry at our daughters
wedding. We shall keep our centre free from the curse of dowry. We shall not practice child marriage.
12.0 We shall not inflict any injustice on anyone, neither shall we allow anyone to do so.
13.0 We shall collectively undertake bigger investments for higher incomes.
14.0 We shall always be ready to help each other. If anyone is in difficulty, we shall all help him or her.
15.0 If we come to know of any breach of discipline in any centre, we shall all go there and help restore
discipline.
16.0 We shall take part in all social activities collectively.,
103.
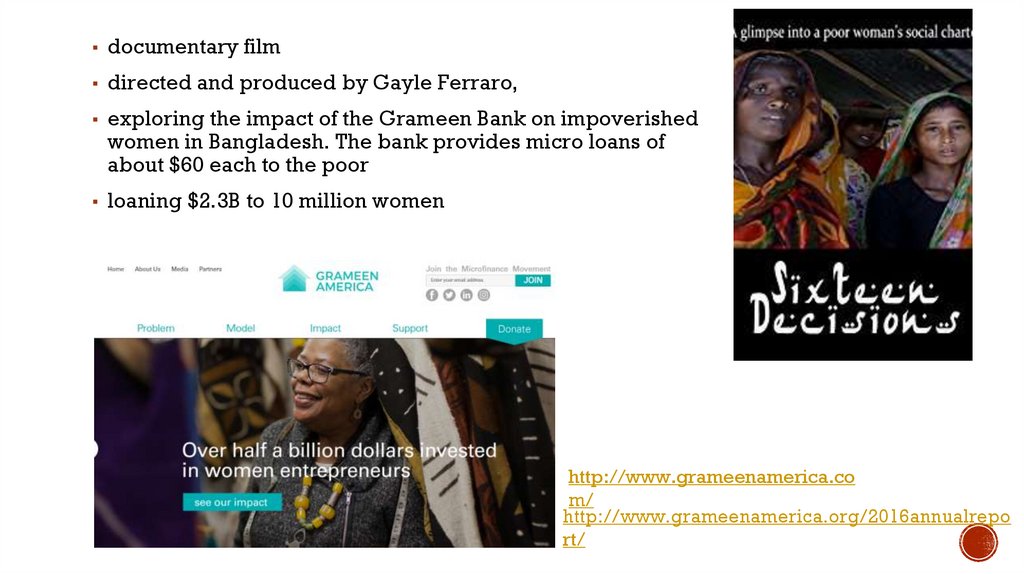
▪ documentary film▪ directed and produced by Gayle Ferraro,
▪ exploring the impact of the Grameen Bank on impoverished
women in Bangladesh. The bank provides micro loans of
about $60 each to the poor
▪ loaning $2.3B to 10 million women
http://www.grameenamerica.co
m/
http://www.grameenamerica.org/2016annualrepo
rt/
104.
HISTORY OF MICROFINANCE▪ India's SKS Microfinance also serves a large number of poor clients. Formed in
1998, it has grown to become one of the biggest microfinance operations in the
world. SKS works in a similar fashion to the Grameen Bank, pooling all borrowers
into groups of five members who work together to ensure loan repayment.
▪ There are other microfinance operations around the world. Some larger
organizations work closely with the World Bank, while other smaller groups
operate in different nations. Some organizations enable lenders to choose exactly
who they want to support, categorizing borrowers on criteria like level of poverty,
geographical region and type of small business. Others are very specifically
targeted: There are those in Uganda, for example, that focus on providing women
with capital required to undertake projects such as growing eggplants and
opening small cafés. Some groups tend to focus their efforts only on businesses
which are created with the intent of improving the overall community through
initiatives like education, job training and clean water.
105.
http://www.bfil.co.in/
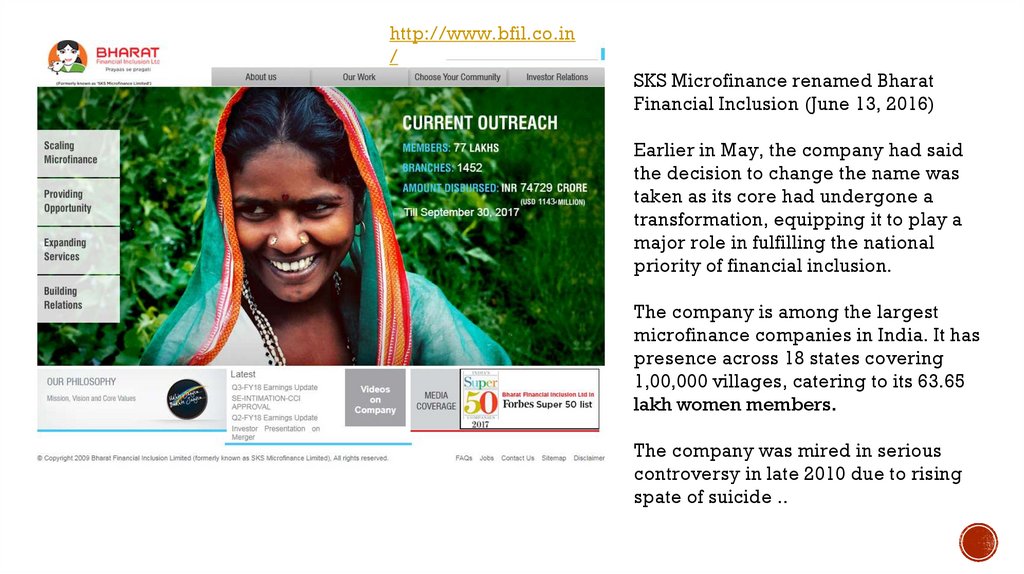
SKS Microfinance renamed Bharat
Financial Inclusion (June 13, 2016)
Earlier in May, the company had said
the decision to change the name was
taken as its core had undergone a
transformation, equipping it to play a
major role in fulfilling the national
priority of financial inclusion.
The company is among the largest
microfinance companies in India. It has
presence across 18 states covering
1,00,000 villages, catering to its 63.65
lakh women members.
The company was mired in serious
controversy in late 2010 due to rising
spate of suicide ..
106.
MICRO FINANCE FIRMS IN INDIA WITHBANKING LICENSE NEED TO BE CAREFUL AS
TO NOT SERVICE THE RICH NOW:
MUHAMMAD
YUNUS
▪ Muhammed Yunus , founder and managing director of Grameen Bank said that the
youth of today aided with technology should make the social impact that the
previous generations could not. Yunus said that unemployment is no longer a
worry of the developing nations as countries like large chunk of youth in Italy and
Greece too are suffering from joblessness.
▪ ET asked him on the sidelines of One Young World what are the challenges faced
in microfinance where one hand you have banking lice .. ET asked him on the
sidelines of One Young World what are the challenges faced in microfinance
where one hand you have banking licenses rolled out and on another, ponzy
scams are preventing many from investing in them. Yunus said that often there are
some who start micro-financing thinking of it as another business where they need
to rake in the profits and then get greedy. He said the Reserve Bank of India
granting licenses to some of the micro-finance institutes was a step in the right
direction, but cautioned that those banks now need to be careful that they should
stop lending the poor and go back serving the rich.
https://economictimes.indiatimes.com/industry/banking/finance/micro-finance-firms-in-india-with-banking-license-need-to-be-careful-as-to-not-service-the-rich-now-muhammadyunus/articleshow/49846358.cms
107.
BENEFITS OF MICROFINANCE▪ The World Bank estimates that more than 500 million people have directly or indirectly
benefited from microfinance-related operations. The International Finance
Corporation (IFC), part of the larger World Bank Group, estimates that more than 130
million people have directly benefited from microfinance-related operations. However,
these operations are only available to approximately 20% of the 3 billion people who
qualify as part of the world’s poor.
▪ In addition to providing microfinancing options, the IFC has assisted developing nations
in the creation or improvement of credit reporting bureaus in 30 nations. It has also
advocated for the addition of relevant laws governing financial activities in 33 countries.
▪ The benefits of microfinance extend beyond the direct effects of giving people a source
for capital. Entrepreneurs who create a successful business create jobs, trade and overall
economic improvement within the community. Empowering women in particular, as
many MFIs do, leads to more stability and prosperity for families.
108.
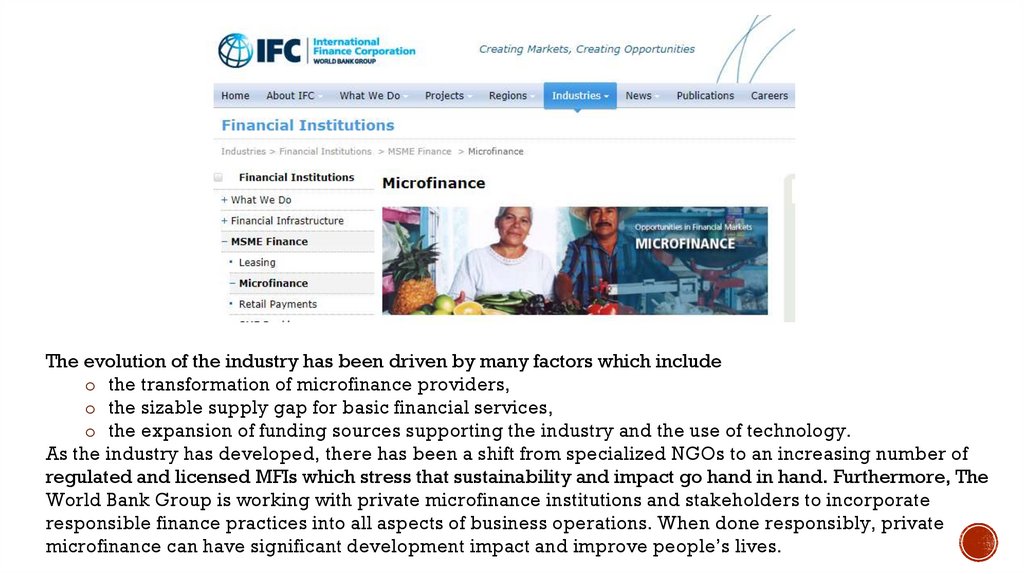
The evolution of the industry has been driven by many factors which includeo the transformation of microfinance providers,
o the sizable supply gap for basic financial services,
o the expansion of funding sources supporting the industry and the use of technology.
As the industry has developed, there has been a shift from specialized NGOs to an increasing number of
regulated and licensed MFIs which stress that sustainability and impact go hand in hand. Furthermore, The
World Bank Group is working with private microfinance institutions and stakeholders to incorporate
responsible finance practices into all aspects of business operations. When done responsibly, private
microfinance can have significant development impact and improve people’s lives.
109.
THE FOR-PROFITMICROFINANCE
CONTROVERSY
▪
While there are countless heartwarming success stories ranging from micro-entrepreneurs
starting their own water supply business in Tanzania to a $1,500 loan allowing a family to open a
barbecue restaurant in China, to immigrants in the U.S. being able to build their own business,
microfinance has sometimes falls under criticism.
▪
While microfinance interest rates are generally lower than conventional banks', critics have
charged that these operations are making money off of the poor – especially since the trend in
for-profit MFIs, such as BancoSol in Bolivia and the above-mentioned SKS (which actually began
as a nonprofit organization (NPO), but became for-profit in 2003).
▪
One of the largest, and most controversial, is Mexico's Compartamos Banco. The bank was
started in 1990 as a nonprofit. However, 10 years later, management decided to transform the
enterprise into a traditional, for-profit company. In 2007, it went public on the Mexican Stock
Exchange, and its initial public offering (IPO) raised more than $400 million. Like most other
microfinance companies, Compartamos Banco makes relatively small loans, serves a largely
female clientele, and pools borrowers into groups. The main difference comes with its use of the
funds it nets in interest and repayments: Like any public company, it distributes them to
shareholders. In contrast, nonprofit institutions take a more philanthropic bent with any profits,
using them to expand the number of people it helps or create more programs.
110.
THE FOR-PROFITMICROFINANCE
CONTROVERSY (2)
▪
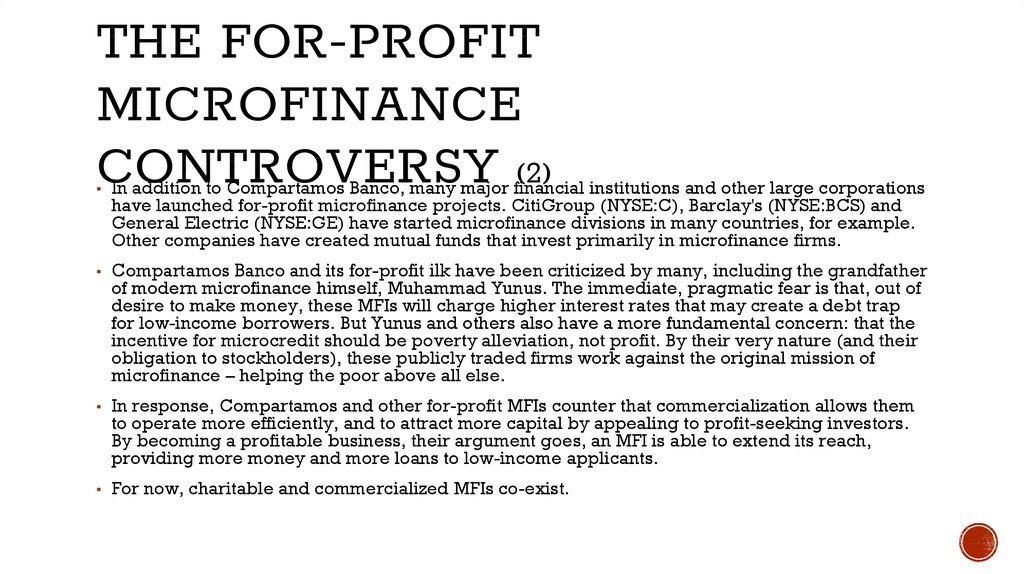
In addition to Compartamos Banco, many major financial institutions and other large corporations
have launched for-profit microfinance projects. CitiGroup (NYSE:C), Barclay's (NYSE:BCS) and
General Electric (NYSE:GE) have started microfinance divisions in many countries, for example.
Other companies have created mutual funds that invest primarily in microfinance firms.
▪
Compartamos Banco and its for-profit ilk have been criticized by many, including the grandfather
of modern microfinance himself, Muhammad Yunus. The immediate, pragmatic fear is that, out of
desire to make money, these MFIs will charge higher interest rates that may create a debt trap
for low-income borrowers. But Yunus and others also have a more fundamental concern: that the
incentive for microcredit should be poverty alleviation, not profit. By their very nature (and their
obligation to stockholders), these publicly traded firms work against the original mission of
microfinance – helping the poor above all else.
▪
In response, Compartamos and other for-profit MFIs counter that commercialization allows them
to operate more efficiently, and to attract more capital by appealing to profit-seeking investors.
By becoming a profitable business, their argument goes, an MFI is able to extend its reach,
providing more money and more loans to low-income applicants.
▪
For now, charitable and commercialized MFIs co-exist.
111.
THE MICROFINANCEDELUSION: WHO REALLY
WINS?
112.
HDI▪
The HDI was created to emphasize that people and their capabilities should be the ultimate
criteria for assessing the development of a country, not economic growth alone. The HDI can also
be used to question national policy choices, asking how two countries with the same level of GNI
per capita can end up with different human development outcomes. These contrasts can stimulate
debate about government policy priorities.
The Human Development Index (HDI) is a summary measure of average achievement in key
dimensions of human development: a long and healthy life, being knowledgeable and have a
decent standard of living. The HDI is the geometric mean of normalized indices for each of the
three dimensions.
▪
The HDI simplifies and captures only part of what human development entails. It does not reflect
on inequalities, poverty, human security, empowerment, etc.
113.
114.
▪ HDI map115.
116.
WORLDECONOMICS:
MIDDLE-INCOME TRAP /
CHINA
Prof. Zharova Liubov
Zharova_l@ua.fm
117.
MIDDLE INCOME TRAP▪ Paul Krugman, “The Myth of Asia’s Miracle”, which re-examined the source of the tigers’
success
▪ Geoffrey Garrett “Globalisation’s Missing Middle” - Middle-income countries have not done nearly
as well under globalised markets as either richer or poorer countries.
▪ Homi Kharas and Indermit Gill of the World Bank nvented the term “middle-income
trap”, which subsequently took on a life of its own
▪ The trap can be interpreted in a variety of ways, which may be one reason why so many
people believe in it.
▪ Some confuse the trap with the simple logic of catch-up growth. According to that logic, poorer
countries can grow faster than richer ones because imitation is easier than innovation and
because capital earns higher returns when it is scarce. By the same logic, a country’s growth will
naturally slow down as the gap with the leading economies narrows and the scope for catch-up
growth diminishes. All else equal, then, middle-income countries should grow more slowly than
poorer ones.
▪ But (!) Mr Garrett was making a bolder argument: that middle-income countries tend to grow
more slowly than both poorer and richer economies.
118.
MIDDLEINCOMETRAP
▪ By far the most prominent trap-watcher is
CHINA, one of the few middle-income
economies that is more than middle-sized.
▪ In 2015 Lou Jiwei, then China’s finance
minister, said that his country had a 50%
chance of falling into the trap in the next five
to ten years.
▪ The same fear haunts Liu He, an influential
economic adviser to Xi Jinping, China’s
president. Mr Liu was one of the driving
forces behind a report entitled “China 2030”,
published in 2012 by his Development
Research Centre (DRC) and the World Bank.
The report featured a chart that has perhaps
done more than any other to spread the idea
of a middle-income trap.
▪ It showed that of 101 countries which counted
as middle-income in 1960, only 13 had
achieved high-income status by 2008. The rest
spent the intervening 50 years trapped in
mediocrity or worse.
119.
▪ It defines “middle-income”broadly, including any country
with a GDP per person that is
more than 5.2% of America’s (at
purchasing-power parity) and
less than 42.75%. That definition
means that a country with a GDP
per person of just $590 (at 1990
prices) counted as middle
income in 1960. And at the other
end of the middle-income scale,
a country with a GDP per
person as high as $13,300 in
2008 would also still belong to
the same category. The second
number is more than 2,000%
higher than the first. No wonder
so many countries remained
stuck in between them.
In principle, it would be possible for an economy’s GDP per person to
grow by over 6% a year for 48 years without escaping it. It is not that
middle-income is unusually treacherous. It is just that the definition is
unusually capacious.
120.
121.
COUNTRIES THAT ARE NEITHERRICH NOR POOR CAN HOLD THEIR
OWN AGAINST RIVALS AT BOTH
EXTREMES
▪
Slow and queasy
▪ it seems to make sense that middle-income countries
will be squeezed between higher-tech and lowerwage rivals on either side. But those rivals rely on high
technology or low wages for a reason.
▪ Rich economies need advanced technologies and
skills to offset high wages.
▪ Poor countries, for their part, need low wages to
offset low levels of technology and skill.
▪ The obvious conclusion is that middle-income
countries can and do compete with both, combining
middling wages with middling levels of skill,
technology and productivity.
122.
MIDDLE-INCOME TRAP▪ Middle-income countries are often more accurately described as mixed-income
economies.
▪ Shaping the mix are at least four possible sources of growth in GDP per person.
1.
moving workers from overmanned fields to more productive factories (structural
transformation).
2.
adding more capital such as machinery per worker (capital-deepening).
3.
augmenting capital or labour by making it more sophisticated, perhaps by adopting
techniques that a firm, industry or country has not previously embraced (technological
diffusion).
4.
the final source of growth derives from advances in technology that introduce something new
to the world at large (technological innovation).
▪ So development does not proceed in discrete stages that require a nationwide leap from
one stage to the next. It is more like a long-distance race, with a leading pack and many
stragglers, in which the result is an average of everyone’s finishing times. The more
stragglers in the race, the more room for improvement.
123.
CHINA GDP ANNUAL GROWTHRATE
124.
HISTORY▪ epresented the success of the First
Five-Year Plan, during which “6000
Soviet advisers helped establish
and operate the 156 large-scale
capital intensive Soviet-assisted
projects”, significantly increasing
the pace and quality (productivity)
of industrialization in the country.
However, it was followed by
the Great Leap Forward (19581962), which undid many of the
gains through worsening of
incentives by banning material
incentives and restricting markets.
125.
HISTORY▪ These reforms were then unwound between 1962 and 1966, leading to another period of productivity and
per capita GDP growth, before the events of the Cultural Revolution (where strikers clashed with the
authorities) set the economy back once again.
▪ the Third Plenary Session of the 11th Central Committee of the Communist Party in December 1978 was the
defining moment in shifting the country from its unsteady early economic trajectory on to a more
sustainable path. It laid the groundwork for future growth by introducing reforms that allowed farmers to
sell their produce in local markets and began the shift from collective farming to the household
responsibility system.
▪ A year later the Law on Chinese Foreign Equity Joint Ventures was introduced, allowing foreign capital to
enter China helping to boost regional economies although it took until the mid-1980s for the government to
gradually ease pricing restrictions and allow companies to retain profits and set up their own wage
structures. This not only helped to boost GDP from an annual average of 6% between 1953-1978 to 9.4%
between 1978-2012 but also increased the pace of urbanization as workers were drawn from the
countryside into higher-paying jobs in cities.
▪ This process of market liberalization led to the establishment of China as a major global exporter. It
eventually allowed for the reopening of the Shanghai stock exchange in December 1990 for the first time in
over 40 years and, ultimately, to China’s accession to the World Trade Organisation
▪ These reforms had a significant impact both on per capita GDP and the pace of the falling share of the
labour force working in agriculture.
126.
127.
HOW CHINA INTERFERES INAUSTRALIA
▪ Few countries on the planet have benefited as clearly from China as Australia has.
Its society has been enriched by waves of Chinese migrants and sojourners for 160
years. Its national income grew as much as 13 percent in a single decade as a
result of China’s resource-intensive construction boom, according to the Australian
Reserve Bank. And an easing of the resources boom has been offset by the
spending power of 180,000 Chinese students and a million tourists each year,
along with hundreds of thousands of migrants who have mostly thrived in their new
country.
128.
ARE CHINA AND BRAZILTRANSFORMING AFRICAN
AGRICULTURE?
▪ Chinese and Brazilian engagements in four African countries – Ethiopia, Ghana,
Mozambique and Zimbabwe – as well as the origins of Chinese and Brazilian
agricultural policies, technology and capital by looking at the two countries’
domestic contexts.
▪
▪
▪
▪
▪
▪
They reveal a rich mix of engagements, including:
agricultural investments by private and state owned enterprises
tri-lateral development cooperation efforts
technological adaptation initiatives
training programmes
‘under-the-radar’ involvement in agriculture by Chinese migrants.
▪ These diverse experiences challenge simplistic narratives of either “South–South”
collaboration or “neo-imperial” expansion of “rising powers”.