


 Менеджмент
Похожие презентации:

")

")

")
")


, TQM, and Hoshin Kanri")
Introduction to Total Quality Management in Organizations & Companies. Lecture 2
1.
Introduction toTotal Quality Management in
Organizations & Companies
Dr. Eleonora Shkolnik
Ariel University
2023
Dr. Eleonora Shkolnik – TQM for MBA
MANAGING FOR QUALITY AND PERFORMANCE EXCELLENCE, 7e, © 2008 Thomson Higher Education Publishing
AU-MBA-TQM-OE-23
Lecture 2
2.
AssignmentDate
#
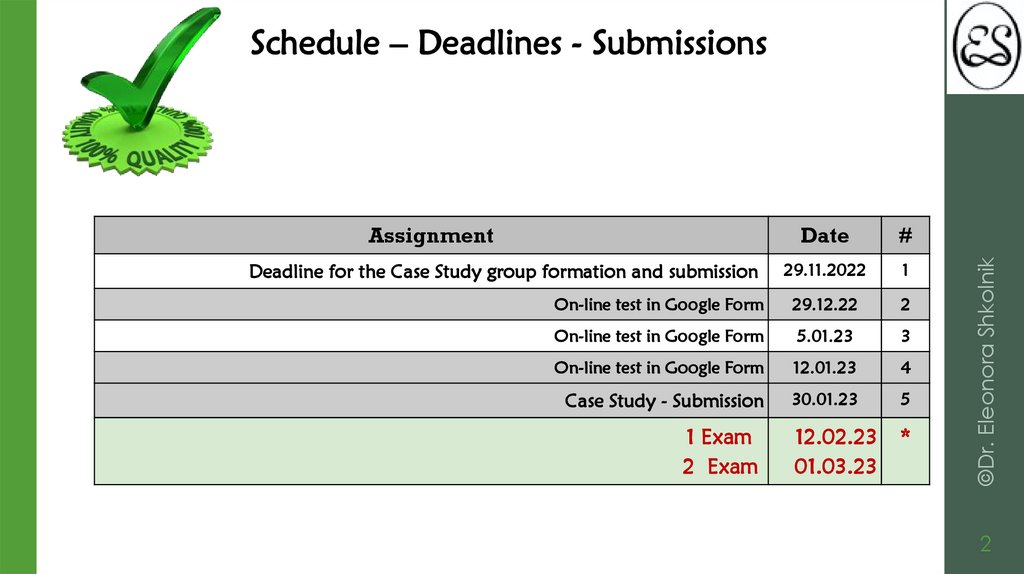
Deadline for the Case Study group formation and submission
29.11.2022
1
On-line test in Google Form
29.12.22
2
On-line test in Google Form
5.01.23
3
On-line test in Google Form
12.01.23
4
Case Study - Submission
30.01.23
5
12.02.23
01.03.23
*
1 Exam
2 Exam
©Dr. Eleonora Shkolnik
Schedule – Deadlines - Submissions
2
3.
Ishikawa DiagramIshikawa Diagram otherwise known as Fishbone diagram is one of
The purpose of this tool is to list down ALL the potential root
causes leading to a problem.
Thus it is one of the important tools used for problem solving
methods like DMAIC, PDCA, and many other projects.
Other than that, Ishikawa diagram is also used in New Product
Development for identifying all the potential features.
It is also called a “Cause and Effect” diagram, because it lists
down all the potential causes for a given effect.
Dr. Eleonora Shkolnik - TQM for MBA
the tools most commonly used by Quality Professionals.
3
4.
Ishikawa DiagramAs the name indicates, this tool was developed by Prof. Karou Ishikawa. He first listed
down all potential design features to be available in a product under different headers.
It is also considered as one of the Seven Tools of Quality.
Fishbone diagram looks like the skeleton of a fish.
1. Men
2. Material
3. Method
4. Machine
5. Measurement
6. Mother Nature
Al the potential causes that might impact the problem are listed under these main
causes. User can branch out sub causes till the level he feels that is relevant to the
problem.
Dr. Eleonora Shkolnik - TQM for MBA
It has six main branches:
4
5.
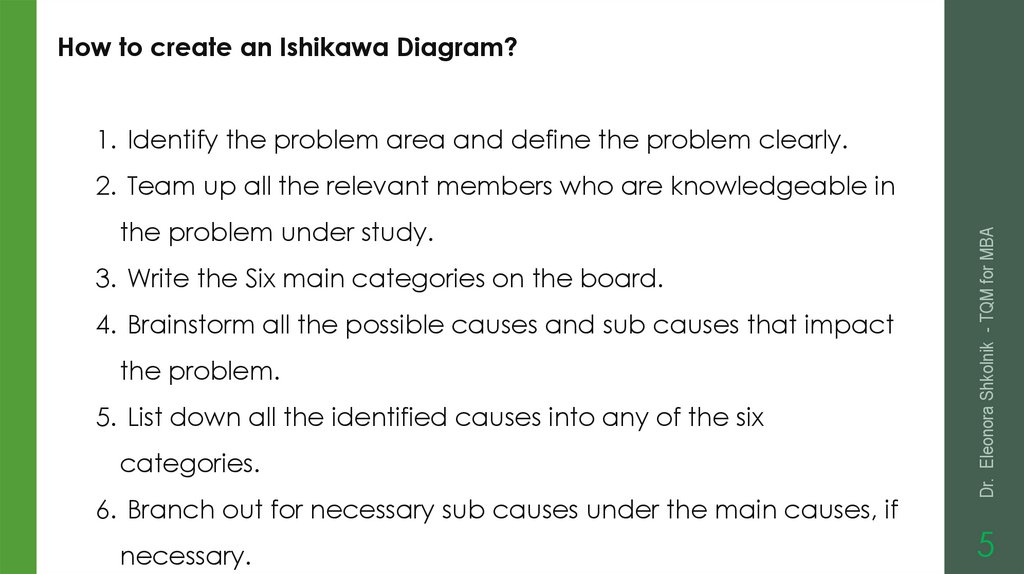
How to create an Ishikawa Diagram?1. Identify the problem area and define the problem clearly.
the problem under study.
3. Write the Six main categories on the board.
4. Brainstorm all the possible causes and sub causes that impact
the problem.
5. List down all the identified causes into any of the six
categories.
6. Branch out for necessary sub causes under the main causes, if
necessary.
Dr. Eleonora Shkolnik - TQM for MBA
2. Team up all the relevant members who are knowledgeable in
5
6.
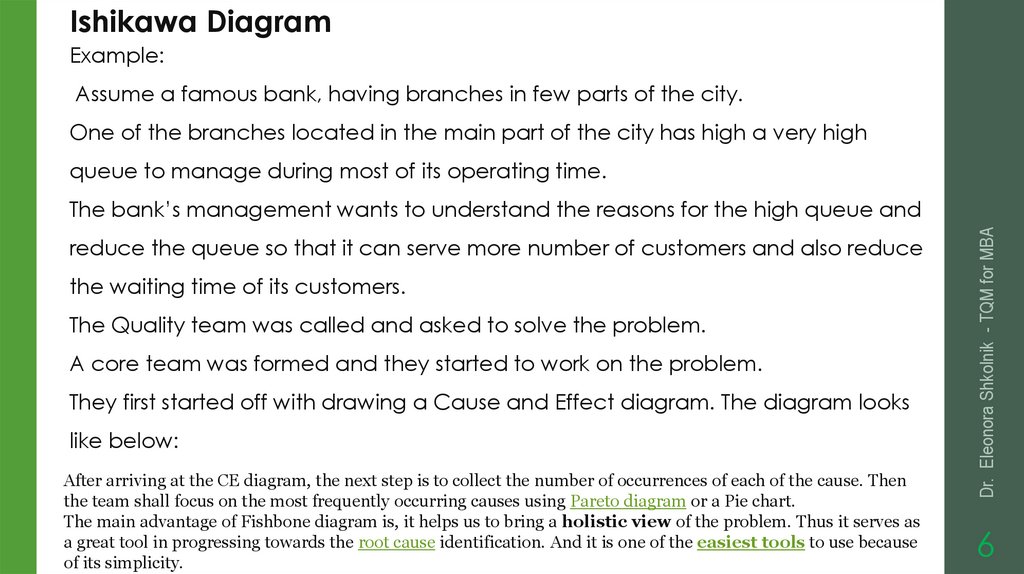
Ishikawa DiagramExample:
Assume a famous bank, having branches in few parts of the city.
One of the branches located in the main part of the city has high a very high
queue to manage during most of its operating time.
reduce the queue so that it can serve more number of customers and also reduce
the waiting time of its customers.
The Quality team was called and asked to solve the problem.
A core team was formed and they started to work on the problem.
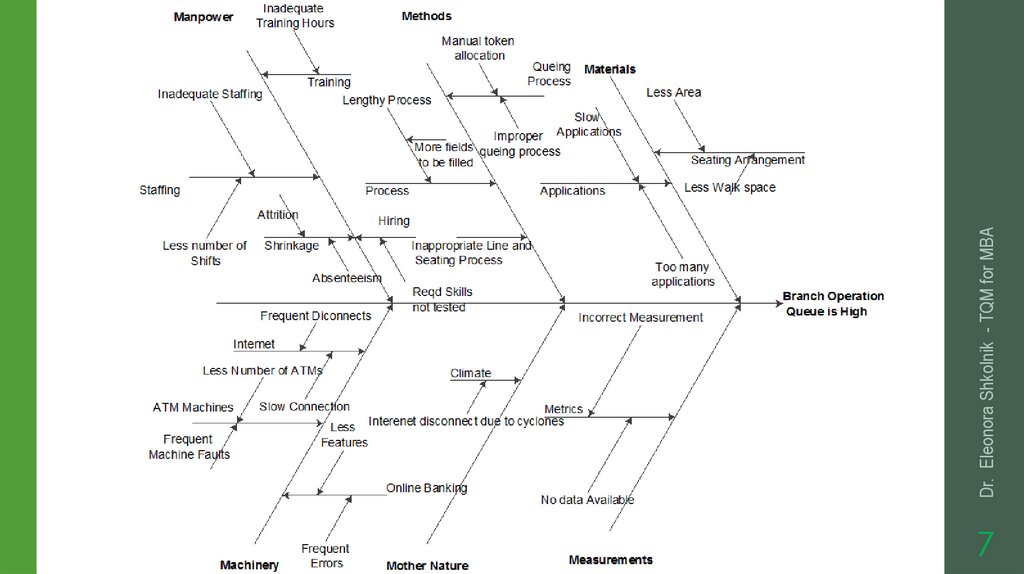
They first started off with drawing a Cause and Effect diagram. The diagram looks
like below:
After arriving at the CE diagram, the next step is to collect the number of occurrences of each of the cause. Then
the team shall focus on the most frequently occurring causes using Pareto diagram or a Pie chart.
The main advantage of Fishbone diagram is, it helps us to bring a holistic view of the problem. Thus it serves as
a great tool in progressing towards the root cause identification. And it is one of the easiest tools to use because
of its simplicity.
Dr. Eleonora Shkolnik - TQM for MBA
The bank’s management wants to understand the reasons for the high queue and
6
7.
7Dr. Eleonora Shkolnik - TQM for MBA
8.
Зачем и как строитьдиаграмму Исикавы
https://lifehacker.ru/postroeni
e-diagrammy-isikavy/
Dr. Eleonora Shkolnik - TQM for MBA
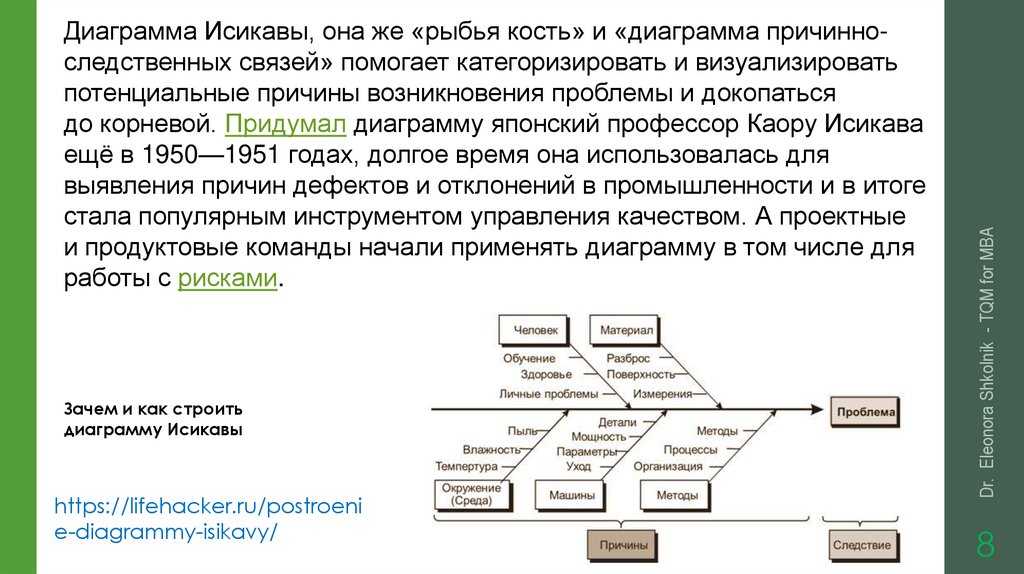
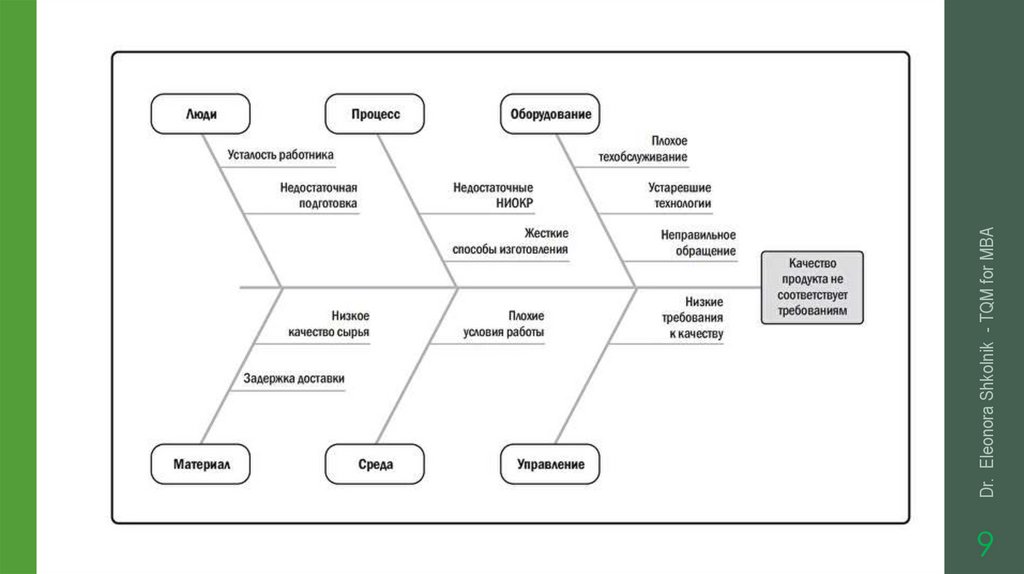
Диаграмма Исикавы, она же «рыбья кость» и «диаграмма причинноследственных связей» помогает категоризировать и визуализировать
потенциальные причины возникновения проблемы и докопаться
до корневой. Придумал диаграмму японский профессор Каору Исикава
ещё в 1950—1951 годах, долгое время она использовалась для
выявления причин дефектов и отклонений в промышленности и в итоге
стала популярным инструментом управления качеством. А проектные
и продуктовые команды начали применять диаграмму в том числе для
работы с рисками.
8
9.
9Dr. Eleonora Shkolnik - TQM for MBA
10.
Dr. Eleonora Shkolnik - TQM for MBAОбласти применения Диаграммы Исикавы
•Для систематического и полного определения причин
возникновения проблемы;
•Для анализа и структурирования процессов на предприятии;
•Если необходимо визуализировать и оценивать соотношения
причинно-следственных связей;
•Для обсуждения проблем в рамках групповой (командной)
работы при "мозговой атаке".
Преимущества метода:
1.помогает группе сосредоточиться на содержании проблемы;
2.хорошая основа для дискуссии по разнообразным причинам
проблемы;
3.позволяет группировать причины в самостоятельные категории;
4.сосредотачивает группу на поиске причин, а не признаков,
5.хорошо применим при групповом обсуждении, создает
результат коллективного знания;
6.является легко осваиваемым и применимым.
10
11.
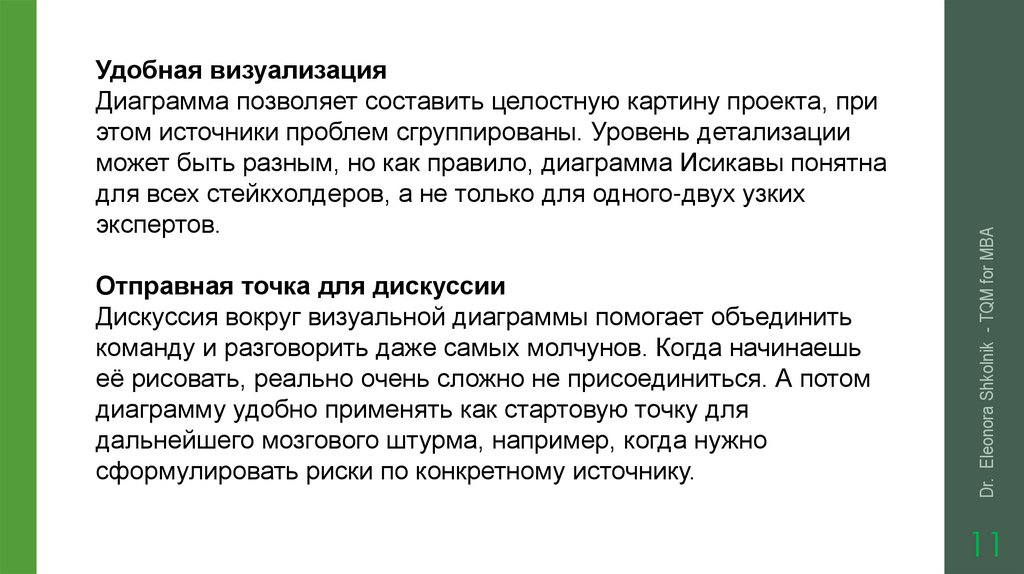
Отправная точка для дискуссииДискуссия вокруг визуальной диаграммы помогает объединить
команду и разговорить даже самых молчунов. Когда начинаешь
её рисовать, реально очень сложно не присоединиться. А потом
диаграмму удобно применять как стартовую точку для
дальнейшего мозгового штурма, например, когда нужно
сформулировать риски по конкретному источнику.
Dr. Eleonora Shkolnik - TQM for MBA
Удобная визуализация
Диаграмма позволяет составить целостную картину проекта, при
этом источники проблем сгруппированы. Уровень детализации
может быть разным, но как правило, диаграмма Исикавы понятна
для всех стейкхолдеров, а не только для одного-двух узких
экспертов.
11
12.
Dr. Eleonora Shkolnik - TQM for MBAНедостатки:
•для анализа комплексных проблем является слишком нечетким
и объемным;
•нельзя представить причинно-следственные связи в соединении
друг с другом;
•нет охвата причин в их взаимодействии и временной
зависимости.
12
13.
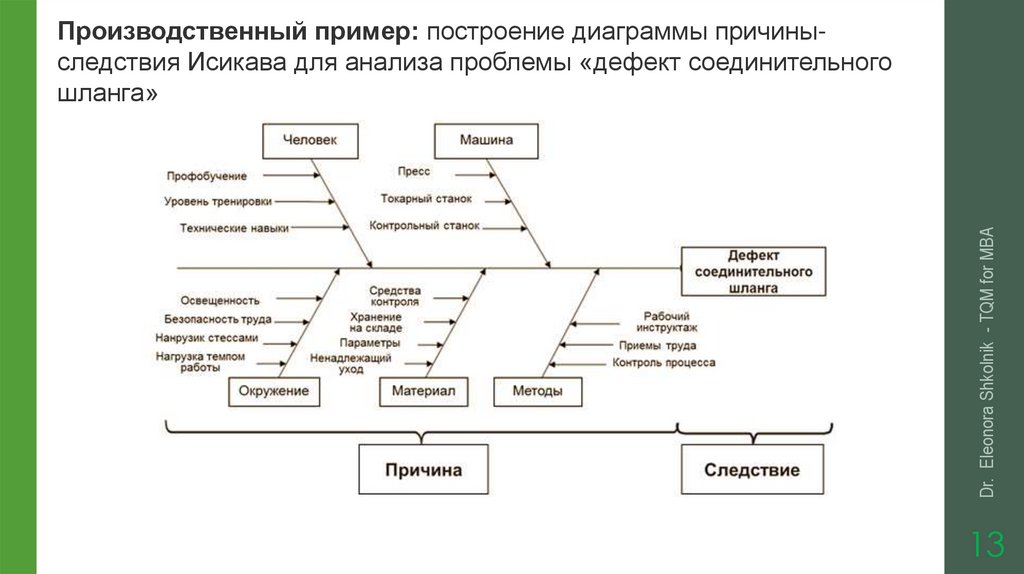
Dr. Eleonora Shkolnik - TQM for MBAПроизводственный пример: построение диаграммы причиныследствия Исикава для анализа проблемы «дефект соединительного
шланга»
13
14.
14Dr. Eleonora Shkolnik - TQM for MBA
15.
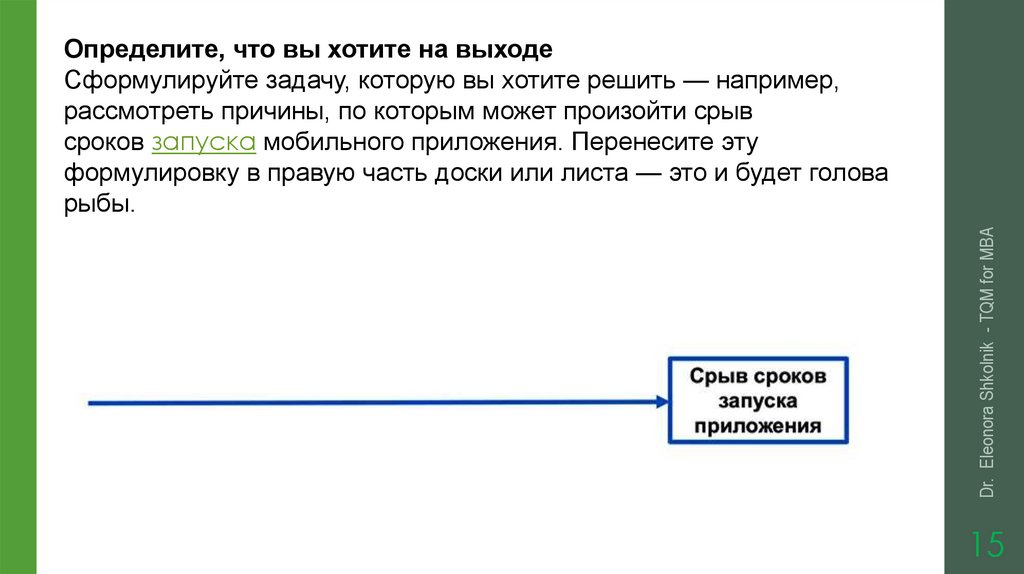
Dr. Eleonora Shkolnik - TQM for MBAОпределите, что вы хотите на выходе
Сформулируйте задачу, которую вы хотите решить — например,
рассмотреть причины, по которым может произойти срыв
сроков запуска мобильного приложения. Перенесите эту
формулировку в правую часть доски или листа — это и будет голова
рыбы.
15
16.
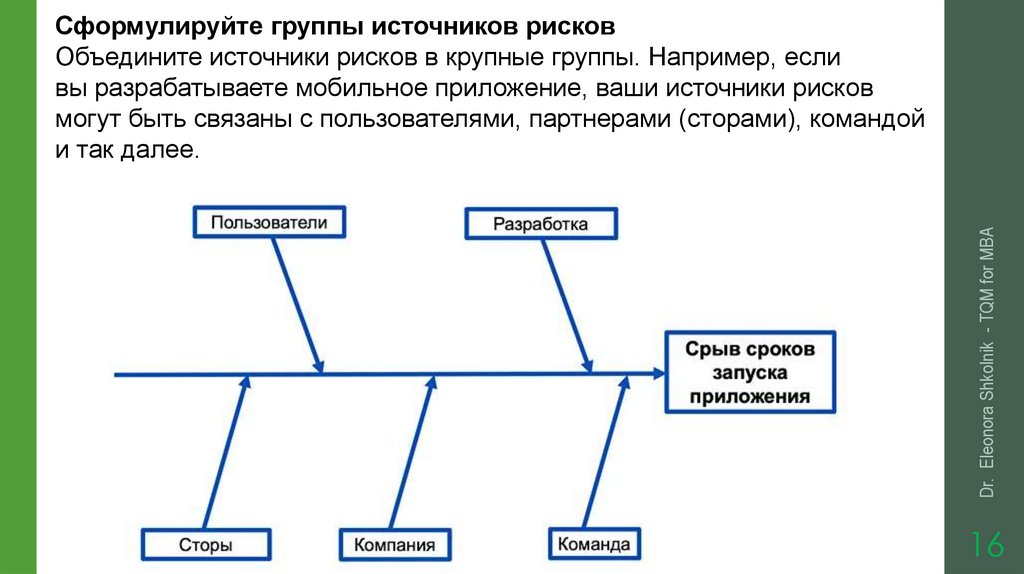
Dr. Eleonora Shkolnik - TQM for MBAСформулируйте группы источников рисков
Объедините источники рисков в крупные группы. Например, если
вы разрабатываете мобильное приложение, ваши источники рисков
могут быть связаны с пользователями, партнерами (сторами), командой
и так далее.
16
17.
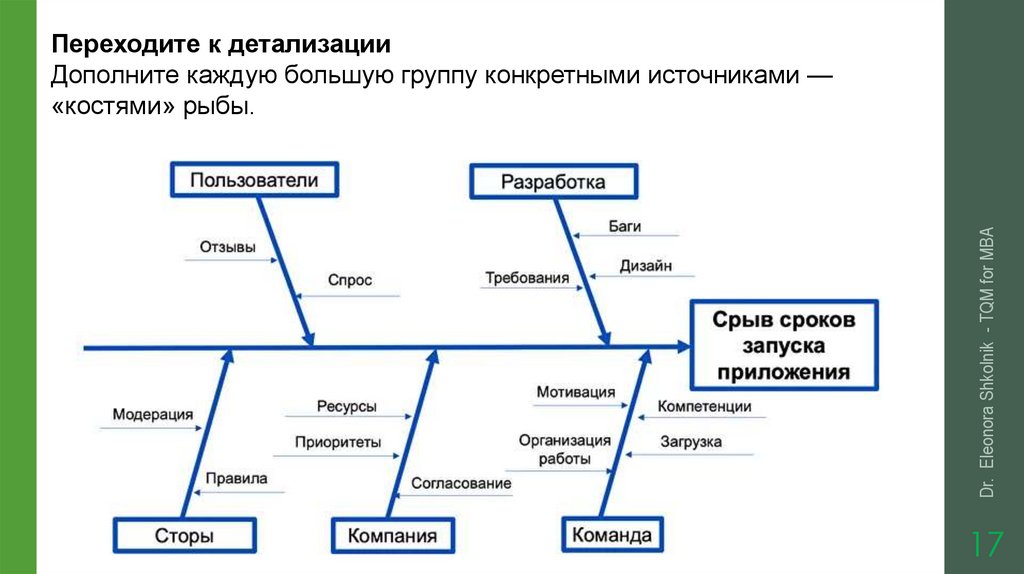
Dr. Eleonora Shkolnik - TQM for MBAПереходите к детализации
Дополните каждую большую группу конкретными источниками —
«костями» рыбы.
17
18.
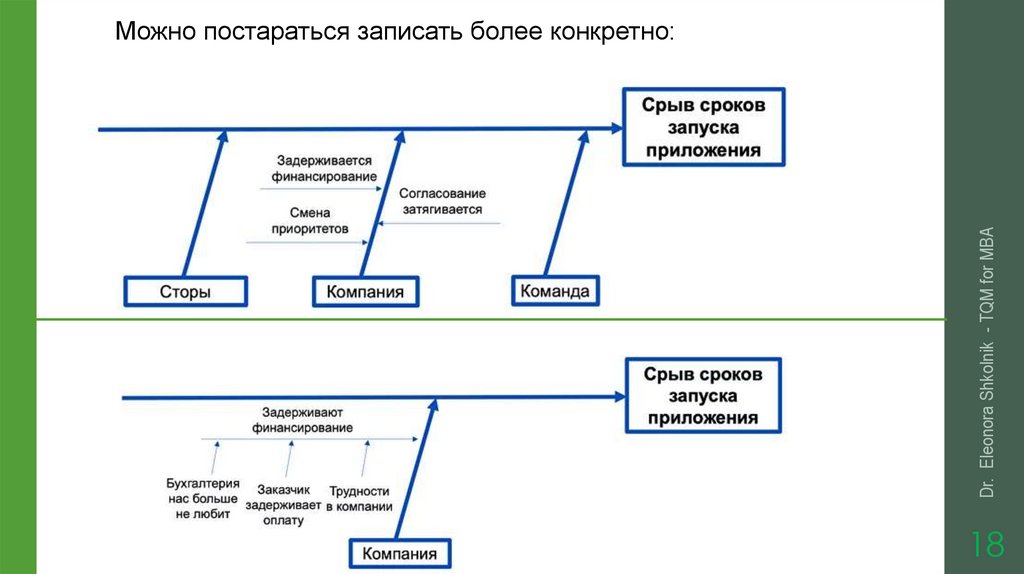
Dr. Eleonora Shkolnik - TQM for MBAМожно постараться записать более конкретно:
18
19.
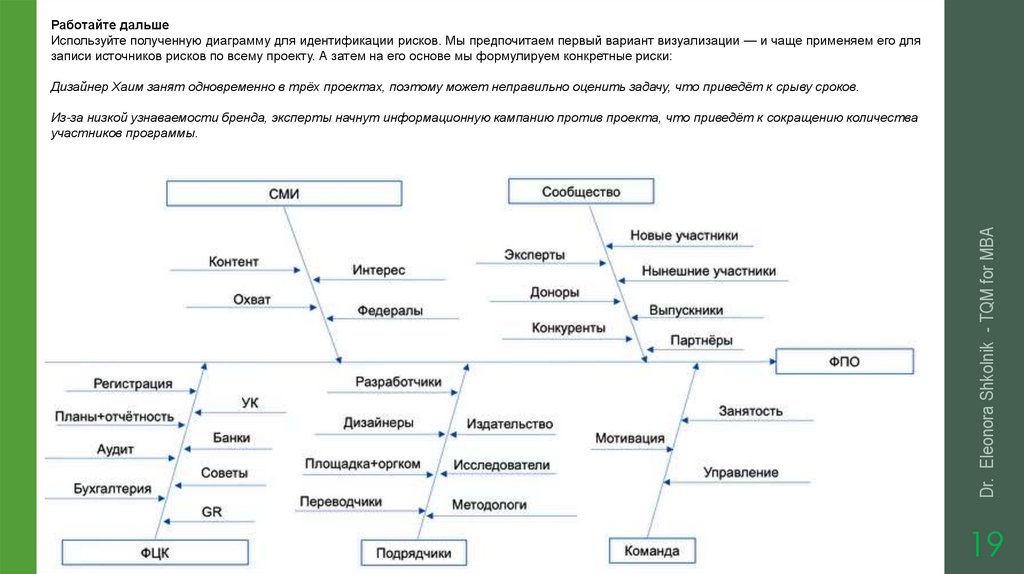
Работайте дальшеИспользуйте полученную диаграмму для идентификации рисков. Мы предпочитаем первый вариант визуализации — и чаще применяем его для
записи источников рисков по всему проекту. А затем на его основе мы формулируем конкретные риски:
Дизайнер Хаим занят одновременно в трёх проектах, поэтому может неправильно оценить задачу, что приведёт к срыву сроков.
Dr. Eleonora Shkolnik - TQM for MBA
Из-за низкой узнаваемости бренда, эксперты начнут информационную кампанию против проекта, что приведёт к сокращению количества
участников программы.
19
20.
מילון מונחים כללי של ניהול האיכותhttp://www.methodacloud.com/content/pages/gloss
ary/H_Gloss.htm#_COBIT
ניהול סיכונים ברפואה
http://www.mrm.org.il/?categoryId=93701
©Dr. Eleonora Shkolnik
American Society of Quality
http://asq.org/learn-about-quality/total-qualitymanagement/overview/implementing-tqm.html
20
21.
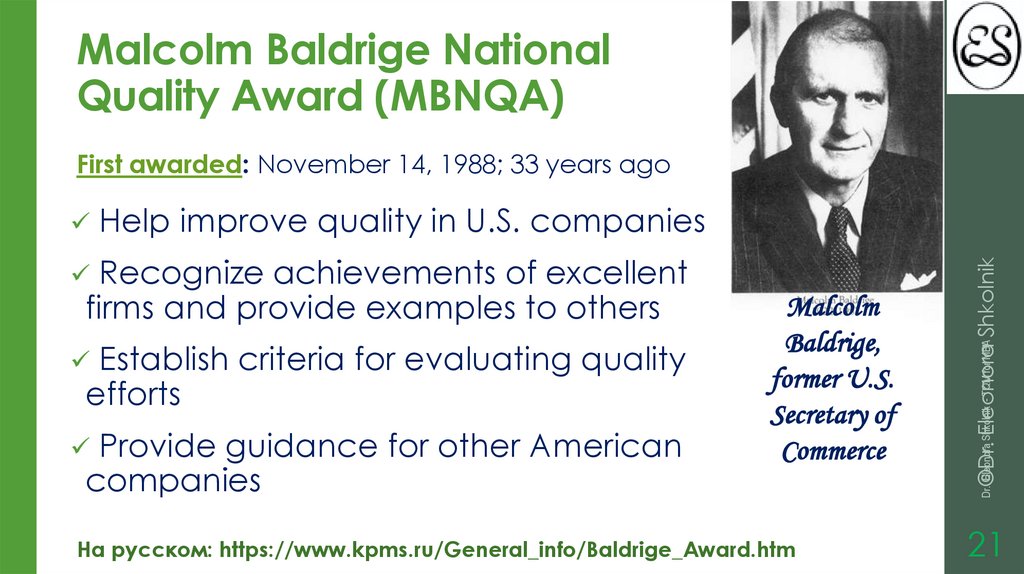
Malcolm Baldrige NationalQuality Award (MBNQA)
First awarded: November 14, 1988; 33 years ago
firms and provide examples to others
Establish criteria for evaluating quality
efforts
Provide guidance for other American
companies
Malcolm
Baldrige,
former U.S.
Secretary of
Commerce
На русском: https://www.kpms.ru/General_info/Baldrige_Award.htm
Dr. Eleonora Shkolnik - TQM for MBA
Recognize achievements of excellent
©Dr. Eleonora Shkolnik
Help improve quality in U.S. companies
21
22.
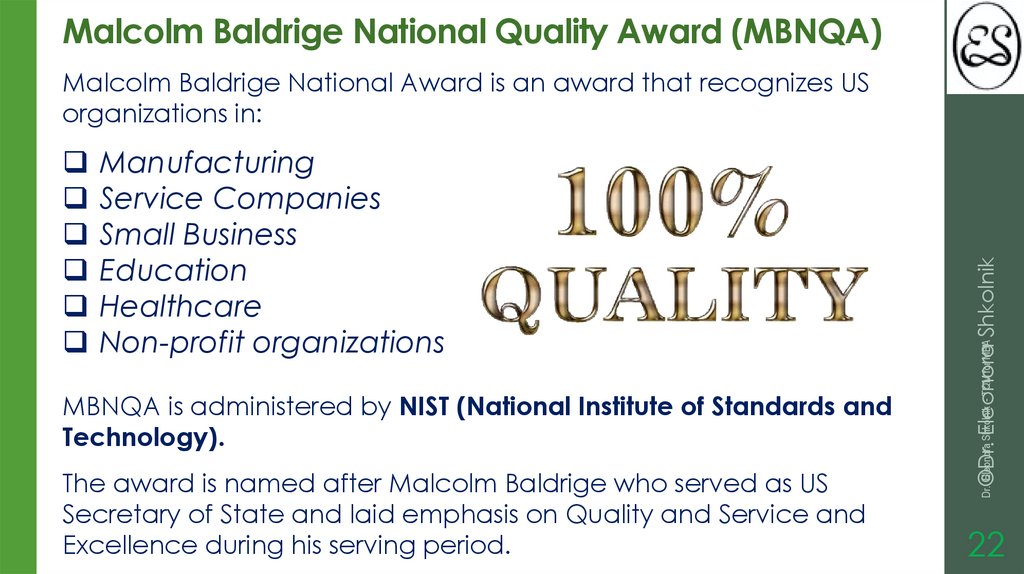
Malcolm Baldrige National Quality Award (MBNQA)MBNQA is administered by NIST (National Institute of Standards and
Technology).
The award is named after Malcolm Baldrige who served as US
Secretary of State and laid emphasis on Quality and Service and
Excellence during his serving period.
Dr. Eleonora Shkolnik - TQM for MBA
Manufacturing
Service Companies
Small Business
Education
Healthcare
Non-profit organizations
©Dr. Eleonora Shkolnik
Malcolm Baldrige National Award is an award that recognizes US
organizations in:
22
23.
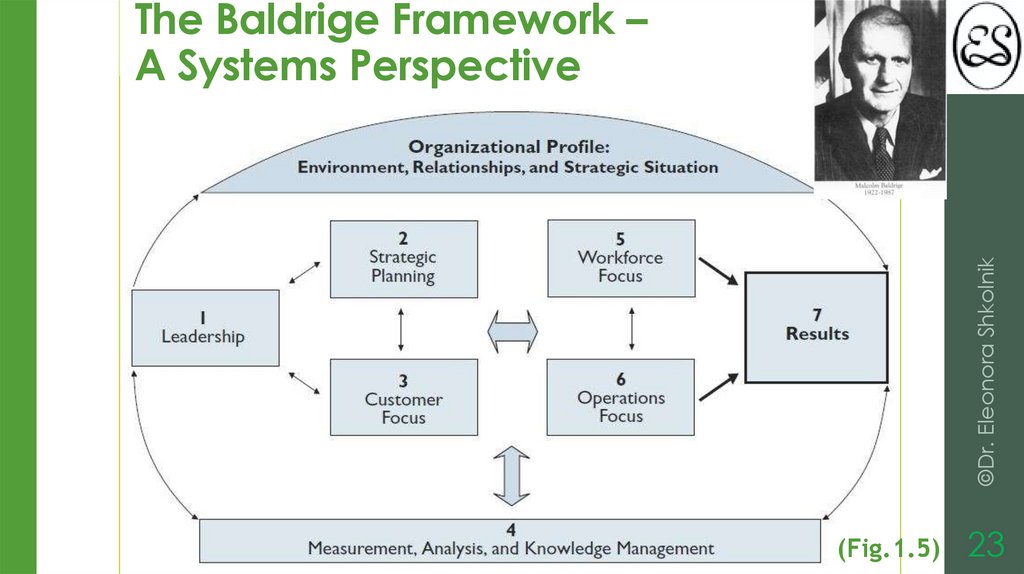
©Dr. Eleonora ShkolnikThe Baldrige Framework –
A Systems Perspective
(Fig.1.5)
23
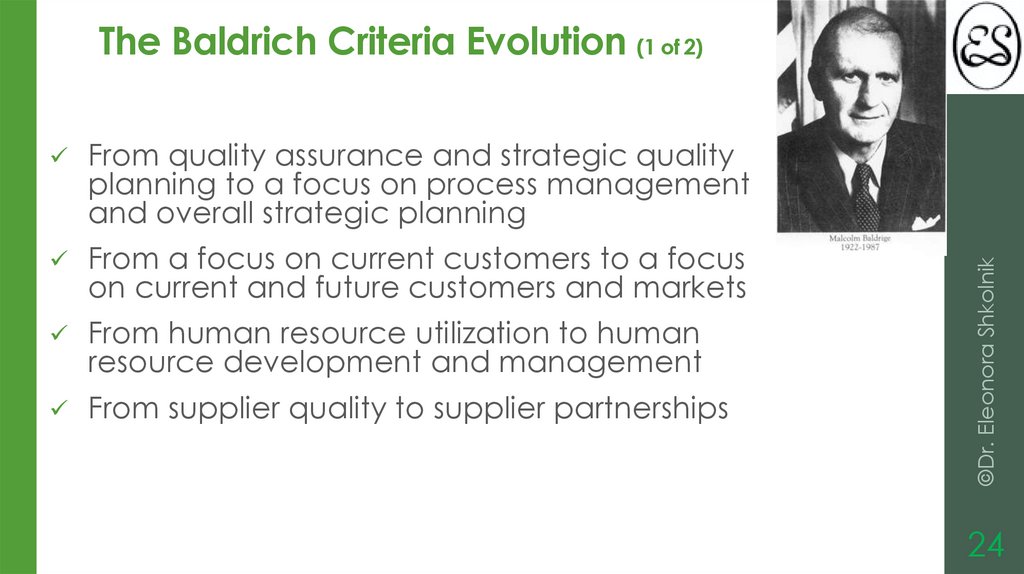
24.
From quality assurance and strategic qualityplanning to a focus on process management
and overall strategic planning
From a focus on current customers to a focus
on current and future customers and markets
From human resource utilization to human
resource development and management
From supplier quality to supplier partnerships
©Dr. Eleonora Shkolnik
The Baldrich Criteria Evolution (1 of 2)
24
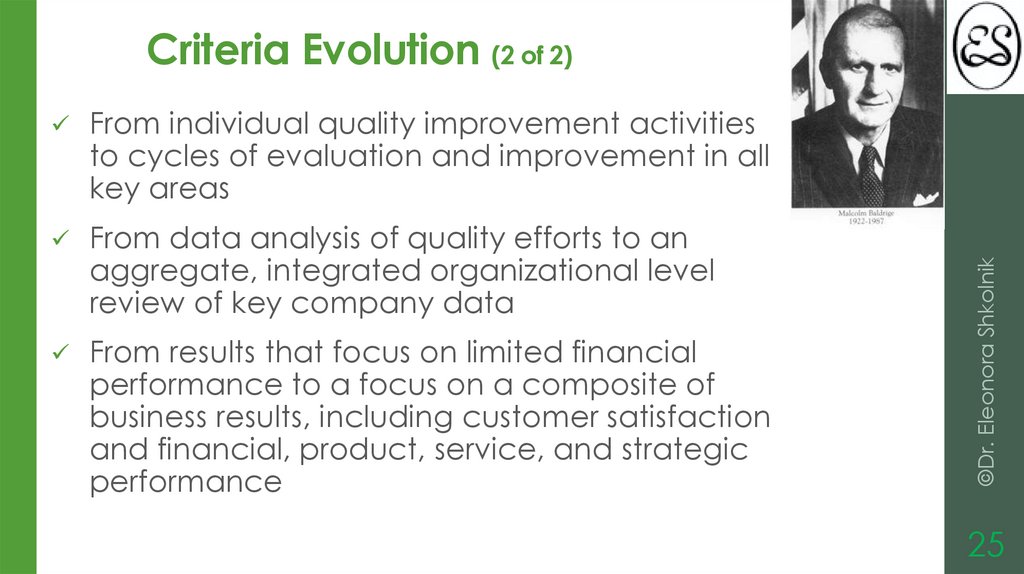
25.
From individual quality improvement activitiesto cycles of evaluation and improvement in all
key areas
From data analysis of quality efforts to an
aggregate, integrated organizational level
review of key company data
From results that focus on limited financial
performance to a focus on a composite of
business results, including customer satisfaction
and financial, product, service, and strategic
performance
©Dr. Eleonora Shkolnik
Criteria Evolution (2 of 2)
25
26.
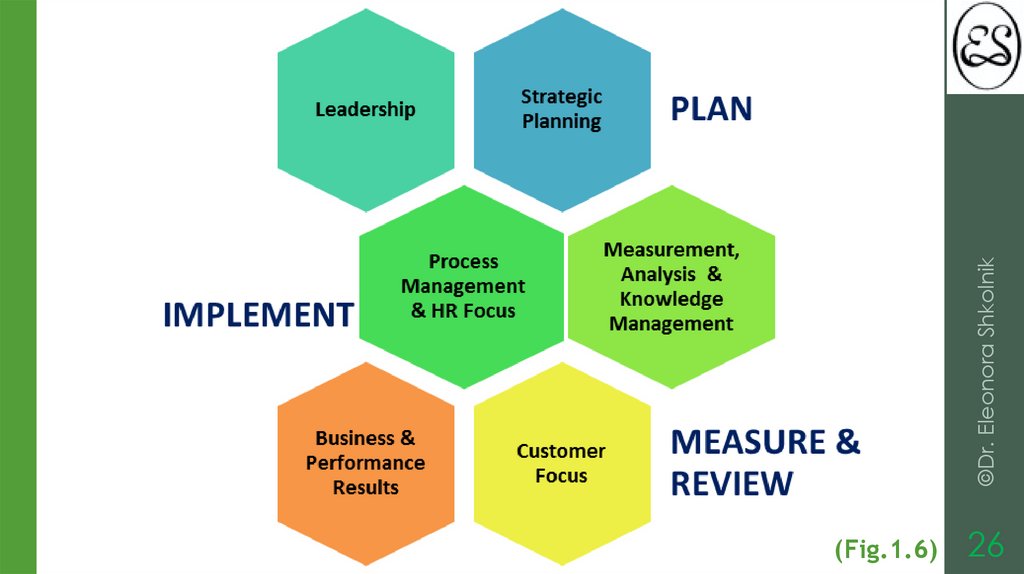
(Fig.1.6)26
©Dr. Eleonora Shkolnik
27.
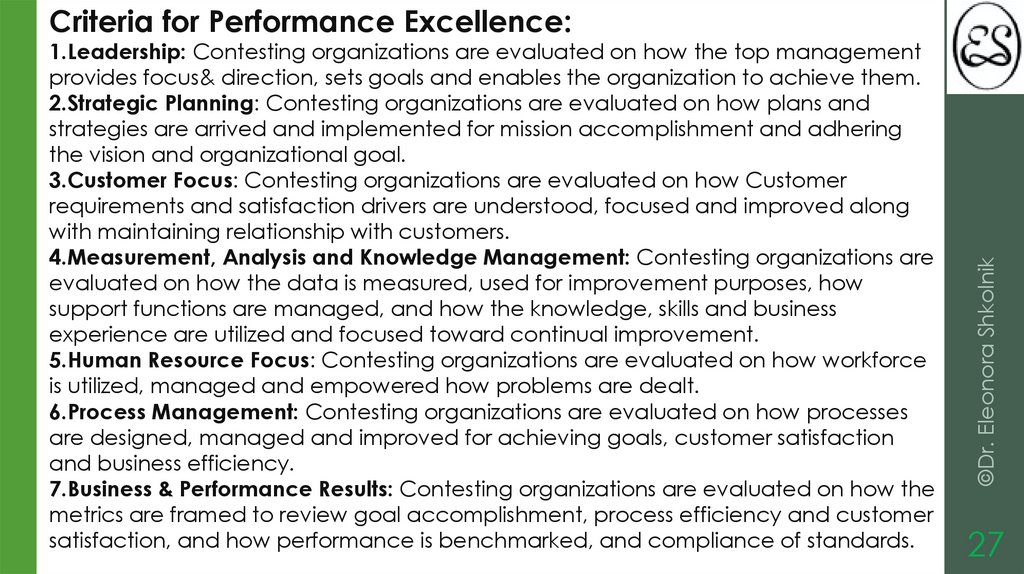
1.Leadership: Contesting organizations are evaluated on how the top managementprovides focus& direction, sets goals and enables the organization to achieve them.
2.Strategic Planning: Contesting organizations are evaluated on how plans and
strategies are arrived and implemented for mission accomplishment and adhering
the vision and organizational goal.
3.Customer Focus: Contesting organizations are evaluated on how Customer
requirements and satisfaction drivers are understood, focused and improved along
with maintaining relationship with customers.
4.Measurement, Analysis and Knowledge Management: Contesting organizations are
evaluated on how the data is measured, used for improvement purposes, how
support functions are managed, and how the knowledge, skills and business
experience are utilized and focused toward continual improvement.
5.Human Resource Focus: Contesting organizations are evaluated on how workforce
is utilized, managed and empowered how problems are dealt.
6.Process Management: Contesting organizations are evaluated on how processes
are designed, managed and improved for achieving goals, customer satisfaction
and business efficiency.
7.Business & Performance Results: Contesting organizations are evaluated on how the
metrics are framed to review goal accomplishment, process efficiency and customer
satisfaction, and how performance is benchmarked, and compliance of standards.
©Dr. Eleonora Shkolnik
Criteria for Performance Excellence:
27
28.
Approaches that organizationsuse to address the Baldrige
criteria requirements need not
be formal or complex and can
easily be implemented by small
businesses.
©Dr. Eleonora Shkolnik
Key Idea
28
29.
A primary goal of the Baldrige program is toencourage many organizations to improve
on their own by equipping them with a
standard template for measuring their
performance and their progress toward
performance excellence.
©Dr. Eleonora Shkolnik
Self Assessment
29
30.
Key Ideaare highly compatible and can each
have a place in the management system
of a successful organization.
©Dr. Eleonora Shkolnik
Although different, Baldrige and Six Sigma
30
31.
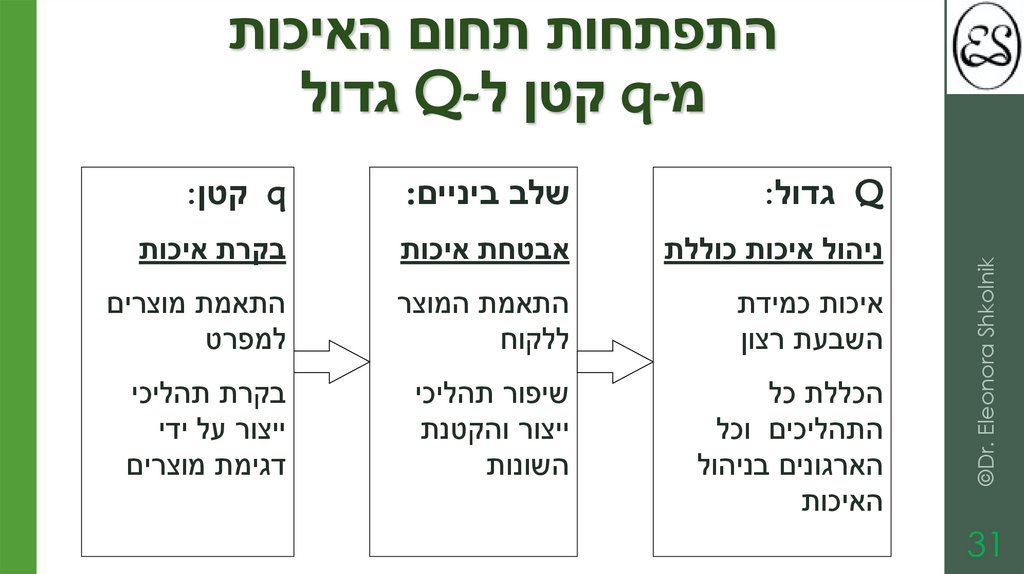
התפתחות תחום האיכותמ q-קטן ל Q-גדול
©Dr. Eleonora Shkolnik
31
Qגדול:
שלב ביניים:
qקטן:
ניהול איכות כוללת
אבטחת איכות
בקרת איכות
איכות כמידת
השבעת רצון
התאמת המוצר
ללקוח
התאמת מוצרים
למפרט
הכללת כל
התהליכים וכל
הארגונים בניהול
האיכות
שיפור תהליכי
ייצור והקטנת
השונות
בקרת תהליכי
ייצור על ידי
דגימת מוצרים
32.
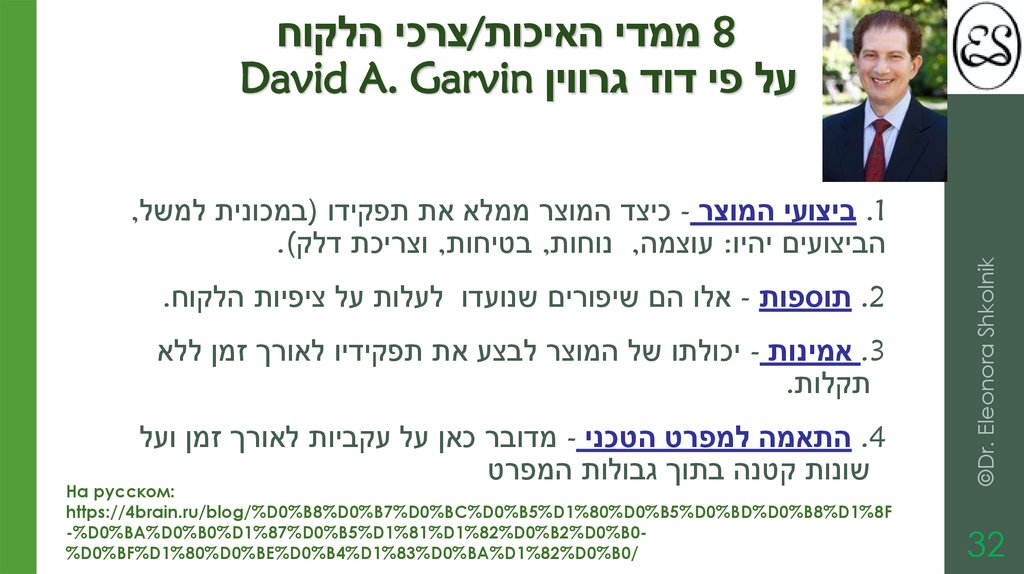
8ממדי האיכות/צרכי הלקוחעל פי דוד גרווין David A. Garvin
©Dr. Eleonora Shkolnik
32
.1ביצועי המוצר -כיצד המוצר ממלא את תפקידו (במכונית למשל,
הביצועים יהיו :עוצמה ,נוחות ,בטיחות ,וצריכת דלק).
.2תוספות -אלו הם שיפורים שנועדו לעלות על ציפיות הלקוח.
.3אמינות -יכולתו של המוצר לבצע את תפקידיו לאורך זמן ללא
תקלות.
.4התאמה למפרט הטכני -מדובר כאן על עקביות לאורך זמן ועל
שונות קטנה בתוך גבולות המפרט
На русском:
https://4brain.ru/blog/%D0%B8%D0%B7%D0%BC%D0%B5%D1%80%D0%B5%D0%BD%D0%B8%D1%8F
-%D0%BA%D0%B0%D1%87%D0%B5%D1%81%D1%82%D0%B2%D0%B0%D0%BF%D1%80%D0%BE%D0%B4%D1%83%D0%BA%D1%82%D0%B0/
33.
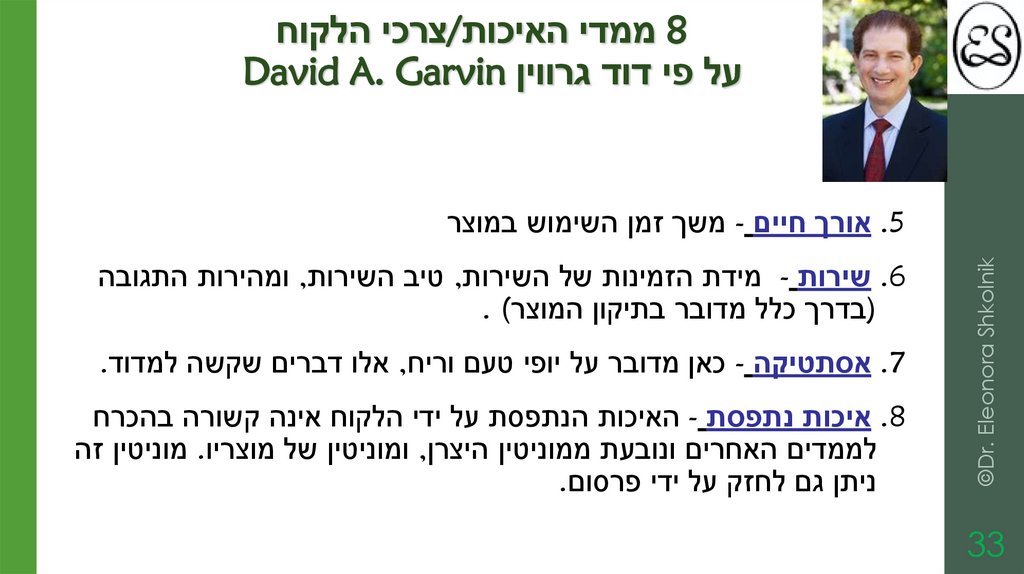
8ממדי האיכות/צרכי הלקוחעל פי דוד גרווין David A. Garvin
.5אורך חיים -משך זמן השימוש במוצר
©Dr. Eleonora Shkolnik
33
.6שירות -מידת הזמינות של השירות ,טיב השירות ,ומהירות התגובה
(בדרך כלל מדובר בתיקון המוצר) .
.7אסתטיקה -כאן מדובר על יופי טעם וריח ,אלו דברים שקשה למדוד.
.8איכות נתפסת -האיכות הנתפסת על ידי הלקוח אינה קשורה בהכרח
לממדים האחרים ונובעת ממוניטין היצרן ,ומוניטין של מוצריו .מוניטין זה
ניתן גם לחזק על ידי פרסום.
34.
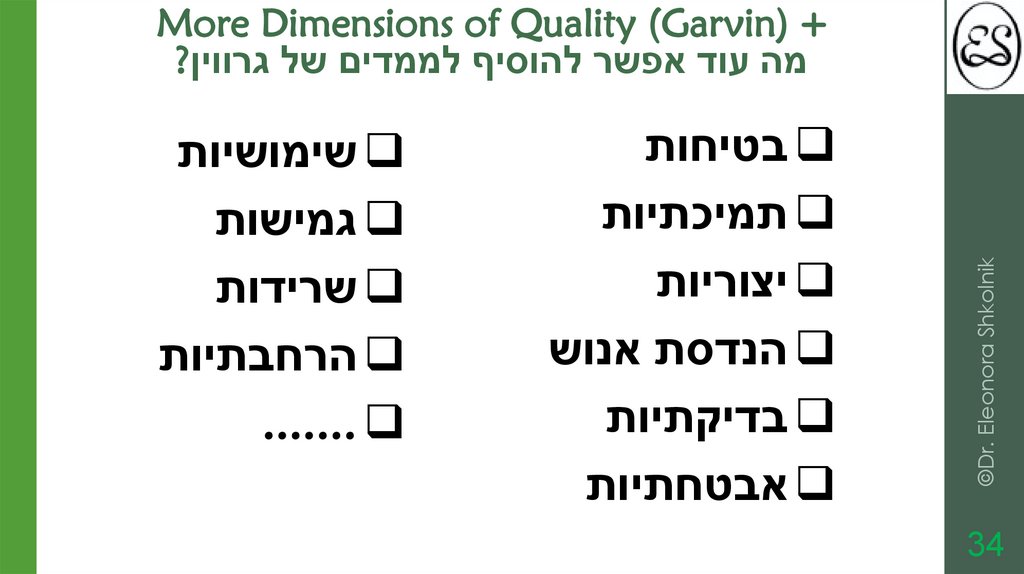
More Dimensions of Quality (Garvin) +מה עוד אפשר להוסיף לממדים של גרווין?
©Dr. Eleonora Shkolnik
34
בטיחות
תמיכתיות
יצוריות
הנדסת אנוש
בדיקתיות
אבטחתיות
שימושיות
גמישות
שרידות
הרחבתיות
.......
35.
Quality system standards adopted byInternational Organization for Standardization
in 1987; revised in 1994, 2000 and 9001:2015
toward 2021…
Used as rules, guidelines, or definitions of
characteristics to ensure that materials,
products, processes, and services are fit for
their purpose
©Dr. Eleonora Shkolnik
ISO 9000 etc.
35
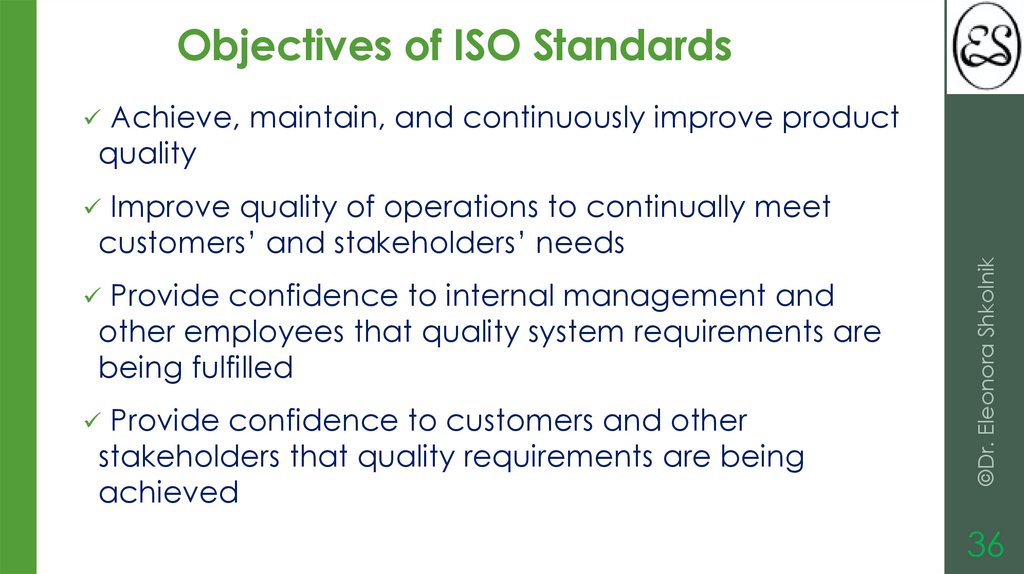
36.
Objectives of ISO StandardsAchieve, maintain, and continuously improve product
quality
customers’ and stakeholders’ needs
Provide confidence to internal management and
other employees that quality system requirements are
being fulfilled
Provide confidence to customers and other
stakeholders that quality requirements are being
achieved
©Dr. Eleonora Shkolnik
Improve quality of operations to continually meet
36
37.
ISO 9000 provides a set of good basicpractices for initiating a quality system
and is an excellent starting point for
companies with no formal Quality
Assurance (QA) program.
©Dr. Eleonora Shkolnik
Key Idea
37
38.
Main Idea©Dr. Eleonora Shkolnik
Document what you do & then
do as you documented!
38
39.
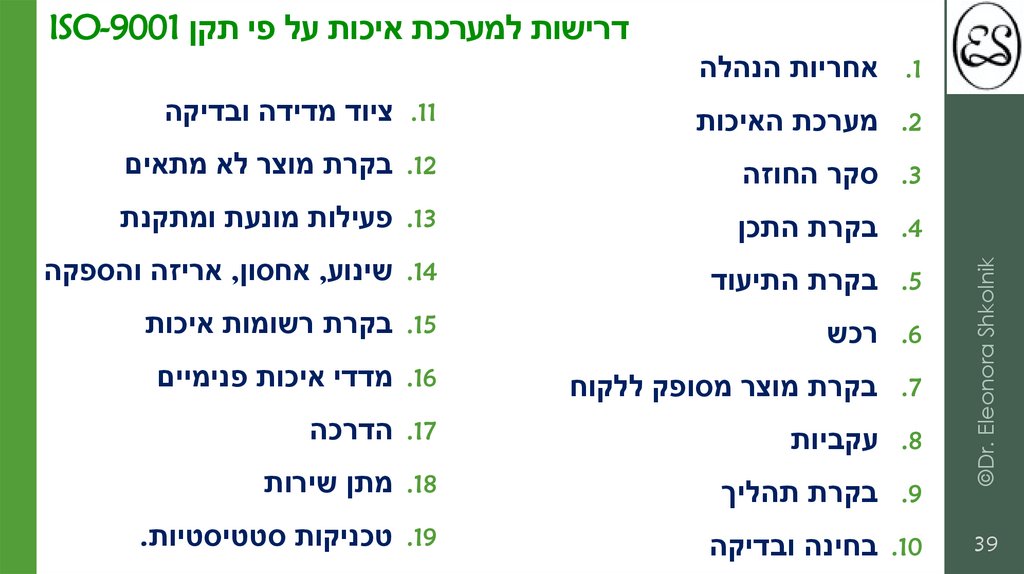
דרישות למערכת איכות על פי תקן ISO-9001 .1אחריות הנהלה
©Dr. Eleonora Shkolnik
39
.2מערכת האיכות
.11ציוד מדידה ובדיקה
.3סקר החוזה
.12בקרת מוצר לא מתאים
.4בקרת התכן
.13פעילות מונעת ומתקנת
.5בקרת התיעוד
.14שינוע ,אחסון ,אריזה והספקה
.6רכש
.15בקרת רשומות איכות
.7בקרת מוצר מסופק ללקוח
.16מדדי איכות פנימיים
.8עקביות
.17הדרכה
.9בקרת תהליך
.18מתן שירות
.10בחינה ובדיקה
.19טכניקות סטטיסטיות.
40.
As consumer expectations have risen, afocus on quality has permeated other key
sectors of the economy, most notably:
Health Care
Education
Not-for-profits
Government
©Dr. Eleonora Shkolnik
Key Idea
40
41.
Systems ThinkingA system is a set of functions or activities within an organization
Subsystems of an organization are linked together as internal
customers and suppliers.
A systems perspective acknowledges the importance of the
interactions of subsystems, not the actions of them individually.
Successful management relies on a systems perspective, one of
the most important elements of total quality.
©Dr. Eleonora Shkolnik
that work together for the aim of the organization.
41
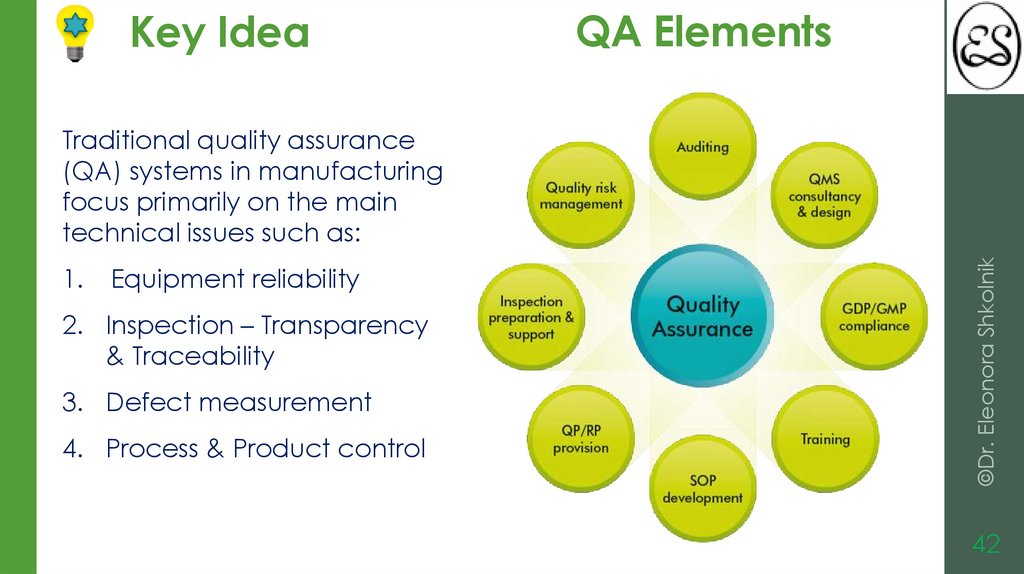
42.
Key IdeaQA Elements
1.
Equipment reliability
2. Inspection – Transparency
& Traceability
3. Defect measurement
4. Process & Product control
©Dr. Eleonora Shkolnik
Traditional quality assurance
(QA) systems in manufacturing
focus primarily on the main
technical issues such as:
42
43.
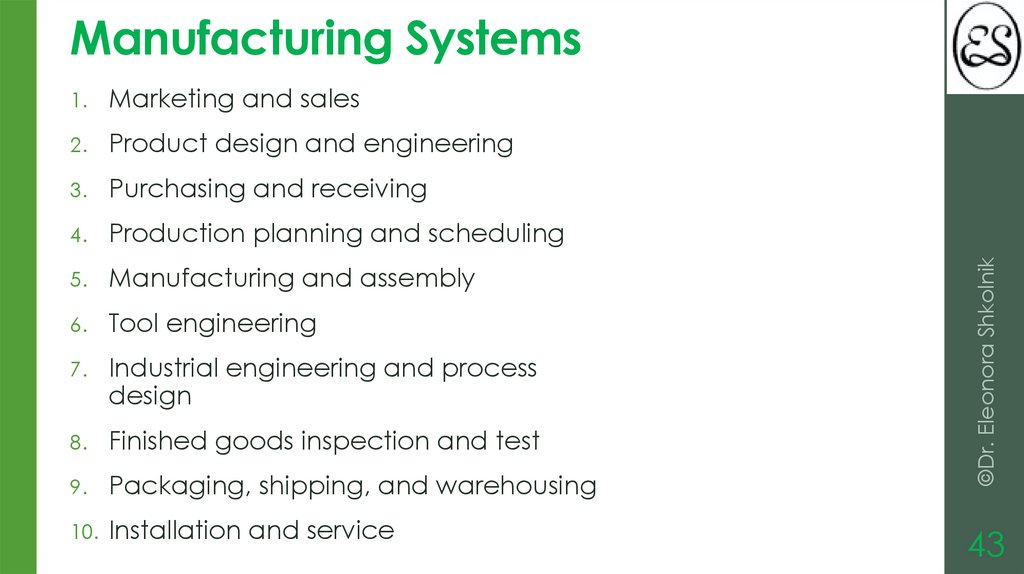
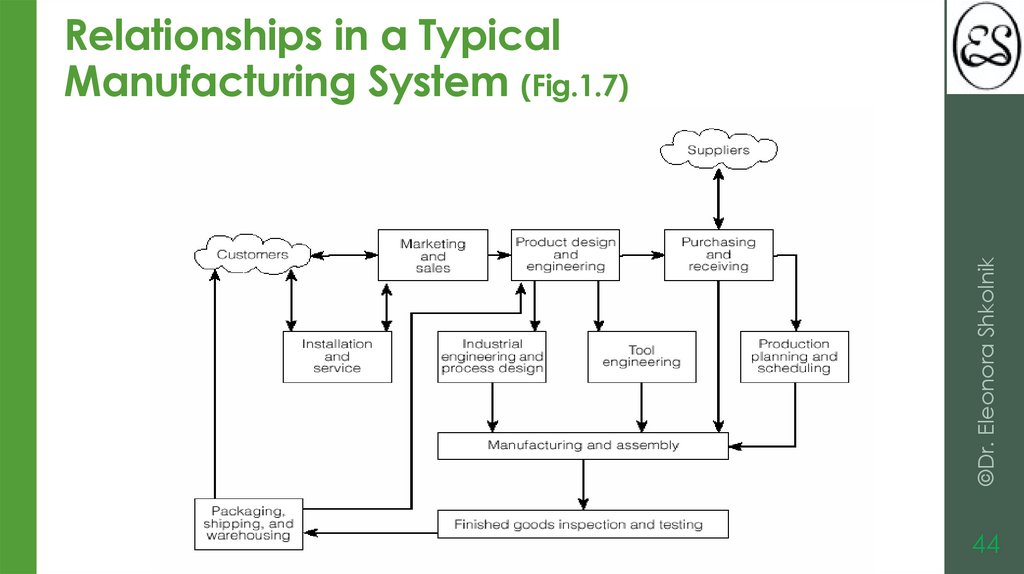
1.Marketing and sales
2.
Product design and engineering
3.
Purchasing and receiving
4.
Production planning and scheduling
5.
Manufacturing and assembly
6.
Tool engineering
7.
Industrial engineering and process
design
8.
Finished goods inspection and test
9.
Packaging, shipping, and warehousing
10. Installation and service
©Dr. Eleonora Shkolnik
Manufacturing Systems
43
44.
©Dr. Eleonora ShkolnikRelationships in a Typical
Manufacturing System (Fig.1.7)
44
45.
1. Quality in MarketingMarketing and sales personnel are responsible for
determining the needs and expectations of consumers.
Product design and engineering functions develop
technical specifications for products and production
processes to meet the requirements determined by the
marketing function.
3. Quality in Purchasing
A purchasing agent should not simply be responsible for
low-cost procurement but should maintain a clear focus on
the quality of purchased goods and materials.
©Dr. Eleonora Shkolnik
2. Quality in Product Design
45
46.
4. Quality in Total Engineering: Production Planning &Scheduling
Poor quality often results from time pressures caused by
insufficient planning and scheduling
Both technology and people are essential to high-quality
manufacturing.
6. Quality in Process Design
Manufacturing processes must be capable of producing
output that meets specifications consistently.
©Dr. Eleonora Shkolnik
5. Quality in Manufacturing and Assembly
46
47.
7. Quality in Finished Goods Inspection and Testing8. Quality in Business Support Functions (BSF) for
Manufacturing
Finance and Accounting - FA
Quality Assurance - QA
Legal Services - LS
BSF = FA + QA + LS
©Dr. Eleonora Shkolnik
The purposes of final product inspection are to judge the
quality of manufacturing, to discover and help to resolve
production problems that may arise, and to ensure that no
defective items reach the customer.
47
48.
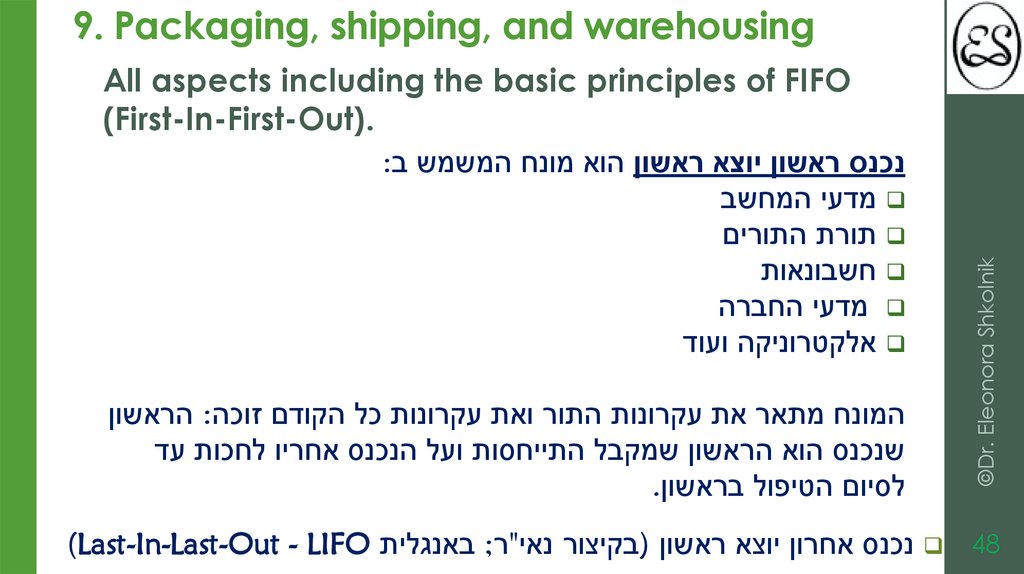
9. Packaging, shipping, and warehousingAll aspects including the basic principles of FIFO
(First-In-First-Out).
©Dr. Eleonora Shkolnik
נכנס ראשון יוצא ראשון הוא מונח המשמש ב:
מדעי המחשב
תורת התורים
חשבונאות
מדעי החברה
אלקטרוניקה ועוד
המונח מתאר את עקרונות התור ואת עקרונות כל הקודם זוכה :הראשון
שנכנס הוא הראשון שמקבל התייחסות ועל הנכנס אחריו לחכות עד
לסיום הטיפול בראשון.
48נכנס אחרון יוצא ראשון (בקיצור נאי"ר; באנגלית )Last-In-Last-Out - LIFO
49.
10. Quality in Installation and ServiceService is defined as “any primary or complementary activity
that does not directly produce a physical product – that is, the
non-goods part of the transaction between buyer (customer)
and seller (provider).”
Key Idea
Every manager is responsible for studying and improving
the quality of the process for which he or she is
responsible.
Every Manager is a Quality Manager!
©Dr. Eleonora Shkolnik
Service after the sale is one of the most important factors in
establishing customer perception of quality and customer loyalty.
49
50.
The American Management Association (AMA)estimates that the average company loses as many
as 35 % of its customers each year, and that about
two-thirds of these are lost because of poor
customer service.
©Dr. Eleonora Shkolnik
Key Idea
50
51.
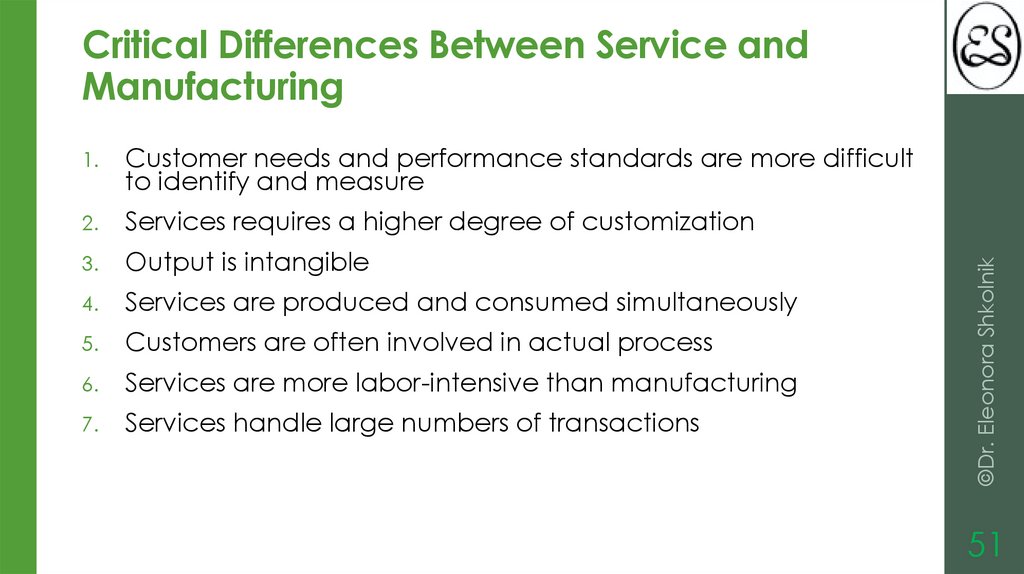
1.Customer needs and performance standards are more difficult
to identify and measure
2.
Services requires a higher degree of customization
3.
Output is intangible
4.
Services are produced and consumed simultaneously
5.
Customers are often involved in actual process
6.
Services are more labor-intensive than manufacturing
7.
Services handle large numbers of transactions
©Dr. Eleonora Shkolnik
Critical Differences Between Service and
Manufacturing
51
52.
These differences make it difficult for many serviceorganizations to apply total quality principles and
foster misguided perceptions that quality
management cannot be effectively accomplished in
services.
Main Components of Service System Quality – SSQ:
Employees
Information Technology – IT
Reporting and Documentation System
©Dr. Eleonora Shkolnik
Key Idea
52
53.
Researchers have repeatedly demonstrated that whenservice employee job satisfaction is high, customer
satisfaction is high, and that when job satisfaction is low,
customer satisfaction is low.
Key Idea
Information technology IT is essential for quality in modern
service organizations because of the high volumes of
information they must process and because customers
demand service at ever-increasing speeds.
©Dr. Eleonora Shkolnik
Key Idea
53
54.
Quality in Health CareJoint Commission on Accreditation of Healthcare
Organizations (JCAHO)
Institute for Healthcare Improvement (IHI)
1999 expansion of the Baldrige Award to nonprofit
Health Care Organizations (HCO)
FDA Regulations
©Dr. Eleonora Shkolnik
National Committee for Quality Assurance (NCQA)
54
55.
Quality Issues in Health CareAvoidable errors
Underutilization of services
Variation in services
Key Idea
Although the National HealthCare System as a whole,
may need a sweeping overhaul, many individual
providers have turned toward quality as a means of
achieving better performance and customer
satisfaction.
©Dr. Eleonora Shkolnik
Overuse of services
55
56.
Quality in Educationcommunity
Committed leadership
System for continuous improvement
Environment that celebrates success
©Dr. Eleonora Shkolnik
Active involvement of whole school
56
57.
Quality in Higher Educationimprovement efforts in higher education by transferring
knowledge and expertise on quality processes and
implementation practices.
©Dr. Eleonora Shkolnik
Business plays an important role in fostering quality
57
58.
AQIP criteria focuses on institutional practices for helpingstudents learn, accomplishing other distinct objectives,
understanding student and stakeholder needs, valuing
people, leading and communicating, supporting
institutional operations, measuring effectiveness, planning
continuous improvement, and building collaborative
relationships—all of which are key elements of TQM.
©Dr. Eleonora Shkolnik
Academic Quality Improvement Project
(AQIP)
58
59.
Quality in Small Business and Not-for-ProfitsSlow to adopt quality approaches
quality
Focus on sales and market growth, cash flow, and
routine fire fighting
Lack of resources for formal quality systems
©Dr. Eleonora Shkolnik
General lack of understanding and knowledge about
59
60.
Key IdeaPerhaps the most important factor in successful quality
CEO or president that a quality focus can be
beneficial and lead to achieving organizational goals.
©Dr. Eleonora Shkolnik
initiatives in small businesses is the recognition by the
60
61.
Quality in the Public SectorQuality in the Federal Government
Federal Quality Institute
President’s Quality Award
State and Local Quality Efforts
©Dr. Eleonora Shkolnik
61
62.
Key IdeaThe difficulty, of course, is developing an infrastructure to
make it happen and the discipline to sustain efforts over
time.
מושגים ועקרונות האיכות הם אוניברסליים וניתן ליישם אותם בכל סוגי
.הארגונים
בפיתוח תשתית כדי לגרום לזה לקרות והמשמעת לקיים, כמובן,הקושי
.מאמצים לאורך זמן
©Dr. Eleonora Shkolnik
Quality concepts and principles are universal and can be
applied in all types of organizations.
62
63.
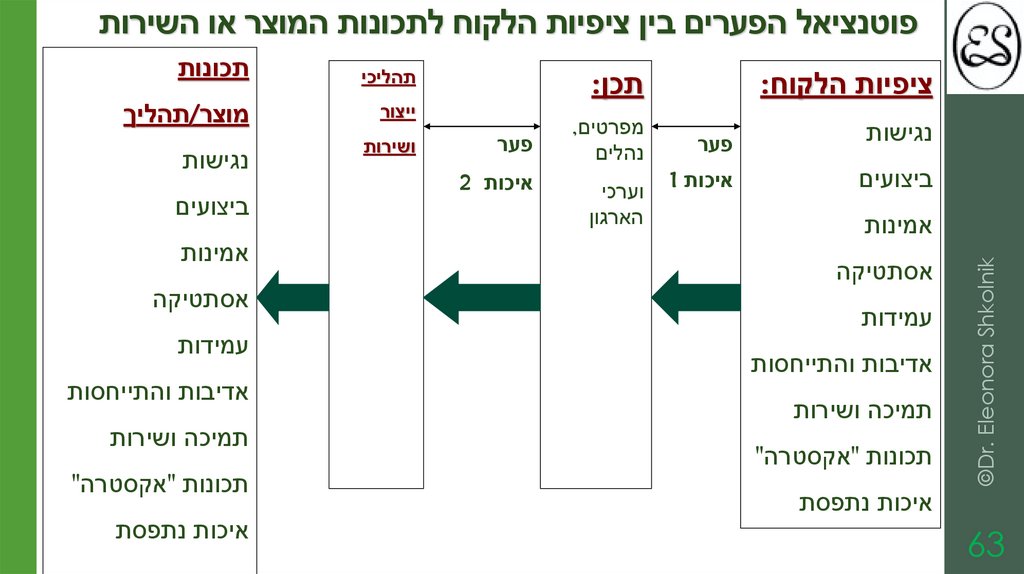
פוטנציאל הפערים בין ציפיות הלקוח לתכונות המוצר או השירותציפיות הלקוח:
נגישות
פער
ביצועים
איכות 1
אמינות
©Dr. Eleonora Shkolnik
אסתטיקה
עמידות
אדיבות והתייחסות
תמיכה ושירות
תכונות "אקסטרה"
איכות נתפסת
63
תכן:
מפרטים,
נהלים
וערכי
הארגון
פער
איכות 2
תהליכי
תכונות
ייצור
מוצר/תהליך
ושירות
נגישות
ביצועים
אמינות
אסתטיקה
עמידות
אדיבות והתייחסות
תמיכה ושירות
תכונות "אקסטרה"
איכות נתפסת
64.
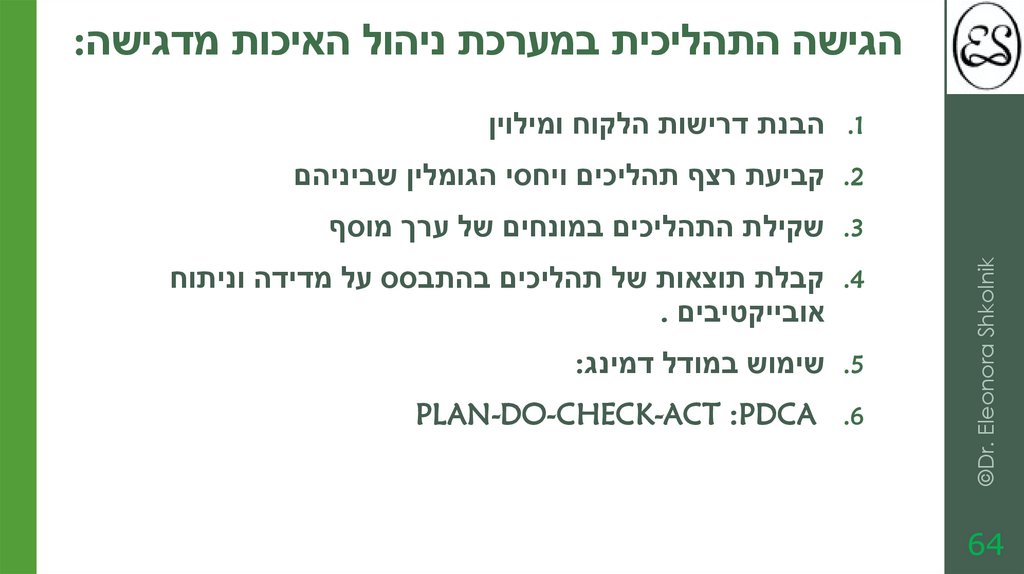
הגישה התהליכית במערכת ניהול האיכות מדגישה: .1הבנת דרישות הלקוח ומילוין
.2קביעת רצף תהליכים ויחסי הגומלין שביניהם
.3שקילת התהליכים במונחים של ערך מוסף
©Dr. Eleonora Shkolnik
64
.4קבלת תוצאות של תהליכים בהתבסס על מדידה וניתוח
אובייקטיבים .
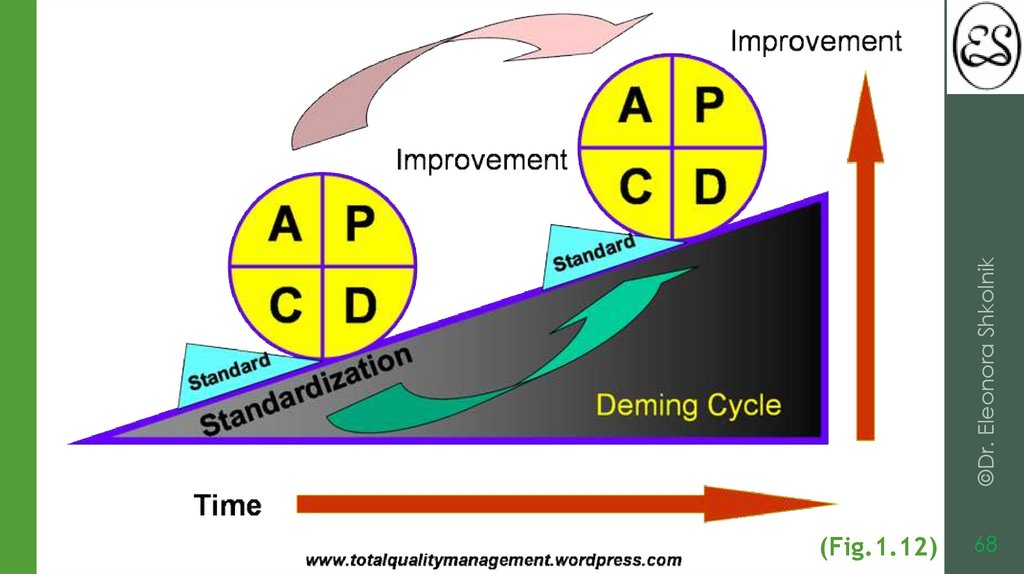
.5שימוש במודל דמינג:
PLAN-DO-CHECK-ACT :PDCA .6
65.
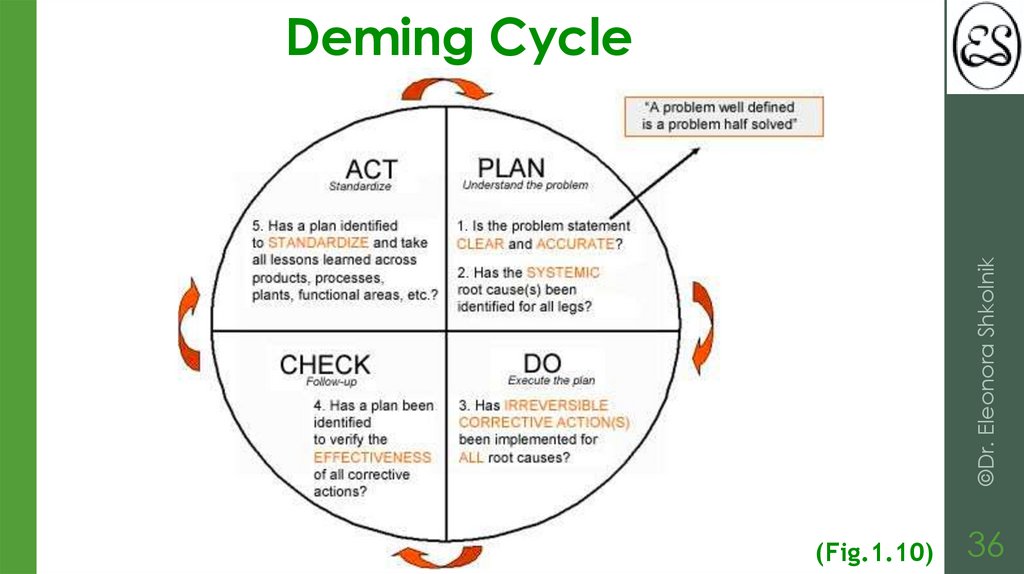
©Dr. Eleonora ShkolnikDeming Cycle
(Fig.1.10)
36
66.
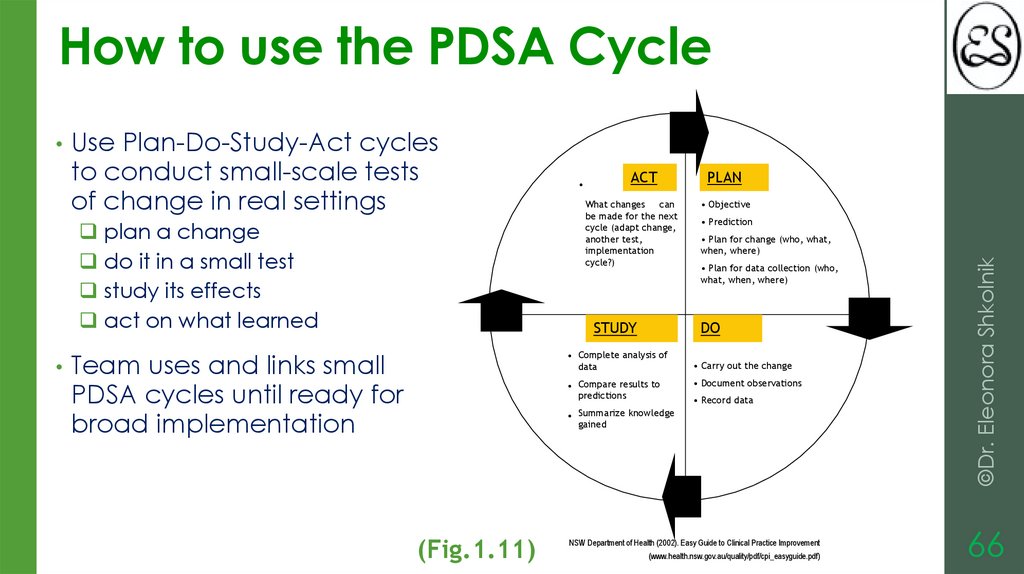
How to use the PDSA Cycle• Use Plan-Do-Study-Act cycles
plan a change
do it in a small test
study its effects
act on what learned
ACT
What changes
can
be made for the next
cycle (adapt change,
another test,
implementation
cycle?)
STUDY
• Team uses and links small
• Objective
• Prediction
• Plan for change (who, what,
when, where)
• Plan for data collection (who,
what, when, where)
DO
• Complete analysis of
data
PDSA cycles until ready for
broad implementation
PLAN
• Compare results to
predictions
• Carry out the change
• Document observations
• Record data
• Summarize knowledge
gained
(Fig.1.11)
NSW Department of Health (2002). Easy Guide to Clinical Practice Improvement
(www.health.nsw.gov.au/quality/pdf/cpi_easyguide.pdf)
©Dr. Eleonora Shkolnik
to conduct small-scale tests
of change in real settings
66
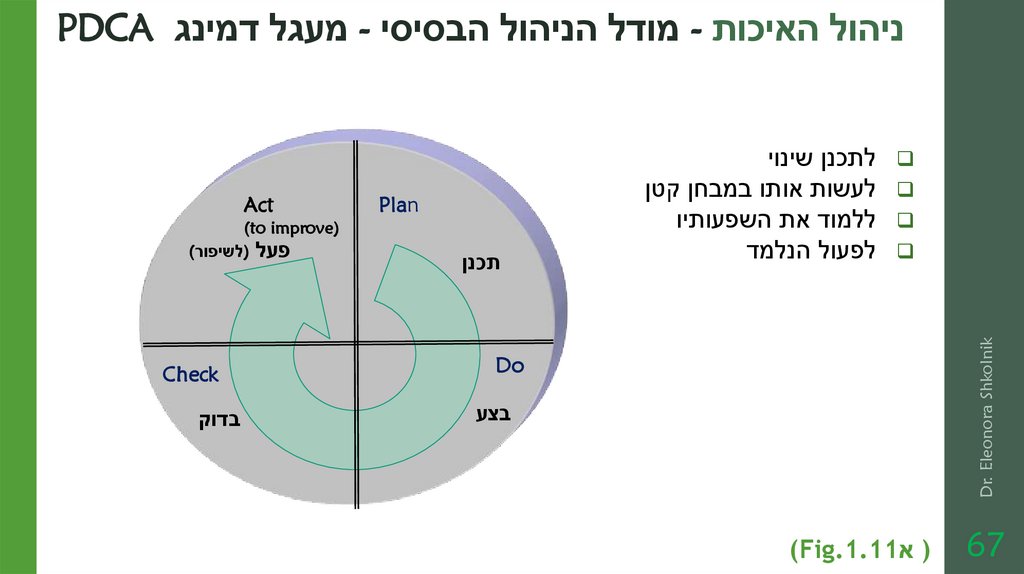
67.
ניהול האיכות -מודל הניהול הבסיסי -מעגל דמינג PDCA לתכנן שינוי
לעשות אותו במבחן קטן
ללמוד את השפעותיו
לפעול הנלמד
Dr. Eleonora Shkolnik
67
Plan
תכנן
Do
בצע
) א(Fig.1.11
Act
)(to improve
פעל (לשיפור)
Check
בדוק
68.
(Fig.1.12)68
©Dr. Eleonora Shkolnik
69.
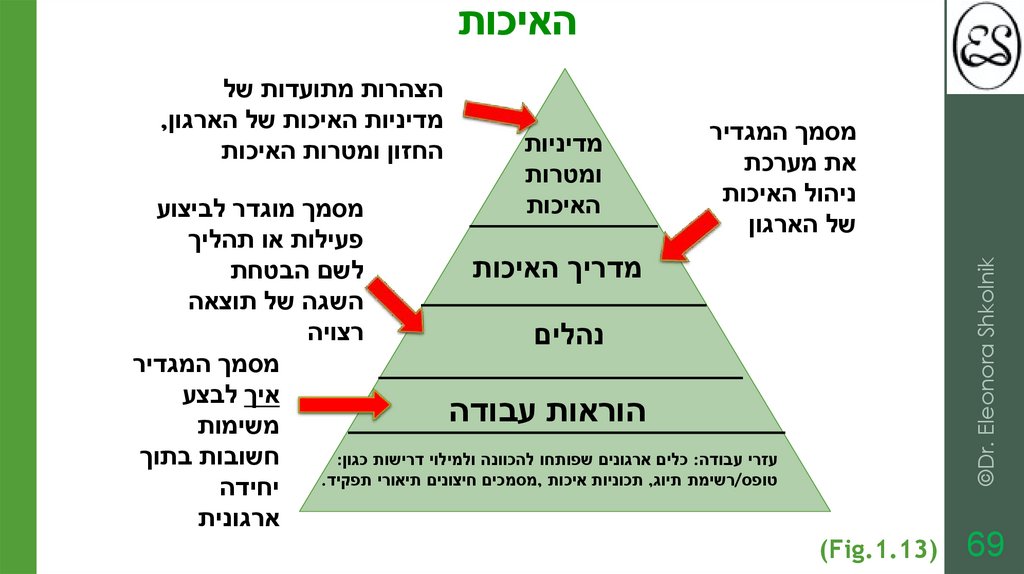
האיכותמסמך המגדיר
את מערכת
ניהול האיכות
של הארגון
מסמך מוגדר לביצוע
פעילות או תהליך
מדריך האיכות
לשם הבטחת
השגה של תוצאה
רצויה
נהלים
מסמך המגדיר
איך לבצע
הוראות עבודה
משימות
חשובות בתוך
עזרי עבודה :כלים ארגונים שפותחו להכוונה ולמילוי דרישות כגון:
טופס/רשימת תיוג ,תכוניות איכות ,מסמכים חיצונים תיאורי תפקיד.
יחידה
ארגונית
©Dr. Eleonora Shkolnik
69
מדיניות
ומטרות
האיכות
הצהרות מתועדות של
מדיניות האיכות של הארגון,
החזון ומטרות האיכות
)(Fig.1.13
70.
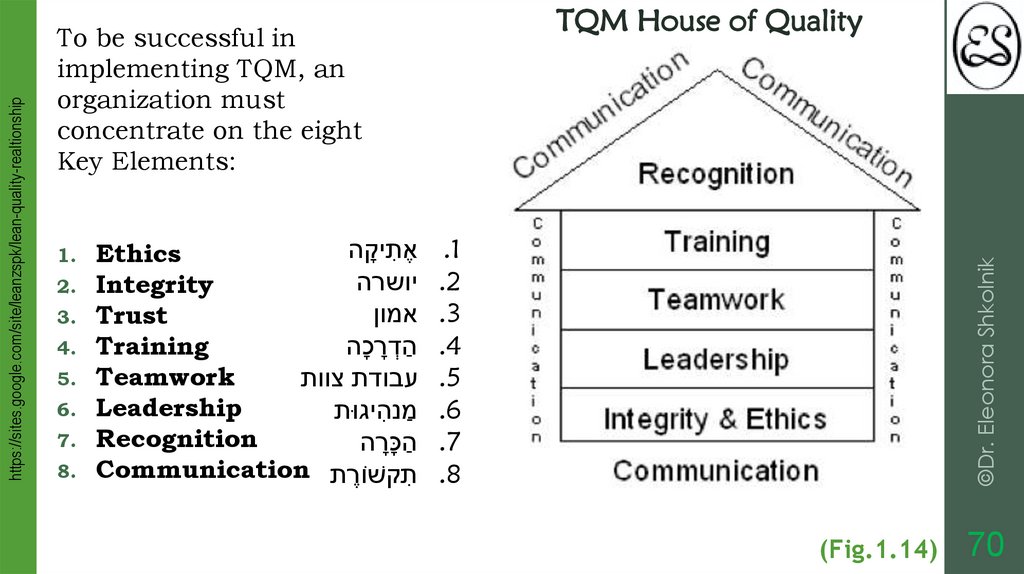
To be successful inimplementing TQM, an
organization must
concentrate on the eight
Key Elements:
1.
2.
3.
4.
5.
6.
7.
8.
יקה
ָ אֶ ִת
Ethics
יושרה
Integrity
אמון
Trust
הַ ְד ָרכָה
Training
Teamwork
עבודת צוות
Leadership
נהיגּות
ִ ַמ
Recognition
הַ כ ָָרה
Communication קׁשֹורת
ֶ
ִת
.1
.2
.3
.4
.5
.6
.7
.8
©Dr. Eleonora Shkolnik
https://sites.google.com/site/leanzspk/lean-quality-realtionship
TQM House of Quality
(Fig.1.14)
70
71.
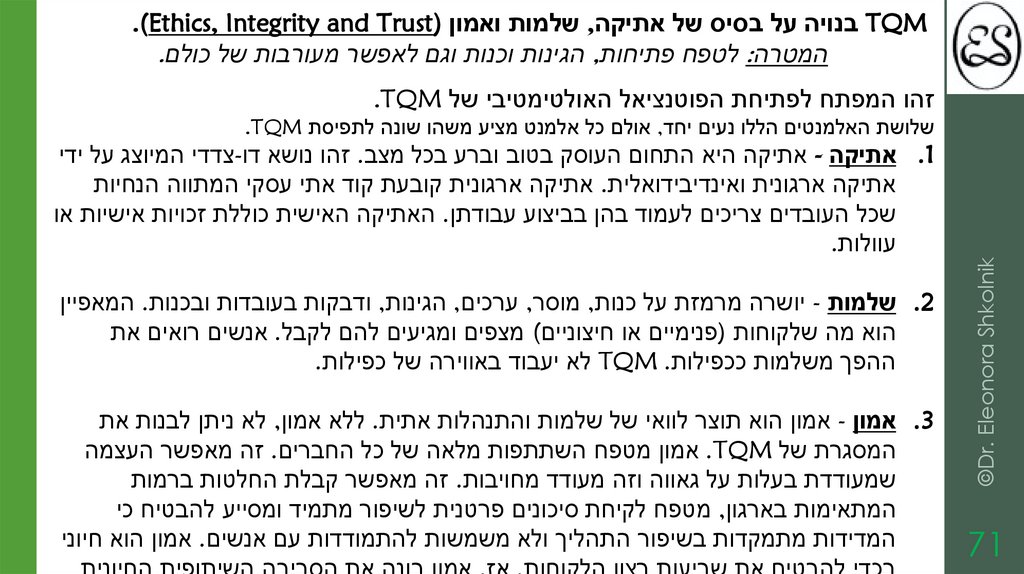
TQMבנויה על בסיס של אתיקה ,שלמות ואמון (.)Ethics, Integrity and Trustהמטרה :לטפח פתיחות ,הגינות וכנות וגם לאפשר מעורבות של כולם.
זהו המפתח לפתיחת הפוטנציאל האולטימטיבי של .TQM
שלושת האלמנטים הללו נעים יחד ,אולם כל אלמנט מציע משהו שונה לתפיסת .TQM
©Dr. Eleonora Shkolnik
71
.1אתיקה -אתיקה היא התחום העוסק בטוב וברע בכל מצב .זהו נושא דו-צדדי המיוצג על ידי
אתיקה ארגונית ואינדיבידואלית .אתיקה ארגונית קובעת קוד אתי עסקי המתווה הנחיות
שכל העובדים צריכים לעמוד בהן בביצוע עבודתן .האתיקה האישית כוללת זכויות אישיות או
עוולות.
.2שלמות -יושרה מרמזת על כנות ,מוסר ,ערכים ,הגינות ,ודבקות בעובדות ובכנות .המאפיין
הוא מה שלקוחות (פנימיים או חיצוניים) מצפים ומגיעים להם לקבל .אנשים רואים את
ההפך משלמות ככפילות TQM .לא יעבוד באווירה של כפילות.
.3אמון -אמון הוא תוצר לוואי של שלמות והתנהלות אתית .ללא אמון ,לא ניתן לבנות את
המסגרת של .TQMאמון מטפח השתתפות מלאה של כל החברים .זה מאפשר העצמה
שמעודדת בעלות על גאווה וזה מעודד מחויבות .זה מאפשר קבלת החלטות ברמות
המתאימות בארגון ,מטפח לקיחת סיכונים פרטנית לשיפור מתמיד ומסייע להבטיח כי
המדידות מתמקדות בשיפור התהליך ולא משמשות להתמודדות עם אנשים .אמון הוא חיוני
72.
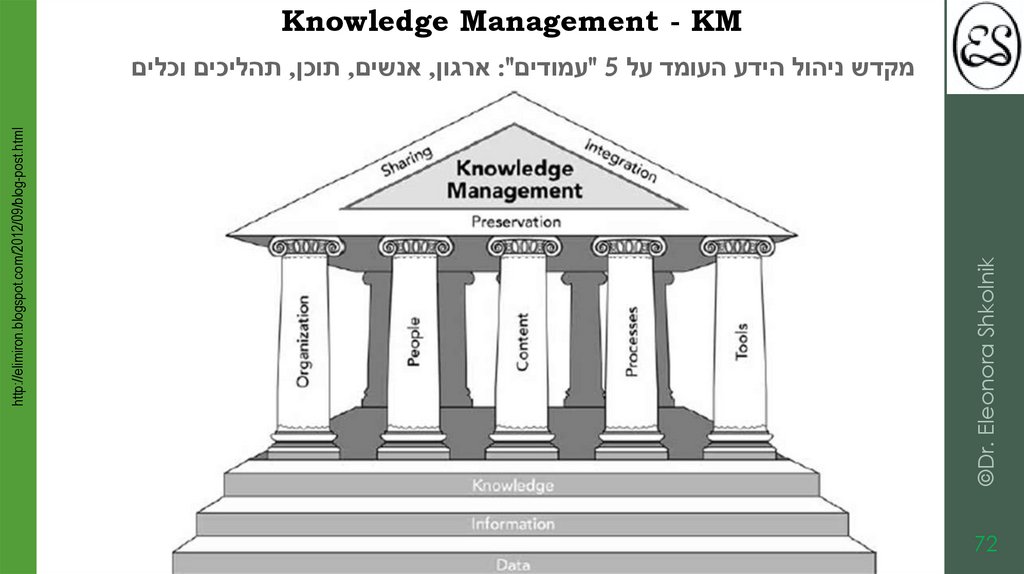
Knowledge Management - KM©Dr. Eleonora Shkolnik
http://elimiron.blogspot.com/2012/09/blog-post.html
תהליכים וכלים, תוכן, אנשים, ארגון:" "עמודים5 מקדש ניהול הידע העומד על
72
73.
מילון מונחים כללי של ניהול האיכותhttp://www.methodacloud.com/content/pages/gloss
ary/H_Gloss.htm#_COBIT
ניהול סיכונים ברפואה
http://www.mrm.org.il/?categoryId=93701
©Dr. Eleonora Shkolnik
American Society of Quality
http://asq.org/learn-about-quality/total-qualitymanagement/overview/implementing-tqm.html
73