
 Менеджмент
 Бизнес
Похожие презентации:

 des entreprises")


An Investigation of Financial Determinants of Corporate Dividend Policy
1.
NATIONAL RESEARCH UNIVERSITYHIGHER SCHOOL OF ECONOMICS
Saint Petersburg School of Economics and Management
Prepared by
Academic supervisor
Dmitrishin Stepan
A.Sidorko Senior Lecturer
Mileshnikov Nikita
Ermolaeva Daria
An Investigation of Financial
Determinants of Corporate Dividend
Policy
Bachelor’s thesis in article format
in the field 38.03.02 ‘Management’
“International Business and Management Studies”
Saint Petersburg, 2023
2.
St. Petersburg School ofEconomics and Management
International Business and
Management
Saint-Petersburg
2023
2
Outline
Research Background and Motivation
3
Research Problem
4
Underlying Theories
5
Main Concepts
6
Hypotheses formulation
7
Methods & Data
9
Results
12
Discussion
14
Conclusion
15
References
17
Appendices
20
3.
St. Petersburg School ofEconomics and Management
International Business and
Management
Saint-Petersburg
2023
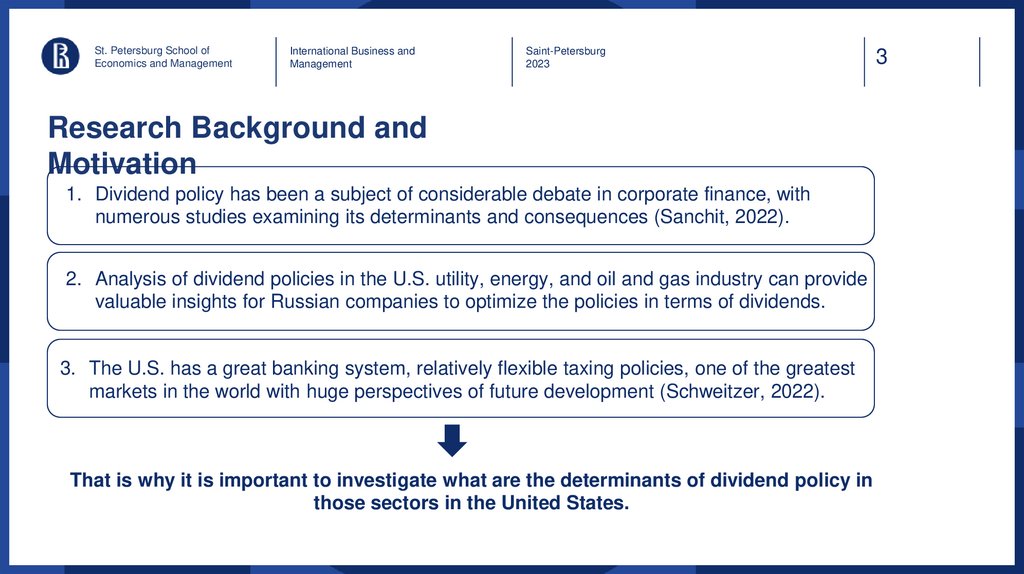
Research Background and
Motivation
1. Dividend policy has been a subject of considerable debate in corporate finance, with
numerous studies examining its determinants and consequences (Sanchit, 2022).
2. Analysis of dividend policies in the U.S. utility, energy, and oil and gas industry can provide
valuable insights for Russian companies to optimize the policies in terms of dividends.
3. The U.S. has a great banking system, relatively flexible taxing policies, one of the greatest
markets in the world with huge perspectives of future development (Schweitzer, 2022).
That is why it is important to investigate what are the determinants of dividend policy in
those sectors in the United States.
3
4.
St. Petersburg School ofEconomics and Management
International Business and
Management
Saint-Petersburg
2023
4
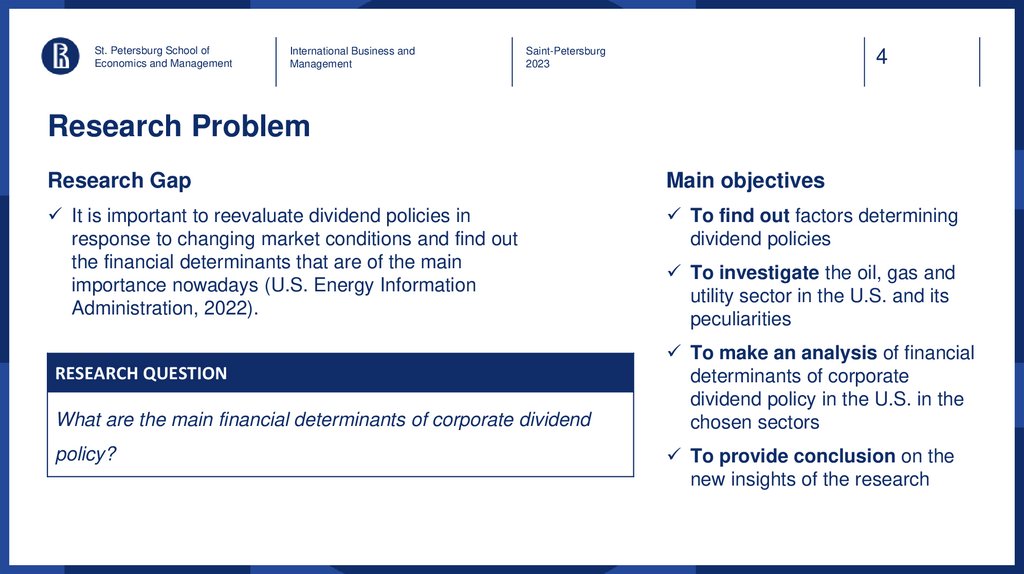
Research Problem
Research Gap
Main objectives
It is important to reevaluate dividend policies in
response to changing market conditions and find out
the financial determinants that are of the main
importance nowadays (U.S. Energy Information
Administration, 2022).
To find out factors determining
dividend policies
RESEARCH QUESTION
What are the main financial determinants of corporate dividend
policy?
To investigate the oil, gas and
utility sector in the U.S. and its
peculiarities
To make an analysis of financial
determinants of corporate
dividend policy in the U.S. in the
chosen sectors
To provide conclusion on the
new insights of the research
5.
St. Petersburg School ofEconomics and Management
International Business and
Management
Saint-Petersburg
2023
5
Underlying Theories
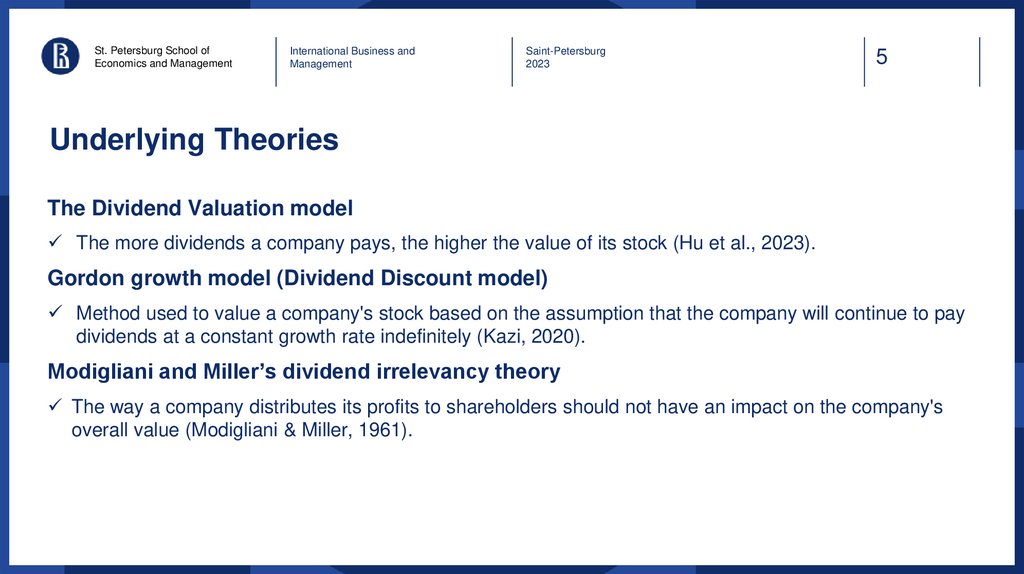
The Dividend Valuation model
The more dividends a company pays, the higher the value of its stock (Hu et al., 2023).
Gordon growth model (Dividend Discount model)
Method used to value a company's stock based on the assumption that the company will continue to pay
dividends at a constant growth rate indefinitely (Kazi, 2020).
Modigliani and Miller’s dividend irrelevancy theory
The way a company distributes its profits to shareholders should not have an impact on the company's
overall value (Modigliani & Miller, 1961).
6.
St. Petersburg School ofEconomics and Management
International Business and
Management
Saint-Petersburg
2023
6
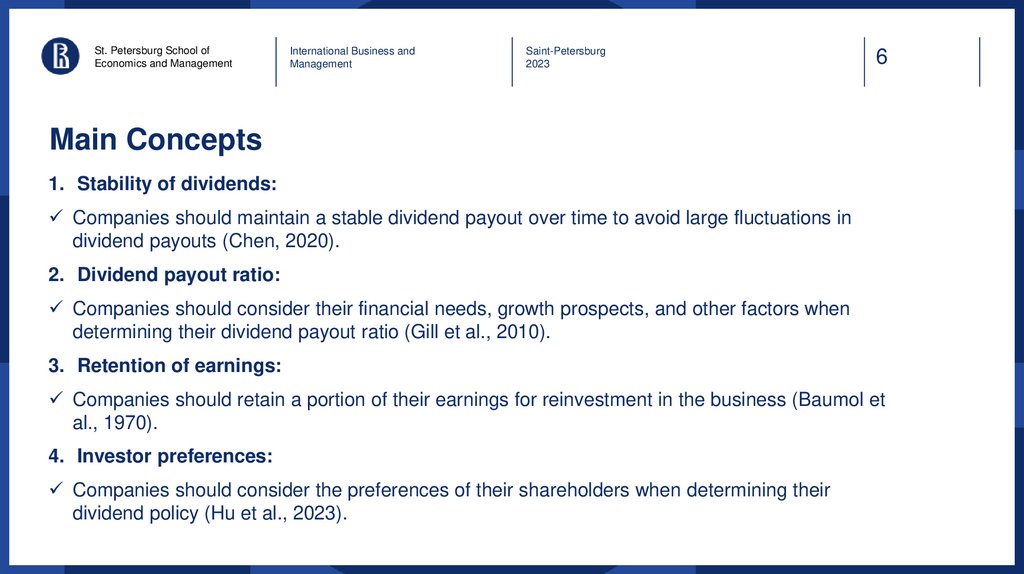
Main Concepts
1. Stability of dividends:
Companies should maintain a stable dividend payout over time to avoid large fluctuations in
dividend payouts (Chen, 2020).
2. Dividend payout ratio:
Companies should consider their financial needs, growth prospects, and other factors when
determining their dividend payout ratio (Gill et al., 2010).
3. Retention of earnings:
Companies should retain a portion of their earnings for reinvestment in the business (Baumol et
al., 1970).
4. Investor preferences:
Companies should consider the preferences of their shareholders when determining their
dividend policy (Hu et al., 2023).
7.
St. Petersburg School ofEconomics and Management
International Business and
Management
Saint-Petersburg
2023
Hypotheses formulation
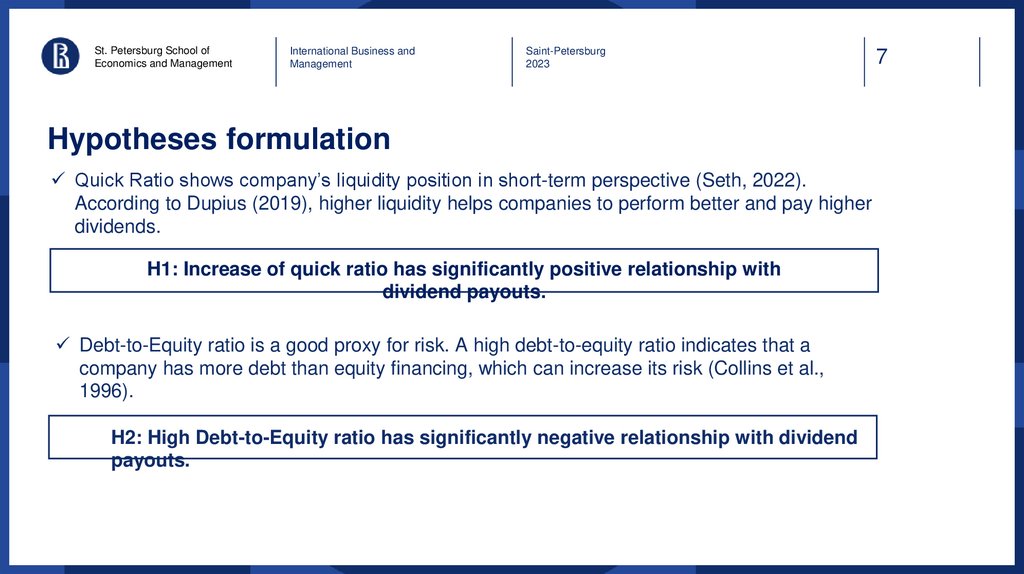
Quick Ratio shows company’s liquidity position in short-term perspective (Seth, 2022).
According to Dupius (2019), higher liquidity helps companies to perform better and pay higher
dividends.
H1: Increase of quick ratio has significantly positive relationship with
dividend payouts.
Debt-to-Equity ratio is a good proxy for risk. A high debt-to-equity ratio indicates that a
company has more debt than equity financing, which can increase its risk (Collins et al.,
1996).
H2: High Debt-to-Equity ratio has significantly negative relationship with dividend
payouts.
7
8.
St. Petersburg School ofEconomics and Management
International Business and
Management
Saint-Petersburg
2023
Hypotheses formulation
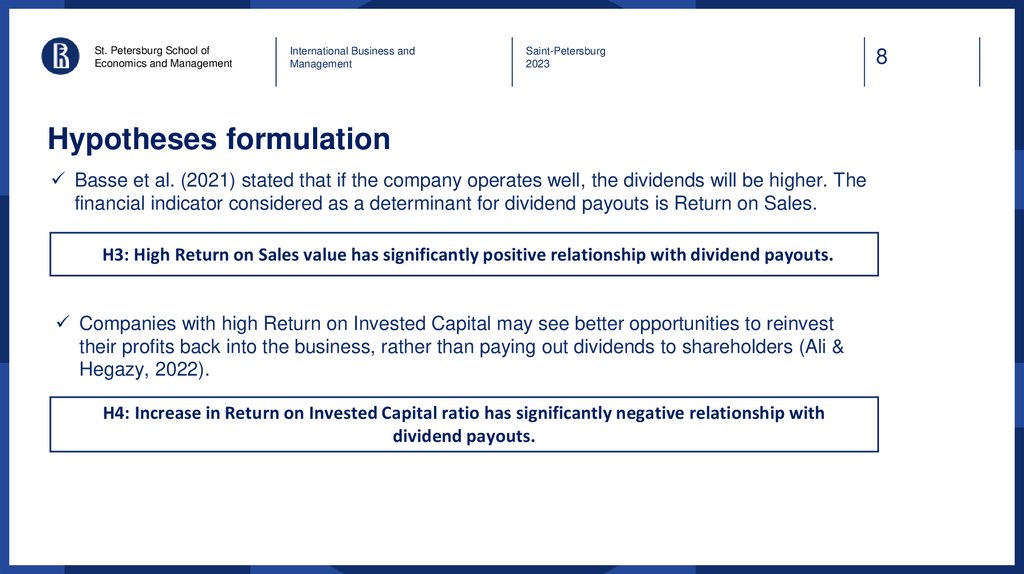
Basse et al. (2021) stated that if the company operates well, the dividends will be higher. The
financial indicator considered as a determinant for dividend payouts is Return on Sales.
H3: High Return on Sales value has significantly positive relationship with dividend payouts.
Companies with high Return on Invested Capital may see better opportunities to reinvest
their profits back into the business, rather than paying out dividends to shareholders (Ali &
Hegazy, 2022).
H4: Increase in Return on Invested Capital ratio has significantly negative relationship with
dividend payouts.
8
9.
St. Petersburg School ofEconomics and Management
International Business and
Management
Saint-Petersburg
2023
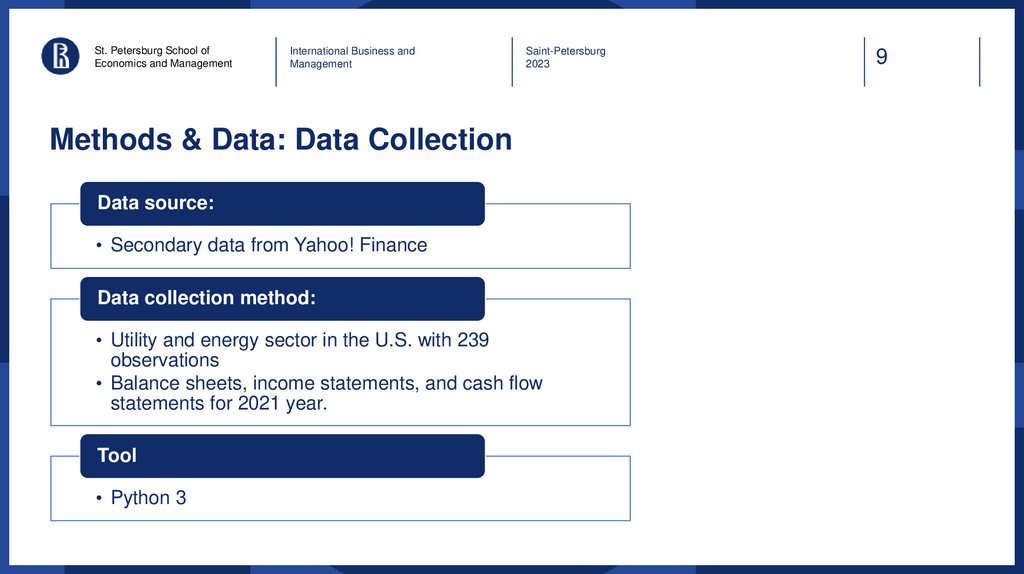
Methods & Data: Data Collection
Data source:
• Secondary data from Yahoo! Finance
Data collection method:
• Utility and energy sector in the U.S. with 239
observations
• Balance sheets, income statements, and cash flow
statements for 2021 year.
Tool
• Python 3
9
10.
St. Petersburg School ofEconomics and Management
International Business and
Management
Saint-Petersburg
2023
10
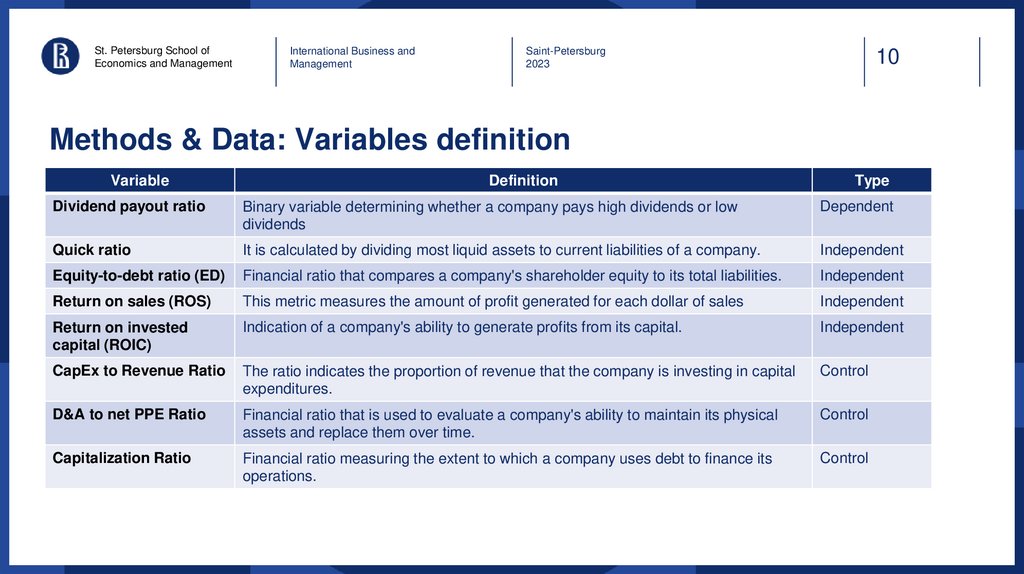
Methods & Data: Variables definition
Variable
Definition
Type
Dividend payout ratio
Binary variable determining whether a company pays high dividends or low
dividends
Dependent
Quick ratio
It is calculated by dividing most liquid assets to current liabilities of a company.
Independent
Equity-to-debt ratio (ED)
Financial ratio that compares a company's shareholder equity to its total liabilities.
Independent
Return on sales (ROS)
This metric measures the amount of profit generated for each dollar of sales
Independent
Return on invested
capital (ROIC)
Indication of a company's ability to generate profits from its capital.
Independent
CapEx to Revenue Ratio
The ratio indicates the proportion of revenue that the company is investing in capital
expenditures.
Control
D&A to net PPE Ratio
Financial ratio that is used to evaluate a company's ability to maintain its physical
assets and replace them over time.
Control
Capitalization Ratio
Financial ratio measuring the extent to which a company uses debt to finance its
operations.
Control
11.
St. Petersburg School ofEconomics and Management
International Business and
Management
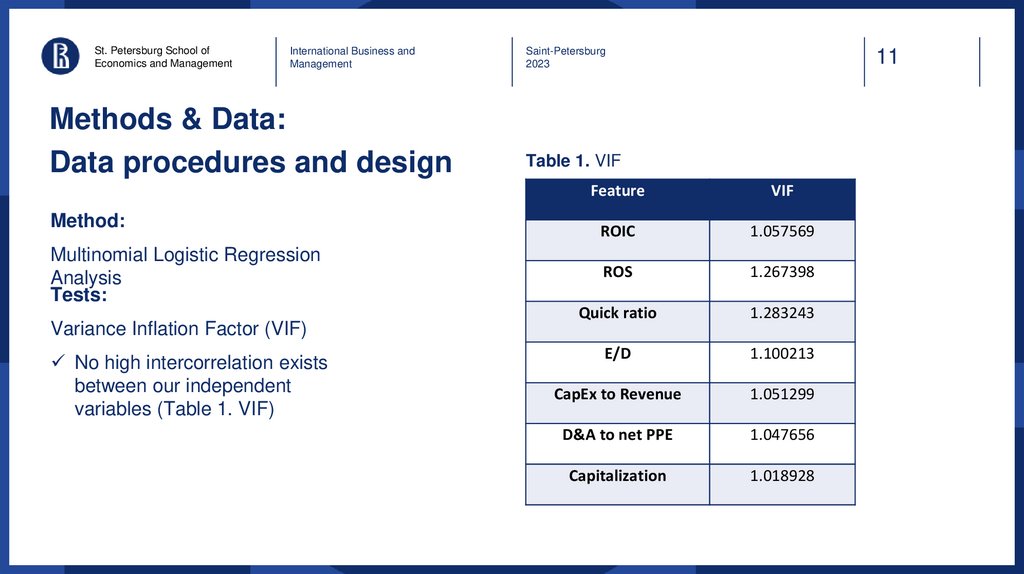
Methods & Data:
Data procedures and design
Method:
Multinomial Logistic Regression
Analysis
Tests:
Variance Inflation Factor (VIF)
No high intercorrelation exists
between our independent
variables (Table 1. VIF)
Saint-Petersburg
2023
11
Table 1. VIF
Feature
VIF
ROIC
1.057569
ROS
1.267398
Quick ratio
1.283243
E/D
1.100213
CapEx to Revenue
1.051299
D&A to net PPE
1.047656
Capitalization
1.018928
12.
St. Petersburg School ofEconomics and Management
International Business and
Management
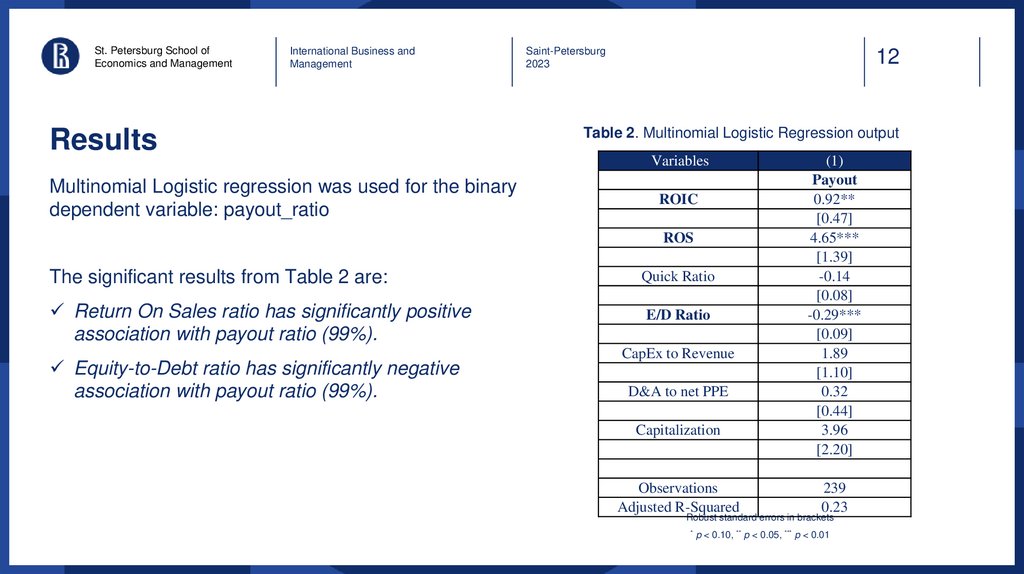
Results
Multinomial Logistic regression was used for the binary
dependent variable: payout_ratio
Saint-Petersburg
2023
12
Table 2. Multinomial Logistic Regression output
Variables
ROIC
ROS
The significant results from Table 2 are:
Quick Ratio
Return On Sales ratio has significantly positive
association with payout ratio (99%).
E/D Ratio
Equity-to-Debt ratio has significantly negative
association with payout ratio (99%).
CapEx to Revenue
D&A to net PPE
Capitalization
Observations
Adjusted R-Squared
(1)
Payout
0.92**
[0.47]
4.65***
[1.39]
-0.14
[0.08]
-0.29***
[0.09]
1.89
[1.10]
0.32
[0.44]
3.96
[2.20]
239
0.23
Robust standard errors in brackets
* p < 0.10, ** p < 0.05, *** p < 0.01
13.
St. Petersburg School ofEconomics and Management
International Business and
Management
Saint-Petersburg
2023
Results
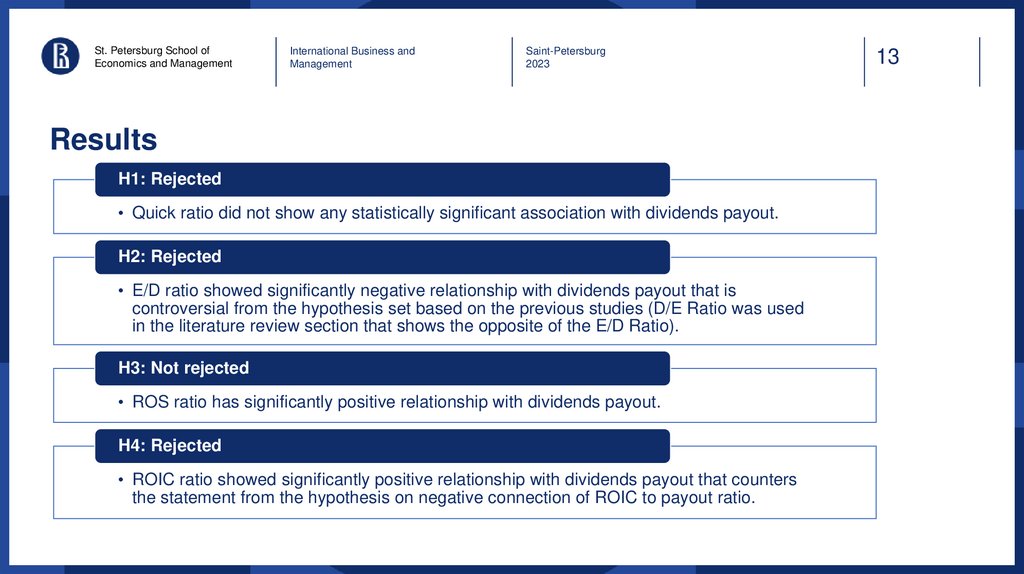
H1: Rejected
• Quick ratio did not show any statistically significant association with dividends payout.
H2: Rejected
• E/D ratio showed significantly negative relationship with dividends payout that is
controversial from the hypothesis set based on the previous studies (D/E Ratio was used
in the literature review section that shows the opposite of the E/D Ratio).
H3: Not rejected
• ROS ratio has significantly positive relationship with dividends payout.
H4: Rejected
• ROIC ratio showed significantly positive relationship with dividends payout that counters
the statement from the hypothesis on negative connection of ROIC to payout ratio.
13
14.
St. Petersburg School ofEconomics and Management
International Business and
Management
Saint-Petersburg
2023
Discussion
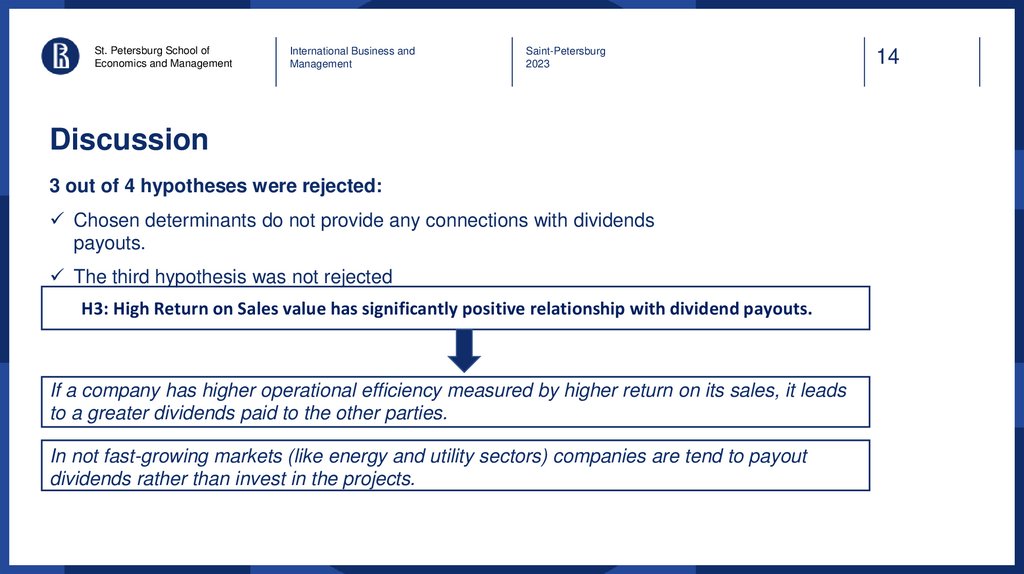
3 out of 4 hypotheses were rejected:
Chosen determinants do not provide any connections with dividends
payouts.
The third hypothesis was not rejected
H3: High Return on Sales value has significantly positive relationship with dividend payouts.
If a company has higher operational efficiency measured by higher return on its sales, it leads
to a greater dividends paid to the other parties.
In not fast-growing markets (like energy and utility sectors) companies are tend to payout
dividends rather than invest in the projects.
14
15.
St. Petersburg School ofEconomics and Management
International Business and
Management
Saint-Petersburg
2023
15
Conclusion: Implications
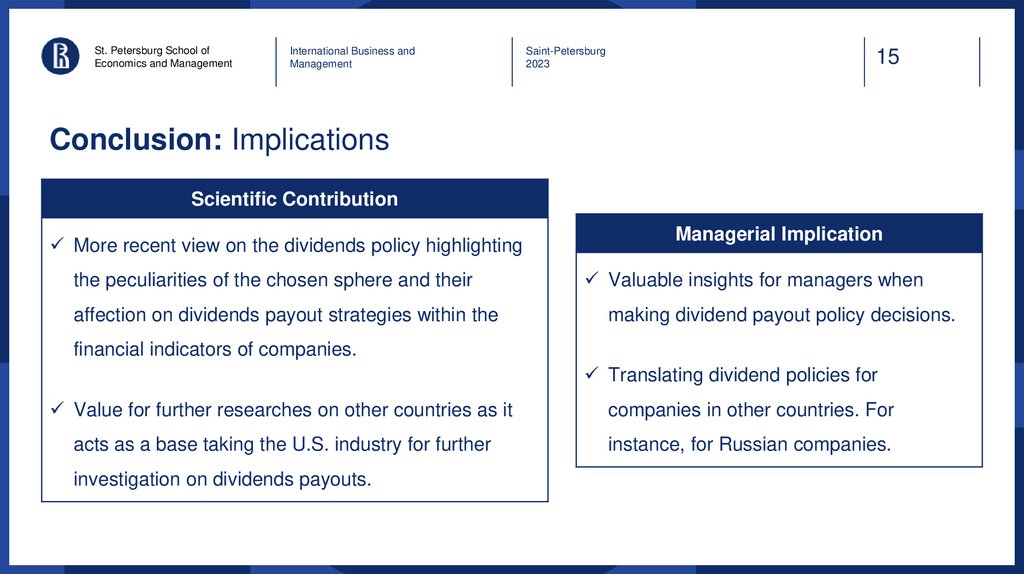
Scientific Contribution
More recent view on the dividends policy highlighting
the peculiarities of the chosen sphere and their
affection on dividends payout strategies within the
Managerial Implication
Valuable insights for managers when
making dividend payout policy decisions.
financial indicators of companies.
Translating dividend policies for
Value for further researches on other countries as it
companies in other countries. For
acts as a base taking the U.S. industry for further
instance, for Russian companies.
investigation on dividends payouts.
16.
St. Petersburg School ofEconomics and Management
International Business and
Management
Saint-Petersburg
2023
16
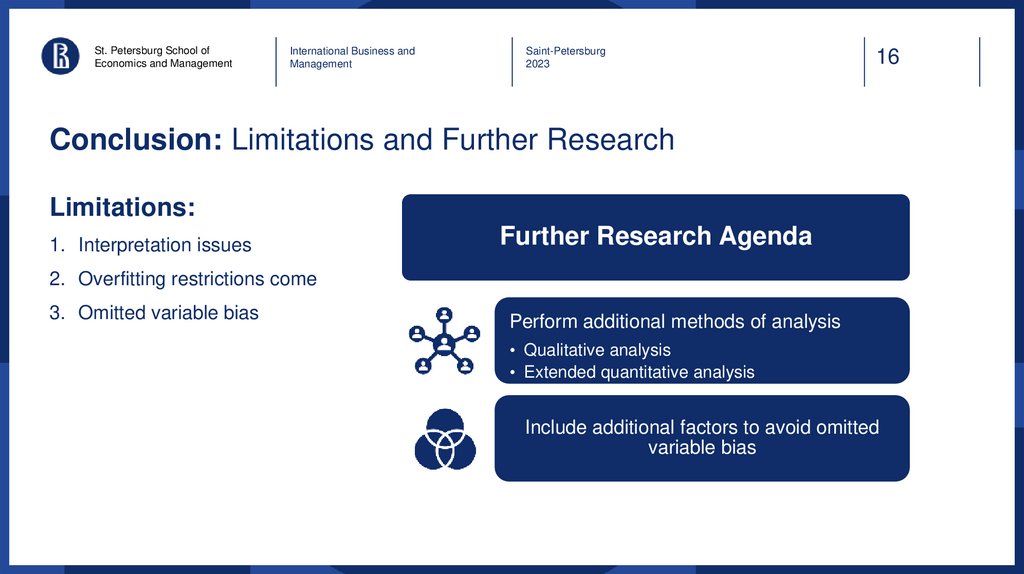
Conclusion: Limitations and Further Research
Limitations:
1. Interpretation issues
Further Research Agenda
2. Overfitting restrictions come
3. Omitted variable bias
Perform additional methods of analysis
• Qualitative analysis
• Extended quantitative analysis
Include additional factors to avoid omitted
variable bias
17.
St. Petersburg School ofEconomics and Management
International Business and
Management
Saint-Petersburg
2023
17
References
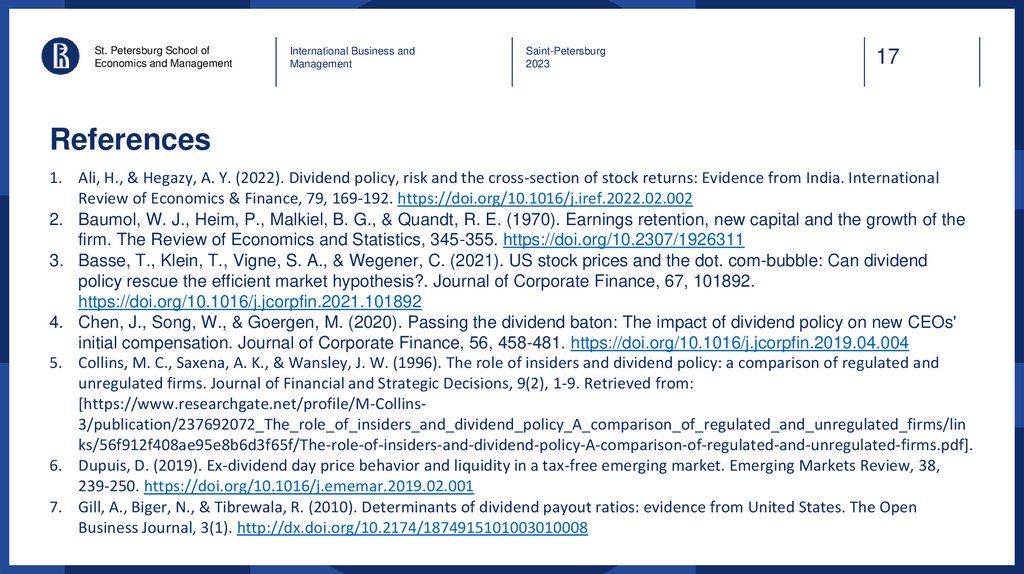
1. Ali, H., & Hegazy, A. Y. (2022). Dividend policy, risk and the cross-section of stock returns: Evidence from India. International
Review of Economics & Finance, 79, 169-192. https://doi.org/10.1016/j.iref.2022.02.002
2. Baumol, W. J., Heim, P., Malkiel, B. G., & Quandt, R. E. (1970). Earnings retention, new capital and the growth of the
firm. The Review of Economics and Statistics, 345-355. https://doi.org/10.2307/1926311
3. Basse, T., Klein, T., Vigne, S. A., & Wegener, C. (2021). US stock prices and the dot. com-bubble: Can dividend
policy rescue the efficient market hypothesis?. Journal of Corporate Finance, 67, 101892.
https://doi.org/10.1016/j.jcorpfin.2021.101892
4. Chen, J., Song, W., & Goergen, M. (2020). Passing the dividend baton: The impact of dividend policy on new CEOs'
initial compensation. Journal of Corporate Finance, 56, 458-481. https://doi.org/10.1016/j.jcorpfin.2019.04.004
5. Collins, M. C., Saxena, A. K., & Wansley, J. W. (1996). The role of insiders and dividend policy: a comparison of regulated and
unregulated firms. Journal of Financial and Strategic Decisions, 9(2), 1-9. Retrieved from:
[https://www.researchgate.net/profile/M-Collins3/publication/237692072_The_role_of_insiders_and_dividend_policy_A_comparison_of_regulated_and_unregulated_firms/lin
ks/56f912f408ae95e8b6d3f65f/The-role-of-insiders-and-dividend-policy-A-comparison-of-regulated-and-unregulated-firms.pdf].
6. Dupuis, D. (2019). Ex-dividend day price behavior and liquidity in a tax-free emerging market. Emerging Markets Review, 38,
239-250. https://doi.org/10.1016/j.ememar.2019.02.001
7. Gill, A., Biger, N., & Tibrewala, R. (2010). Determinants of dividend payout ratios: evidence from United States. The Open
Business Journal, 3(1). http://dx.doi.org/10.2174/1874915101003010008
18.
St. Petersburg School ofEconomics and Management
International Business and
Management
Saint-Petersburg
2023
18
References
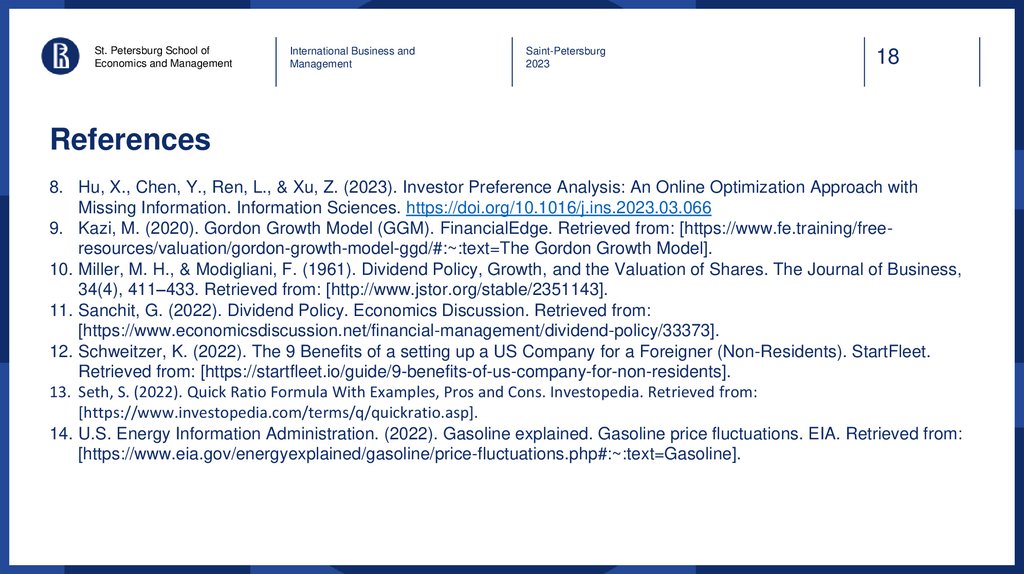
8. Hu, X., Chen, Y., Ren, L., & Xu, Z. (2023). Investor Preference Analysis: An Online Optimization Approach with
Missing Information. Information Sciences. https://doi.org/10.1016/j.ins.2023.03.066
9. Kazi, M. (2020). Gordon Growth Model (GGM). FinancialEdge. Retrieved from: [https://www.fe.training/freeresources/valuation/gordon-growth-model-ggd/#:~:text=The Gordon Growth Model].
10. Miller, M. H., & Modigliani, F. (1961). Dividend Policy, Growth, and the Valuation of Shares. The Journal of Business,
34(4), 411–433. Retrieved from: [http://www.jstor.org/stable/2351143].
11. Sanchit, G. (2022). Dividend Policy. Economics Discussion. Retrieved from:
[https://www.economicsdiscussion.net/financial-management/dividend-policy/33373].
12. Schweitzer, K. (2022). The 9 Benefits of a setting up a US Company for a Foreigner (Non-Residents). StartFleet.
Retrieved from: [https://startfleet.io/guide/9-benefits-of-us-company-for-non-residents].
13. Seth, S. (2022). Quick Ratio Formula With Examples, Pros and Cons. Investopedia. Retrieved from:
[https://www.investopedia.com/terms/q/quickratio.asp].
14. U.S. Energy Information Administration. (2022). Gasoline explained. Gasoline price fluctuations. EIA. Retrieved from:
[https://www.eia.gov/energyexplained/gasoline/price-fluctuations.php#:~:text=Gasoline].
19.
NATIONAL RESEARCH UNIVERSITYHIGHER SCHOOL OF ECONOMICS
Prepared by
Academic supervisor
Saint Petersburg School of Economics and Management
«Сюда вставим наши фото с контактной
информацией»
Thank you
for your attention!
20.
St. Petersburg School ofEconomics and Management
International Business and
Management
Saint-Petersburg
2023
20
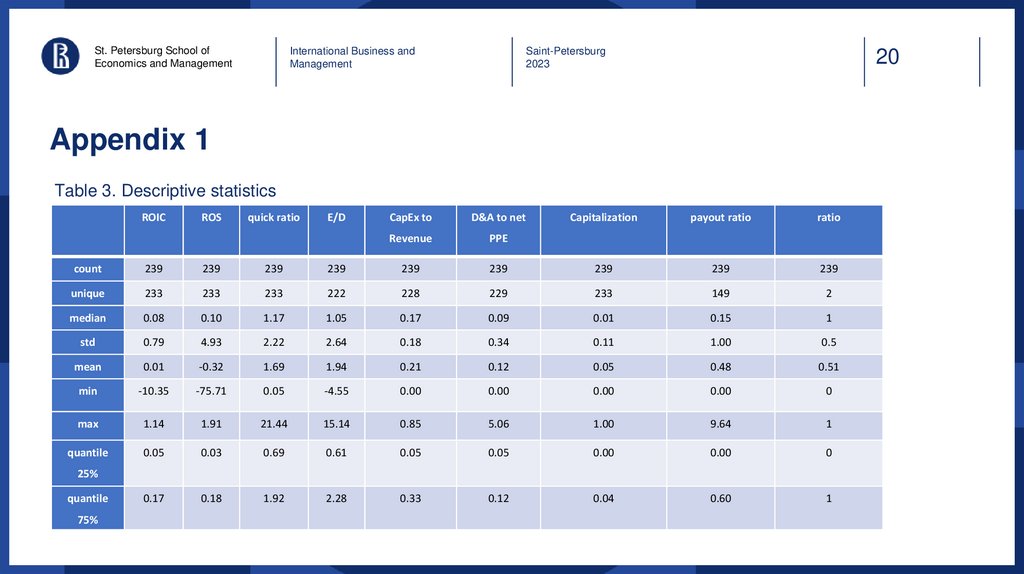
Appendix 1
Table 3. Descriptive statistics
ROIC
ROS
quick ratio
E/D
CapEx to
D&A to net
Revenue
PPE
Capitalization
payout ratio
ratio
count
239
239
239
239
239
239
239
239
239
unique
233
233
233
222
228
229
233
149
2
median
0.08
0.10
1.17
1.05
0.17
0.09
0.01
0.15
1
std
0.79
4.93
2.22
2.64
0.18
0.34
0.11
1.00
0.5
mean
0.01
-0.32
1.69
1.94
0.21
0.12
0.05
0.48
0.51
min
-10.35
-75.71
0.05
-4.55
0.00
0.00
0.00
0.00
0
max
1.14
1.91
21.44
15.14
0.85
5.06
1.00
9.64
1
quantile
0.05
0.03
0.69
0.61
0.05
0.05
0.00
0.00
0
0.17
0.18
1.92
2.28
0.33
0.12
0.04
0.60
1
25%
quantile
75%
21.
St. Petersburg School ofEconomics and Management
International Business and
Management
Saint-Petersburg
2023
21
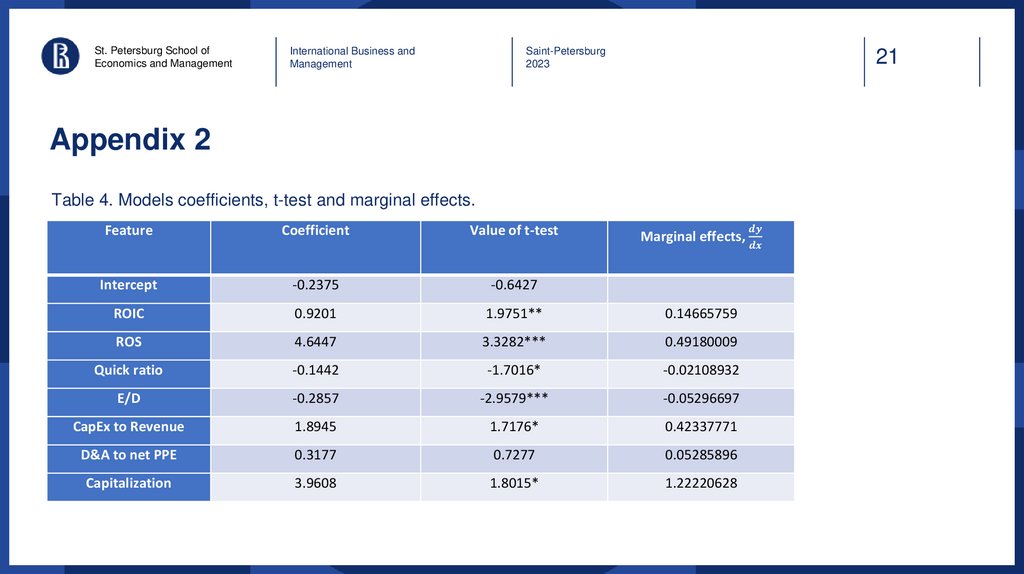
Appendix 2
Table 4. Models coefficients, t-test and marginal effects.
Feature
Coefficient
Value of t-test
Marginal effects,
Intercept
-0.2375
-0.6427
ROIC
0.9201
1.9751**
0.14665759
ROS
4.6447
3.3282***
0.49180009
Quick ratio
-0.1442
-1.7016*
-0.02108932
E/D
-0.2857
-2.9579***
-0.05296697
CapEx to Revenue
1.8945
1.7176*
0.42337771
D&A to net PPE
0.3177
0.7277
0.05285896
Capitalization
3.9608
1.8015*
1.22220628