


 Бизнес
Похожие презентации:


")
")
Business Valuation of «Казмунайгаз»
1. Business Valuation of «Казмунайгаз»
Complied: Turussbekova Z.Shilin V.
1401 SPO finance
2.
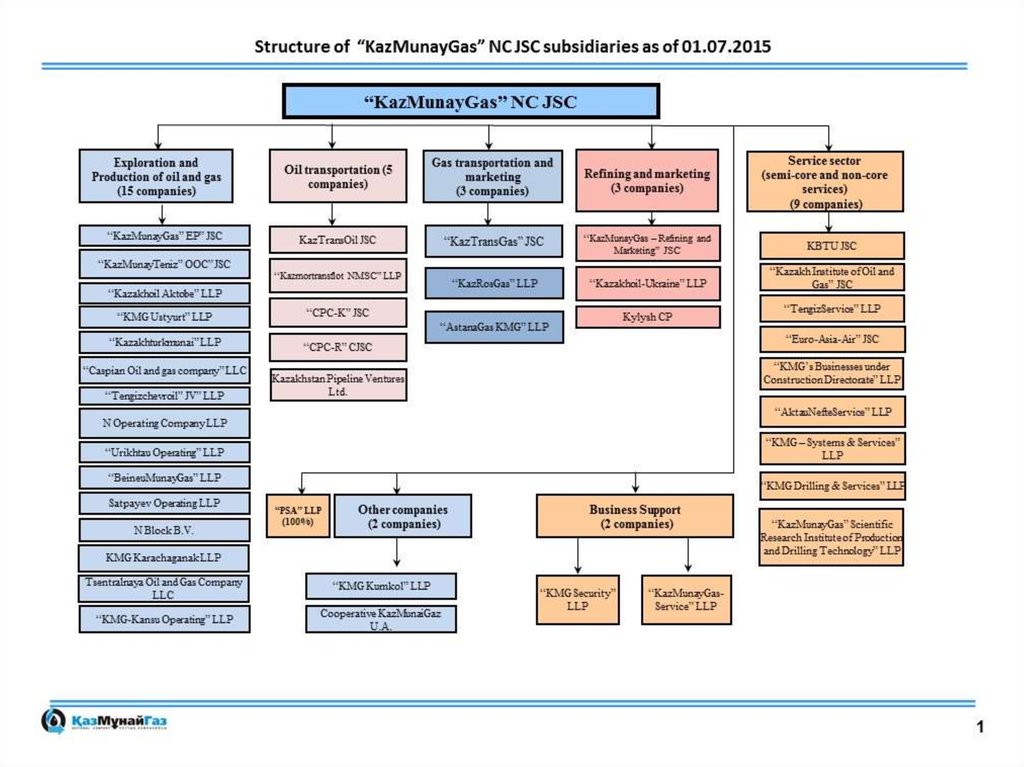
About the companyNational Company “KazMunayGas” (KMG) is the Kazakhstan operator for exploration,
production, refining and transportation of hydrocarbons, representing the state interests in
the oil and gas industry of Kazakhstan. Joint Stock Company “National Company
“KazMunayGas” was established by way of merger of “Kazakhoil” National Oil and Gas
Company and “Oil and Gas Transportation” National Company pursuant to the Decree of
the President of the Republic of Kazakhstan as of February 20, 2002. 90% of KMG shares
are owned by Samruk Kazyna National Welfare Fund JSC. 10% of KMG shares are owned by
the National Bank of the Republiс of Kazakhstan. National Company “KazMunayGas” is a
vertically integrated oil and gas company performing a full production cycle from
exploration and production of hydrocarbons, their transportation and refining to provision
of customized services.
KMG sets a goal to ensure maximum benefits for the Republic of Kazakhstan from
participation in developing the national oil and gas industry.
The KMG group of companies includes 220 companies. KazMunayGas occupies over a
quarter of the Kazakhstan market on production of oil and gas condensate as well as a
dominant position in oil refining, pipeline transportation of oil and natural gas in the
country.
3.
4.
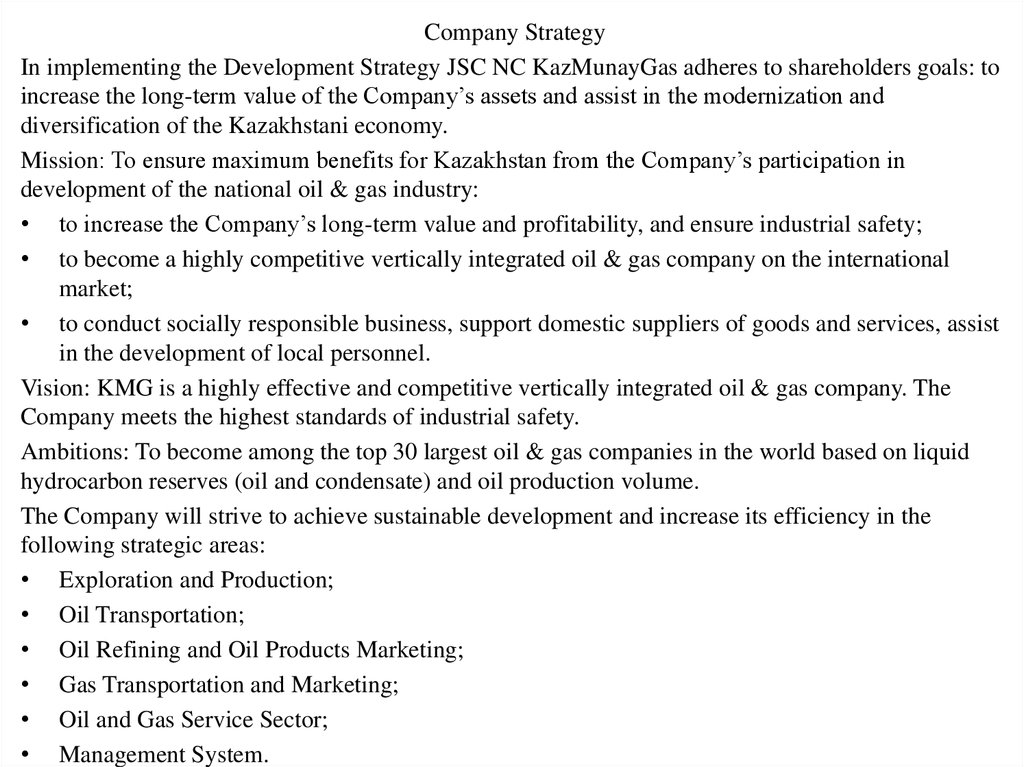
Company StrategyIn implementing the Development Strategy JSC NC KazMunayGas adheres to shareholders goals: to
increase the long-term value of the Company’s assets and assist in the modernization and
diversification of the Kazakhstani economy.
Mission: To ensure maximum benefits for Kazakhstan from the Company’s participation in
development of the national oil & gas industry:
• to increase the Company’s long-term value and profitability, and ensure industrial safety;
• to become a highly competitive vertically integrated oil & gas company on the international
market;
• to conduct socially responsible business, support domestic suppliers of goods and services, assist
in the development of local personnel.
Vision: KMG is a highly effective and competitive vertically integrated oil & gas company. The
Company meets the highest standards of industrial safety.
Ambitions: To become among the top 30 largest oil & gas companies in the world based on liquid
hydrocarbon reserves (oil and condensate) and oil production volume.
The Company will strive to achieve sustainable development and increase its efficiency in the
following strategic areas:
• Exploration and Production;
• Oil Transportation;
• Oil Refining and Oil Products Marketing;
• Gas Transportation and Marketing;
• Oil and Gas Service Sector;
• Management System.
5.
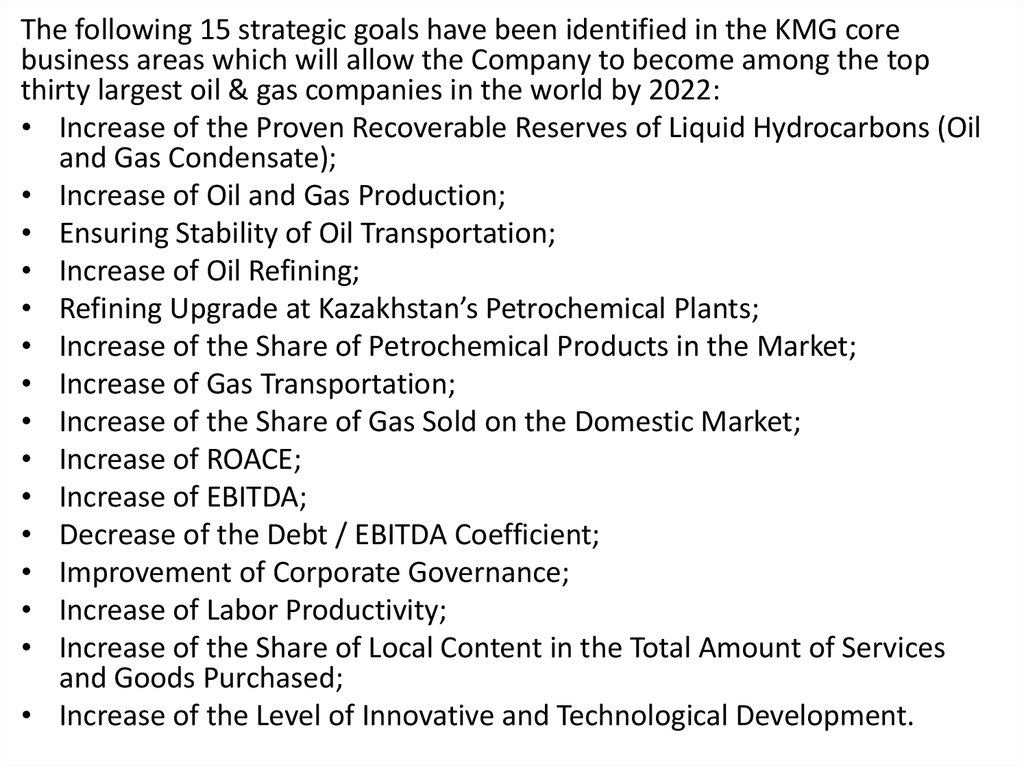
The following 15 strategic goals have been identified in the KMG corebusiness areas which will allow the Company to become among the top
thirty largest oil & gas companies in the world by 2022:
• Increase of the Proven Recoverable Reserves of Liquid Hydrocarbons (Oil
and Gas Condensate);
• Increase of Oil and Gas Production;
• Ensuring Stability of Oil Transportation;
• Increase of Oil Refining;
• Refining Upgrade at Kazakhstan’s Petrochemical Plants;
• Increase of the Share of Petrochemical Products in the Market;
• Increase of Gas Transportation;
• Increase of the Share of Gas Sold on the Domestic Market;
• Increase of ROACE;
• Increase of EBITDA;
• Decrease of the Debt / EBITDA Coefficient;
• Improvement of Corporate Governance;
• Increase of Labor Productivity;
• Increase of the Share of Local Content in the Total Amount of Services
and Goods Purchased;
• Increase of the Level of Innovative and Technological Development.
6.
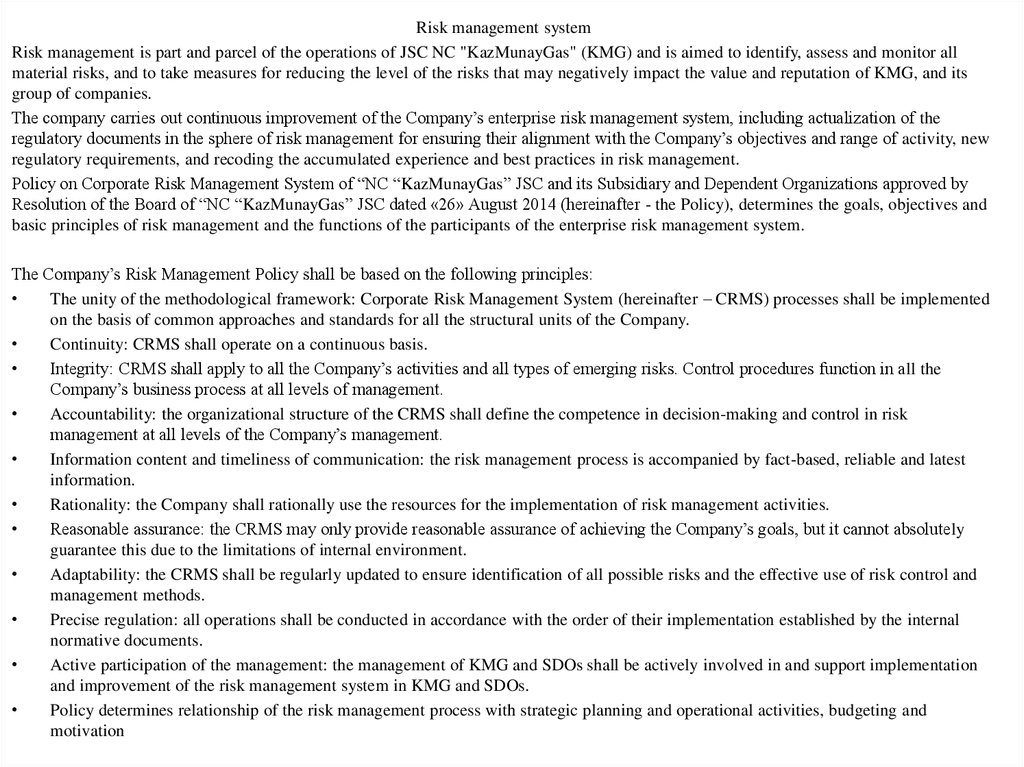
Risk management systemRisk management is part and parcel of the operations of JSC NC "KazMunayGas" (KMG) and is aimed to identify, assess and monitor all
material risks, and to take measures for reducing the level of the risks that may negatively impact the value and reputation of KMG, and its
group of companies.
The company carries out continuous improvement of the Company’s enterprise risk management system, including actualization of the
regulatory documents in the sphere of risk management for ensuring their alignment with the Company’s objectives and range of activity, new
regulatory requirements, and recoding the accumulated experience and best practices in risk management.
Policy on Corporate Risk Management System of “NC “KazMunayGas” JSC and its Subsidiary and Dependent Organizations approved by
Resolution of the Board of “NC “KazMunayGas” JSC dated «26» August 2014 (hereinafter - the Policy), determines the goals, objectives and
basic principles of risk management and the functions of the participants of the enterprise risk management system.
The Company’s Risk Management Policy shall be based on the following principles:
The unity of the methodological framework: Corporate Risk Management System (hereinafter – CRMS) processes shall be implemented
on the basis of common approaches and standards for all the structural units of the Company.
Continuity: CRMS shall operate on a continuous basis.
Integrity: CRMS shall apply to all the Company’s activities and all types of emerging risks. Control procedures function in all the
Company’s business process at all levels of management.
Accountability: the organizational structure of the CRMS shall define the competence in decision-making and control in risk
management at all levels of the Company’s management.
Information content and timeliness of communication: the risk management process is accompanied by fact-based, reliable and latest
information.
Rationality: the Company shall rationally use the resources for the implementation of risk management activities.
Reasonable assurance: the CRMS may only provide reasonable assurance of achieving the Company’s goals, but it cannot absolutely
guarantee this due to the limitations of internal environment.
Adaptability: the CRMS shall be regularly updated to ensure identification of all possible risks and the effective use of risk control and
management methods.
Precise regulation: all operations shall be conducted in accordance with the order of their implementation established by the internal
normative documents.
Active participation of the management: the management of KMG and SDOs shall be actively involved in and support implementation
and improvement of the risk management system in KMG and SDOs.
Policy determines relationship of the risk management process with strategic planning and operational activities, budgeting and
motivation
7.
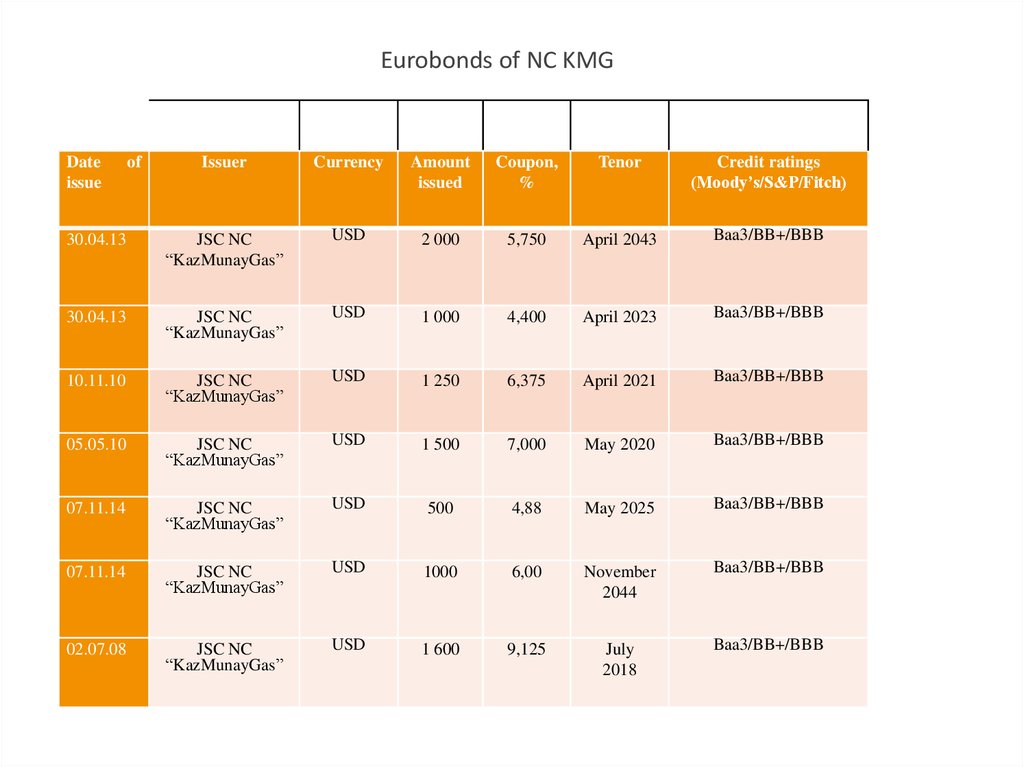
Eurobonds of NC KMGDate
issue
of
Issuer
Currency
Amount
issued
Coupon,
%
Tenor
Credit ratings
(Moody’s/S&P/Fitch)
30.04.13
JSC NC
“KazMunayGas”
USD
2 000
5,750
April 2043
Baa3/BB+/BBB
30.04.13
JSC NC
“KazMunayGas”
USD
1 000
4,400
April 2023
Baa3/BB+/BBB
10.11.10
JSC NC
“KazMunayGas”
USD
1 250
6,375
April 2021
Baa3/BB+/BBB
05.05.10
JSC NC
“KazMunayGas”
USD
1 500
7,000
May 2020
Baa3/BB+/BBB
07.11.14
JSC NC
“KazMunayGas”
USD
500
4,88
May 2025
Baa3/BB+/BBB
07.11.14
JSC NC
“KazMunayGas”
USD
1000
6,00
November
2044
Baa3/BB+/BBB
02.07.08
JSC NC
“KazMunayGas”
USD
1 600
9,125
July
2018
Baa3/BB+/BBB
8. Information on shares and dividends
following the results of 2006 the dividend amount per one ordinary share made up KZT 27.73, total receivedand paid dividends in the amount of KZT 8,766,059,040;
following the results of 2007 the dividend amount per one ordinary share made up KZT 92.40, total received
and paid dividends in the amount of KZT 29,209,331,;
following the results of 2008 the dividend amount per one ordinary share made up KZT 92.59, total received
and paid dividends in the amount of KZT 29,268,028 100;
following the results of 2009 the dividend amount per one ordinary share made up KZT 53, total received
and paid dividends in the amount of KZT 16, 940,104,;
following the results of 2010 the amount of dividend per one ordinary share was KZT 117, 68, total received
and paid dividends in the amount of KZT 45 796 382 550.
following the results of 2011 the amount of dividend per one ordinary share was KZT 293.35, total received
and paid dividends in the amount of KZT 143,201,087,066.
following the results of 2012 the amount of dividend per one ordinary share was KZT 75.19, total received
and paid dividends in the amount of KZT 38,961,363,784.
following the results of 2013 the amount of dividend per one ordinary share was KZT 158.08, total received
and paid dividends in the amount of KZT 69,577,485,076.
at the end of 2014 the amount of dividend per one ordinary share amounts to 53 tenge 24 tiyn, total
dividends to be paid amount to 31,104,442,350 tenge till 30 September 2015.
Quantity of the authorized shares of NC KMG amounts to 849,559,596 shares.
Quantity of the floated shares of NC KMG amounts to 584,207,465 shares.
Nominal value – KZT 500.
9. Financial Statement Analysis of “KazMunayGas”
10. vertical and horizontal analysis
НазваниеДенежные средства и их эквиваленты
Финансовые активы, имеющиеся в наличии для продажи
Производные финансовые инструменты
Финансовые активы, учитываемые по справедливой
стоимости через прибыли и убытки
Финансовые активы, удерживаемые до погашения
Прочие краткосрочные финансовые активы
Краткосрочная торговая и прочая дебиторская
задолженность
Текущий подоходный налог
Запасы
Прочие краткосрочные активы
Итого краткосрочных активов
Финансовые активы, имеющиеся в наличии для продажи
Производные финансовые инструменты
Финансовые активы, учитываемые по справедливой
стоимости через прибыли и убытки
Финансовые активы, удерживаемые до погашения
Прочие долгосрочные финансовые активы
Долгосрочная торговая и прочая дебиторская
задолженность
Инвестиции, учитываемые методом долевого участия
Инвестиционное имущество
Основные средства
2013
2014
I. Краткосрочные активы:
535 762 566 25,8
633 762 233
0,0
0,0
1 570 707
%
2015
%
Прирост
2013/2014
Прирост
2014/2015
29,89
0,00
0,07
436 743 120
19,85
0,00
0,08
18,29
0,00
0,00
-31,09
1 814 384
15,51
0,0
0,00
0,00
0,00
0,00
0,0
771 430 077 37,1
678 139 294
0,00
31,98
1 039 190 720
0,00
47,24
0,00
-12,09
0,00
53,24
247 237 152 11,9
250 336 242
11,81
251 165 091
11,42
1,25
0,33
43 168 694
2,04
200 893 287
9,47
312 699 048
14,75
2 120 569
2 078 190 736 100
505
100
II. Долгосрочные активы
0,00
0,00
0,00
0,00
46 062 957
224 361 995
200 602 153
2,09
10,20
9,12
-26,46
-1,34
19,60
6,70
11,68
-35,85
2 199 940 420
100
2,04
3,74
0,00
0,00
0,00
0,00
0,00
0,00
0,00
0,00
0,00
0,64
7,26
0,59
34,24
0,67
159,07
0,00
0,00
0,00
26,69
0,46
51,65
27,03
-1,94
18,77
23,82
-3,42
-29,55
0,00
0,00
0,00
3,53
3,53
2,00
4,25
25,38
0,44
26,76
10,68
-21,08
1,41
175,17
77,12
58 702 622 2,8
203 613 699 9,8
261 444 620 12,6
0,00
0,00
36 871 078 0,69
122 225 133 2,28
37 087 461
164 070 976
993 392 297 18,51
28 274 125 0,53
3 613 044 161 67,34
1 261 912 630
27 726 925
4 291 259 356
3,89
3,78
0,62
2,36
37 335 809
425 060 774
19,62
0,43
66,74
1 562 455 782
26 777 960
3 022 989 309
0,00
0,00
208 699 496
202 645 337
33 495 628
126 868 232
0,58
2,55
0,00
0,00
Биологические активы
Разведочные и оценочные активы
Нематериальные активы
Отложенные налоговые активы
Прочие долгосрочные активы
%
261 667 014
203 534 329
42 458 687
140 419 997
4,07
3,17
0,66
2,18
206 500 769
206 406 652
116 832 985
248 705 955
11.
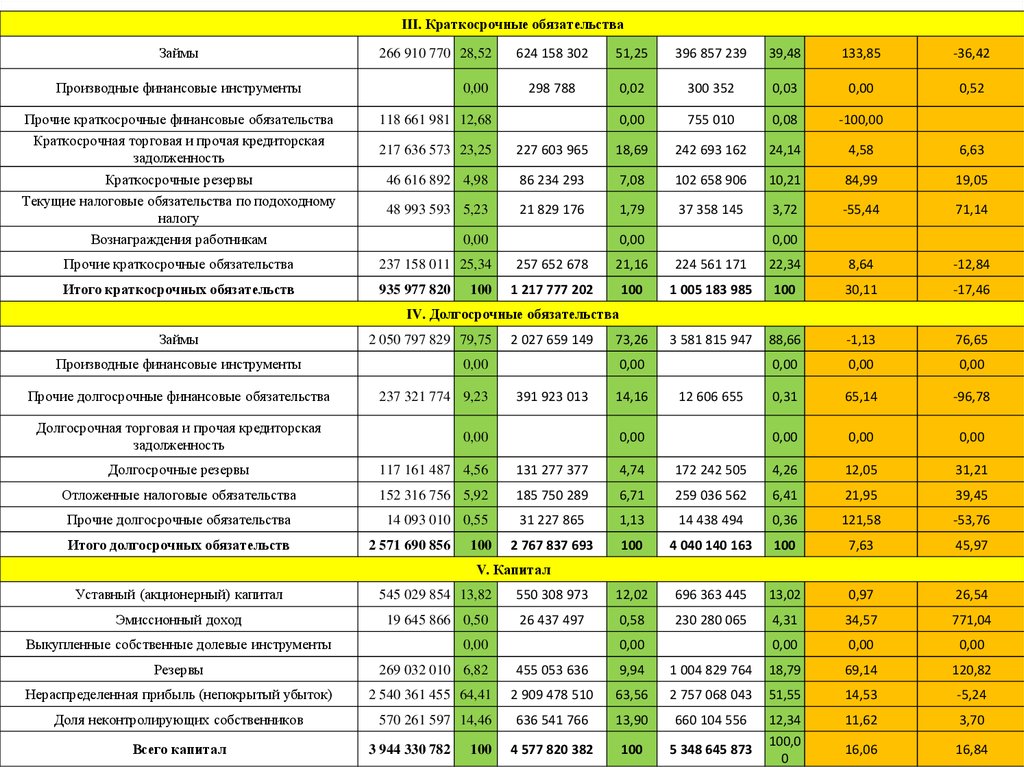
III. Краткосрочные обязательстваЗаймы
266 910 770 28,52
Производные финансовые инструменты
0,00
624 158 302
51,25
396 857 239
39,48
133,85
-36,42
298 788
0,02
300 352
0,03
0,00
0,52
0,00
755 010
0,08
-100,00
Прочие краткосрочные финансовые обязательства
118 661 981 12,68
Краткосрочная торговая и прочая кредиторская
задолженность
217 636 573 23,25
227 603 965
18,69
242 693 162
24,14
4,58
6,63
Краткосрочные резервы
46 616 892 4,98
86 234 293
7,08
102 658 906
10,21
84,99
19,05
Текущие налоговые обязательства по подоходному
налогу
48 993 593 5,23
21 829 176
1,79
37 358 145
3,72
-55,44
71,14
Вознаграждения работникам
0,00
0,00
Прочие краткосрочные обязательства
237 158 011 25,34
Итого краткосрочных обязательств
935 977 820
100
0,00
257 652 678
21,16
224 561 171
22,34
8,64
-12,84
1 217 777 202
100
1 005 183 985
100
30,11
-17,46
73,26
3 581 815 947
88,66
-1,13
76,65
0,00
0,00
0,00
0,31
65,14
-96,78
0,00
0,00
0,00
IV. Долгосрочные обязательства
Займы
2 050 797 829 79,75
Производные финансовые инструменты
Прочие долгосрочные финансовые обязательства
2 027 659 149
0,00
0,00
237 321 774 9,23
Долгосрочная торговая и прочая кредиторская
задолженность
391 923 013
14,16
12 606 655
0,00
0,00
Долгосрочные резервы
117 161 487 4,56
131 277 377
4,74
172 242 505
4,26
12,05
31,21
Отложенные налоговые обязательства
152 316 756 5,92
185 750 289
6,71
259 036 562
6,41
21,95
39,45
Прочие долгосрочные обязательства
14 093 010 0,55
31 227 865
1,13
14 438 494
0,36
121,58
-53,76
2 767 837 693
100
4 040 140 163
100
7,63
45,97
Итого долгосрочных обязательств
2 571 690 856
100
V. Капитал
Уставный (акционерный) капитал
545 029 854 13,82
550 308 973
12,02
696 363 445
13,02
0,97
26,54
Эмиссионный доход
19 645 866 0,50
26 437 497
0,58
230 280 065
4,31
34,57
771,04
0,00
0,00
0,00
Выкупленные собственные долевые инструменты
0,00
0,00
Резервы
269 032 010 6,82
455 053 636
9,94
1 004 829 764
18,79
69,14
120,82
Нераспределенная прибыль (непокрытый убыток)
2 540 361 455 64,41
2 909 478 510
63,56
2 757 068 043
51,55
14,53
-5,24
636 541 766
13,90
660 104 556
12,34
11,62
3,70
5 348 645 873
100,0
0
16,06
16,84
Доля неконтролирующих собственников
Всего капитал
570 261 597 14,46
3 944 330 782
100
4 577 820 382
100
12. Turnover ratio
2012COGS
Inventory
Average Inventory
Receivables
Average Receivables
Total revenue
Total assets
Average Total assets
Working capital
Average Working capital
89 854 875
250 336 242
2 400 138 545
6 833 721 423
902 792 303
2012
Inventory turnover
Receivables turnover
Total assets turnover
Working capital turnover
2013
1 087 961 654
91 507 234
90 681 055
284 447 047
267 391 645
2 127 460 318
7 558 185 840
7 195 953 632
1 004 196 608
953 494 456
2013
12,00
7,96
0,30
2,23
2014
1 093 791 099
110 052 511
100 779 873
251 165 091
267 806 069
2 046 860 424
8 838 840 866
8 198 513 353
1 194 756 435
1 099 476 522
2014
2015
1 106 561 311
88 709 365
99 380 938
202 622 353
226 893 722
2 388 614 543
10 709 657 658
9 774 249 262
1 029 983 326
1 112 369 881
2015
10,85
7,64
0,25
1,86
11,13
10,53
0,24
2,15
13.
Receivables turnoverInventory turnover
12,00
12,20
12,00
11,80
12,00
10,00
11,60
10,53
8,00
7,96
11,40
7,64
6,00
11,20
11,13
11,00
4,00
10,80
10,85
10,60
2,00
10,40
10,20
2013
2014
2015
2013
Total assets turnover
2014
2015
Working capital turnover
0,35
2,30
0,30
2,20
2,23
0,30
2,15
2,10
0,25
0,25
0,24
0,20
2,00
0,15
1,90
1,86
1,80
0,10
1,70
0,05
1,60
2013
2014
2015
2013
2014
2015
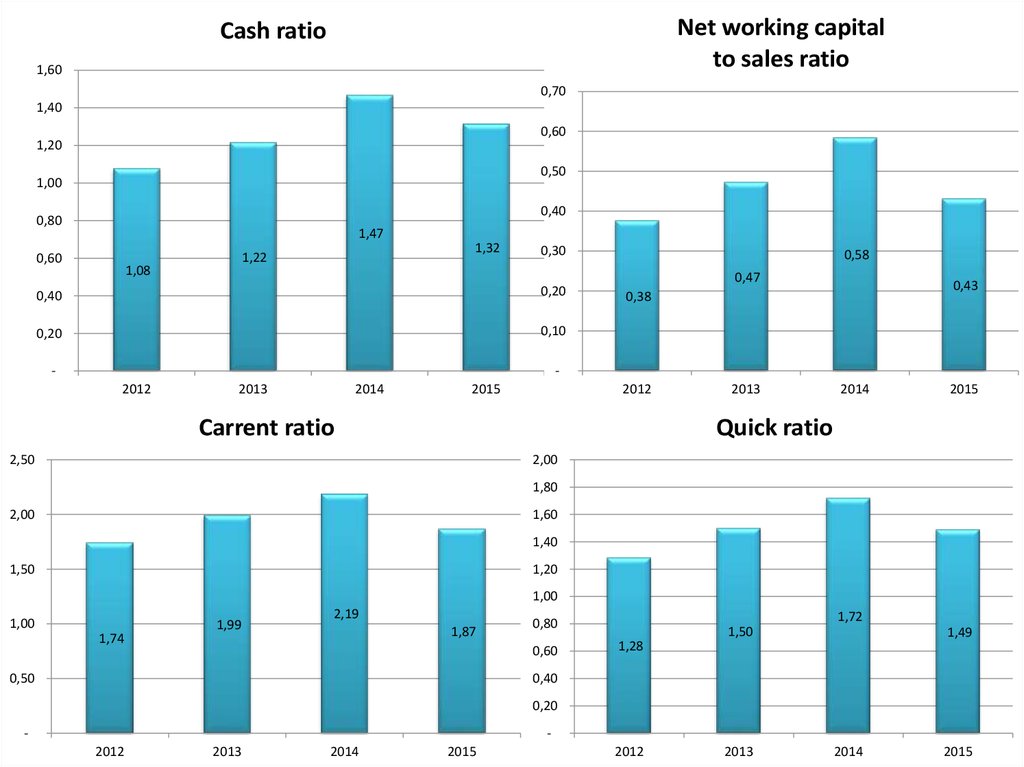
14. Liquidity Ratio
Net working capitalto sales ratio
Carrent ratio
Quick ratio
Cash ratio
2012
2013
0,38
1,74
1,28
1,08
0,47
1,99
1,50
1,22
2014
2015
0,58
2,19
1,72
1,47
0,43
1,87
1,49
1,32
Liquidity analysis
2,50
2,00
1,50
Net working capital
to sales ratio
1,00
Carrent ratio
0,50
-
Quick ratio
2012
2013
2014
2015
Net working capital
to sales ratio
0,38
0,47
0,58
0,43
Carrent ratio
1,74
1,99
2,19
1,87
Quick ratio
1,28
1,50
1,72
1,49
Cash ratio
1,08
1,22
1,47
1,32
Cash ratio
15.
Net working capitalto sales ratio
Cash ratio
1,60
0,70
1,40
0,60
1,20
0,50
1,00
0,40
0,80
1,47
0,60
1,32
1,22
1,08
0,30
0,40
0,20
0,20
0,10
-
2012
2013
2014
0,58
0,47
2012
2015
0,43
0,38
Carrent ratio
2013
2014
2015
Quick ratio
2,50
2,00
1,80
2,00
1,60
1,40
1,50
1,20
1,00
1,00
1,74
1,99
2,19
1,87
0,60
0,50
1,72
0,80
1,50
1,49
1,28
0,40
0,20
-
2012
2013
2014
2015
2012
2013
2014
2015
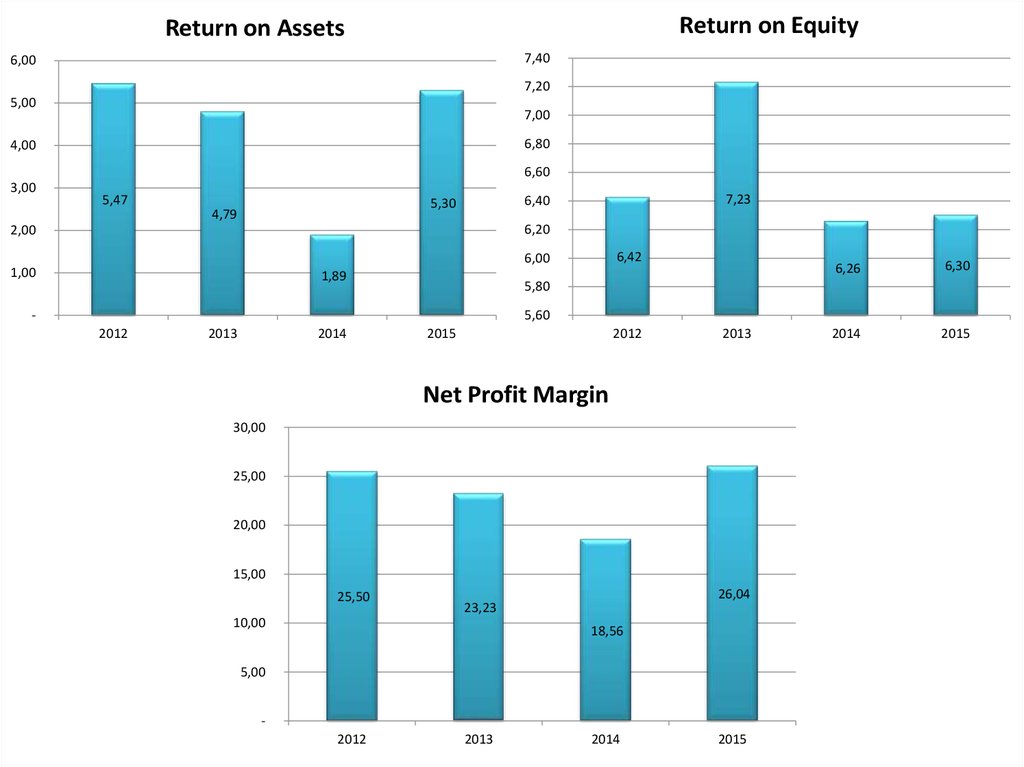
16. Profitability Ratio
20125,47
6,42
25,50
Profitability Ratio
Return on Assets
Return on Equity
Net Profit Margin
2013
4,79
7,23
23,23
2014
1,89
6,26
18,56
Profitability Ratio
30,00
25,00
20,00
15,00
10,00
5,00
-
2012
2013
2014
2015
Return on Assets
5,47
4,79
1,89
5,30
Return on Equity
6,42
7,23
6,26
6,30
Net Profit Margin
25,50
23,23
18,56
26,04
2015
5,30
6,30
26,04
17.
Return on EquityReturn on Assets
7,40
6,00
7,20
5,00
7,00
6,80
4,00
6,60
3,00
5,47
7,23
6,40
5,30
4,79
6,20
2,00
6,42
6,00
1,00
1,89
6,26
6,30
2014
2015
5,80
-
5,60
2012
2013
2014
2015
2012
2013
Net Profit Margin
30,00
25,00
20,00
15,00
25,50
26,04
23,23
10,00
18,56
5,00
2012
2013
2014
2015
18. Business Valuation of «Казмунайгаз»
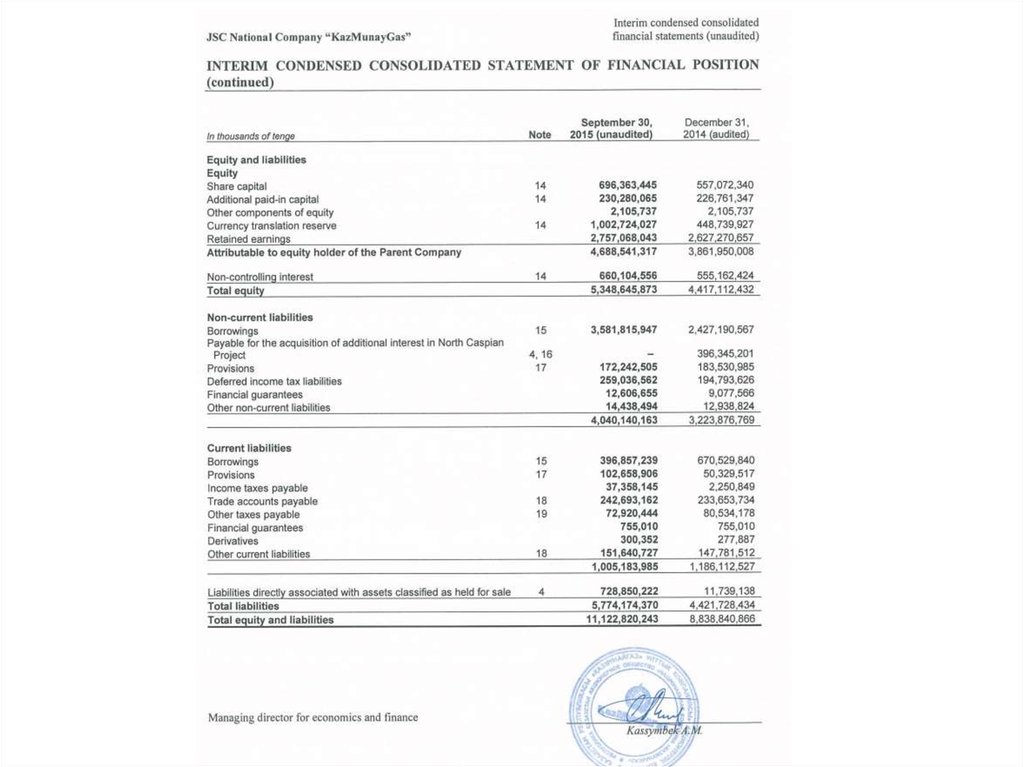
19. Balance Sheet
20.
21. Balance Sheet metod
Net assets=Total assets-Total liabilitiesNet assets(Company value)= 11 122
820 243 – (1 005 183 985 + 4 040 140
163) = 6 077 496 095
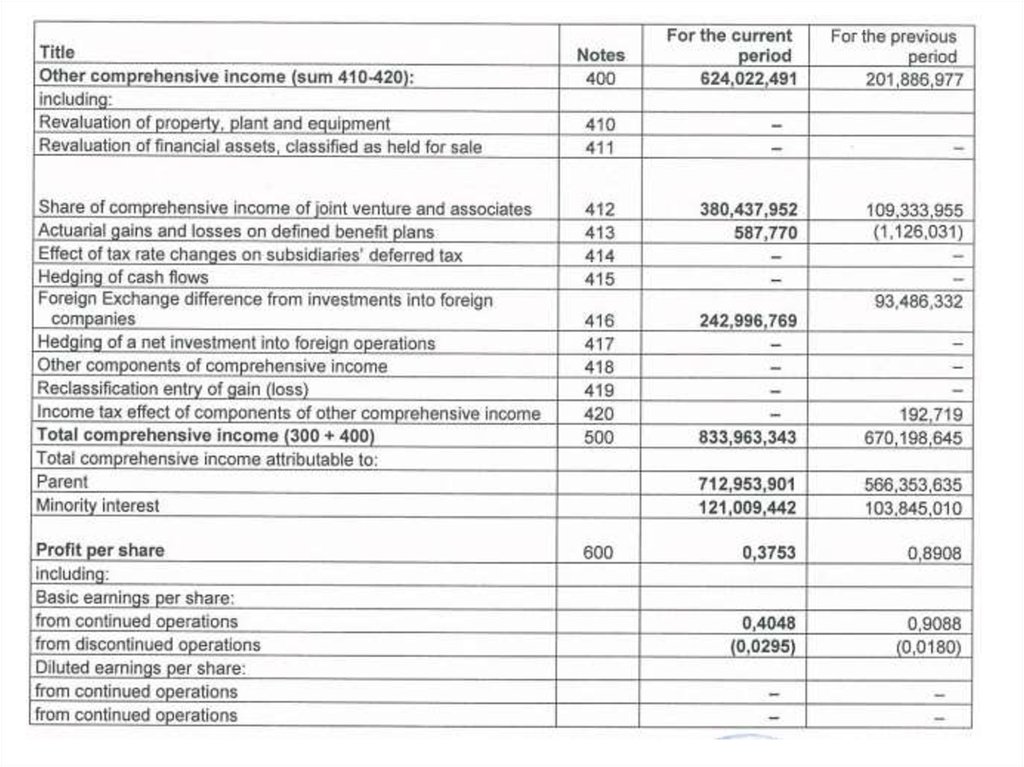
22. Income Statement
23.
24.
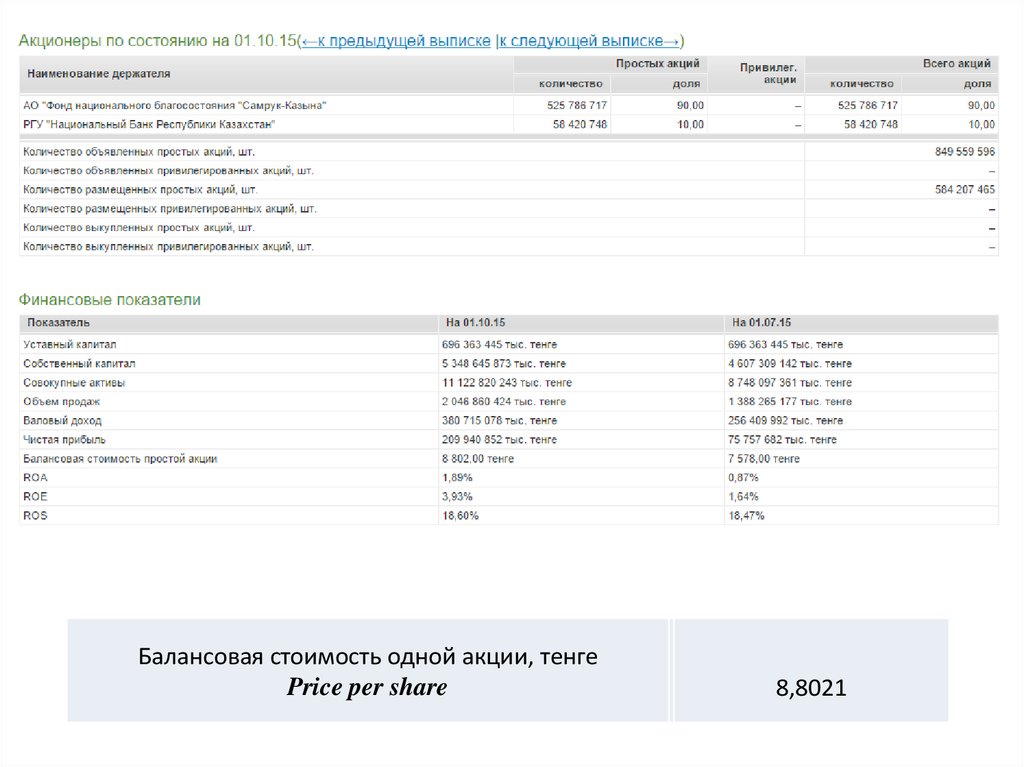
Балансовая стоимость одной акции, тенгеPrice per share
8,8021
25. Income statement metod
• Company value=net income*price earning ratio• Price earnig ratio= Price per share/earning per
share
• Earning per share=Net income/namber of common
share
• Earning per share= 209 940 852/849 559 596=0,25
• Price earnig ratio= 8,8021/0,25= 35,2084
• Company value=209 940 852*35,2084=7 391 681 494