 Экономика
Похожие презентации:


Malaysia Distribution Strategy Report
1.
Malaysia Distribution Strategy Report2023. 04
Global Distribution Strategy PJT
2.
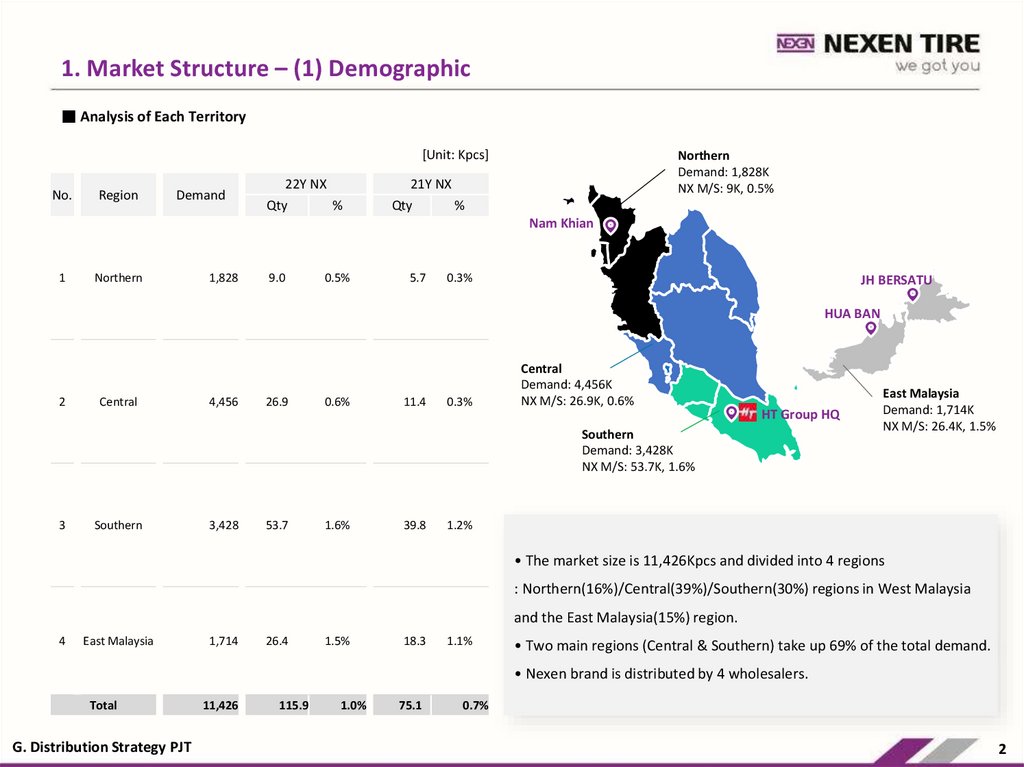
1. Market Structure – (1) Demographic■ Analysis of Each Territory
[Unit: Kpcs]
No.
Region
Demand
22Y NX
Qty
Northern
Demand: 1,828K
NX M/S: 9K, 0.5%
21Y NX
%
Qty
%
Nam Khian
1
Northern
1,828
9.0
0.5%
5.7
0.3%
JH BERSATU
HUA BAN
2
Central
4,456
26.9
0.6%
11.4
0.3%
Central
Demand: 4,456K
NX M/S: 26.9K, 0.6%
HT Group HQ
Southern
Demand: 3,428K
NX M/S: 53.7K, 1.6%
3
Southern
3,428
53.7
1.6%
39.8
East Malaysia
Demand: 1,714K
NX M/S: 26.4K, 1.5%
1.2%
• The market size is 11,426Kpcs and divided into 4 regions
: Northern(16%)/Central(39%)/Southern(30%) regions in West Malaysia
and the East Malaysia(15%) region.
4
East Malaysia
1,714
26.4
1.5%
18.3
1.1%
• Two main regions (Central & Southern) take up 69% of the total demand.
• Nexen brand is distributed by 4 wholesalers.
Total
G. Distribution Strategy PJT
11,426
115.9
1.0%
75.1
0.7%
2
3.
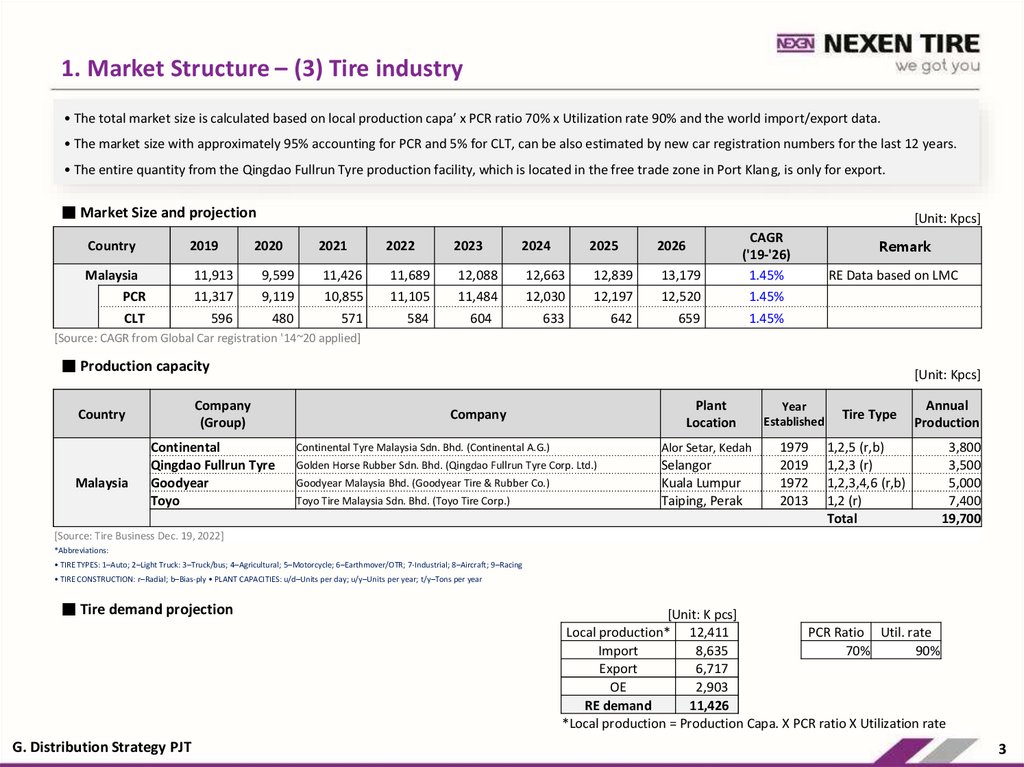
1. Market Structure – (3) Tire industry• The total market size is calculated based on local production capa’ x PCR ratio 70% x Utilization rate 90% and the world import/export data.
• The market size with approximately 95% accounting for PCR and 5% for CLT, can be also estimated by new car registration numbers for the last 12 years.
• The entire quantity from the Qingdao Fullrun Tyre production facility, which is located in the free trade zone in Port Klang, is only for export.
■ Market Size and projection
[Unit: Kpcs]
Country
2019
2020
2021
2022
2023
2024
2025
2026
Malaysia
11,913
9,599
11,426
11,689
12,088
12,663
12,839
13,179
CAGR
('19-'26)
1.45%
PCR
11,317
9,119
10,855
11,105
11,484
12,030
12,197
12,520
1.45%
CLT
596
480
571
584
604
633
642
659
1.45%
Remark
RE Data based on LMC
[Source: CAGR from Global Car registration '14~20 applied]
■ Production capacity
Company
(Group)
Country
Malaysia
Continental
Qingdao Fullrun Tyre
Goodyear
Toyo
[Unit: Kpcs]
Plant
Location
Year
Established
Continental Tyre Malaysia Sdn. Bhd. (Continental A.G.)
Alor Setar, Kedah
Golden Horse Rubber Sdn. Bhd. (Qingdao Fullrun Tyre Corp. Ltd.)
Selangor
Kuala Lumpur
Taiping, Perak
1979
2019
1972
2013
Company
Goodyear Malaysia Bhd. (Goodyear Tire & Rubber Co.)
Toyo Tire Malaysia Sdn. Bhd. (Toyo Tire Corp.)
Tire Type
Annual
Production
1,2,5 (r,b)
1,2,3 (r)
1,2,3,4,6 (r,b)
1,2 (r)
Total
3,800
3,500
5,000
7,400
19,700
[Source: Tire Business Dec. 19, 2022]
*Abbreviations:
• TIRE TYPES: 1–Auto; 2–Light Truck: 3–Truck/bus; 4–Agricultural; 5–Motorcycle; 6–Earthmover/OTR; 7-Industrial; 8–Aircraft; 9–Racing
• TIRE CONSTRUCTION: r–Radial; b–Bias-ply • PLANT CAPACITIES: u/d–Units per day; u/y–Units per year; t/y–Tons per year
■ Tire demand projection
G. Distribution Strategy PJT
[Unit: K pcs]
Local production* 12,411
PCR Ratio Util. rate
Import
8,635
70%
90%
Export
6,717
OE
2,903
RE demand
11,426
*Local production = Production Capa. X PCR ratio X Utilization rate
3
4.
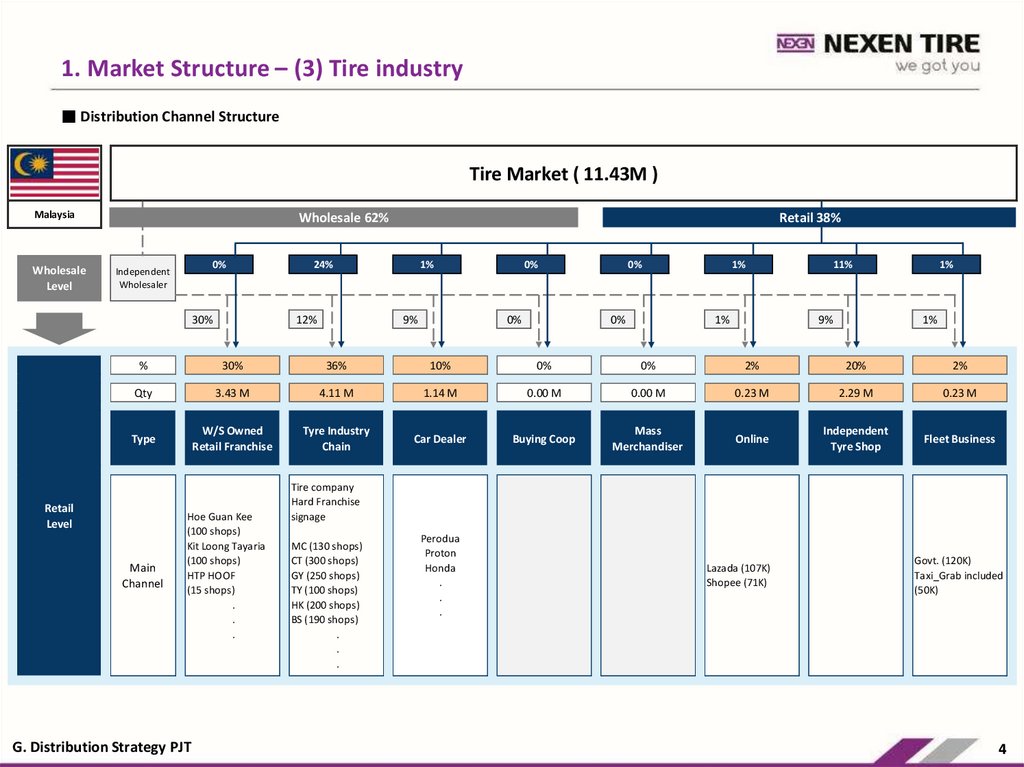
1. Market Structure – (3) Tire industry■ Distribution Channel Structure
Tire Market ( 11.43M )
Malaysia
Wholesale
Level
Wholesale 62%
0%
Independent
Wholesaler
30%
Retail 38%
24%
12%
1%
9%
0%
0%
0%
0%
1%
1%
11%
9%
1%
1%
%
30%
36%
10%
0%
0%
2%
20%
2%
Qty
3.43 M
4.11 M
1.14 M
0.00 M
0.00 M
0.23 M
2.29 M
0.23 M
Type
W/S Owned
Retail Franchise
Tyre Industry
Chain
Car Dealer
Buying Coop
Mass
Merchandiser
Online
Independent
Tyre Shop
Fleet Business
Retail
Level
Main
Channel
Hoe Guan Kee
(100 shops)
Kit Loong Tayaria
(100 shops)
HTP HOOF
(15 shops)
.
.
.
G. Distribution Strategy PJT
Tire company
Hard Franchise
signage
MC (130 shops)
CT (300 shops)
GY (250 shops)
TY (100 shops)
HK (200 shops)
BS (190 shops)
.
.
.
Perodua
Proton
Honda
.
.
.
Lazada (107K)
Shopee (71K)
Govt. (120K)
Taxi_Grab included
(50K)
4
5.
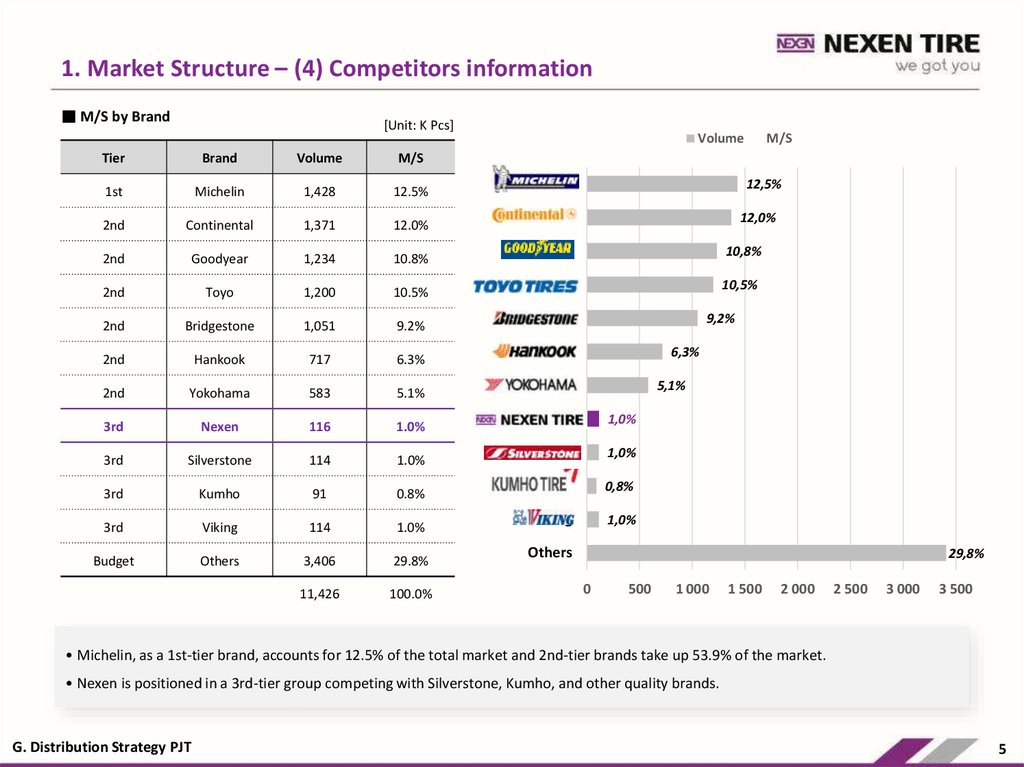
1. Market Structure – (4) Competitors information■ M/S by Brand
[Unit: K Pcs]
Tier
Brand
Volume
M/S
1st
Michelin
1,428
12.5%
2nd
Continental
1,371
12.0%
2nd
Goodyear
1,234
10.8%
2nd
Toyo
1,200
10.5%
2nd
Bridgestone
1,051
9.2%
2nd
Hankook
717
6.3%
2nd
Yokohama
583
5.1%
3rd
Nexen
116
1.0%
3rd
Silverstone
114
1.0%
3rd
Kumho
91
0.8%
3rd
Viking
114
1.0%
Budget
Others
3,406
29.8%
11,426
100.0%
Volume
M/S
Michelin
12,5%
Continental
12,0%
Goodyear
10,8%
Toyo
10,5%
Bridgestone
9,2%
Hankook
6,3%
Yokohama
5,1%
Nexen
1,0%
Silverstone
1,0%
Kumho
0,8%
Viking
1,0%
Others
29,8%
0
500
1 000
1 500
2 000
2 500
3 000
3 500
• Michelin, as a 1st-tier brand, accounts for 12.5% of the total market and 2nd-tier brands take up 53.9% of the market.
• Nexen is positioned in a 3rd-tier group competing with Silverstone, Kumho, and other quality brands.
G. Distribution Strategy PJT
5
6.
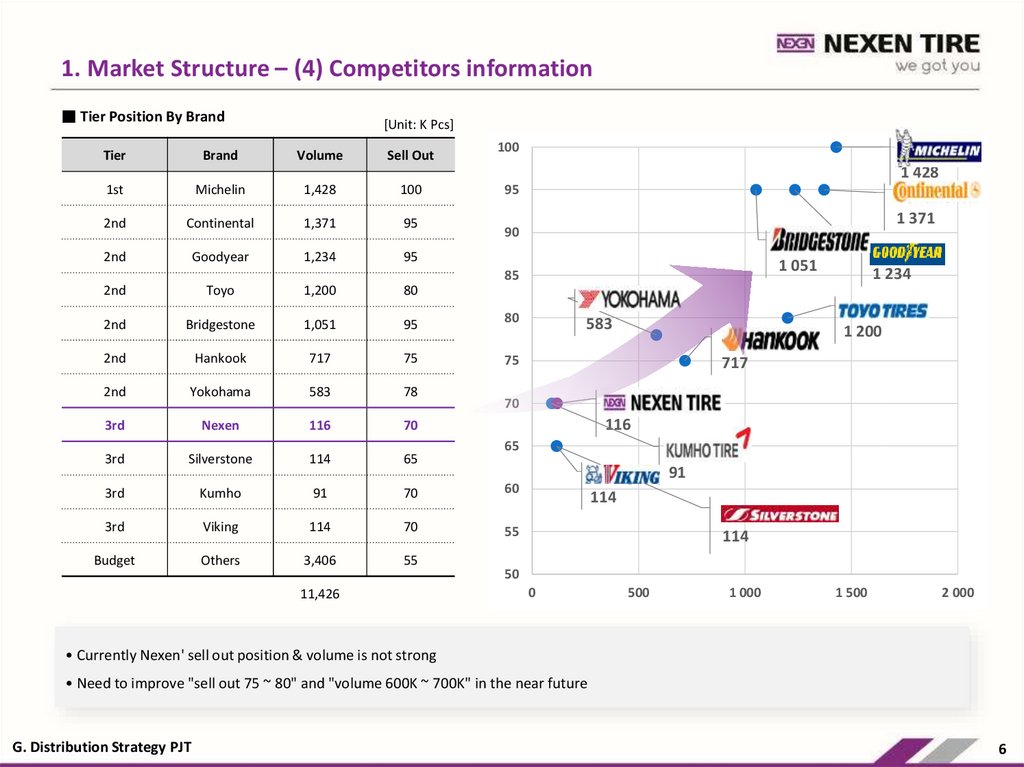
1. Market Structure – (4) Competitors information■ Tier Position By Brand
[Unit: K Pcs]
100
Tier
Brand
Volume
Sell Out
1st
Michelin
1,428
100
2nd
Continental
1,371
95
2nd
Goodyear
1,234
95
2nd
Toyo
1,200
80
2nd
Bridgestone
1,051
95
80
2nd
Hankook
717
75
75
2nd
Yokohama
583
78
3rd
Nexen
116
70
3rd
Silverstone
114
65
3rd
Kumho
91
70
60
3rd
Viking
114
70
55
Budget
Others
3,406
55
Michelin
1 428
Continental
1 371
95
90
Bridgestone
Goodyear
1 051
1 234
85
11,426
Yokohama
583
Hankook
717
Toyo
1 200
Nexen
116
70
65
Viking
114
Kumho
91
Silverstone
114
50
0
500
1 000
1 500
2 000
• Currently Nexen' sell out position & volume is not strong
• Need to improve "sell out 75 ~ 80" and "volume 600K ~ 700K" in the near future
G. Distribution Strategy PJT
6
7.
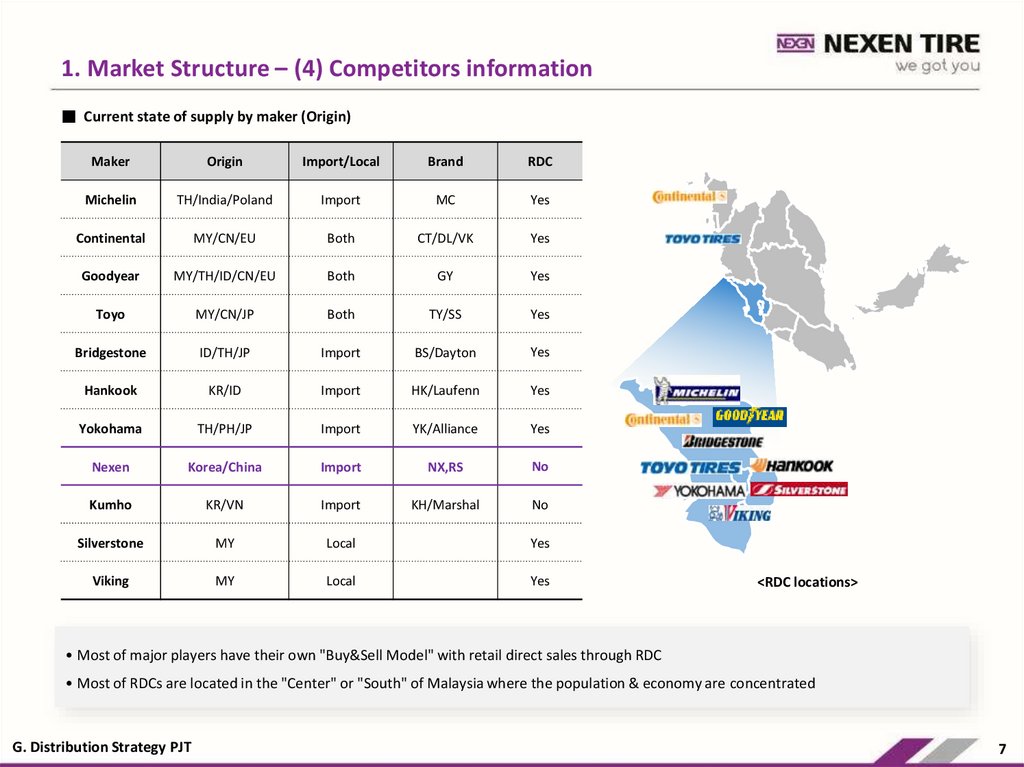
1. Market Structure – (4) Competitors information■ Current state of supply by maker (Origin)
Maker
Origin
Import/Local
Brand
RDC
Michelin
TH/India/Poland
Import
MC
Yes
Continental
MY/CN/EU
Both
CT/DL/VK
Yes
Goodyear
MY/TH/ID/CN/EU
Both
GY
Yes
Toyo
MY/CN/JP
Both
TY/SS
Yes
Bridgestone
ID/TH/JP
Import
BS/Dayton
Yes
Hankook
KR/ID
Import
HK/Laufenn
Yes
Yokohama
TH/PH/JP
Import
YK/Alliance
Yes
Nexen
Korea/China
Import
NX,RS
No
Kumho
KR/VN
Import
KH/Marshal
No
Silverstone
MY
Local
Yes
Viking
MY
Local
Yes
<RDC locations>
• Most of major players have their own "Buy&Sell Model" with retail direct sales through RDC
• Most of RDCs are located in the "Center" or "South" of Malaysia where the population & economy are concentrated
G. Distribution Strategy PJT
7
8.
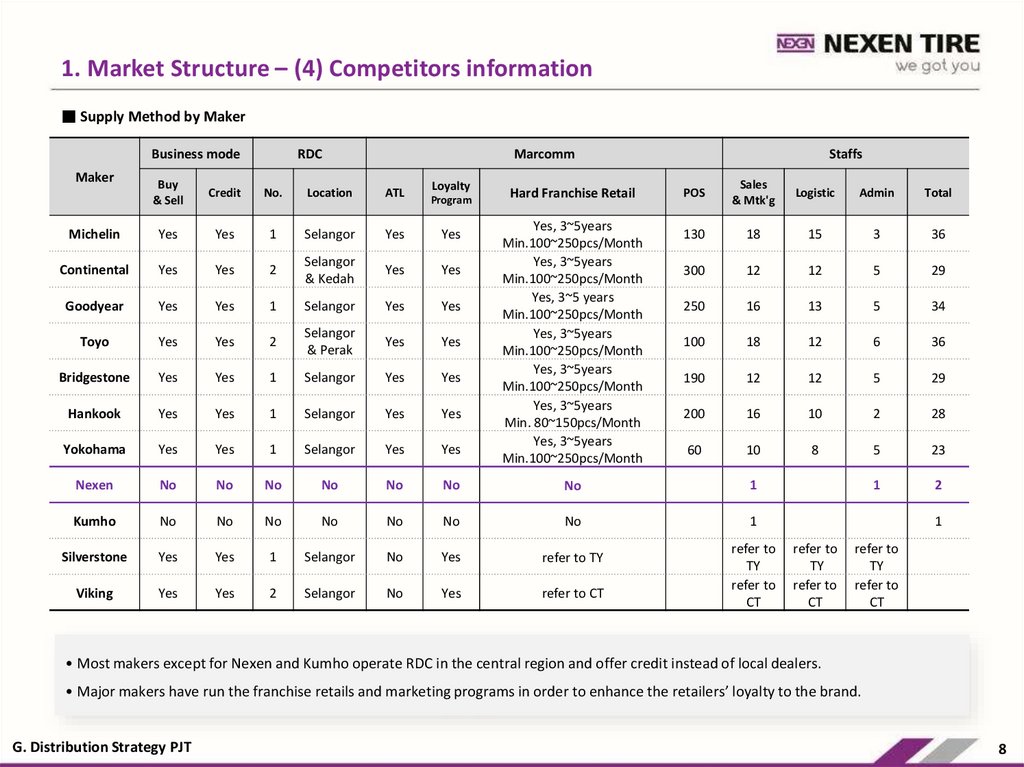
1. Market Structure – (4) Competitors information■ Supply Method by Maker
Business mode
Maker
RDC
Marcomm
Staffs
Buy
& Sell
Credit
No.
Location
ATL
Michelin
Yes
Yes
1
Selangor
Yes
Yes
Continental
Yes
Yes
2
Selangor
& Kedah
Yes
Yes
Goodyear
Yes
Yes
1
Selangor
Yes
Yes
Toyo
Yes
Yes
2
Selangor
& Perak
Yes
Yes
Bridgestone
Yes
Yes
1
Selangor
Yes
Yes
Hankook
Yes
Yes
1
Selangor
Yes
Yes
Yokohama
Yes
Yes
1
Selangor
Yes
Yes
Nexen
No
No
No
No
No
No
No
1
Kumho
No
No
No
No
No
No
No
1
Silverstone
Yes
Yes
1
Selangor
No
Yes
refer to TY
Viking
Yes
Yes
2
Selangor
No
Yes
refer to CT
Loyalty
Program
Hard Franchise Retail
Yes, 3~5years
Min.100~250pcs/Month
Yes, 3~5years
Min.100~250pcs/Month
Yes, 3~5 years
Min.100~250pcs/Month
Yes, 3~5years
Min.100~250pcs/Month
Yes, 3~5years
Min.100~250pcs/Month
Yes, 3~5years
Min. 80~150pcs/Month
Yes, 3~5years
Min.100~250pcs/Month
POS
Sales
& Mtk'g
Logistic
Admin
Total
130
18
15
3
36
300
12
12
5
29
250
16
13
5
34
100
18
12
6
36
190
12
12
5
29
200
16
10
2
28
60
10
8
5
23
1
2
refer to
TY
refer to
CT
1
refer to
TY
refer to
CT
refer to
TY
refer to
CT
• Most makers except for Nexen and Kumho operate RDC in the central region and offer credit instead of local dealers.
• Major makers have run the franchise retails and marketing programs in order to enhance the retailers’ loyalty to the brand.
G. Distribution Strategy PJT
8