


 Биология
Похожие презентации:


. Occurrence and classification")


Role of plants in disease treatment
1.
8% 9%8%
1st Qtr
2nd Qtr
302: Biochemistry
3rd Qtr
4th Qtr
75%
ROLE OF PLANTS
IN DISEASE TREATMENT
Research Findings
Include your name and
The date of the presentation
2.
IntroductionIntroduce your research project and the scope of the
assignment to your classmates and teacher.
THIS STUDY IS AIMED AT DEMONSTRATING WHICH PLANTS
ARE MOST EFFECTIVE IN THE TREATMENT OF DISEASES.
Testing and analysis of various plant species
3.
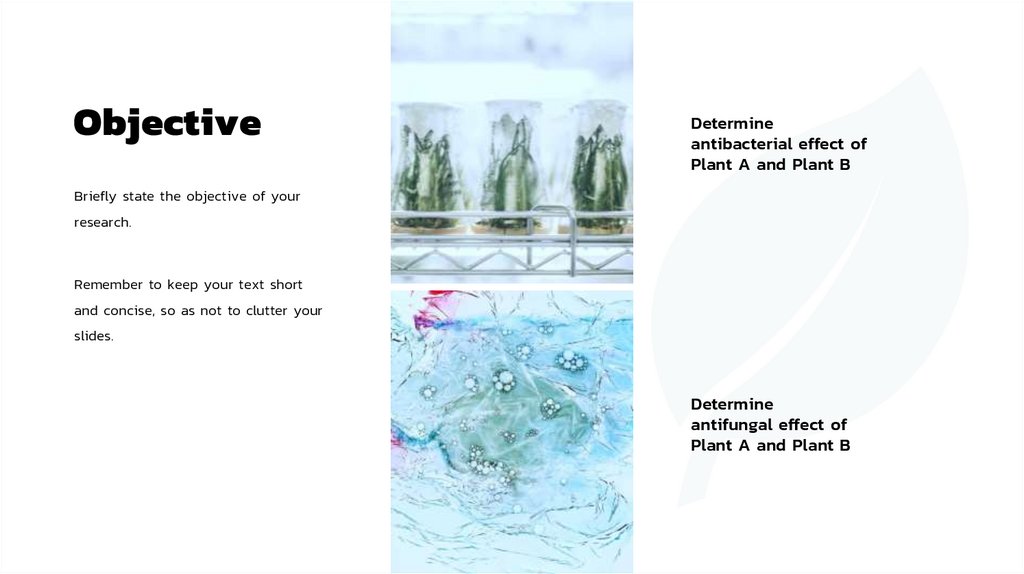
ObjectiveDetermine
antibacterial effect of
Plant A and Plant B
Briefly state the objective of your
research.
Remember to keep your text short
and concise, so as not to clutter your
slides.
Determine
antifungal effect of
Plant A and Plant B
4.
HypothesisPlant A will demonstrate more positive results in the treatment of bacterial
diseases, while Plant B will be more beneficial in the treatment of fungal
diseases.
5.
ParticipantsAudiences respond well to visuals. Include images of any individuals who participated in the research findings.
Briefly explain what their primary role was throughout the project, if applicable.
John Doe
Participant 1
James Doe
Participant 2
Joe Doe
Participant 3
Brief description of
Brief description of
Brief description of
what this person does
what this person does
what this person does
for the project.
for the project.
for the project.
6.
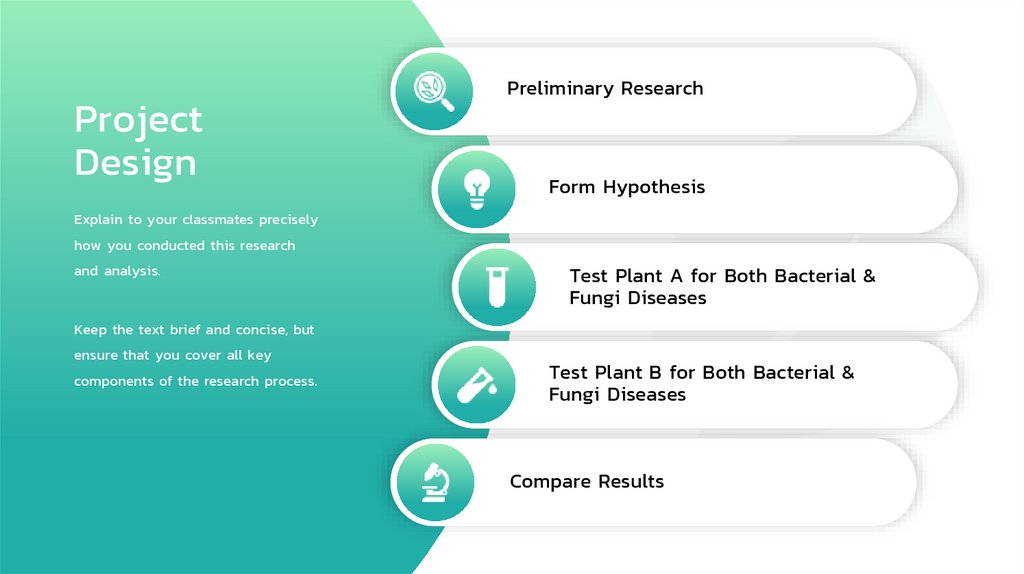
ProjectDesign
Preliminary Research
Form Hypothesis
Explain to your classmates precisely
how you conducted this research
and analysis.
Test Plant A for Both Bacterial &
Fungi Diseases
Keep the text brief and concise, but
ensure that you cover all key
components of the research process.
Test Plant B for Both Bacterial &
Fungi Diseases
Compare Results
7.
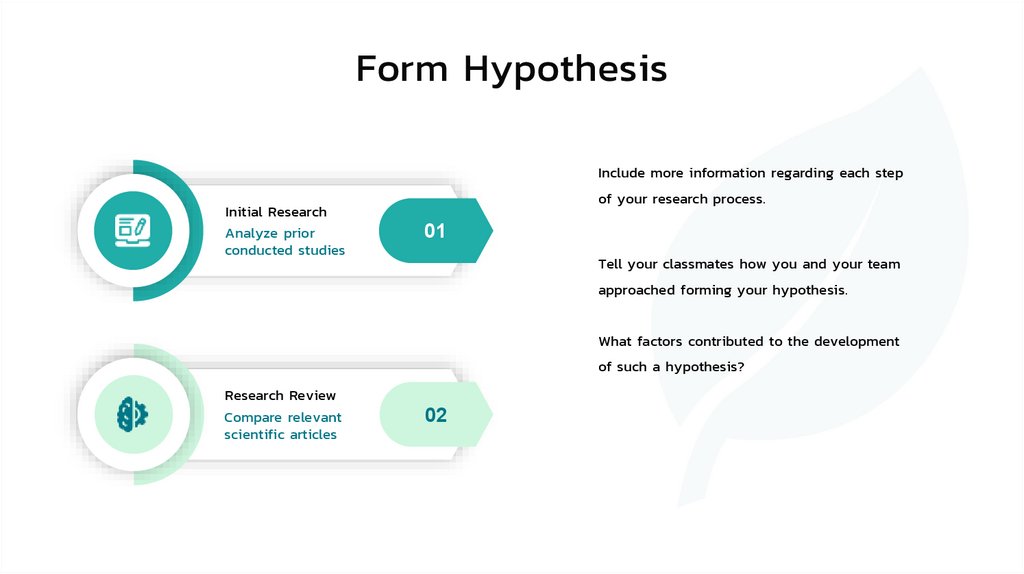
Form HypothesisInclude more information regarding each step
of your research process.
Initial Research
Analyze prior
conducted studies
01
Tell your classmates how you and your team
approached forming your hypothesis.
What factors contributed to the development
of such a hypothesis?
Research Review
Compare relevant
scientific articles
02
8.
DiscussionShare any thoughts that you
and your team had regarding
Why did Plant A prove more
effective to treatment of bacterial
diseases?
these research findings.
Does Plant B offer any benefits to bacterial
This discussion can include
disease treatment?
any initial questions that you
answered throughout your
research, as well as any key
Both Plant A and Plant B used
messages that you took away
medicinally, today
from the findings.
9.
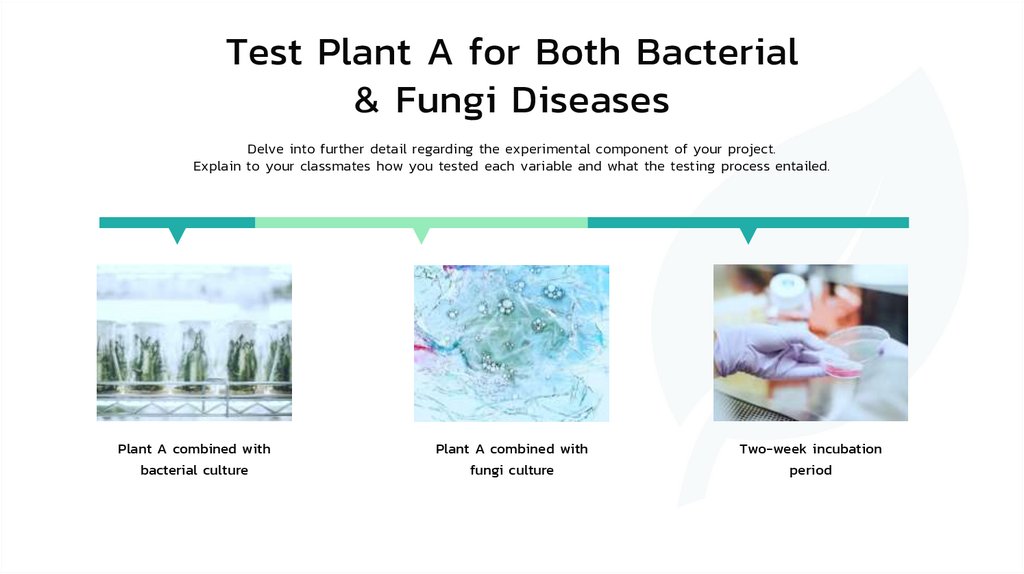
Test Plant A for Both Bacterial& Fungi Diseases
Delve into further detail regarding the experimental component of your project.
Explain to your classmates how you tested each variable and what the testing process entailed.
Plant A combined with
Plant A combined with
Two-week incubation
bacterial culture
fungi culture
period
10.
CompareResults
Charts and graphs are great tools
to deliver your findings and any
6
6
5
5
4
4
key figures.
a
3
Use this chart to illustrate how
you and your team compared the
3
b
c
2
2
1
final results of your project.
1
0
1
0
1
2
3
4
2
a
3
b
Ряд 3
4
11.
Eye Contact Improves EngagementKnow Your Audience
Keep Your Core Message in Mind
Tailor your slideshow to your audience’s
You have a lot of knowledge to share.
needs. Consider their level of familiarity
Decide which points you most want
with the subject matter, industry jargon,
your audience to remember after they
and background.
leave.
If you’re using language they are likely to
Write your presentation with those
be unfamiliar with, offer definitions so they
points in mind, so your most important
don’t feel lost.
message is clear and memorable.
12.
METHODS/SLIDE DIVIDERUse this slide as a divider to introduce the next section that will detail research
methods and materials used.
13.
Data at aGlance
Leverage visuals
Show your data visually. Charts let your audience
understand the numbers at a glance, so you can
present a lot of information without breaking
pace.
Pull out and highlight the most compelling data
points.
Add a line or two about your analysis or how
this influences your plan or proposal.
1
2
3
4
14.
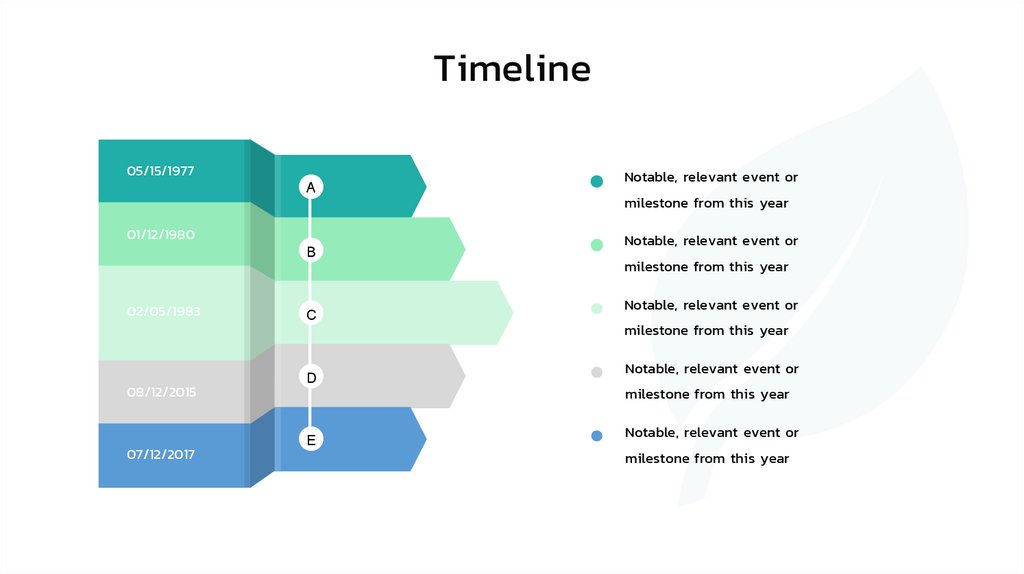
Timeline05/15/1977
A
01/12/1980
B
02/05/1983
08/12/2015
07/12/2017
C
D
E
Notable, relevant event or
milestone from this year
Notable, relevant event or
milestone from this year
Notable, relevant event or
milestone from this year
Notable, relevant event or
milestone from this year
Notable, relevant event or
milestone from this year
15.
StorytellingAudiences respond well to stories. Look for a narrative
thread behind your presentation content and consider
presenting your information beginning-to-end. Follow
a situation to its consequences or a problem to its
solution.
Weave the thread throughout your presentation. This
will help it feel cohesive and make it easier to follow
than a jumble of disjointed slides.
16.
StoryboardCompelling visuals are crucial.
Choose simple, clean images that will draw attention without distracting from your presentation.
17.
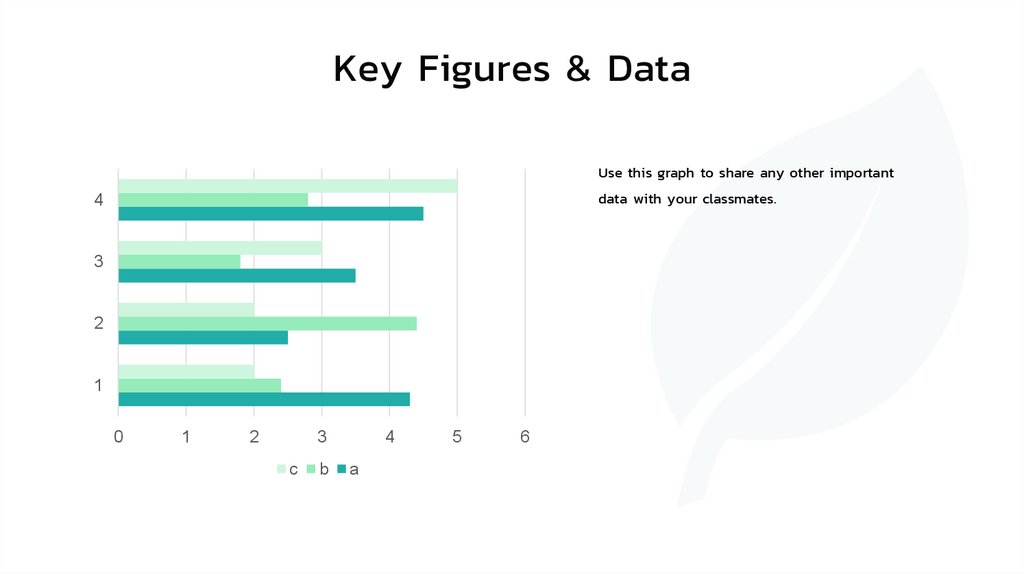
Key Figures & DataUse this graph to share any other important
data with your classmates.
4
3
2
1
0
1
2
3
c
b
4
a
5
6
18.
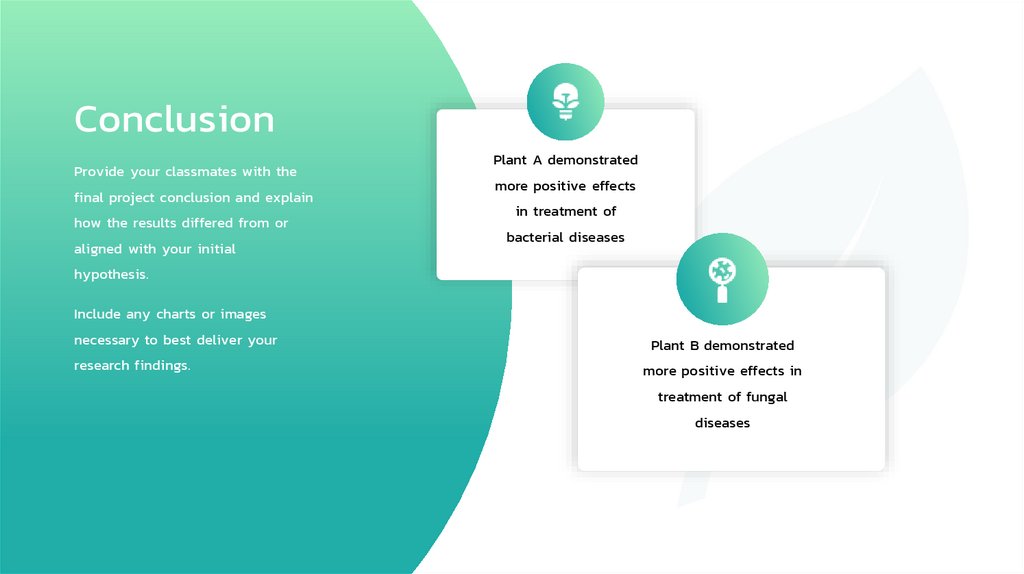
ConclusionProvide your classmates with the
final project conclusion and explain
how the results differed from or
aligned with your initial
Plant A demonstrated
more positive effects
in treatment of
bacterial diseases
hypothesis.
Include any charts or images
necessary to best deliver your
Plant B demonstrated
research findings.
more positive effects in
treatment of fungal
diseases
19.
THANK YOU!Thank your classmates for their time and attention. Welcome any questions
that they or your teacher may have regarding your findings.
20.
ContactParting Thoughts
Leave your audience with a quick final thought that
encapsulates you, your company, or this presentation.
Website
www.company.com
Phone
+123 456 789 101
name@company.com