


 География
Похожие презентации:


Climate Workshop
1.
Climate Workshop2.
Developed by:3.
Agenda:1. Introduction
2. Scenarios of
Climate Success
3. Debrief
4.
Introduction5.
En-ROADS is a cutting-edge simulation model used to test climate solutions and generate climate scenariosfor the future.
6.
7.
En-ROADS simulations:Over 135,000 participants in 95 countries
As of May 2022
8.
Let’s briefly review the science and what’s at stake….9.
Carbon dioxide concentration(parts per million)
Atmospheric CO2 is higher than any time in that last 800,000 years, and levels are increasing
faster than any time in millions of years.
480
460
440
420
400
380
360
340
320
300
280
260
240
220
200
180
160
Current
level
(2019)
For millennia, CO2 has never been above this line:
800000
Source: NASA
700000
600000
500000
400000
300000
Years before 1950
200000
1950
level
100000
0
10.
CO2 Emissions (Gtons CO2/year)CO2 Emissions by Source
Source: Carbon Dioxide
Information Analysis Center (CDIAC)
Others = Emissions from cement production and gas flaring
11.
Greenhouse Gas Emissions (Gtons CO2-eq/year)Total Annual Global Greenhouse Gas Emissions by Gas
60
2% F-gases
50
5% N2O
18% CH4
40
7% CO2 from land use
and forestry
30
20
10
68% CO2 from fossil fuels
0
1850 1865 1880 1895 1910 1925 1940 1955 1970 1985 2000 2015
Source: C-ROADS
12.
Global Temperature Change from Preindustrial (°C)Temperature Anomaly (°C)
°F
1,5
2.7
1
1.8
Historical Dataset:
Med Office HadCRUT5
0,5
0.9
NASA GISTEMP v4
0
0
-0,5
-0.9
1850
Source: C-ROADS
1870
1890
1910
1930
1950
1970
1990
2010
13.
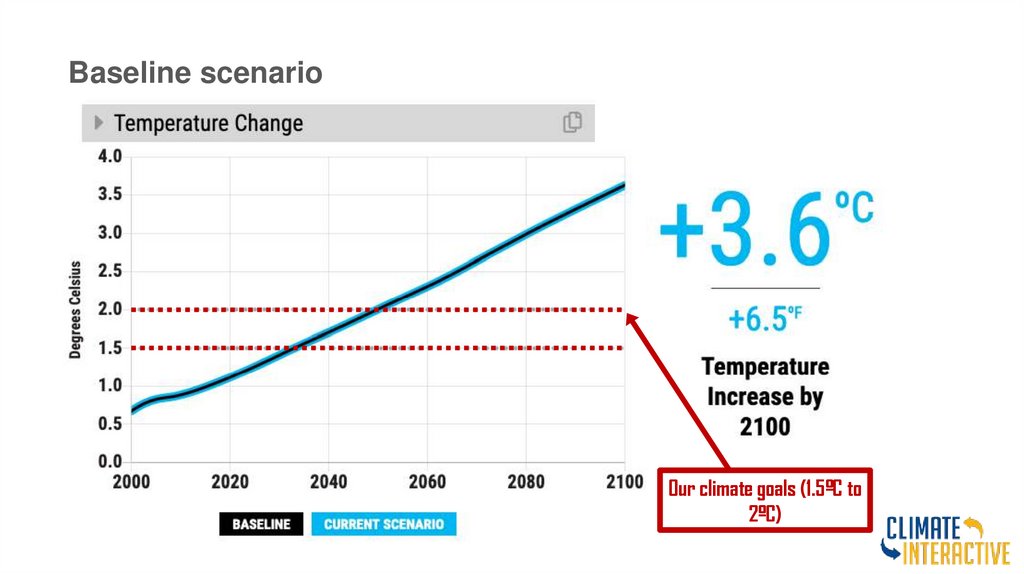
Baseline scenarioOur climate goals (1.5ºC to
2ºC)
14.
What would 3+ °C (or 5.4+ °F) of warming mean?Arctic sea ice is gone in 2 out of every 3 summers1
50% of insect species lose >50% of their habitat range2
Drought: 11 months longer
Increase in average drought length3
Area burned by summer wildfires in Mediterranean doubles4
Compared to today
See the impacts of your scenario in the Impacts graph section of En-ROADS
15.
Hanoi, Vietnam:3.6°C
Flood risk from sea
level rise by 2100
Source: En-ROADS & Climate Central
16.
Hanoi, Vietnam:3.6°C
Flood risk from sea
level rise over next
few centuries
Source: En-ROADS & Climate Central
Use En-ROADS to create a scenario that
lowers this sea level rise. View the map
under “Impacts” in the Graphs menu.
17.
Dubai today18.
Dubai todaySource: Climate Central
…and with 3°C of warming
19.
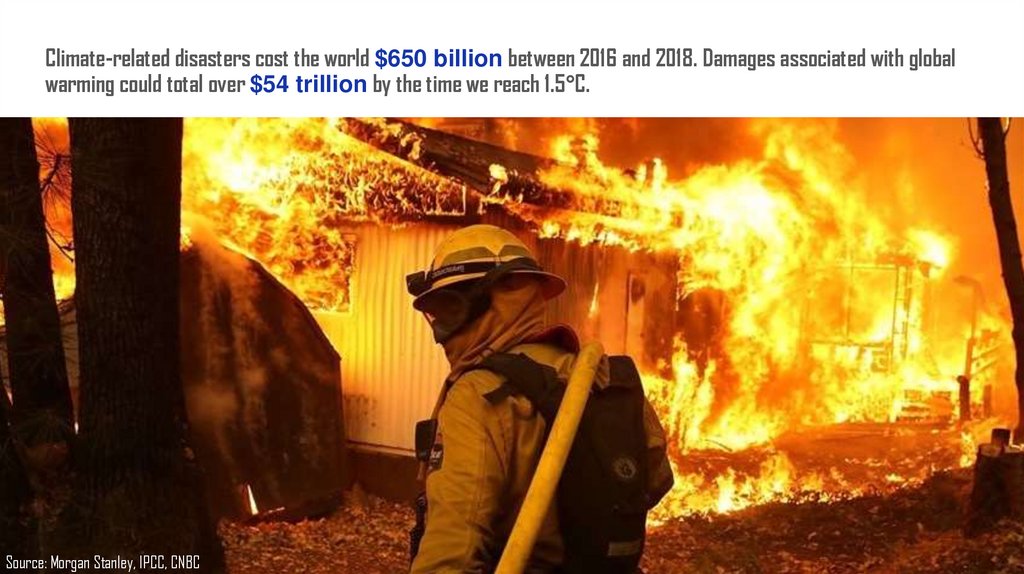
Climate-related disasters cost the world $650 billion between 2016 and 2018. Damages associated with globalwarming could total over $54 trillion by the time we reach 1.5°C.
Source: Morgan Stanley, IPCC, CNBC
20.
Scenarios of ClimateSuccess
21.
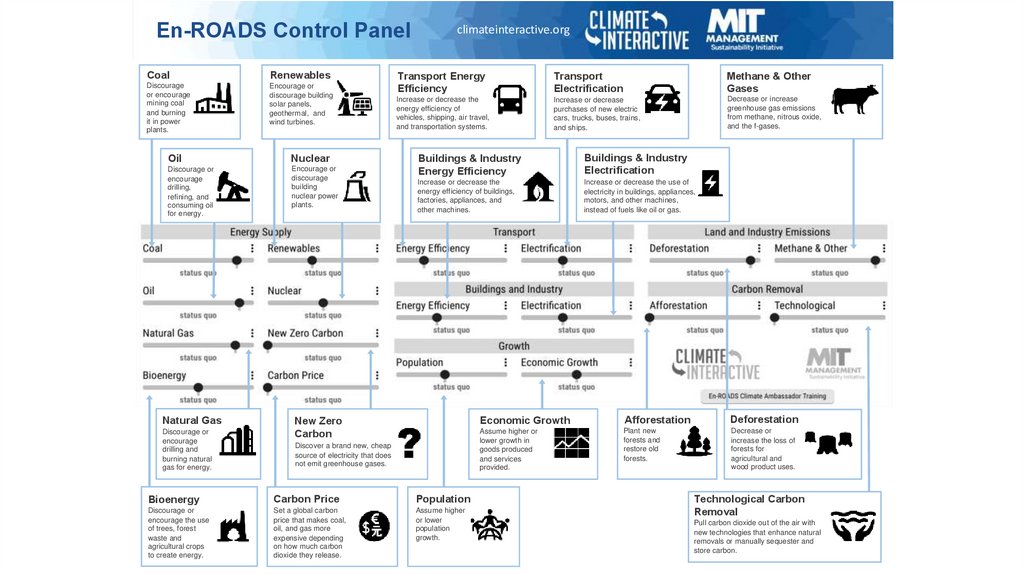
En-ROADS Control PanelCoal
Renewables
Discourage
or encourage
mining coal
and burning
it in power
plants.
Encourage or
discourage building
solar panels,
geothermal, and
wind turbines.
Oil
Nuclear
Discourage or
encourage
drilling,
refining, and
consuming oil
for energy.
Encourage or
discourage
building
nuclear power
plants.
Natural Gas
New Zero
Carbon
Discourage or
encourage
drilling and
burning natural
gas for energy.
climateinteractive.org
Transport Energy
Efficiency
Transport
Electrification
Methane & Other
Gases
Increase or decrease the
energy efficiency of
vehicles, shipping, air travel,
and transportation systems.
Increase or decrease
purchases of new electric
cars, trucks, buses, trains,
and ships.
Decrease or increase
greenhouse gas emissions
from methane, nitrous oxide,
and the f-gases.
Buildings & Industry
Energy Efficiency
Buildings & Industry
Electrification
Increase or decrease the
energy efficiency of buildings,
factories, appliances, and
other machines.
Increase or decrease the use of
electricity in buildings, appliances,
motors, and other machines,
instead of fuels like oil or gas.
Discover a brand new, cheap
source of electricity that does
not emit greenhouse gases.
Bioenergy
Carbon Price
Population
Discourage or
encourage the use
of trees, forest
waste and
agricultural crops
to create energy.
Set a global carbon
price that makes coal,
oil, and gas more
expensive depending
on how much carbon
dioxide they release.
Assume higher
or lower
population
growth.
Economic Growth
Afforestation
Deforestation
Assume higher or
lower growth in
goods produced
and services
provided.
Plant new
forests and
restore old
forests.
Decrease or
increase the loss of
forests for
agricultural and
wood product uses.
Technological Carbon
Removal
Pull carbon dioxide out of the air with
new technologies that enhance natural
removals or manually sequester and
store carbon.
22.
Your ActionsWhat actions have you or your organization done in the last five years to help
mitigate climate change?
23.
What else would it take to limit warming to less than 2 °C or even 1.5 °C?24.
Multisolving LensConsider:
• A near-term co-benefit from your proposal. How can you address more than one
problem with one action?
25.
Multisolving LensConsider:
• In what ways could implementation of this policy harm vulnerable communities?
26.
Debrief27.
ReflectionThink of something you would love about being part of this sort of future.
Take one minute of silence to reflect on your experience.
28.
How are you feeling?29.
Debriefing Discussion• What surprised you?
• What were your key insights?
• What will you take away from today, and how can you apply what
you learned to the real world?
30.
Looking ahead• We have the tools
• Solar and wind are growing and getting cheaper
• Corporations are investing in clean tech
• Countries and states are stepping up
• The general public is becoming more educated and engaged
31.
Companies are starting to take actionClothing brand
H&M has promised
to double its
energy efficiency
by 2030.
Over 260 of the world’s
largest companies have
committed to using 100%
renewable electricity by
2050, with an average
target date of 2028.
Microsoft has pledged to
be carbon negative by
2030, removing more
carbon than it emits.
32.
Carbon prices are being enacted around the worldCurrent or planned carbon
22% of
pricing covers
global emissions
80+ jurisdictions
(regional, national or subnational) have implemented or
are considering carbon prices
Source: World Bank, 2020
33.
“The world as we have createdit is a process of our thinking. It
cannot be changed without
changing our thinking.”
- Albert Einstein
“Never doubt that a small group
of thoughtful, committed
citizens can change the world.
Indeed, it is the only thing that
ever has.”
- Margaret Mead
34.
September 2019: Over 7 million people in 185 countriesGlobal
Climate
Strikes
35.
What canyou do?
Illustration by Elise Amel
36.
Thank You!Visit:
climateinteractive.org
37.
Appendix38.
The En-ROADS Training ProgramJoin this free, self-paced online course to…
• Learn more about the En-ROADS simulator
• Facilitate engaging events to spark climate action
– both online and in-person
• Gain valuable insights on systems thinking,
multisolving, advanced facilitation tips, and more
• Begin your journey as an En-ROADS Climate
Ambassador
• So far, we have over 500 En-ROADS Climate
Ambassadors from more than 70 different countries!
Register at: https://learn.climateinteractive.org
39.
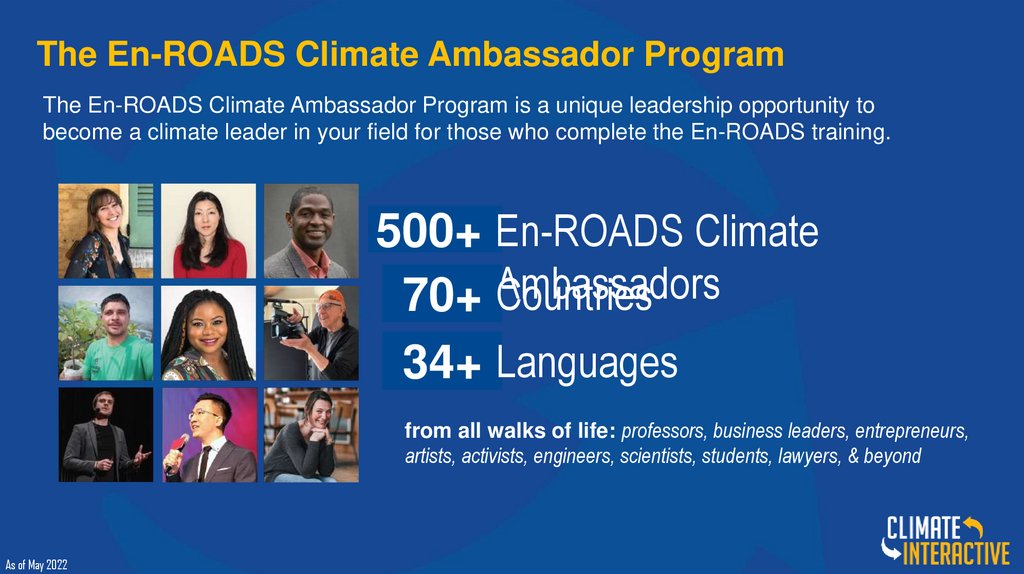
The En-ROADS Climate Ambassador ProgramThe En-ROADS Climate Ambassador Program is a unique leadership opportunity to
become a climate leader in your field for those who complete the En-ROADS training.
500+ En-ROADS Climate
Countries
70+ Ambassadors
34+ Languages
from all walks of life: professors, business leaders, entrepreneurs,
artists, activists, engineers, scientists, students, lawyers, & beyond
As of May 2022
40.
Insights from En-ROADS1. A combination of solutions is needed to address climate change: “It takes more
than one seed to plant a garden”:
2. Keeping climate change to well below 2°C, and limiting it to 1.5°C, is possible.
• We can still avoid the worst-case scenarios – it is still physically and
technologically possible.
3. All successful scenarios significantly cut burning of coal, oil, and gas in the next
10-20 years
4. There are many lower-leverage actions that help address climate change globally
but which are not as high of a priority as reducing fossil fuel use.
5. There are many opportunities to increase equity as we take these actions.
41.
Additional En-ROADS Insights• The transition from high-carbon to low-carbon takes decades due to the long lifetime of fossil fuel capital
infrastructure.
• A brand-new energy source takes too long to scale up to contribute much on its own.
• Even when low-carbon energy sources are encouraged, we still burn fossil fuels unless they are actively
discouraged.
• Reducing other greenhouse gas emissions (methane, N2O, F-gases) reduces temperature quite a bit.
• A carbon price is high leverage because it changes the fuel mix and reduces energy demand.
• New technologies grow via reinforcing “learning” feedback loops.
• When energy becomes inexpensive, energy demand increases modestly.
• Accelerated growth in natural gas (e.g., via subsidy), without a carbon price, competes with renewables and
does not reduce greenhouse gas emissions.
• In a scenario in which many actions that limit fossil fuel demand have already been taken, more nuclear/new
zero-carbon energy/renewables just displaces the other low-carbon sources (a dynamic known as “crowding
out”).
• Reducing deforestation is lower leverage in the long term than many expect, because its impact is
overshadowed by the amount of greenhouse gas emissions that come from burning fossil fuels.
42.
System Dynamics In En-ROADS1. Capital Stock Turnover – Changes to infrastructure take time
2. Price-Demand Feedback – Price, demand, and supply are linked
3. Crowding Out – Low-carbon supplies compete for long-term market share
4. Squeezing the Balloon – Fossil fuel supplies experience compensating feedback
5. Economies of Scale and Learning – Success builds success via Progress Ratio
6. Drivers of Growth – Population and GDP growth drives emissions
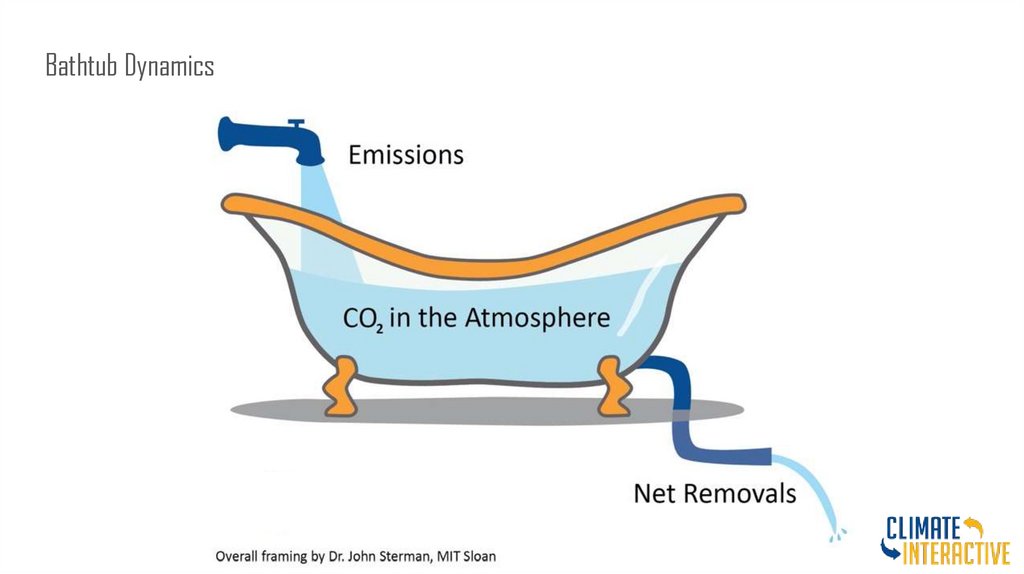
7. Bathtub Dynamics – CO2 emissions must be lower than removals for CO2
concentration and temperature to stop rising
43.
Features of En-ROADS• Transparent
All equations and structure are available in the online Reference Guide
• Flexible
Assumptions are adjustable
• Globally aggregated to be fast
Complementing, not supplanting, the integrated assessment models used by the IPCC
• Supports grounding discussions to learn and strategize, backed with real data &
science
However, not to serve as predictions for the future, which is dependent on too many
behavioral variables
44.
Bathtub Dynamics45.
En-ROADS Core StructureTemperature
Impacts
Total greenhouse
gases (GHGs)
Energy CO2
emissions
Population
Consumption
Land use CO2
emissions
Energy
Intensity
Carbon
Intensity
CO2
removal
Other greenhouse
gases
(N2O, methane,
f-gases)
46.
Multisolving47.
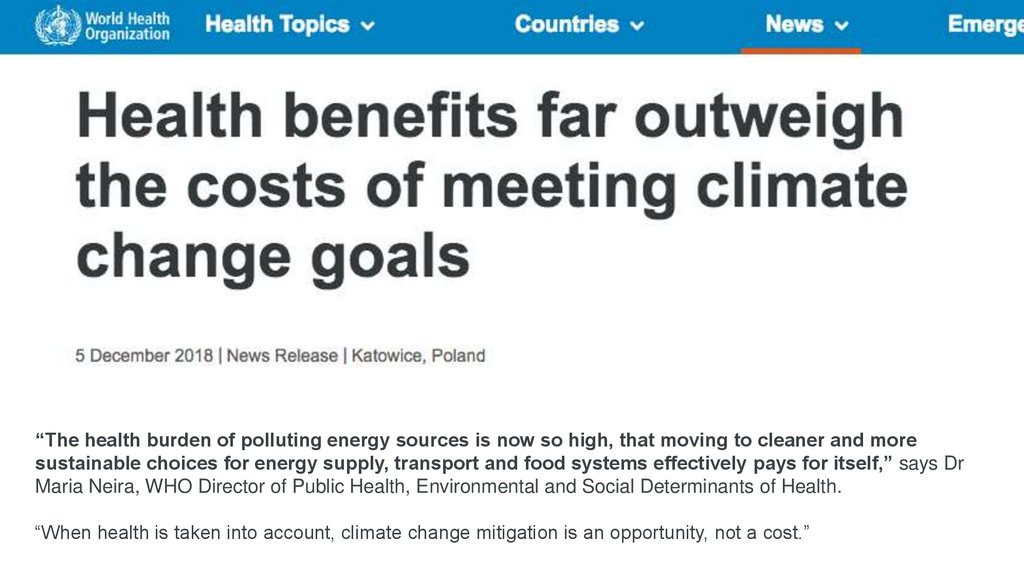
“The health burden of polluting energy sources is now so high, that moving to cleaner and moresustainable choices for energy supply, transport and food systems effectively pays for itself,” says Dr
Maria Neira, WHO Director of Public Health, Environmental and Social Determinants of Health.
“When health is taken into account, climate change mitigation is an opportunity, not a cost.”
48.
Clean Energy & HealthHealth benefits from wind and
solar power in the United
States from 2007 to 2015 were
even greater than their climate
benefits.
Source: Millstein, et al (2017)
Avoided
Climate
Damages, $32
billion
Health
Benefits,
$56
billion
49.
Clean Energy & JobsIf $200 billion was invested every year in energy efficiency and clean
energy in the US, 4.2 million jobs would be created by 2030, and the
2030 unemployment rate would be reduced by 1.5%.
Source: Pollin, et al (2014)
50.
Health Benefits of Climate Action: GlobalLimiting warming to 1.5-2°C by cutting fossil fuel
emissions would:
• Prevent ~153 million premature deaths from air
pollution by 21001
• Save ~$800 Billion per year due to health benefits
from clean power and $400 Billion per year from
clean transportation
• ~$1.2 Trillion per year total2
Source: Shindell et al., 2018; Shindell et al., 2016
51.
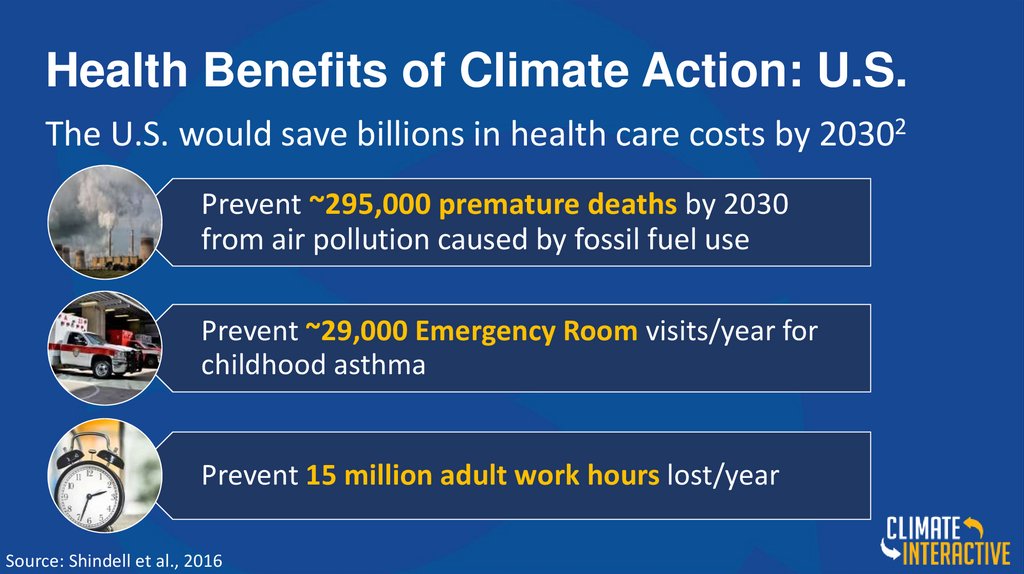
Health Benefits of Climate Action: U.S.The U.S. would save billions in health care costs by 20302
Prevent ~295,000 premature deaths by 2030
from air pollution caused by fossil fuel use
Prevent ~29,000 Emergency Room visits/year for
childhood asthma
Prevent 15 million adult work hours lost/year
Source: Shindell et al., 2016
52.
Impacts at differentlevels of warming
53.
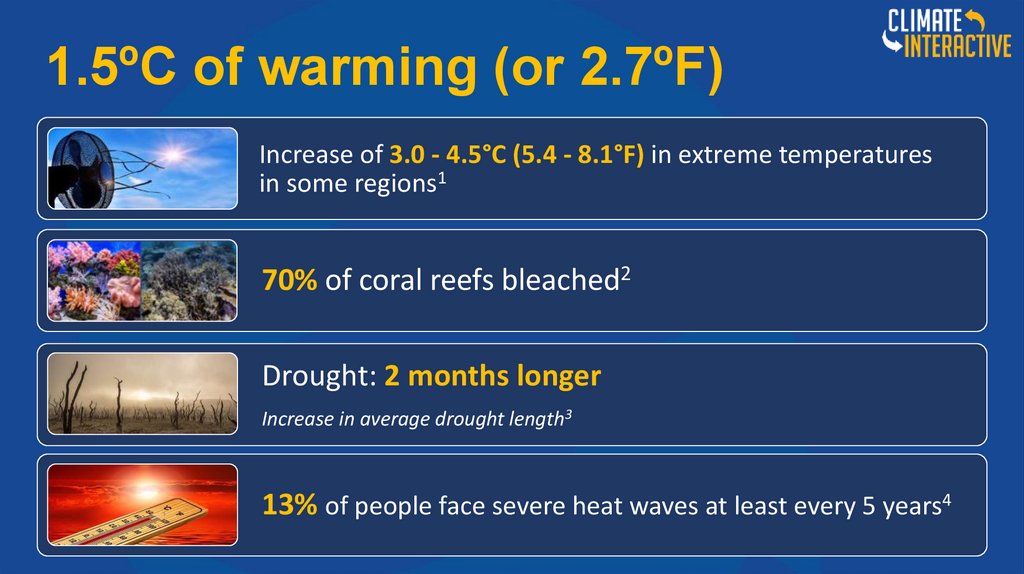
1.5ºC of warming (or 2.7ºF)Increase of 3.0 - 4.5°C (5.4 - 8.1°F) in extreme temperatures
in some regions1
70% of coral reefs bleached2
Drought: 2 months longer
Increase in average drought length3
13% of people face severe heat waves at least every 5 years4
54.
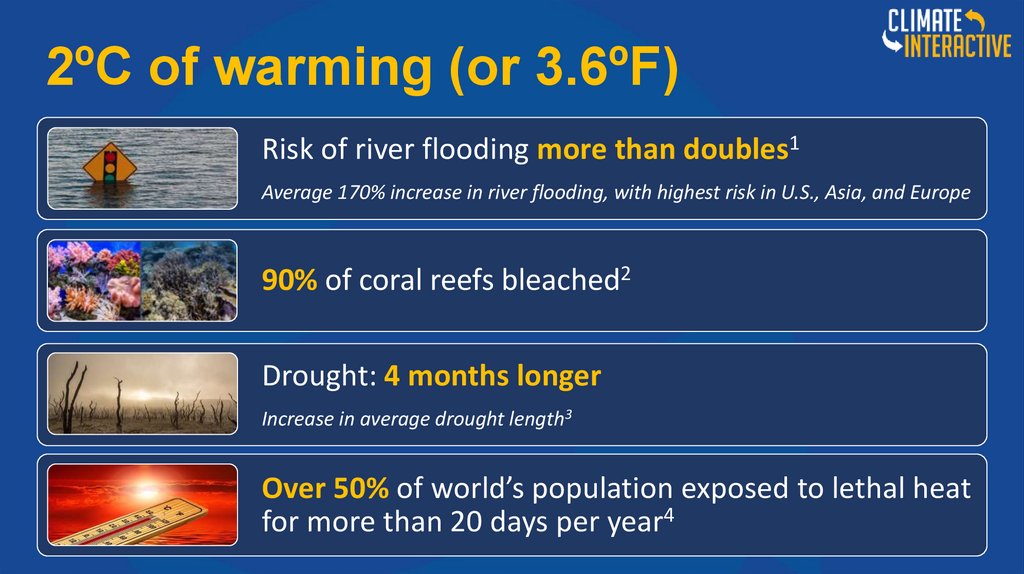
2ºC of warming (or 3.6ºF)Risk of river flooding more than doubles1
Average 170% increase in river flooding, with highest risk in U.S., Asia, and Europe
90% of coral reefs bleached2
Drought: 4 months longer
Increase in average drought length3
Over 50% of world’s population exposed to lethal heat
for more than 20 days per year4
55.
3ºC of warming (or 5.4ºF)Arctic sea ice is gone in 2 out of every 3 summers1
50% of insect species lose >50% of their habitat range2
Drought: 11 months longer
Increase in average drought length3
Area burned by summer wildfires in Mediterranean doubles4
Compared to today
56.
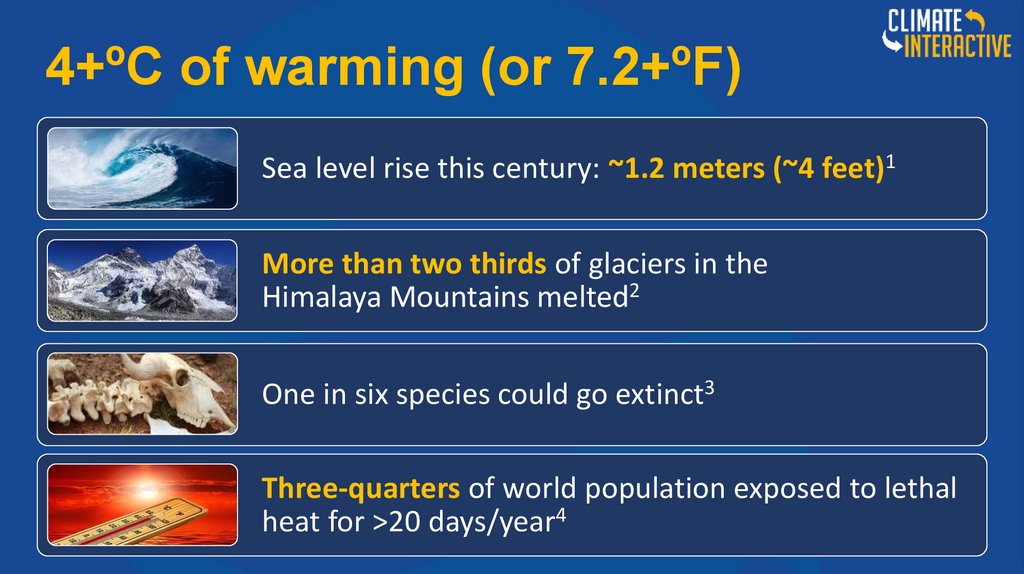
4+ºC of warming (or 7.2+ºF)Sea level rise this century: ~1.2 meters (~4 feet)1
More than two thirds of glaciers in the
Himalaya Mountains melted2
One in six species could go extinct3
Three-quarters of world population exposed to lethal
heat for >20 days/year4