


")


 География
Похожие презентации:


")


History of Earth’s Climate
1. History of Earth’s Climate
Earth formed ~4.6 billion years ago
Originally very hot
Sun’s energy output only 70% of present
Liquid water present ~4.3 billion years
2. History of Earth’s Climate
• Life appeared ~3.8 billion years ago• Photosynthesis began 3.5-2.5 billion years ago
– Produced oxygen and removed carbon dioxide
and methane (greenhouse gases)
– Earth went through periods of cooling (“Snowball
Earth”) and warming
• Earth began cycles of glacial and interglacial
periods ~3 million years ago
3. Earth’s Temperature
SolarSun
Energy
Solar
Energy
The temperature of the earth is directly related to the
energy input from the Sun. Some of the Sun’s energy is
reflected by clouds. Other is reflected by ice. The
remainder is absorbed by the earth.
4. Earth’s Temperature
SunSolar
Energy
Radiation
Cooling
If amount of solar energy absorbed by the earth is
equal to the amount radiated back into space, the
earth remains at a constant temperature.
5. Earth’s Temperature
SunSolar
Energy
Radiation
Cooling
if the amount of solar energy is greater than the
amount radiated, then the earth heats up.
6. Earth’s Temperature
SunSolar
Energy
Radiation
Cooling
If the amount of solar energy is less than the amount
radiated, then the earth cools down.
7. Greenhouse Effect
SunGreenhouse Effect
To a certain degree, the earth acts like a greenhouse. Energy from the Sun penetrates the glass
of a greenhouse and warms the air and objects within the greenhouse. The same glass slows the
heat from escaping, resulting in much higher temperatures within the greenhouse than outside
it.
8. Earth’s Atmospheric Gases
Nitrogen (N2)Oxygen (O2)
NonGreenhouse
Gases
99%
Water (H2O)
Carbon Dioxide (CO2)
Methane (CH4)
Greenhouse
Gases
1%
9.
10.
11.
Recap and importance:The photochemical reactions produce ATP and NADH at sites in the stroma.
The Dark Cycle (Calvin Cycle), or more descriptively, the carbon reactions of photosynthesis
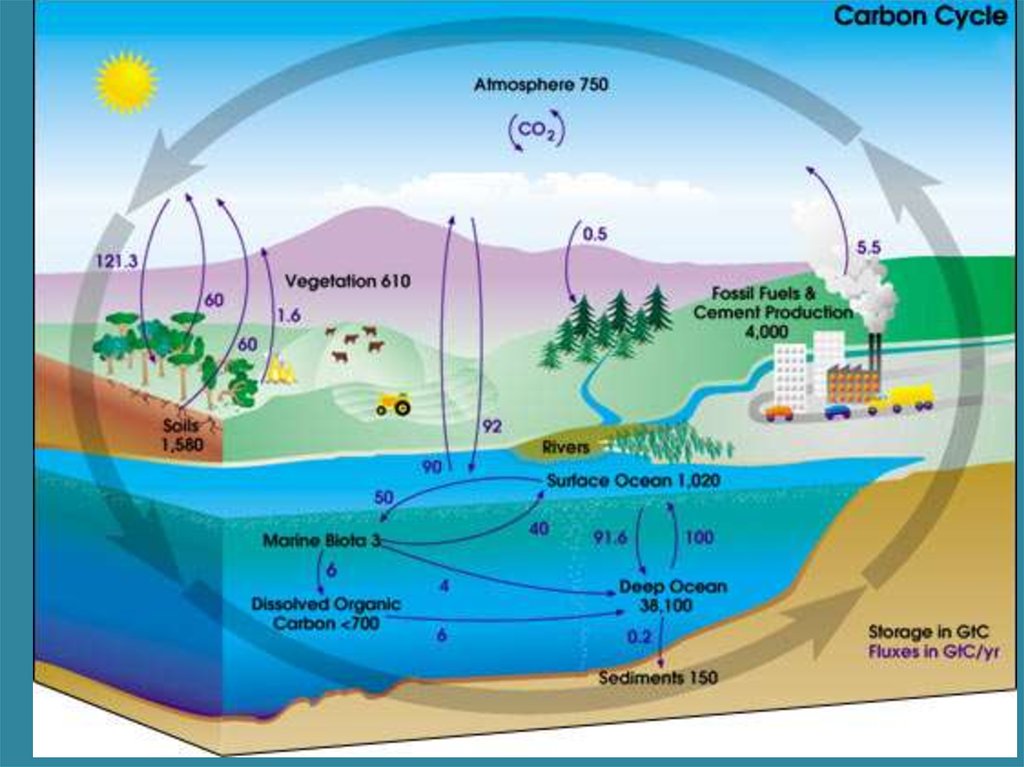
~200 billion tons of CO2 are converted to biomass each year
The enzyme ribulose biphosphate carboxylase/oxygenase, Rubisco, that
incorporates CO2 is 40% of the protein in most leaves.
12.
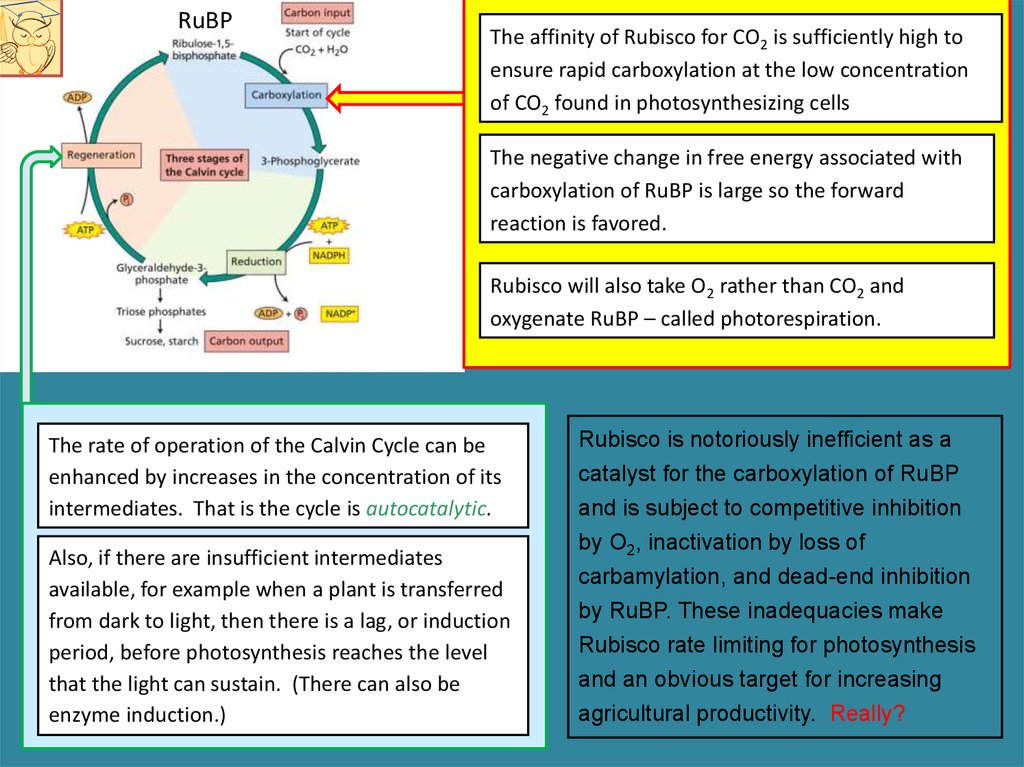
The Calvin cycle proceeds in three stages: carboxylation, reduction, and regenerationCarboxylation of the CO2 acceptor,
ribulose-1, 5-biphosphate, forming
two molecules of 3-phosphoglcerate.
Rubisco – the enzyme ribulose
biphosphate carboxylase/oxygenase
Reduction of 3-phosphoglycerate to
form glyceraldehyde-3-phosphate
which can be used in formation of
carbon compounds that are
translocated.
Regeneration of the CO2 acceptor
ribulose-1, 5-biphosphate from
glyceraldehyde-3-phosphate
13.
RuBPThe affinity of Rubisco for CO2 is sufficiently high to
ensure rapid carboxylation at the low concentration
of CO2 found in photosynthesizing cells
The negative change in free energy associated with
carboxylation of RuBP is large so the forward
reaction is favored.
Rubisco will also take O2 rather than CO2 and
oxygenate RuBP – called photorespiration.
The rate of operation of the Calvin Cycle can be
enhanced by increases in the concentration of its
intermediates. That is the cycle is autocatalytic.
Also, if there are insufficient intermediates
available, for example when a plant is transferred
from dark to light, then there is a lag, or induction
period, before photosynthesis reaches the level
that the light can sustain. (There can also be
enzyme induction.)
Rubisco is notoriously inefficient as a
catalyst for the carboxylation of RuBP
and is subject to competitive inhibition
by O2, inactivation by loss of
carbamylation, and dead-end inhibition
by RuBP. These inadequacies make
Rubisco rate limiting for photosynthesis
and an obvious target for increasing
agricultural productivity. Really?
14. Basics of foliage photosynthesis
Light ReactionLimiting
Dark Reaction
Limiting
Increasing CO2
concentration in the
atmosphere can increase
the maximum rate of
photosynthesis in the
short term
Saturation level.
sometimes called
photosynthetic
capacity.
Photosynthetic efficiency:
Increase in photosynthesis per
increase in irradiance
0
0
Any questions?
Compensation point
The irradiance at which CO 2
uptake is zero
15. In the presence of higher O2 levels, photosynthesis rates are lower.
275 ppm CO273 ppm CO2
In the presence of higher O2 levels,
photosynthesis rates are lower.
The inhibition of photosynthesis
by O2 was first noticed by the
German plant physiologist, Otto
Warburg, in 1920, and called the
"Warburg effect".
It is believed that photorespiration in plants has increased over geologic time due to
increasing atmospheric O2 concentration -the product of photosynthetic organisms
themselves.
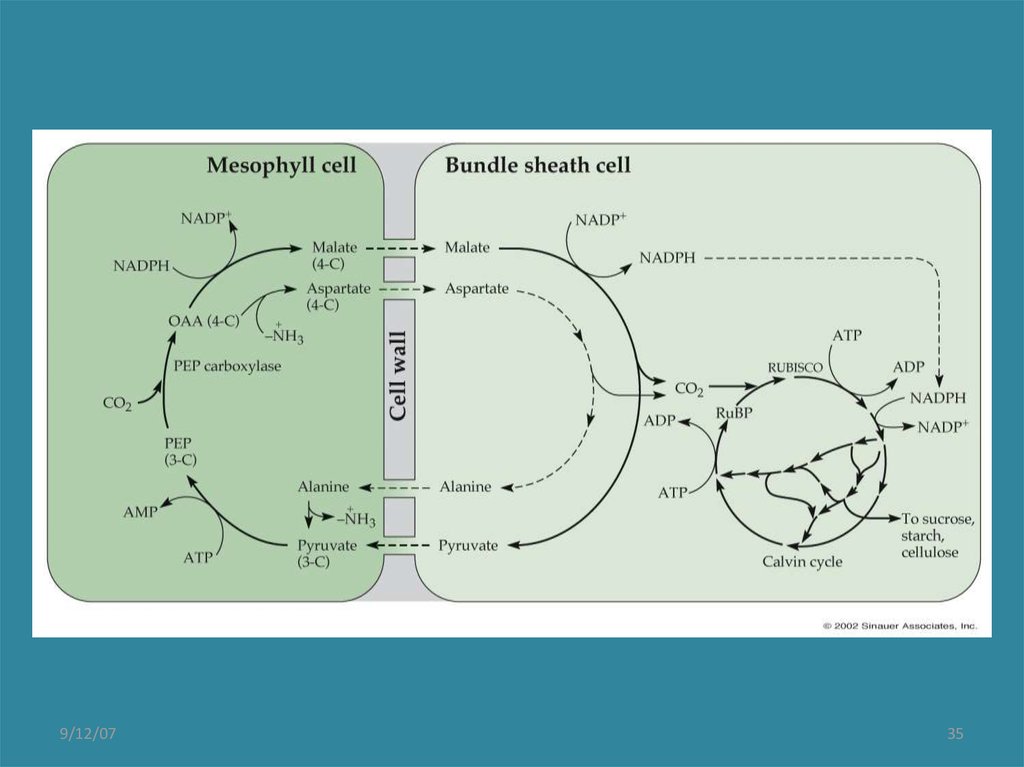
16.
C4 PhotosynthesisThe first product of CO2 fixation is malate
(C4) in mesophyll cells, not PGA as it is
in C3 plants. This is transported to
bundle sheath cells
CO2 is released from malate in bundle
sheath cells, where it is fixed again by
Rubisco and the Calvin cycle proceeds.
PEP is recycled back to mesophyll cells.
Decarboxylation of malate (CO2 release)
creates a higher concentration of CO2 in
bundle sheath cells than found in
photosynthetic cells of C3 plants.
This enables C4 plants to sustain higher
rates of photosynthesis. And, because the
concentration of CO2 relative to O2 in bundle
sheath cells is higher, photorespiration rates
are lower.
17. Crassulacean Acid Metabolism (CAM)
First discovered in succulents of theCrassulacea: e.g.,sedums
Uses C4 pathways, but segregates CO2
assimilation and Calvin cycle between day
and night
CAM plants open their stomates at night.
This conserves H2O. CO2 is assimilated into
malic acid and stored in high concentrations
in cell vacuoles
During the day, stomates close, and the
stored malic acid is gradually recycled to
release CO2 to the Calvin cycle
18.
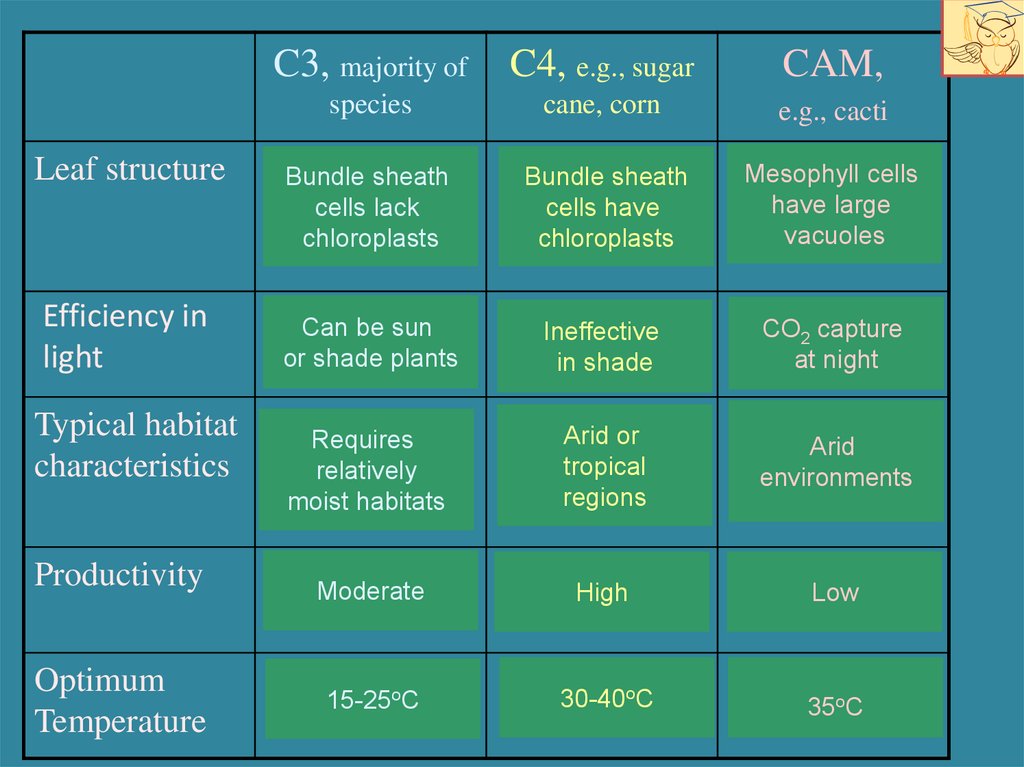
Leaf structureEfficiency in
light
Typical habitat
characteristics
Productivity
Optimum
Temperature
C3, majority of
C4, e.g., sugar
CAM,
species
cane, corn
e.g., cacti
Bundle sheath
cells lack
chloroplasts
Bundle sheath
cells have
chloroplasts
Mesophyll cells
have large
vacuoles
Can be sun
or shade plants
Ineffective
in shade
CO2 capture
at night
Requires
relatively
moist habitats
Arid or
tropical
regions
Arid
environments
Moderate
High
Low
15-25oC
30-40oC
35oC
19.
ISOTOPES AND LAND PLANT ECOLOGYC3 vs. C4 vs. CAM
20.
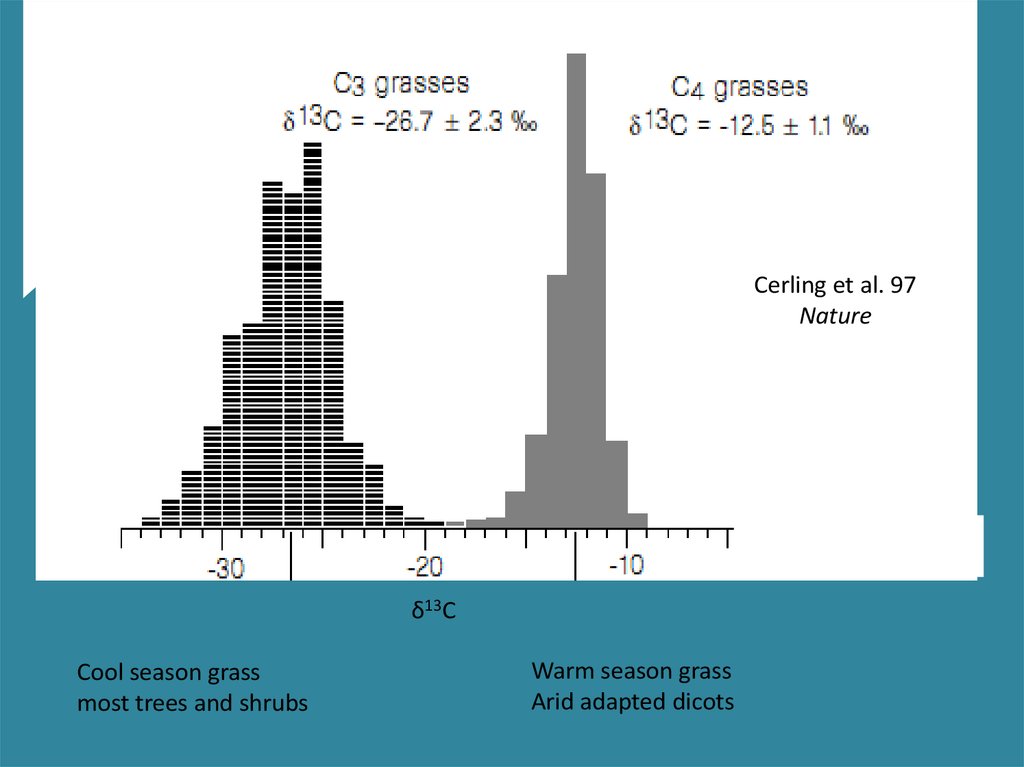
Cerling et al. 97Nature
δ13C
Cool season grass
most trees and shrubs
Warm season grass
Arid adapted dicots
21.
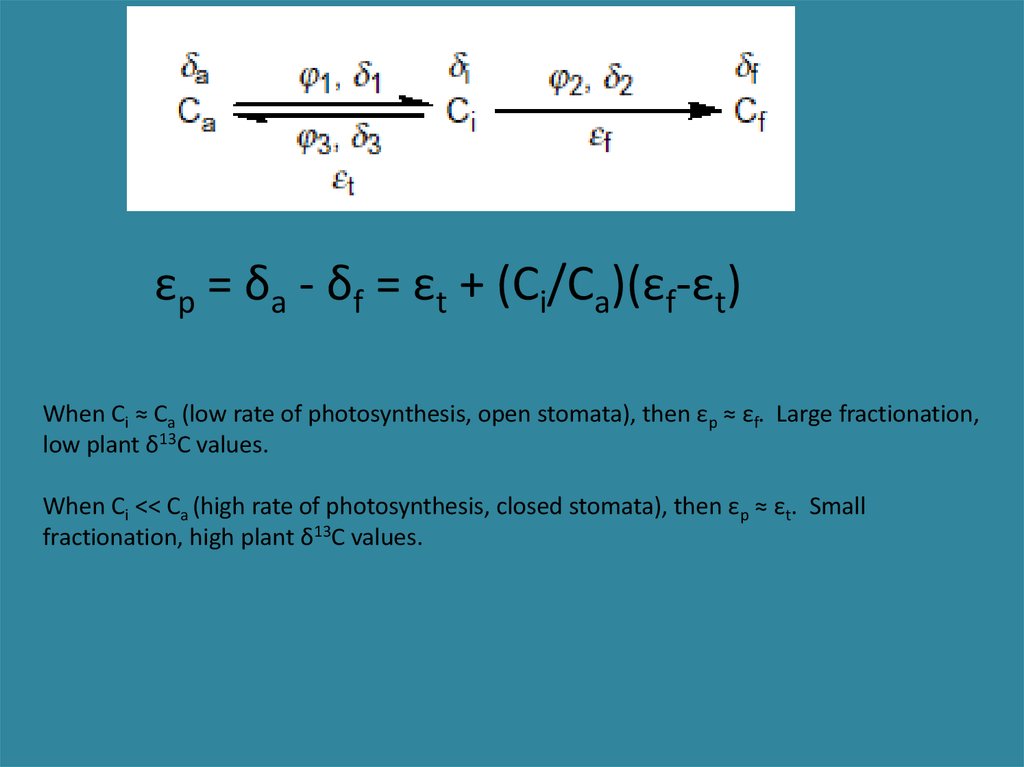
εp = δa - δf = εt + (Ci/Ca)(εf-εt)When Ci ≈ Ca (low rate of photosynthesis, open stomata), then εp ≈ εf. Large fractionation,
low plant δ13C values.
When Ci << Ca (high rate of photosynthesis, closed stomata), then εp ≈ εt. Small
fractionation, high plant δ13C values.
22.
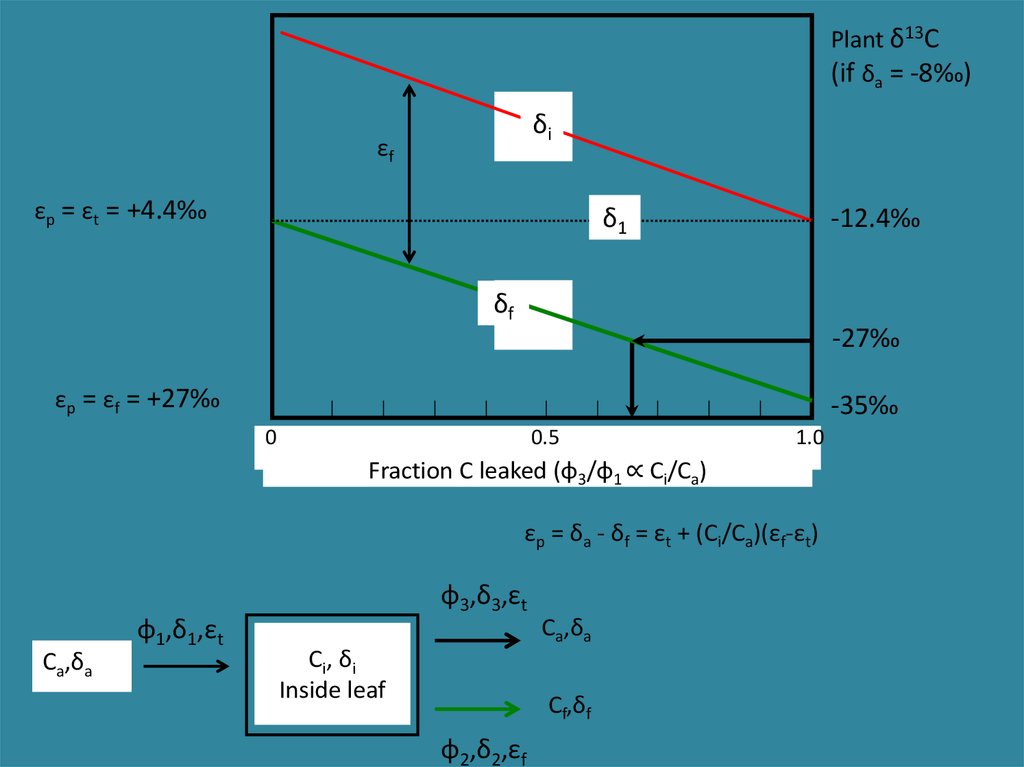
Plant δ13C(if δa = -8‰)
δi
εf
εp = εt = +4.4‰
δ1
-12.4‰
δf
-27‰
εp = εf = +27‰
-35‰
0
0.5
1.0
Fraction C leaked (φ3/φ1 ∝ Ci/Ca)
εp = δa - δf = εt + (Ci/Ca)(εf-εt)
φ3,δ3,εt
φ1,δ1,εt
Ca,δa
Ca,δa
C i, δ i
Inside leaf
Cf,δf
φ2,δ2,εf
23.
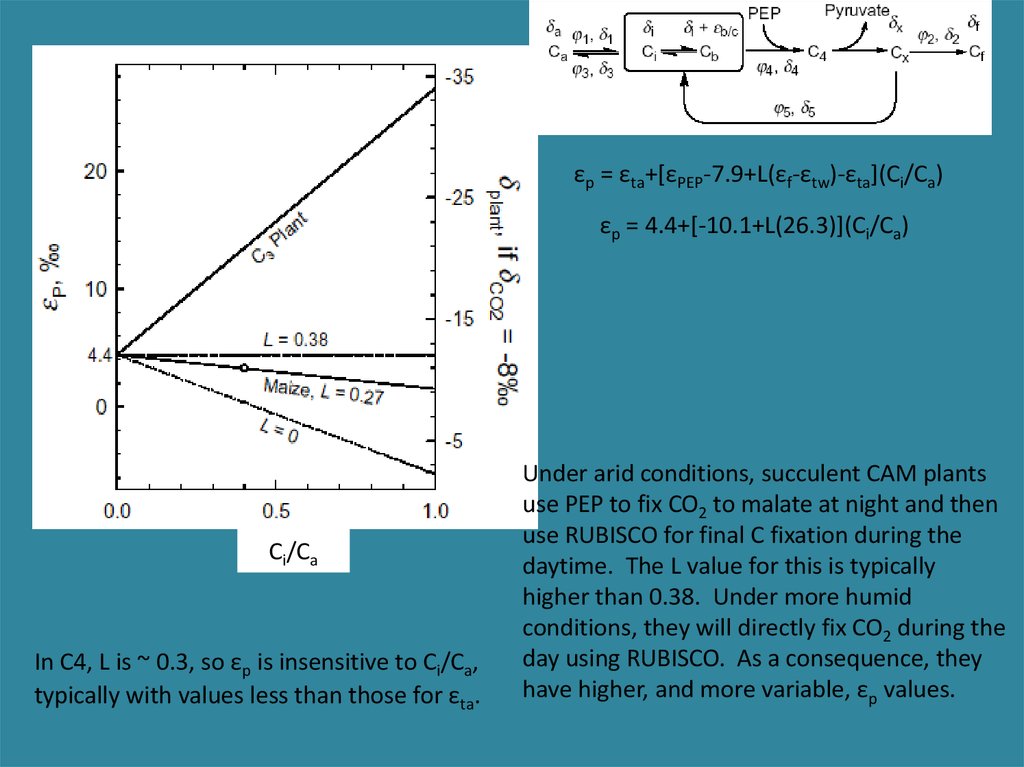
εp = εta+[εPEP-7.9+L(εf-εtw)-εta](Ci/Ca)εp = 4.4+[-10.1+L(26.3)](Ci/Ca)
Ci/Ca
In C4, L is ~ 0.3, so εp is insensitive to Ci/Ca,
typically with values less than those for εta.
Under arid conditions, succulent CAM plants
use PEP to fix CO2 to malate at night and then
use RUBISCO for final C fixation during the
daytime. The L value for this is typically
higher than 0.38. Under more humid
conditions, they will directly fix CO2 during the
day using RUBISCO. As a consequence, they
have higher, and more variable, εp values.
24.
Δ13C fraction-whole plant25.
δ13C varies with environment within C3 plantsC3 plants
26.
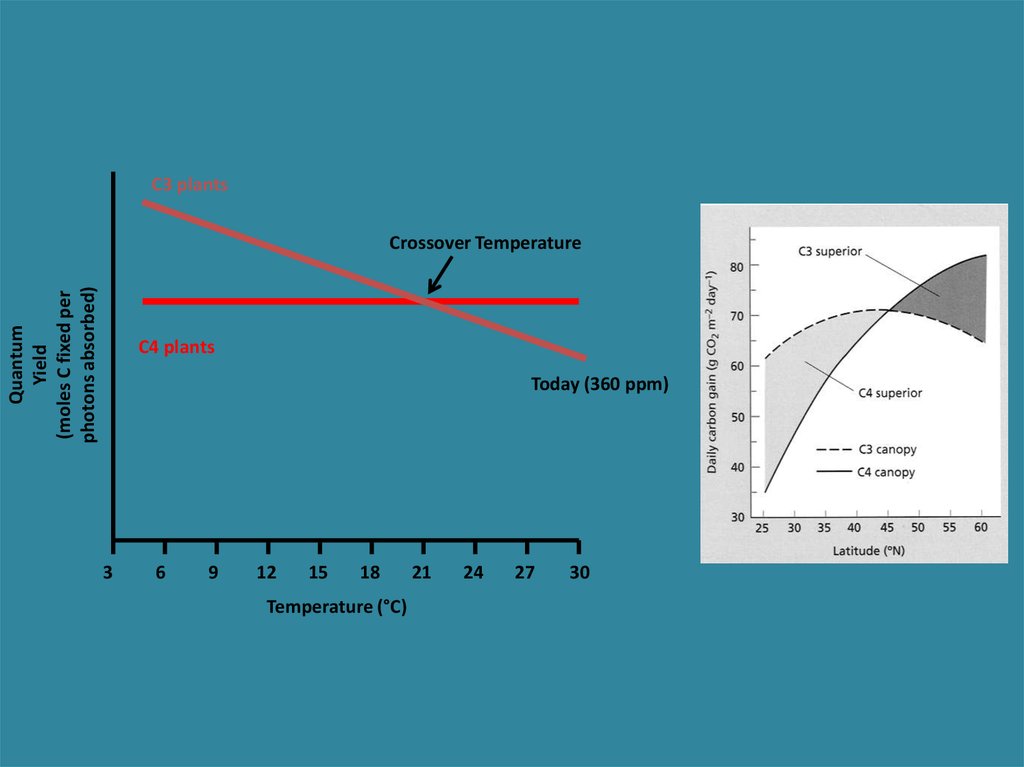
C3 plantsQuantum
Yield
(moles C fixed per
photons absorbed)
Crossover Temperature
C4 plants
Today (360 ppm)
3
6
9
12
15
18
Temperature (°C)
21
24
27
30
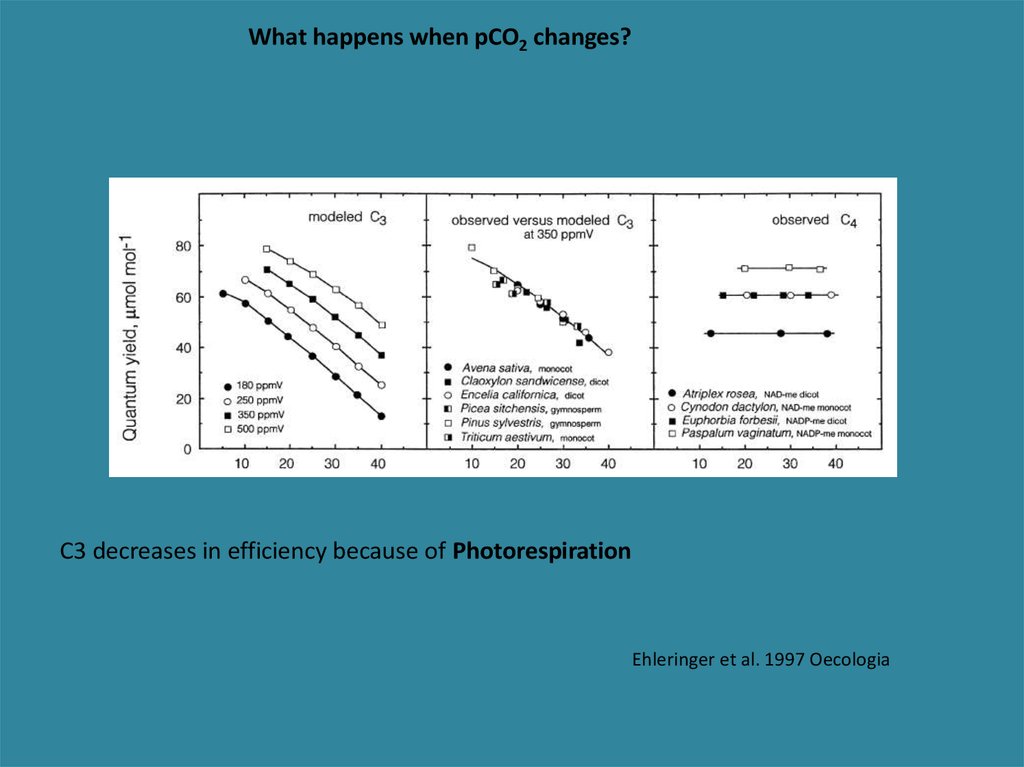
27.
What happens when pCO2 changes?C3 decreases in efficiency because of Photorespiration
Ehleringer et al. 1997 Oecologia
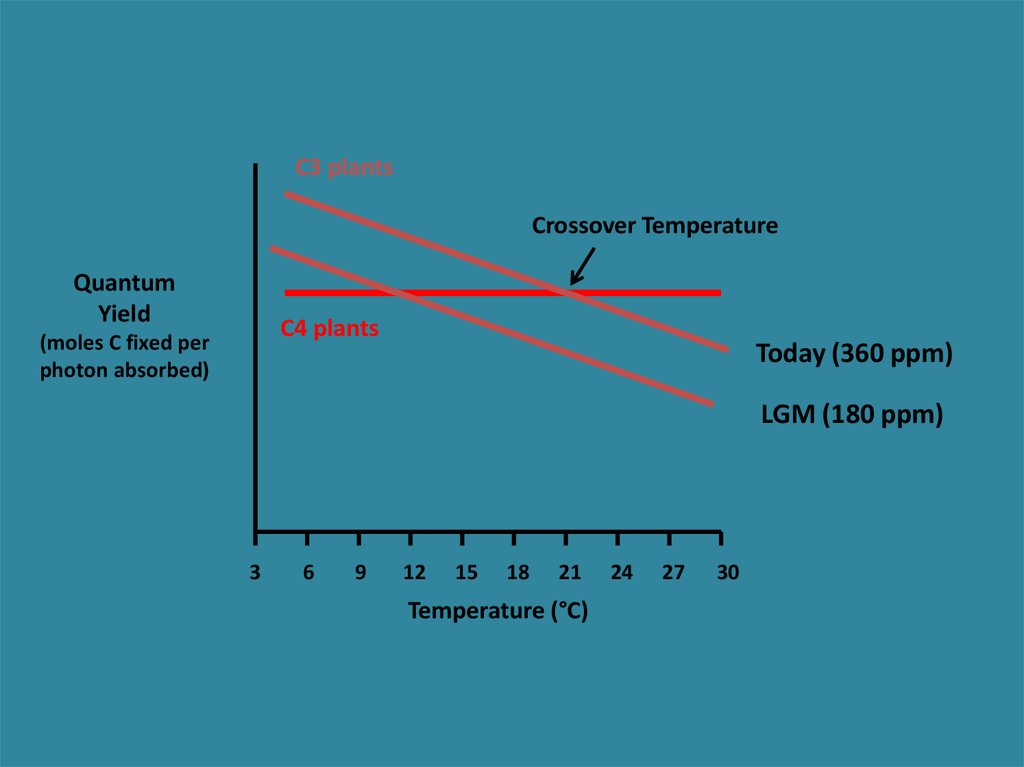
28.
C3 plantsCrossover Temperature
Quantum
Yield
C4 plants
(moles C fixed per
photon absorbed)
Today (360 ppm)
LGM (180 ppm)
3
6
9
12
15
18
21
Temperature (°C)
24
27
30
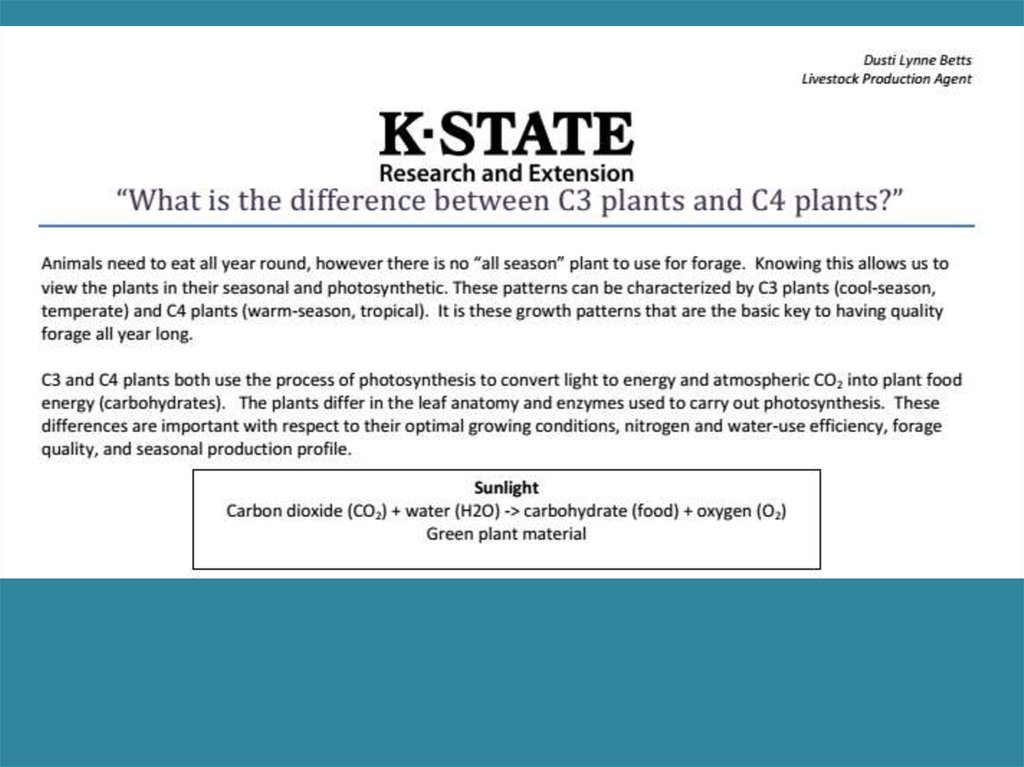
29. C3 versus C4 plants
C3C4
Photorespiration
Yes
Not detectable
CO2 compensation point (mL CO2 l-1)
20 – 100
0–5
Temperature optimum (oC)
20 – 25
30 – 45
Quantum yield as a function of temp.
Declining
Steady
Transpiration ratio
500 – 1000
200 – 350
Light saturation (mmole photons m-2 s-1)
400 – 500
Does not
saturate
C3 plants are favoured in environments where water is plentiful, temperature
and light levels are moderate (temperate climates)
C4 plants are favoured in environments where water is limiting and light and
temperatures are high (tropical / subtropical habitats)
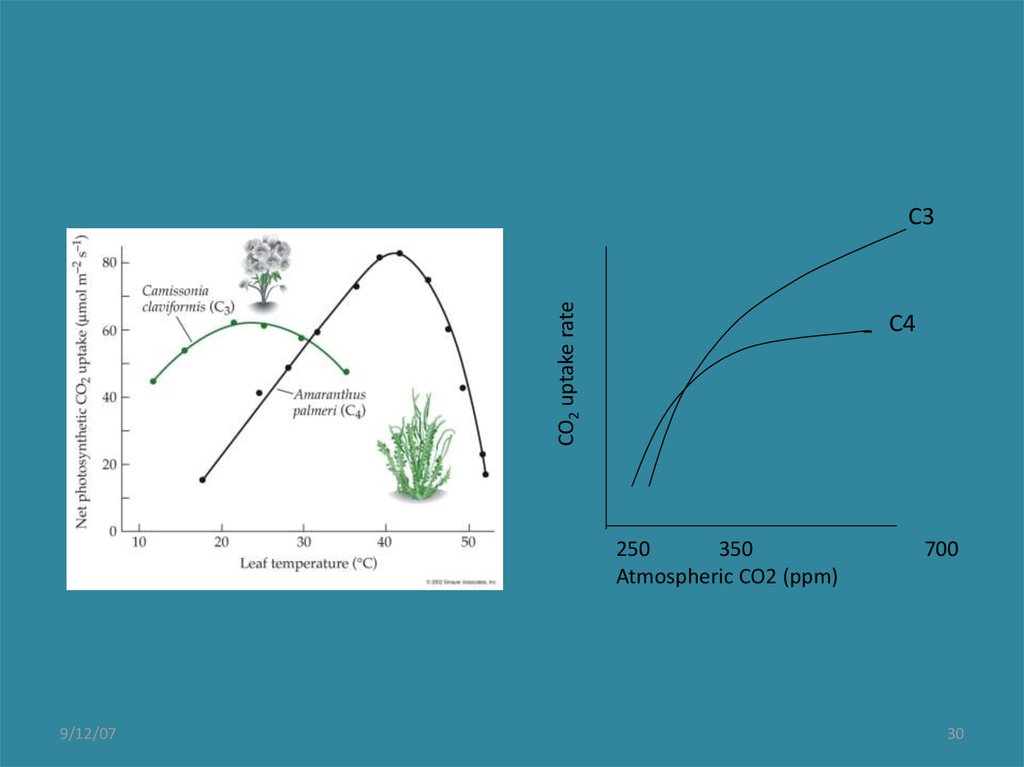
30.
CO2 uptake rateC3
C4
250
350
Atmospheric CO2 (ppm)
9/12/07
700
30
31. Three modes of photosynthesis
C3 pathway, aka Calvin cycle, most common.– Ribulose bisphosphate (RuBP, Rubisco) most abundant
protein on Earth; enzyme captures CO2 but also has
high affinity for O2.
– Phosphoglyceric acid (PGA) is 3-C sugar formed during
CO2 uptake.
– Photorespiration makes photosynthesis less efficient
but also protects cells from excess light energy.
– At high CO2:O2 ratios, Rubisco is more efficient, thus C3
plants respond more to elevated CO2 than do C4 plants
– Most trees, shrubs, cool-season grasses
9/12/07
31
32. Calvin Cycle
9/12/0732
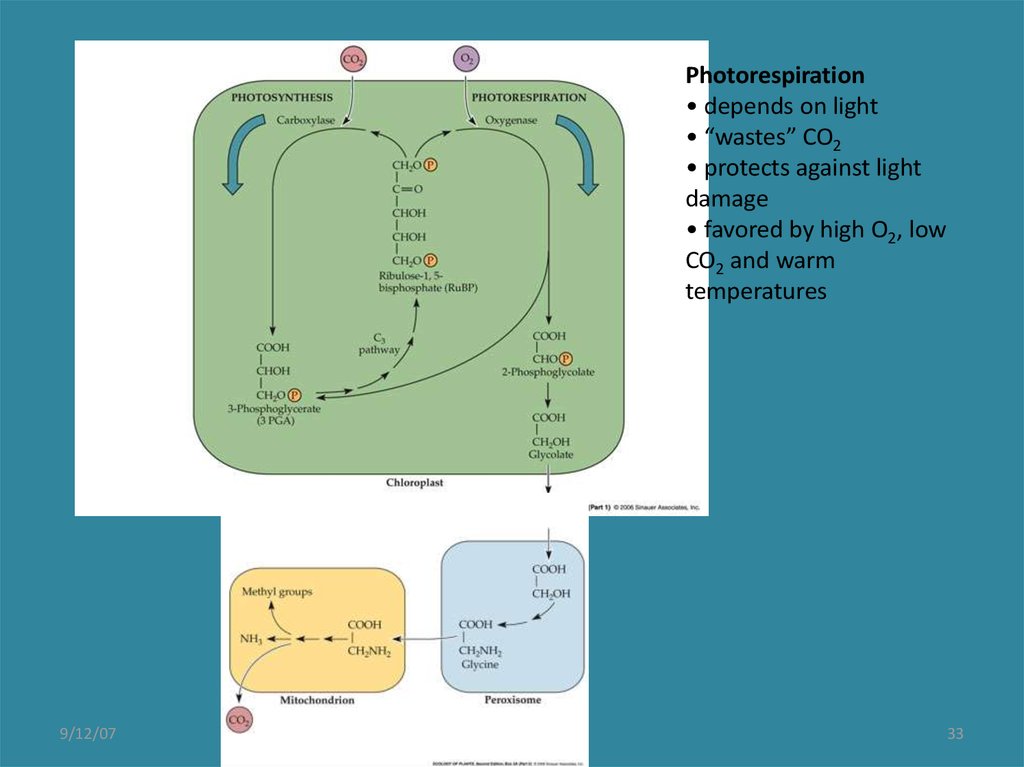
33.
Photorespiration• depends on light
• “wastes” CO2
• protects against light
damage
• favored by high O2, low
CO2 and warm
temperatures
9/12/07
33
34. Three modes of photosynthesis
• C4 pathway, aka Hatch-Slack, has additionalenzyme, PEP carboxylase, with much higher
affinity for CO2.
– Oxaloacetate (OAA) is 4-C sugar formed during CO2
uptake.
– Rubisco concentrated in bundle sheath cells, where
OAA delivers CO2.
– Photorespiration limited because CO2:O2 is much
higher inside bundle sheath cells than in C3’s.
– Less Rubisco needed for psn means higher N-use
efficiency.
9/12/07
34
35.
9/12/0735
36. Three modes of photosynthesis
• C4 pathway– Higher T optimum and light saturation.
– High water use efficiency (C gained per H2O lost)
because stomates can be partly closed.
– Lower response to elevated CO2
– Cost of C4: additional ATP is needed for PEP cycle,
which may limit C4 growth at low light levels
– 2000 species in 18 families; half of all grass (Poaceae)
species (warm-season grasses)
9/12/07
36
37.
38.
39.
• There is a clear correlation between the amount of anthropogenic CO2 released to the atmosphere
and the increase in atmospheric CO2 concentration during last decades.
• Atmospheric oxygen is declining proportionately to CO2 increase and fossil fuel combustion.
• For the last half century, the CO2 airborne fraction (AF) parameter remained consistent and
averaged at 0.55 (the AF parameter is the ratio of the increase in atmospheric CO2 concentration to
fossil fuel-derived CO2 emissions). AF has been introduced to assess short- and long-term changes in
the atmospheric carbon content; in particular, AF of 0.55 indicates that the oceans and terrestrial
ecosystems have cumulatively removed about 45 % of anthropogenic CO2 from the atmosphere over
the last half century [6].
• The isotopic signature of fossil fuels (e.g., the lack of 14C and the depleted level of 13C carbon
isotopes) is detected in atmospheric CO2.
• There exists an interhemispheric gradient in the atmospheric CO2 concentrations in the Northern
and Southern Hemispheres. In particular, the predominance of fossil-derived CO2 emissions in more
industrially developed Northern Hemisphere (compared to the Southern Hemisphere) causes the
occurrence of the atmospheric CO2 gradient in the amount of about 0.5 ppm per GtC per year [6].
• There have been dramatic changes in RFCO2 values over the last decades. For example, during
1995–2005, the RFCO2 increased by about 0.28 W/m2 (or about 20 % increase), which represents the
largest increase in RFCO2 for any decade since the beginning of the industrial era. RFCO2 in 2005 was
estimated at RFCO2=1.66±0.17 W/m2 (corresponding to the atmospheric CO2 concentration of
379±0.65 ppm), which is the largest RF among all major forcing factors (The concept of radiative
forcing (RF))
• The data show that the changes in the land use greatly contributed to the RFCO2 value in the
amount of about 0.4 W/m2 (since the beginning of the industrial era). This implies that the remaining
three quarters of RFCO2 can be attributed to burning fossil fuels, cement manufacturing, and other
industrial CO2 emitters [6].