


 Программное обеспечение
Похожие презентации:


Working with data analysis expressions (DAX) in MS power bi. DAX functions
1.
LECTURES 12-13WORKING WITH DATA ANALYSIS
EXPRESSIONS (DAX) IN MS POWER BI.
DAX FUNCTIONS.
2.
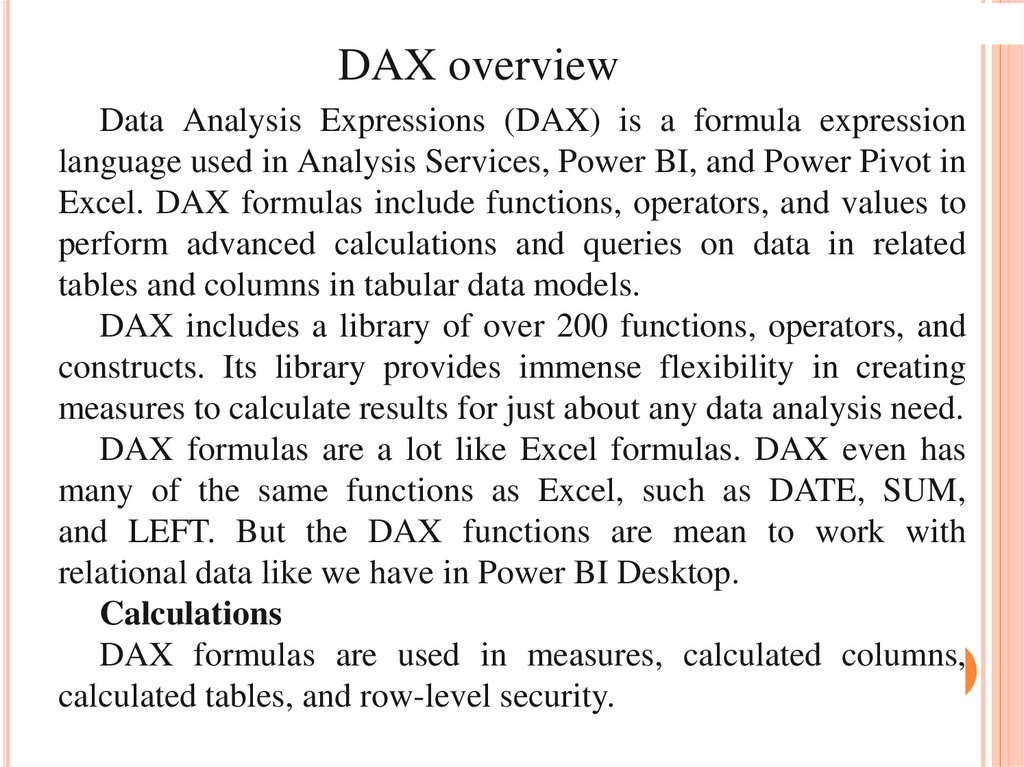
DAX overviewData Analysis Expressions (DAX) is a formula expression
language used in Analysis Services, Power BI, and Power Pivot in
Excel. DAX formulas include functions, operators, and values to
perform advanced calculations and queries on data in related
tables and columns in tabular data models.
DAX includes a library of over 200 functions, operators, and
constructs. Its library provides immense flexibility in creating
measures to calculate results for just about any data analysis need.
DAX formulas are a lot like Excel formulas. DAX even has
many of the same functions as Excel, such as DATE, SUM,
and LEFT. But the DAX functions are mean to work with
relational data like we have in Power BI Desktop.
Calculations
DAX formulas are used in measures, calculated columns,
calculated tables, and row-level security.
3.
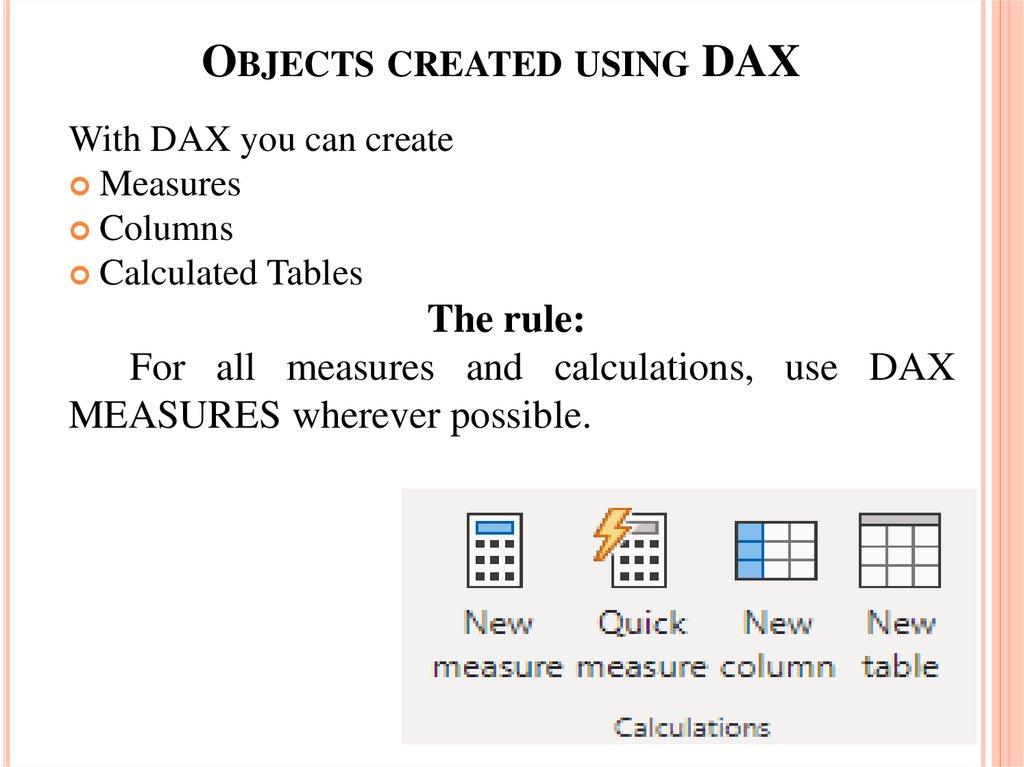
OBJECTS CREATED USING DAXWith DAX you can create
Measures
Columns
Calculated Tables
The rule:
For all measures and calculations, use DAX
MEASURES wherever possible.
4.
Measures and calculated columnsA measure is a basic concept in DAX and is an expression that
allows you to calculate the required indicator based on data from
the model. An example of using measures is calculating the
average, sum, number of unique records, and so on.
The calculated column also allows you to calculate metrics,
but the calculation is performed for each row of the table
separately and the result is saved in a separate field (a new table
column).
Measures, unlike columns, are calculated only when using the
visualization, while the values of a new column are calculated
immediately after it is created.
The measure is not physically displayed in the table and the
model, and does not weigh down the model.
The calculated column is stored in the model.
5.
MeasuresIn Power BI Desktop, measures are created
and displayed in Report View or Data View.
Measures are dynamic calculation formulas
where the results change depending on
context. Measures are used in reporting that
support combining and filtering model data by
using multiple attributes such as a Power BI
report or Excel PivotTable or PivotChart.
Measures are created by using the DAX
formula bar in the model designer.
Measures you create yourself appear in
the Fields list with a calculator icon and
available to all users of the model. You can
name measures whatever you want and add
them to a new or existing visualization just
like any other field.
6.
MeasuresA formula in a measure can use standard aggregation
functions automatically created by using the Autosum feature,
such as COUNT or SUM, or you can define your own formula
by using the DAX formula bar. Named measures can be passed
as an argument to other measures.
For example, this is a very simple measure formula:
Total Sales = SUM([Sales Amount])
Unlike calculated columns, the syntax for a measure
includes the measure's name preceding the formula.
Next example of using the DAX to create the measure
Projected Sales = SUM('Sales'[Last Years Sales])*1.06
7.
ORGANIZING YOUR MEASURESMeasures have a Home table that defines where they're found in
the field list. You can change their location by choosing a location
from the tables in your model.
You can create a special table that contains only measures. That
table always appears at the top of the Fields. To do so, create a table
with just one column. You can use Enter Data to create that table.
Then move your measures to that table. Finally, hide the column,
but not the table, that you created. Select the arrow at the top of
Fields to close and reopen the fields list to see your changes.
8.
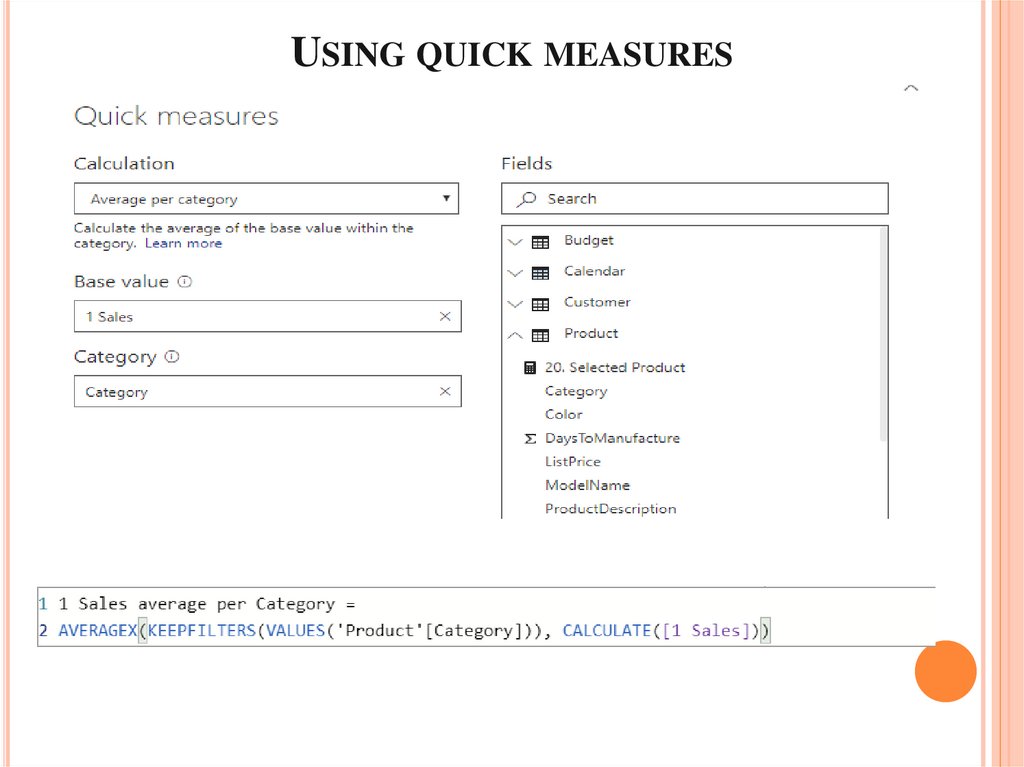
USING QUICK MEASURESTo quickly and easily perform standard and resourceintensive calculations, you can use quick measures.
Quick Measure executes a set of DAX commands in the
background, and then presents the results for use in a
report.
No need to write DAX code — everything is done
automatically based on the input data.
9.
USING QUICK MEASURESFive types of fast measure calculations Change by year
Change by quarter
with corresponding calculations.
Aggregate by category:
Monthly change
Average per category
Moving average
Variance by category
Results
Maximum per category
Total amount
Minimum per category
Totals for the category (with filters)
Weighted average by category
Totals for the category (without filters)
Filters:
Mathematical operations
Filtered value
Addendum
Difference with filtered value
Subtraction
Percentage of the difference with the filtered
value
Multiplication
Division
Sales from new customers
The percentage difference
Logic of operations with time
is the correlation coefficient.
Total since the beginning of the year
Text messages
Total since the beginning of the quarter
Evaluation
Total from the beginning of the month
Combined list of values
10.
USING QUICK MEASURES11.
TABLE OF MEASURESIt is convenient to create a measure table when there are many
measures in different tables.
Steps for creating a measure table:
Home tab-Enter Data, renaming the table name to
MeasureTable-Load.
Create a new test measure measure = “Test”
Delete column Column1
Save the project and close it
Re-open the project, the resulting table of measures will be
located at the beginning of the list of tables
Select each measure and select MeasureTable as the Home
table for the measure.
You can create separate tables for measures (for measures for
sales, products, customers, etc.).)
12.
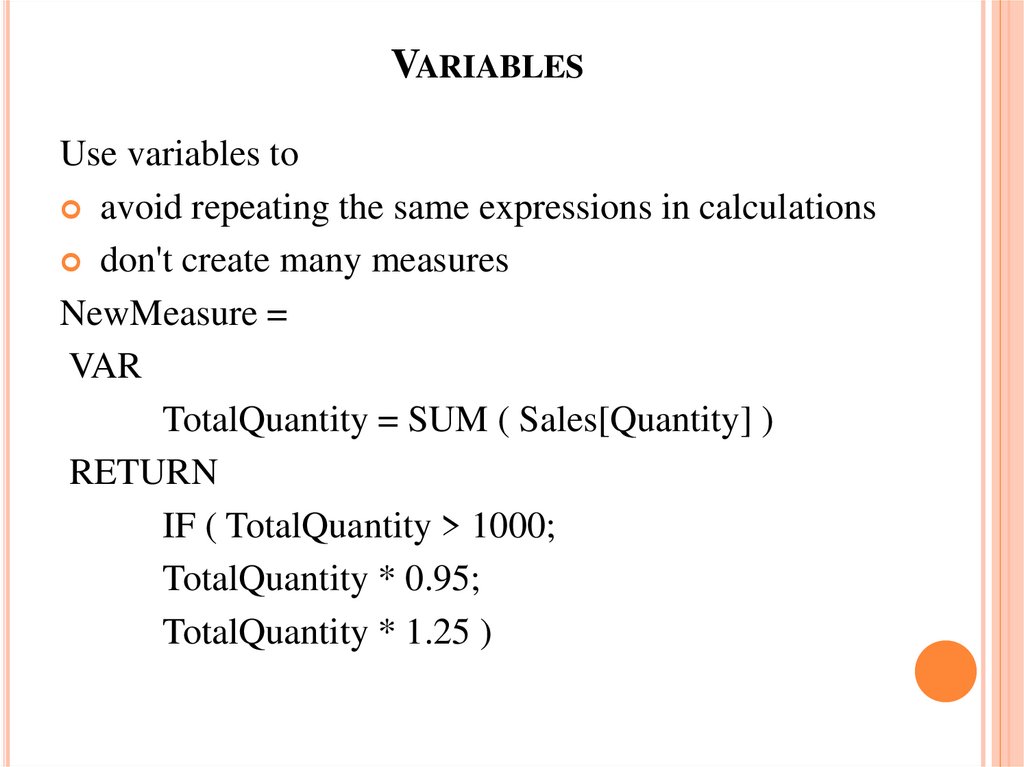
VARIABLESUse variables to
avoid repeating the same expressions in calculations
don't create many measures
NewMeasure =
VAR
TotalQuantity = SUM ( Sales[Quantity] )
RETURN
IF ( TotalQuantity > 1000;
TotalQuantity * 0.95;
TotalQuantity * 1.25 )
13.
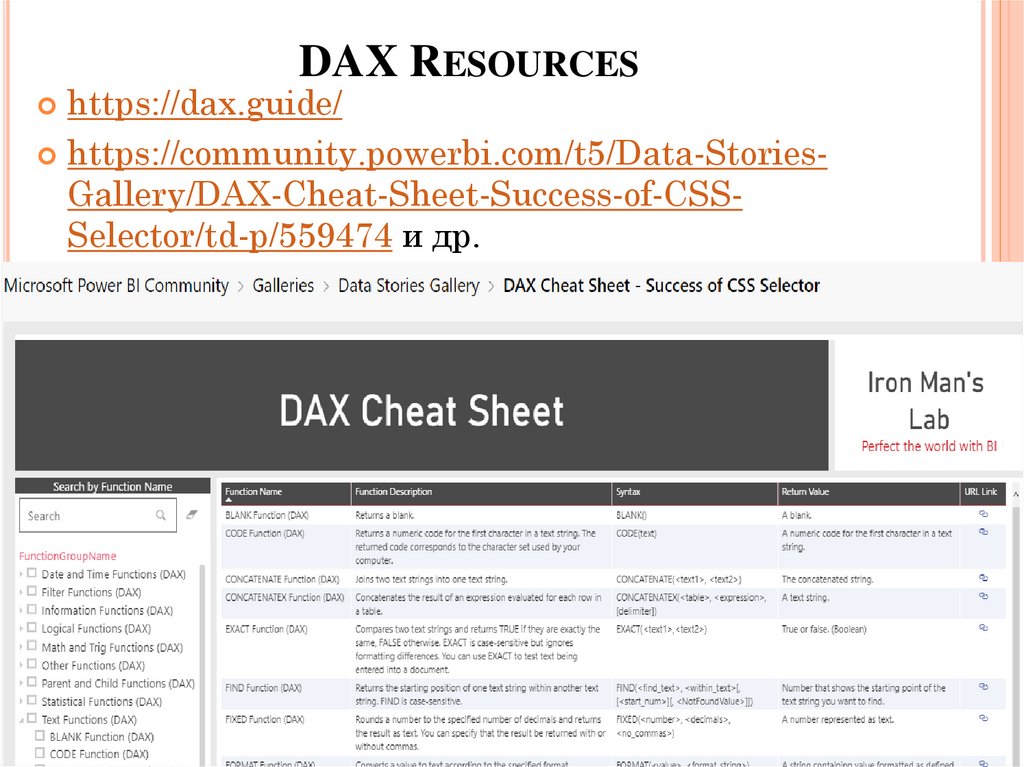
DAX RESOURCEShttps://dax.guide/
https://community.powerbi.com/t5/Data-Stories-
Gallery/DAX-Cheat-Sheet-Success-of-CSSSelector/td-p/559474 и др.
14.
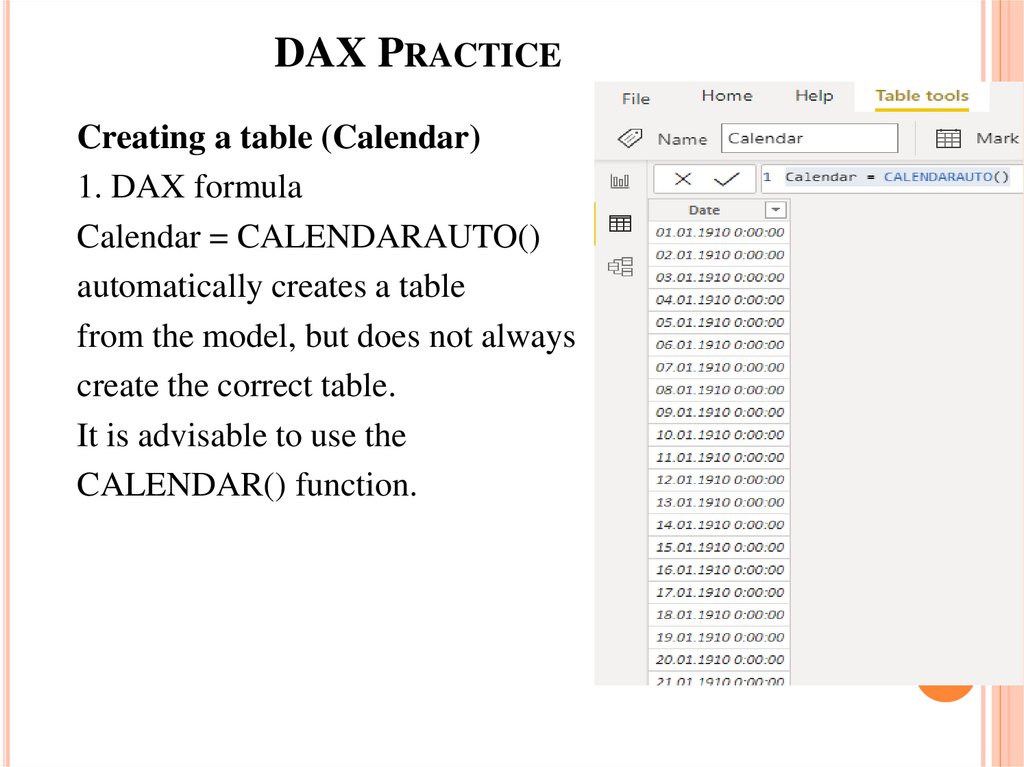
DAX PRACTICECreating a table (Calendar)
1. DAX formula
Calendar = CALENDARAUTO()
automatically creates a table
from the model, but does not always
create the correct table.
It is advisable to use the
CALENDAR() function.
15.
DAX PRACTICECreating a table (Calendar)
2. The DAX formula CALENDAR () creates a singlecolumn table with data between Startdate, Enddate.
Dates: 01.04.2014
– 07.01.2017,
1103 lines
16.
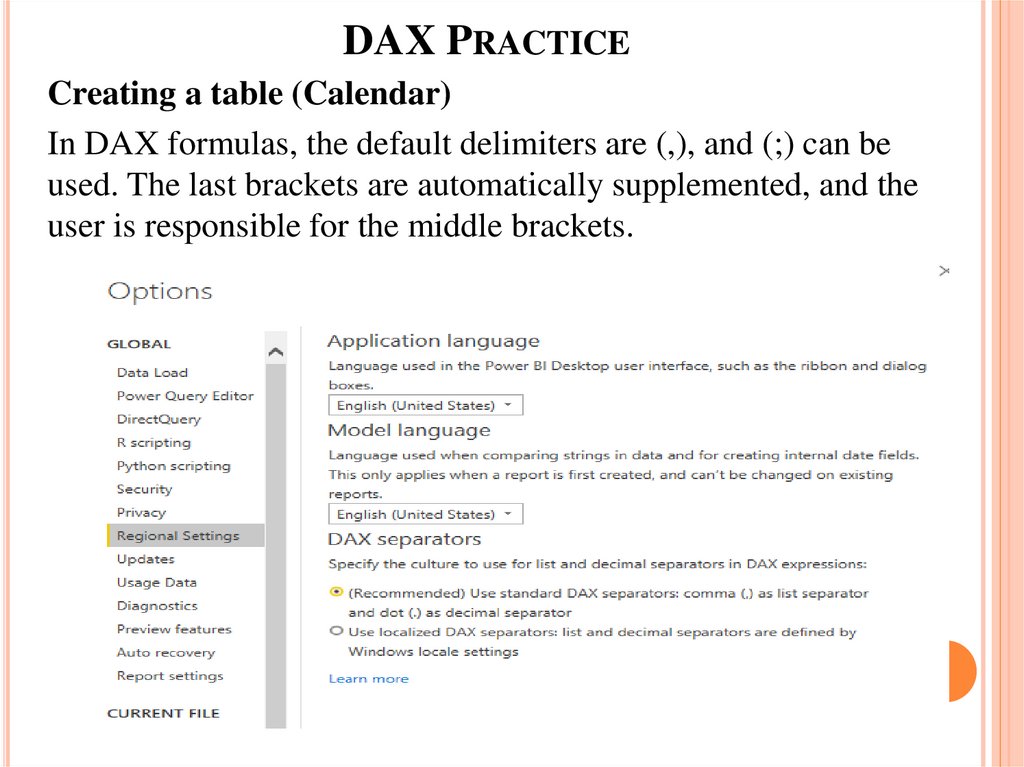
DAX PRACTICECreating a table (Calendar)
In DAX formulas, the default delimiters are (,), and (;) can be
used. The last brackets are automatically supplemented, and the
user is responsible for the middle brackets.
17.
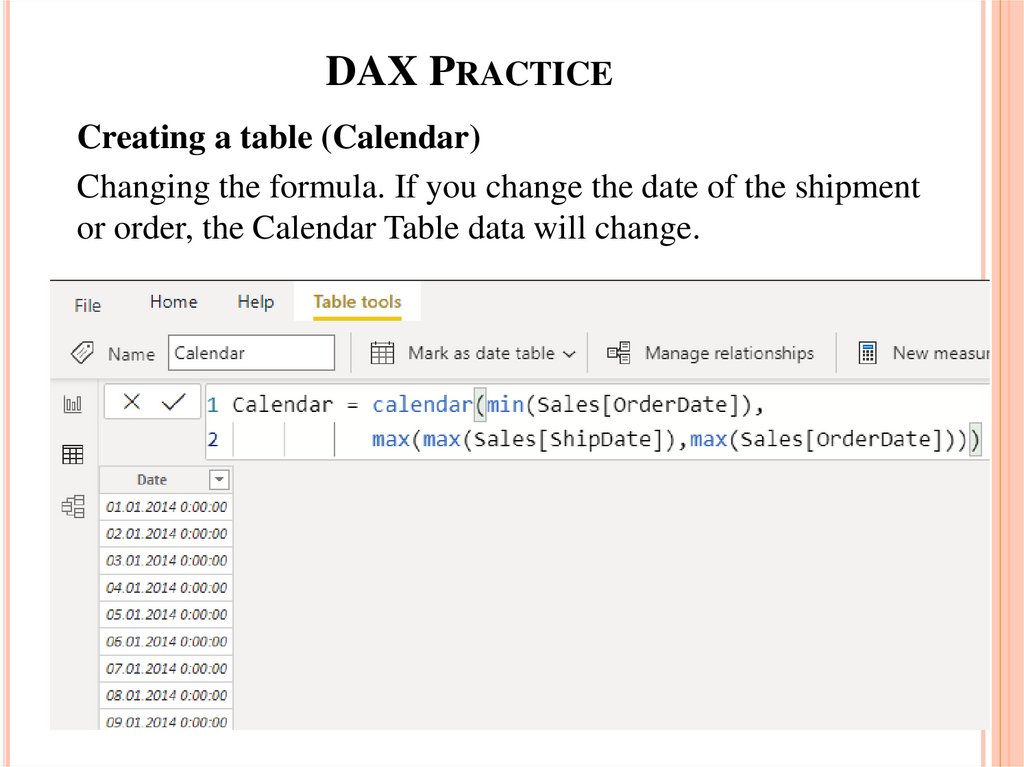
DAX PRACTICECreating a table (Calendar)
Changing the formula. If you change the date of the shipment
or order, the Calendar Table data will change.
18.
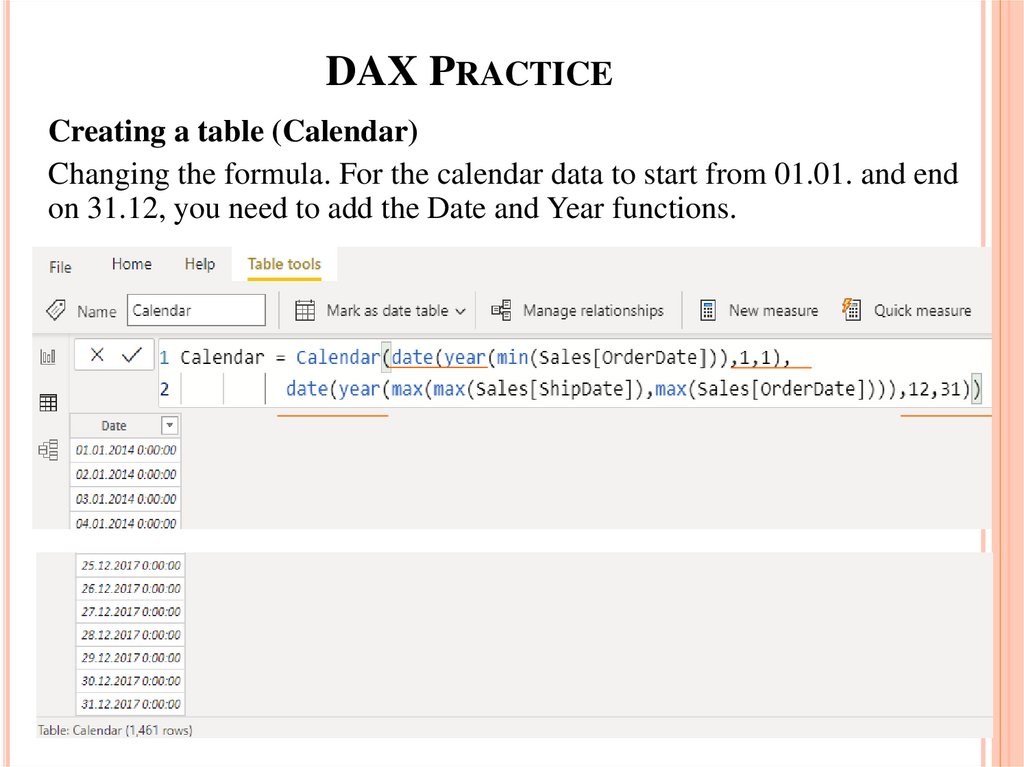
DAX PRACTICECreating a table (Calendar)
Changing the formula. For the calendar data to start from 01.01. and end
on 31.12, you need to add the Date and Year functions.
19.
DAX PRACTICECreating a table (Calendar)
Adding columns. Table tools- New Column
20.
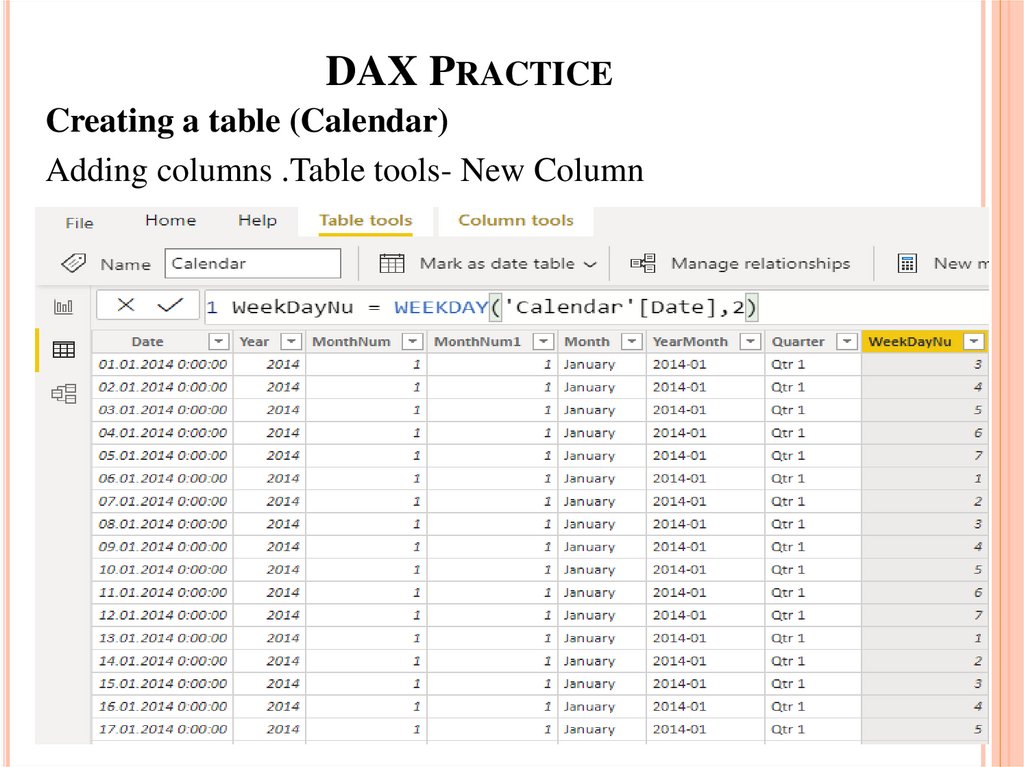
DAX PRACTICECreating a table (Calendar)
Adding columns .Table tools- New Column
21.
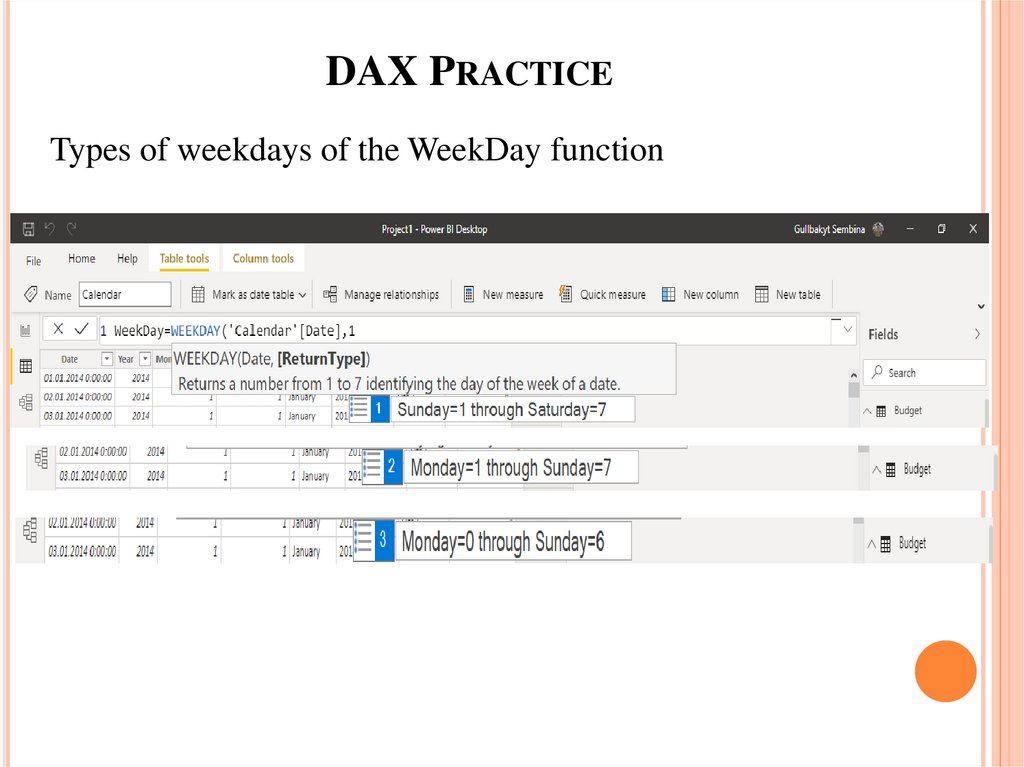
DAX PRACTICETypes of weekdays of the WeekDay function
22.
DAX PRACTICEAdding columns. Logical functions
SWITCH, IF
23.
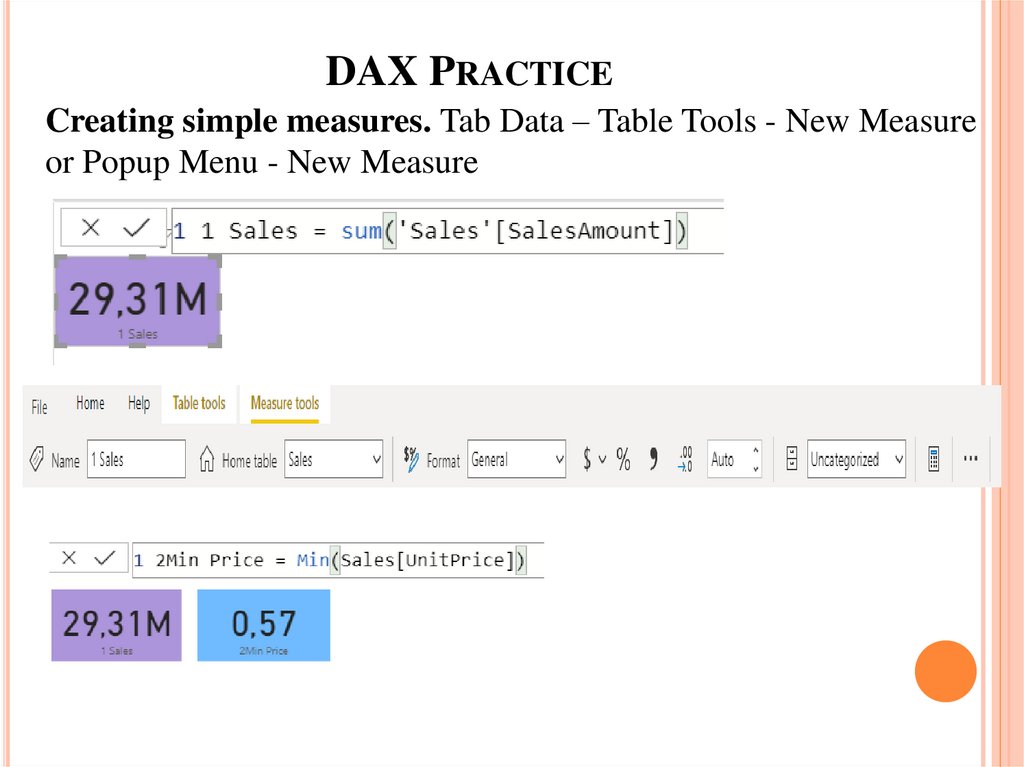
DAX PRACTICECreating simple measures. Tab Data – Table Tools - New Measure
or Popup Menu - New Measure
24.
DAX PRACTICECreating simple
measures.
25.
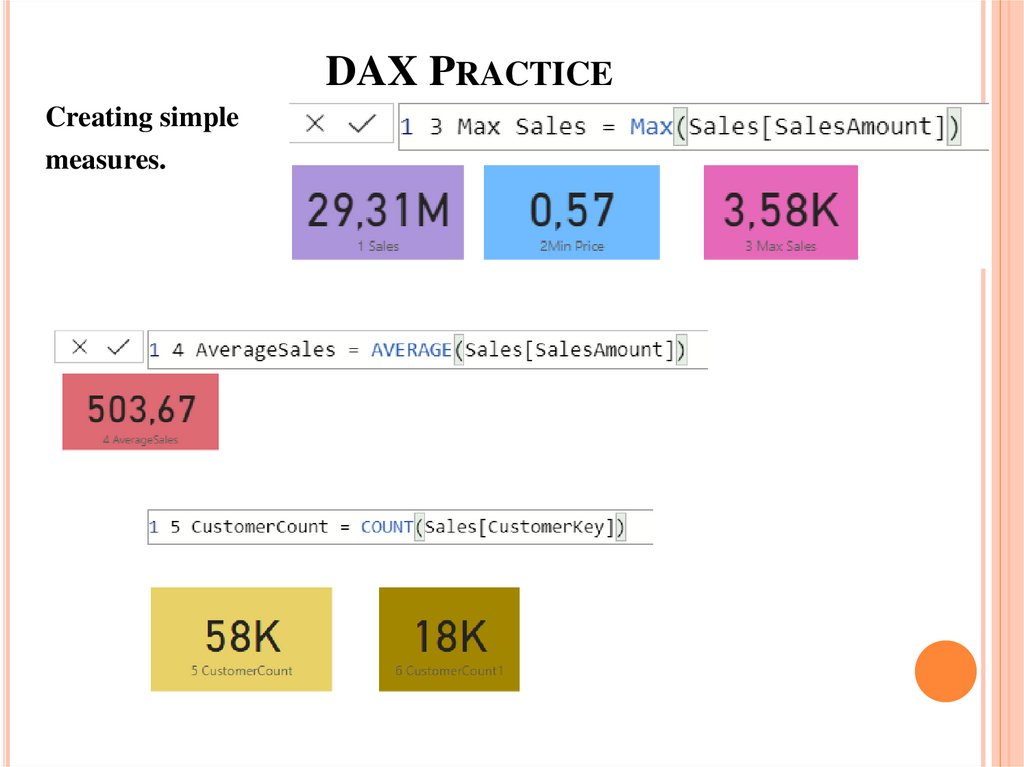
DAX PRACTICECreating simple measures.
26.
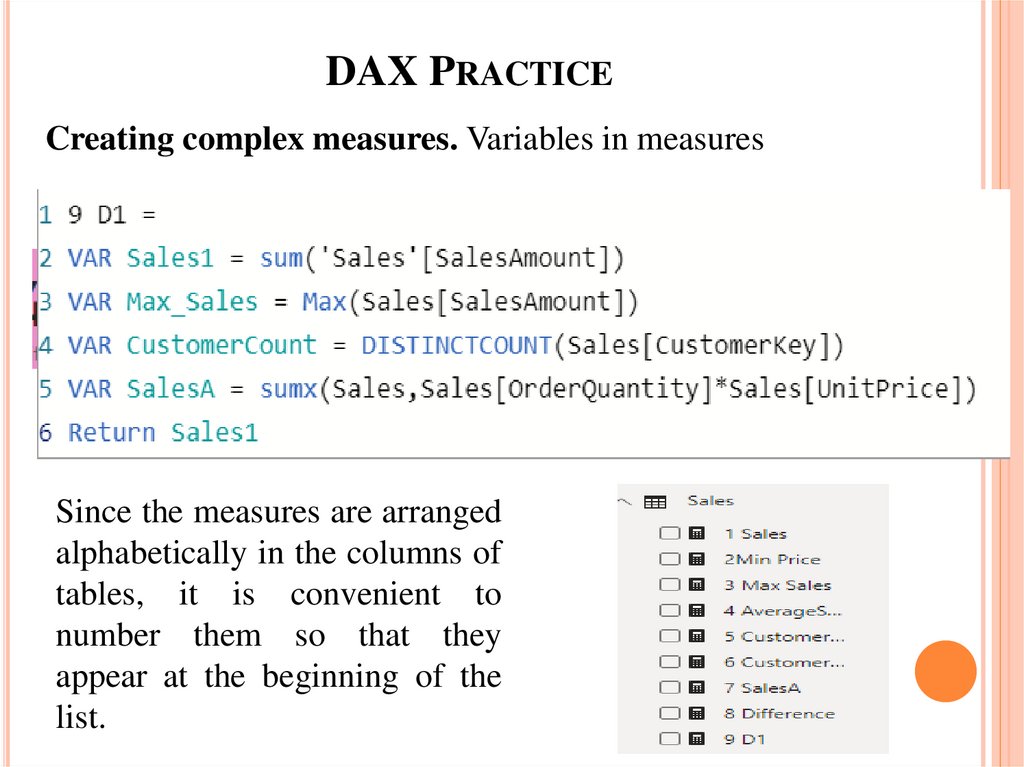
DAX PRACTICECreating complex measures. Variables in measures
Since the measures are arranged
alphabetically in the columns of
tables, it is convenient to
number them so that they
appear at the beginning of the
list.
27.
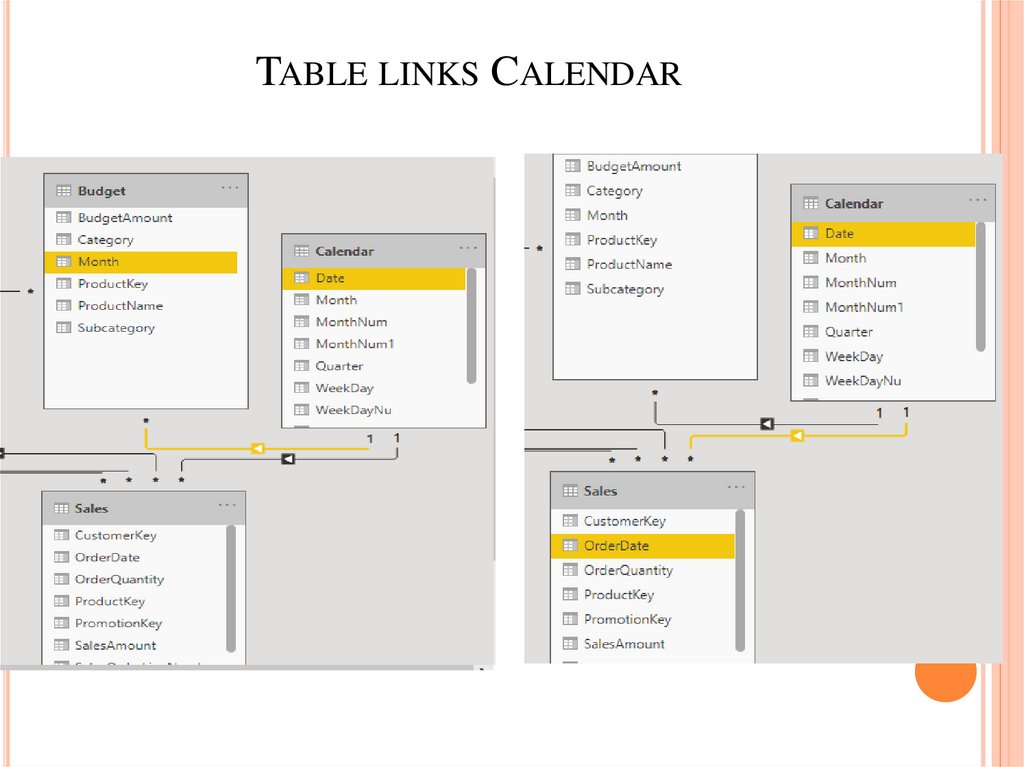
TABLE LINKS CALENDAR28.
ITERATOR FUNCTIONSThe iterator functions provide flexibility and control over
the summation of data in model calculations.
The iterator functions are SUMX, COUNTX, MINX,
MAXX, and others. In addition, there are specialized
iterator functions that perform filtering, ranking, semiadditive calculations in time, and much more.
The main characteristic of all iterator functions is that
you must pass a table and an expression.
Syntax: SUMX(<table>, <expression>)
A table can be a reference to a model table, or an
expression that returns a table object. The evaluation of
the expression must give a scalar value.
29.
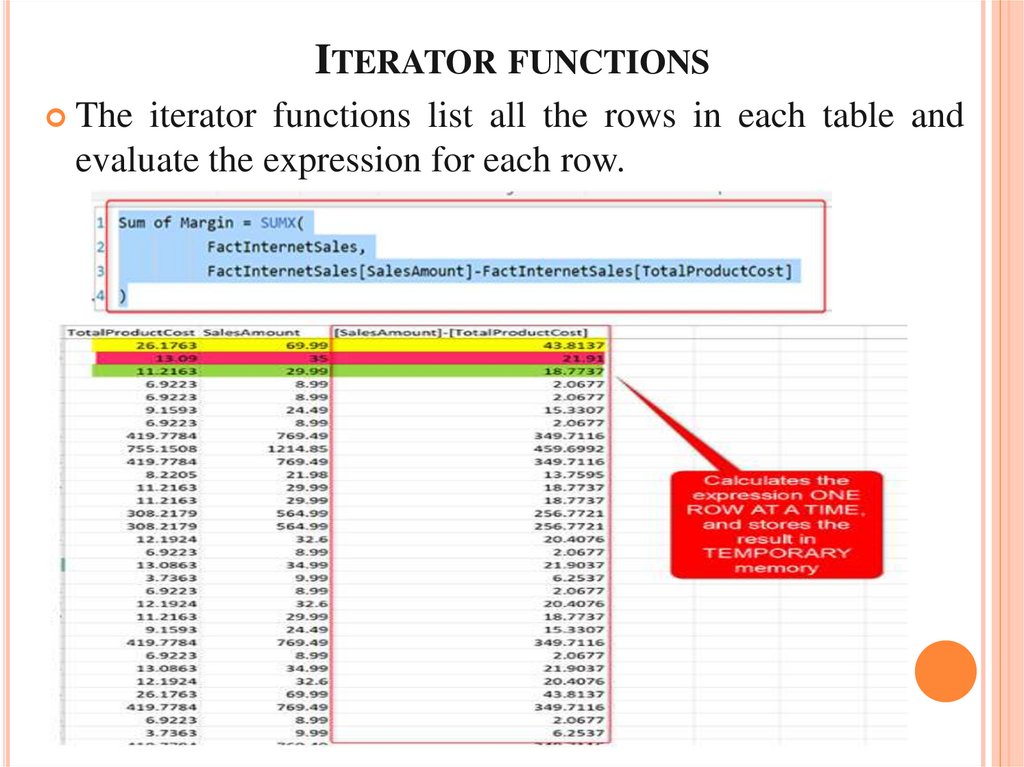
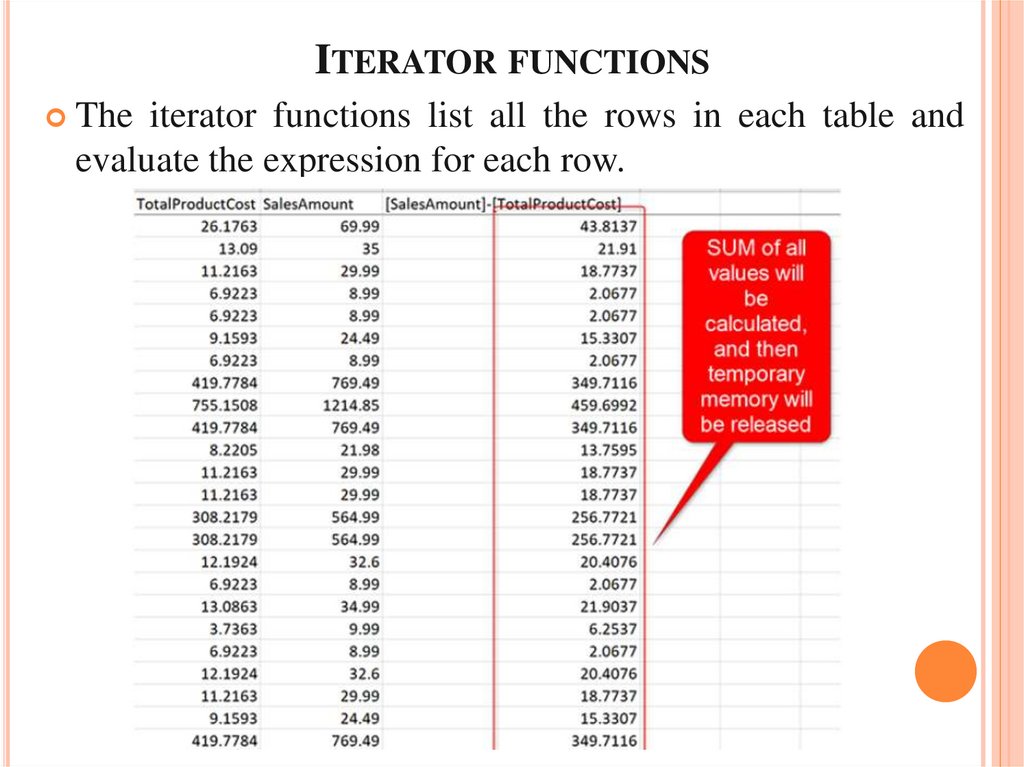
ITERATOR FUNCTIONSThe iterator functions list all the rows in each table and
evaluate the expression for each row.
30.
ITERATOR FUNCTIONSThe iterator functions list all the rows in each table and
evaluate the expression for each row.
31.
Important!When using iterator functions, make sure that
you do not use large tables (rows) with
expressions that use advanced DAX functions.
Some functions, such as the SEARCH (DAX)
function, which scans a text value for specific
characters or text, can lead to poor performance.
32.
COMPLEX SUMMARY DATA GENERATIONThe
file
was
first
downloaded
and
opened
Adventure Works DW 2020 M05.pbix.
Then the following DAX measure is added
1. Revenue = SUMX( Sales, Sales[Order Quantity] *
Sales[Unit Price] * (1 - Sales[Unit Price Discount Pct]) )
Format the Revenue measure as a currency with two decimal
places, and then add it to the table visual that contains the
Month column data from the Date table.
Using the iterator function, the Revenue measure formula
aggregates more than the values of a single column. For each
row, it uses the three-column row context values to get the
revenue amount. Row context = current row
The row context is a key component of calculated columns.
33.
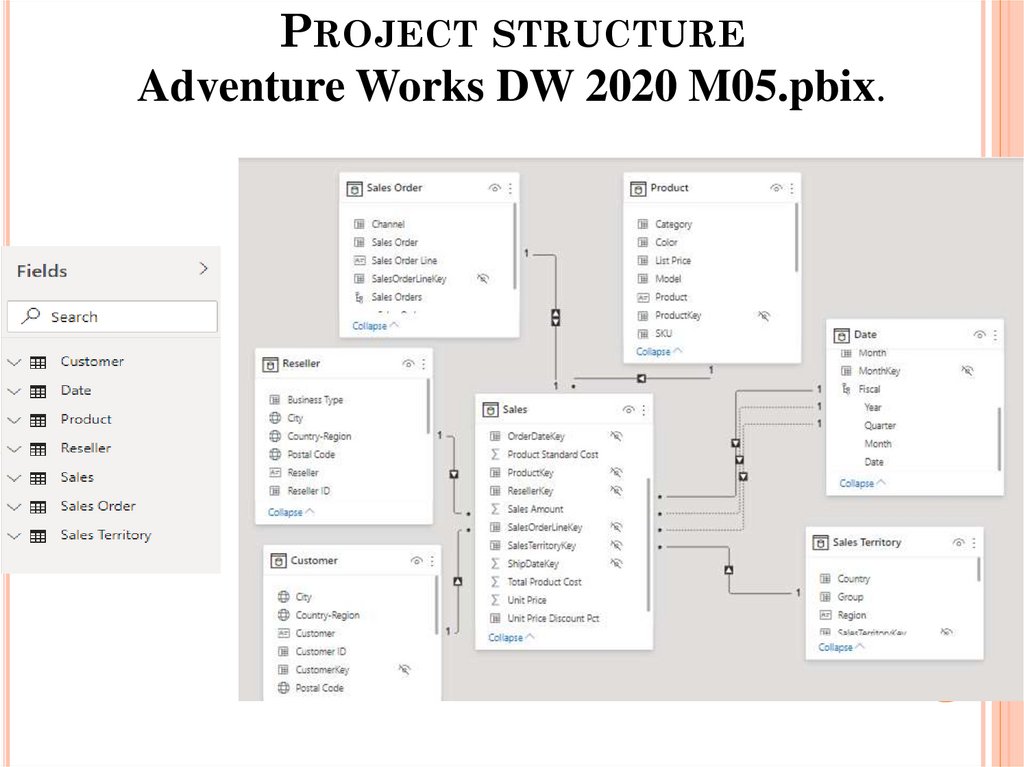
PROJECT STRUCTUREAdventure Works DW 2020 M05.pbix.
34.
COMPLEX SUMMARY DATA GENERATIONNow add another DAX measure
2.Discount = SUMX( Sales, Sales[Order Quantity] *
( RELATED('Product'[List Price]) - Sales[Unit Price] ) )
Format the Discount measure as a currency with two decimal
places, and then add it to the table visual.
The formula uses the RELATED function.
Remember that the row context does not extend beyond the
table. If your formula needs to refer to columns in other tables
and there are relationships between the tables in the model, use
the RELATED function to link.
RELATED function-Returns a related value from another
table. RELATED(<column>) syntax)
35.
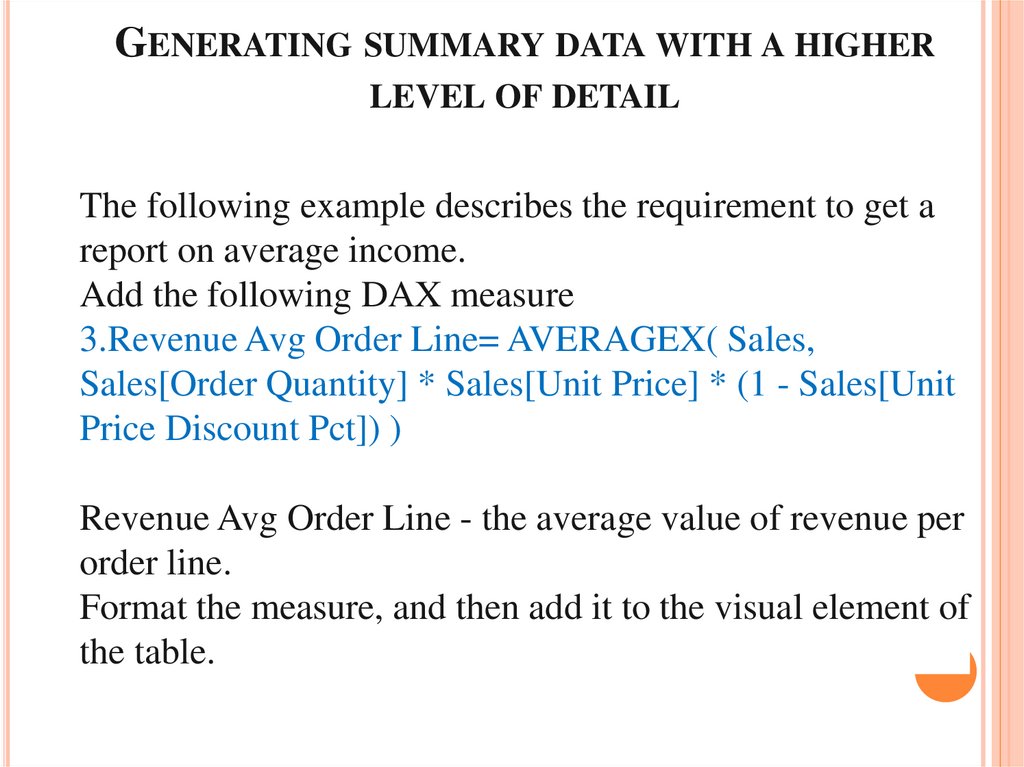
GENERATING SUMMARY DATA WITH A HIGHERLEVEL OF DETAIL
The following example describes the requirement to get a
report on average income.
Add the following DAX measure
3.Revenue Avg Order Line= AVERAGEX( Sales,
Sales[Order Quantity] * Sales[Unit Price] * (1 - Sales[Unit
Price Discount Pct]) )
Revenue Avg Order Line - the average value of revenue per
order line.
Format the measure, and then add it to the visual element of
the table.
36.
GENERATING SUMMARY DATA WITH AHIGHER LEVEL OF DETAIL
In the following example, the iterator function is used to create
a measure that increases the granularity to the level of a sales
order (a sales order consists of one or more order lines).
Add the following DAX measure
4. Revenue Avg Order = AVERAGEX( VALUES ('Sales
Order'[Sales Order]), [1.Revenue] )
The formula uses the VALUES (DAX) function. With this
function, formulas can determine which values are in the
filter context. In this case, the AVERAGEX function iterates
over each sales order in the filter context.
In other words, it iterates through each sales order in a month.
Filter context is a set of filters in a pivot table
37.
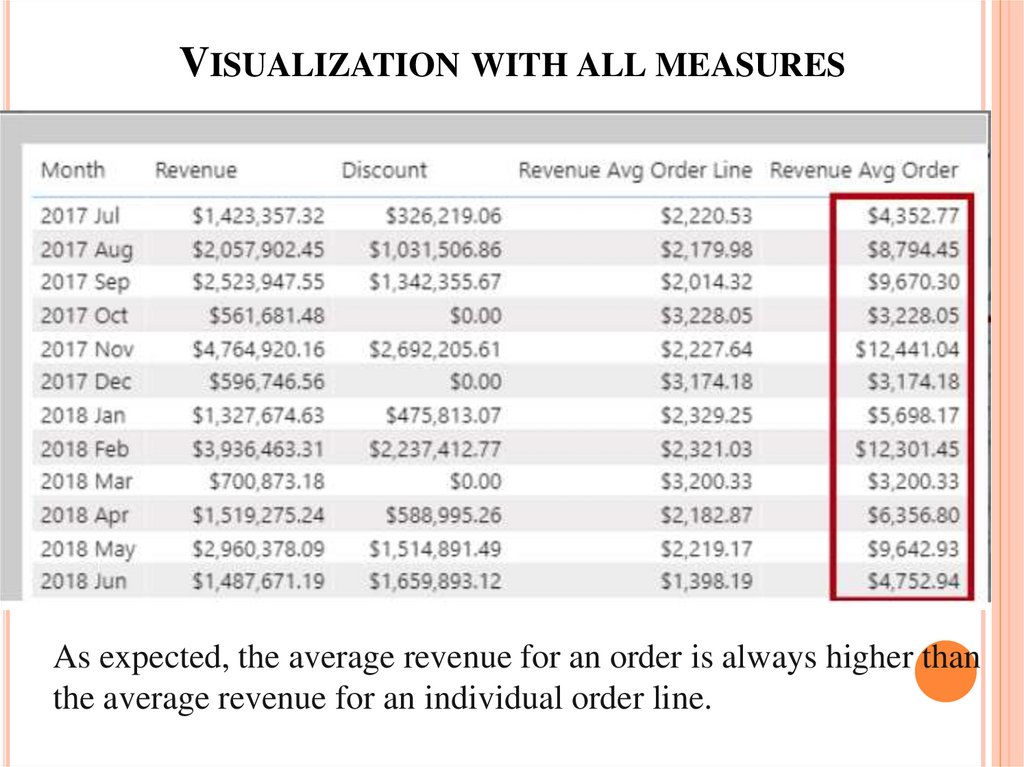
VISUALIZATION WITH ALL MEASURESAs expected, the average revenue for an order is always higher than
the average revenue for an individual order line.
38.
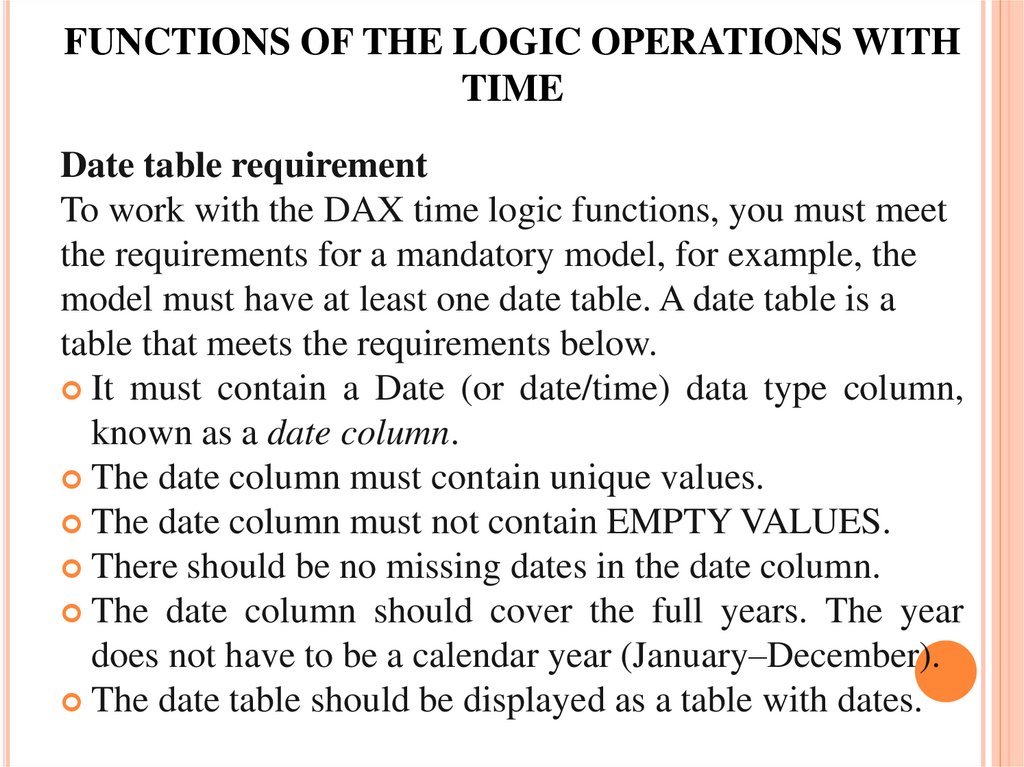
FUNCTIONS OF THE LOGIC OPERATIONS WITHTIME
Date table requirement
To work with the DAX time logic functions, you must meet
the requirements for a mandatory model, for example, the
model must have at least one date table. A date table is a
table that meets the requirements below.
It must contain a Date (or date/time) data type column,
known as a date column.
The date column must contain unique values.
The date column must not contain EMPTY VALUES.
There should be no missing dates in the date column.
The date column should cover the full years. The year
does not have to be a calendar year (January–December).
The date table should be displayed as a table with dates.
39.
METHODS FOR GENERATING SUMMARY DATA BYTIME
Function DAX DATESYTD — returns a single-column table that
contains the dates from the beginning of the year (YTD) for the current
filter context. This group also includes functions
DAX DATESMTD and DATESQTD from the beginning of the month
(MTD) and from the beginning of the quarter (QTD). These functions can
be passed as filters to the DAX CALCULATE function .
Function DAX TOTALYTD —evaluates the expression for YTD in the
current filter context. Also included are the equivalent DAX functions for
the QTD and MTD period TOTALQTD and TOTALMTD .
Function DAX DATESBETWEEN — returns a table containing a
column with dates starting from the start date value and ending with the
end date value.
Function DAX DATESINPERIOD — returns a table containing a date
column that starts with the start date value and continues for the specified
number of intervals..
40.
METHODS FOR GENERATING SUMMARY DATA BYTIME
Function DAX TOTALYTD —evaluates the expression
for YTD in the current filter context. Also included are the
equivalent DAX functions for the QTD and MTD period
TOTALQTD and TOTALMTD .
The syntax of TOTALYTD is as follows :
TOTALYTD(<expression>,
<dates>,
[,
<filter>][,
<year_end_date>])
The function requires an expression and a reference to the
date column of the labeled date table. If necessary, you can
pass a single filter criterion or the end date of the year
(required only if the year does not end on December 31).
41.
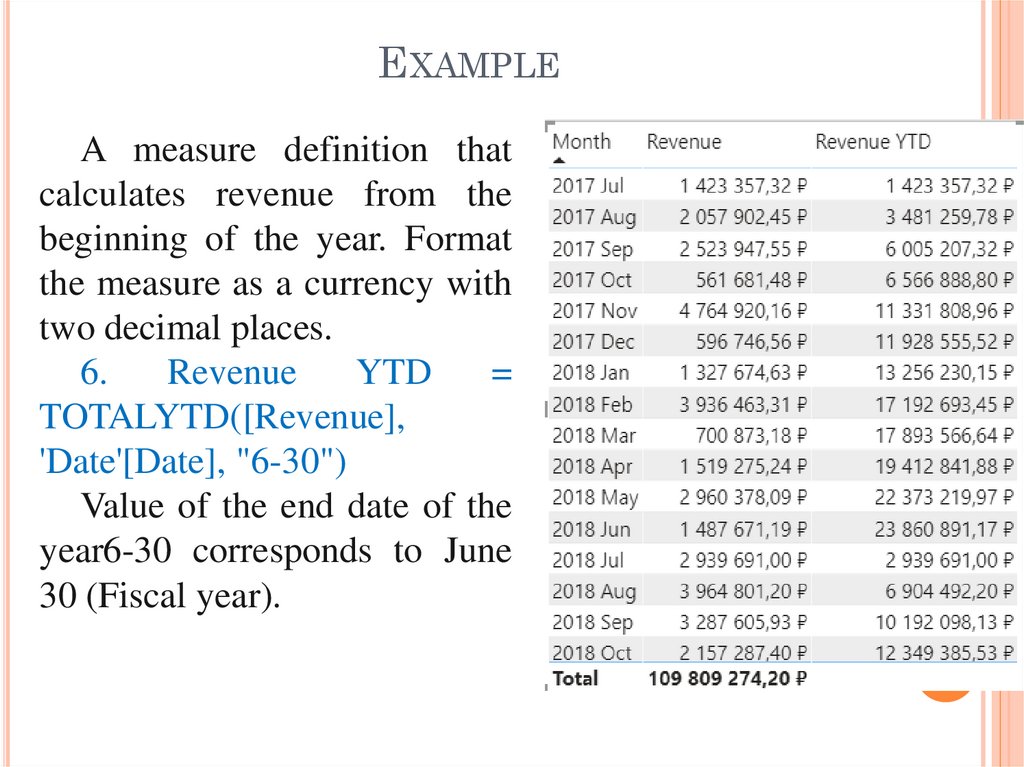
EXAMPLEA measure definition that
calculates revenue from the
beginning of the year. Format
the measure as a currency with
two decimal places.
6.
Revenue
YTD
=
TOTALYTD([Revenue],
'Date'[Date], "6-30")
Value of the end date of the
year6-30 corresponds to June
30 (Fiscal year).
42.
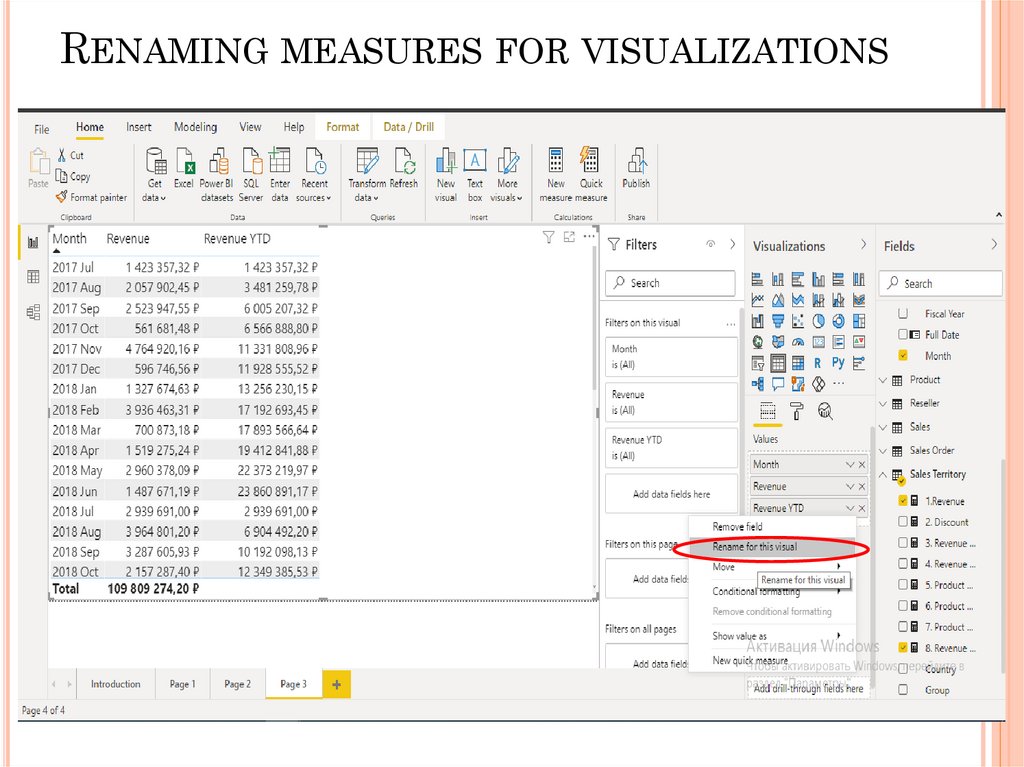
RENAMING MEASURES FOR VISUALIZATIONS43.
Calculating new occurrencesAnother application of the logic functions of operations
over time is the counting of new occurrences.
The following example shows how you can calculate the
number of new customers for a specific time period. A new
customer is counted for the period of time during which they
made their first purchase.
The first task is to add the following measure definition,
which counts the number of unique customers for the entire
period (LTD).
For the entire period means from the start date to the end
date in the filter context.
44.
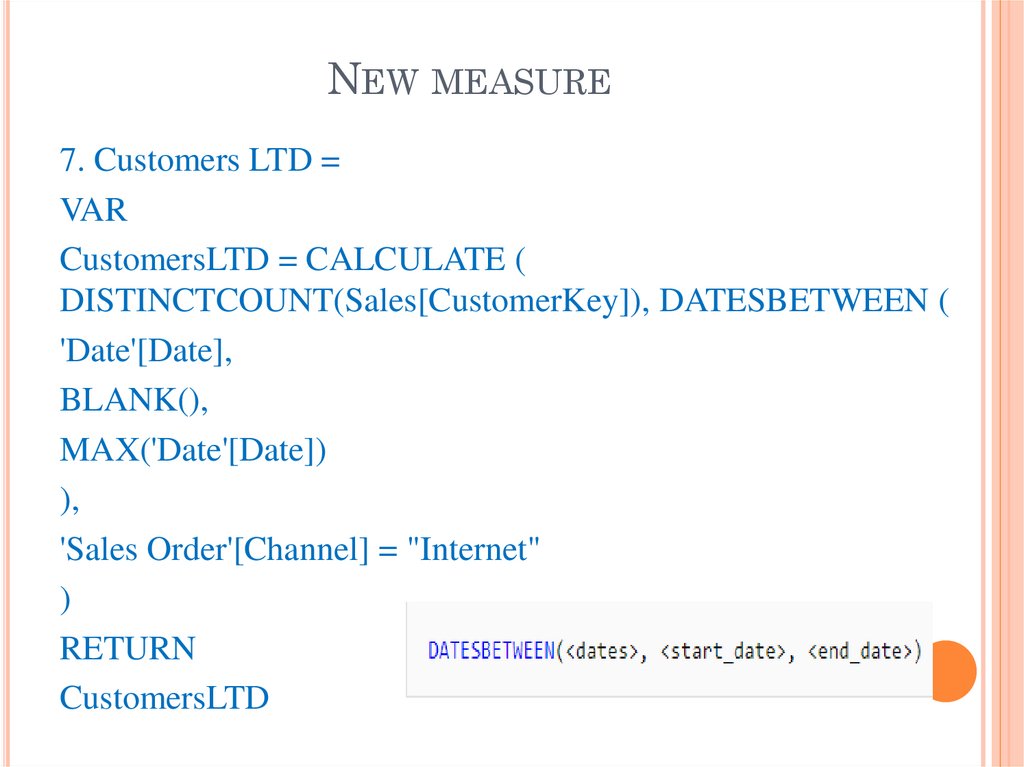
NEW MEASURE7. Customers LTD =
VAR
CustomersLTD = CALCULATE (
DISTINCTCOUNT(Sales[CustomerKey]), DATESBETWEEN (
'Date'[Date],
BLANK(),
MAX('Date'[Date])
),
'Sales Order'[Channel] = "Internet"
)
RETURN
CustomersLTD
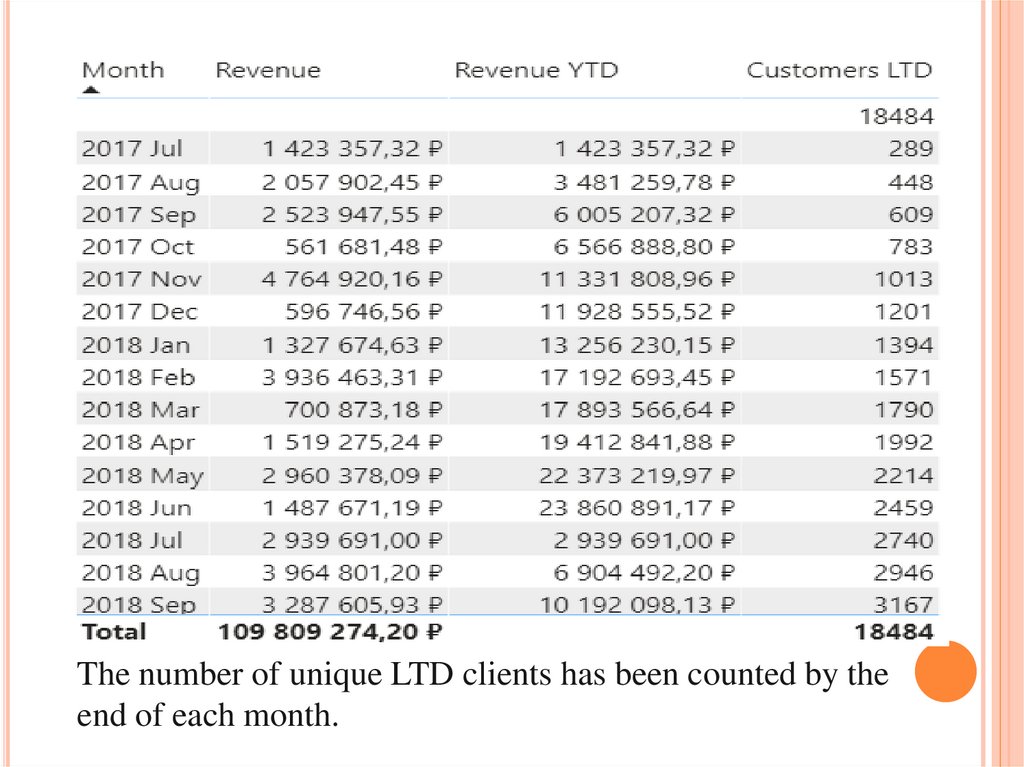
45.
The number of unique LTD clients has been counted by theend of each month.