 География
Похожие презентации:


A new operational wind wave observing system based on navigational X‐band radar
1.
A new operational wind wave observing systembased on navigational X‐band radar: a potential
for a massive wave observations worldwide
Elizaveta Ezhova1,2, Alexander Gavrikov1, Natalia Tilinina1, Vitali Sharmar1, Sergey Gulev1
1 P.P. Shirshov Institute of Oceanology, Russian Academy of Science
Sea Atmosphere Interaction Laboratory
2 Moscow Institute of Physics and Technology
2.
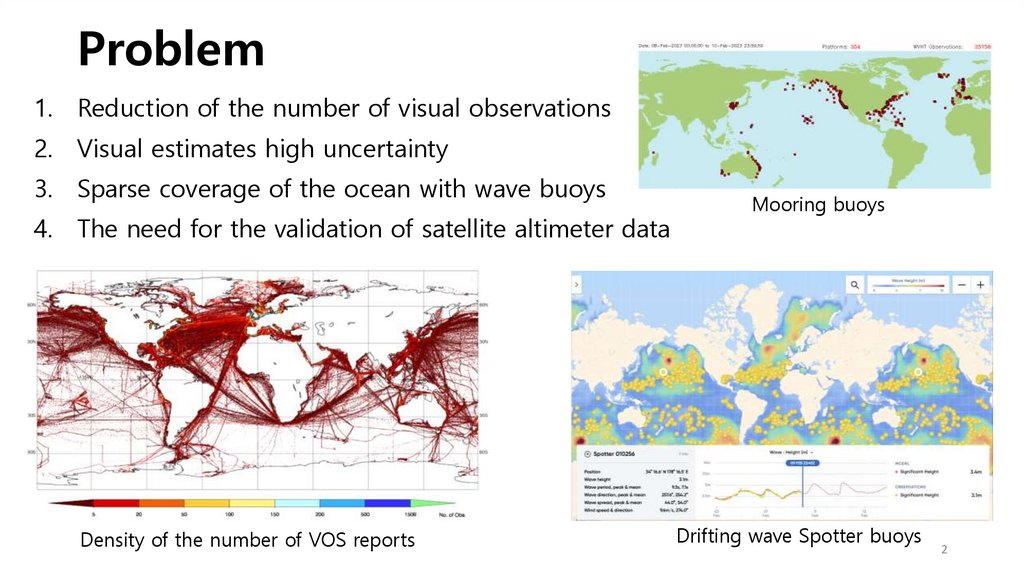
Problem1. Reduction of the number of visual observations
2. Visual estimates high uncertainty
3. Sparse coverage of the ocean with wave buoys
4. The need for the validation of satellite altimeter data
Density of the number of VOS reports
Mooring buoys
Drifting wave Spotter buoys
2
3.
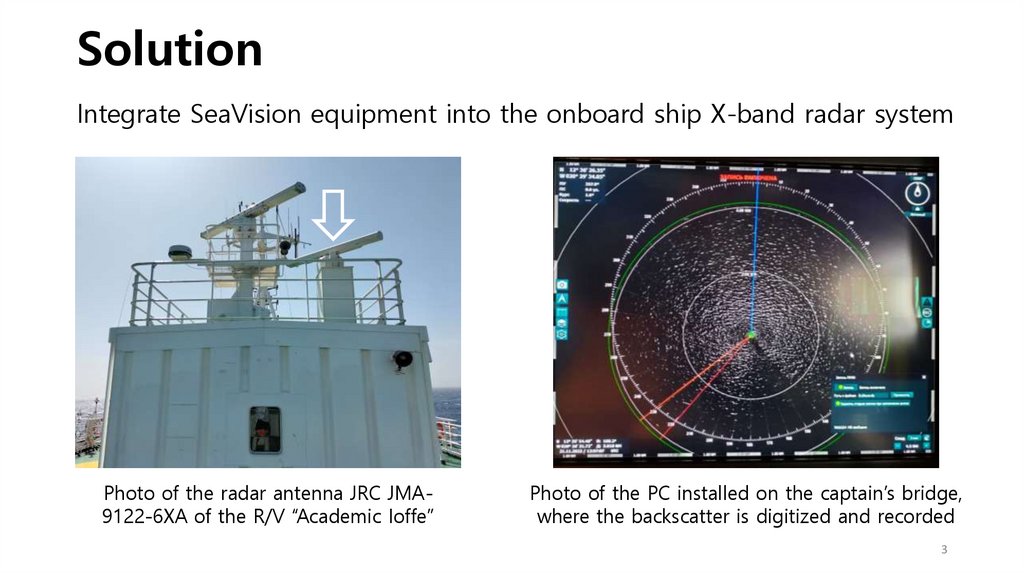
SolutionIntegrate SeaVision equipment into the onboard ship X-band radar system
Photo of the radar antenna JRC JMA9122-6XA of the R/V “Academic Ioffe”
Photo of the PC installed on the captain’s bridge,
where the backscatter is digitized and recorded
3
4.
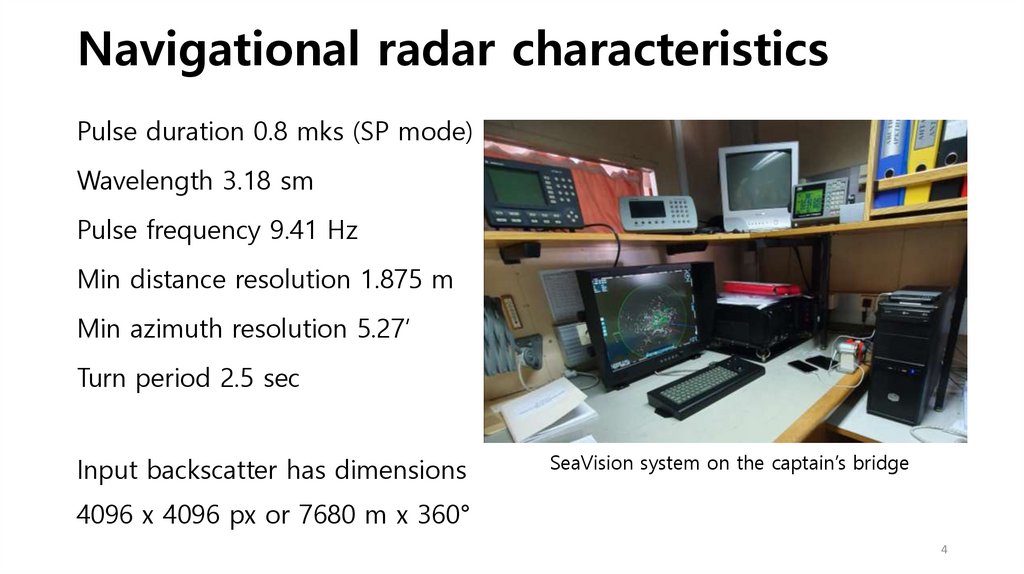
Navigational radar characteristicsPulse duration 0.8 mks (SP mode)
Wavelength 3.18 sm
Pulse frequency 9.41 Hz
Min distance resolution 1.875 m
Min azimuth resolution 5.27’
Turn period 2.5 sec
Input backscatter has dimensions
SeaVision system on the captain’s bridge
4096 x 4096 px or 7680 m x 360°
4
5.
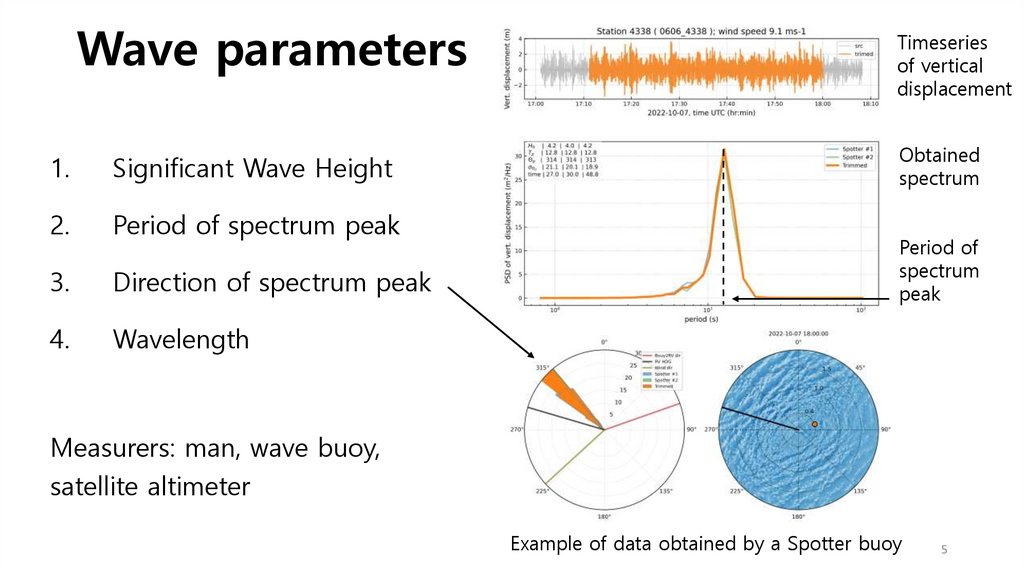
Wave parameters1.
Significant Wave Height
2.
Period of spectrum peak
3.
Direction of spectrum peak
4.
Wavelength
Timeseries
of vertical
displacement
Obtained
spectrum
Period of
spectrum
peak
Measurers: man, wave buoy,
satellite altimeter
Example of data obtained by a Spotter buoy
5
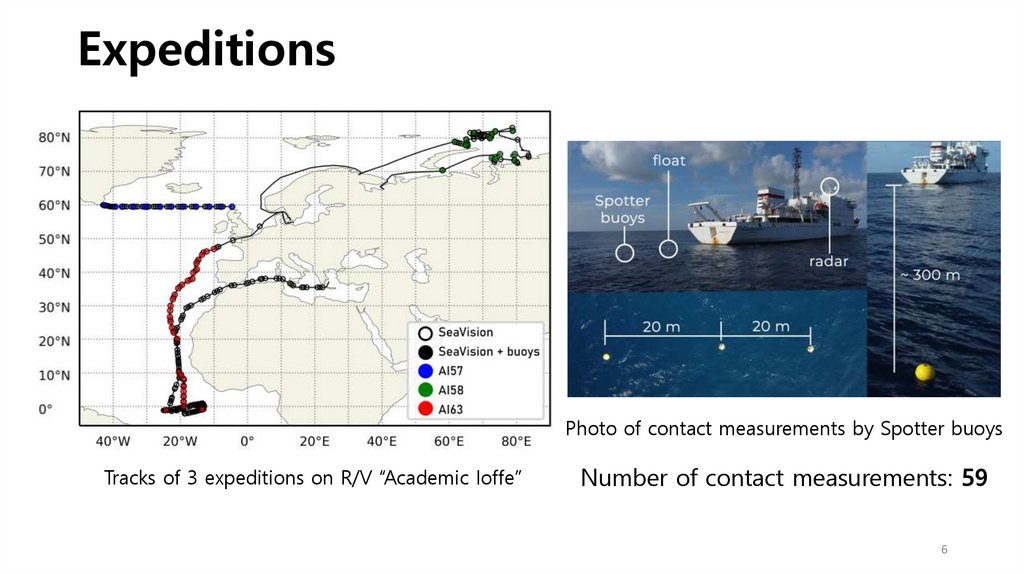
6.
ExpeditionsPhoto of contact measurements by Spotter buoys
Tracks of 3 expeditions on R/V “Academic Ioffe”
Number of contact measurements: 59
6
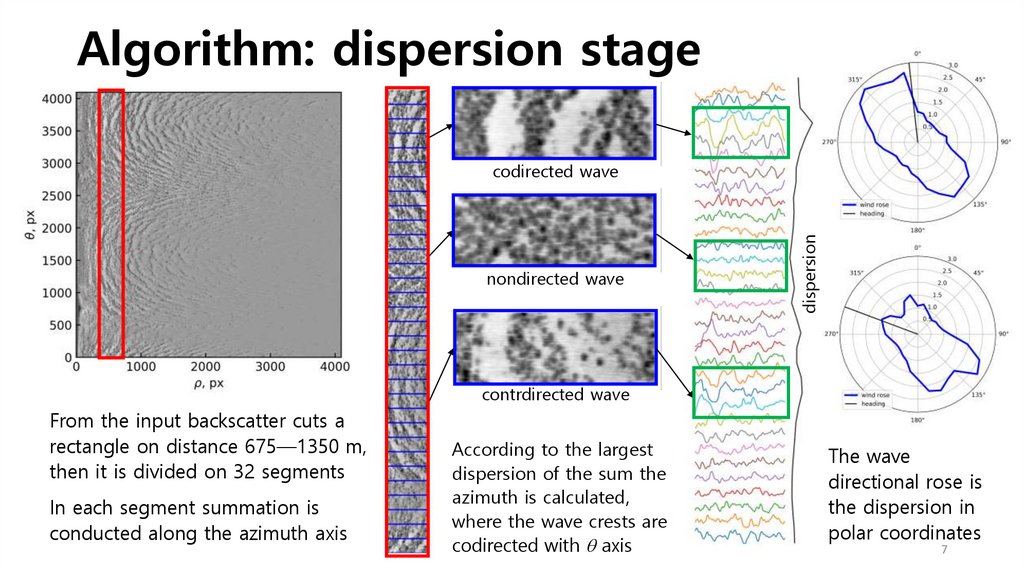
7.
Algorithm: dispersion stagenondirected wave
dispersion
codirected wave
contrdirected wave
From the input backscatter cuts a
rectangle on distance 675—1350 m,
then it is divided on 32 segments
In each segment summation is
conducted along the azimuth axis
According to the largest
dispersion of the sum the
azimuth is calculated,
where the wave crests are
codirected with q axis
The wave
directional rose is
the dispersion in
polar coordinates
7
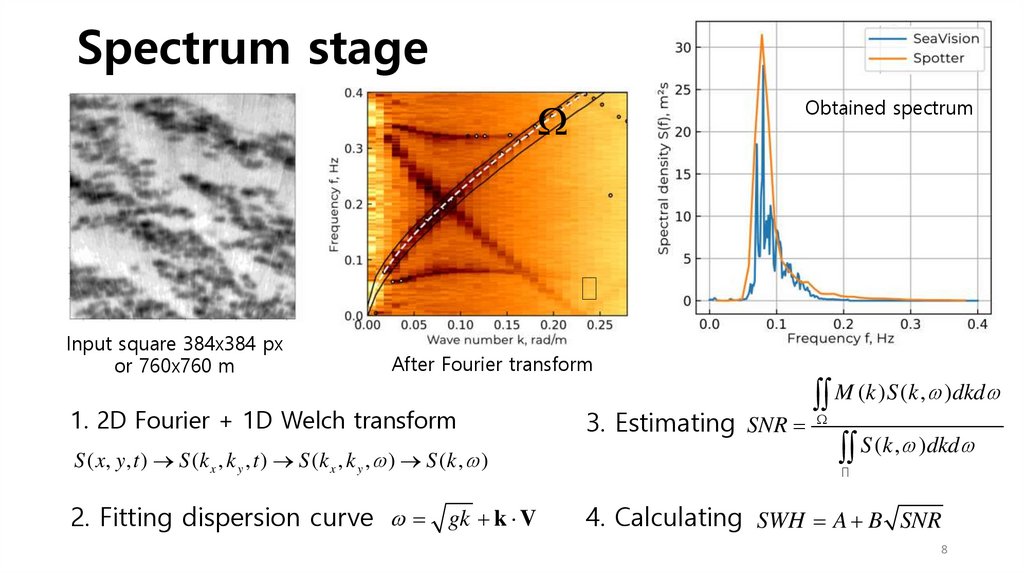
8.
Spectrum stageObtained spectrum
Input square 384x384 px
or 760x760 m
After Fourier transform
1. 2D Fourier + 1D Welch transform
S ( x, y , t ) S ( k x , k y , t ) S ( k x , k y , ) S ( k , )
2. Fitting dispersion curve gk k V
M (k )S (k , )dkd
3. Estimating SNR
S (k , )dkd
4. Calculating SWH A B SNR
8
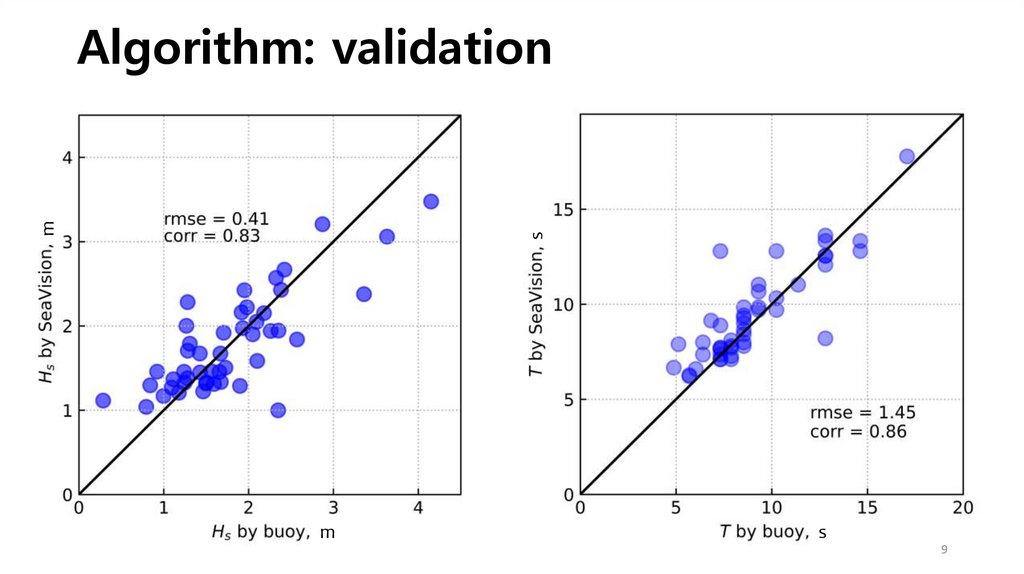
9.
sm
Algorithm: validation
m
s
9
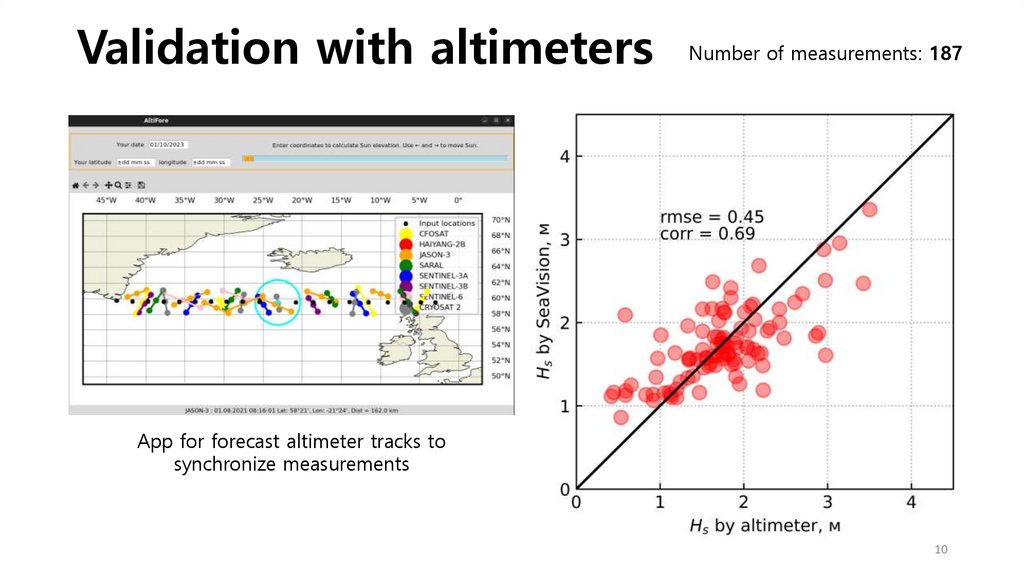
10.
Validation with altimetersNumber of measurements: 187
App for forecast altimeter tracks to
synchronize measurements
10
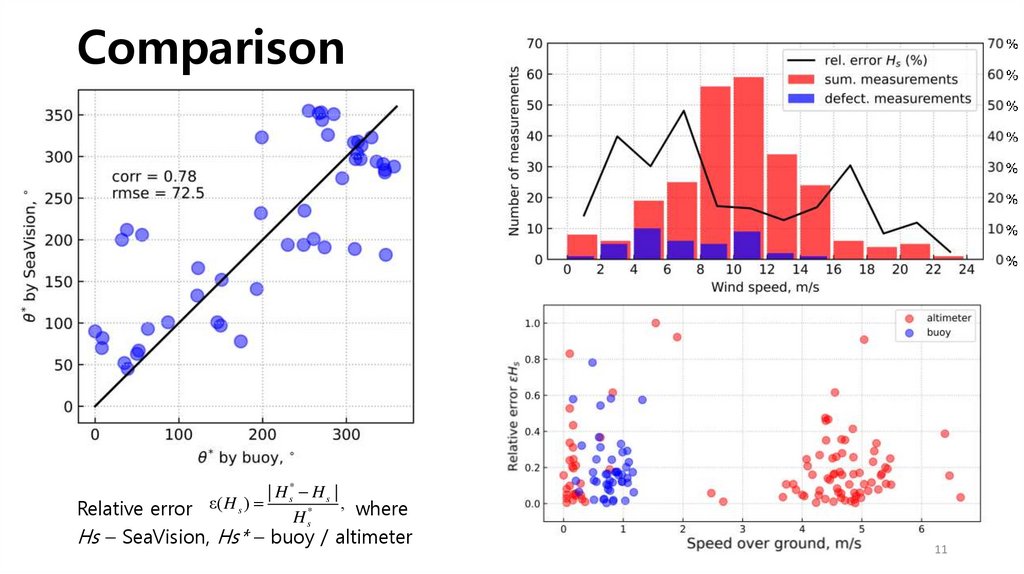
11.
Comparison| H s* H s |
, where
Relative error ε( H s )
H s*
Hs – SeaVision, Hs* – buoy / altimeter
11
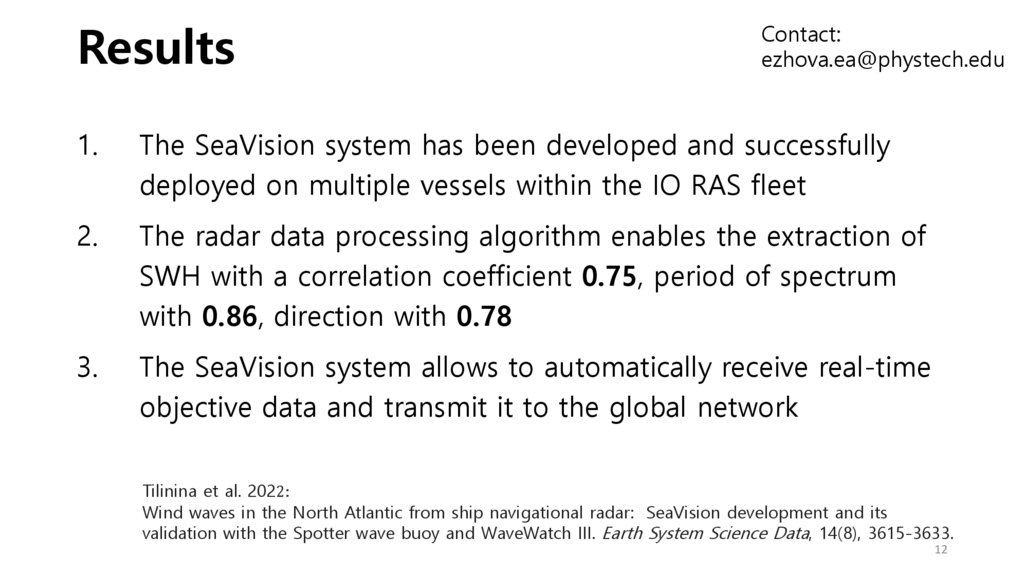
12.
ResultsContact:
ezhova.ea@phystech.edu
1.
The SeaVision system has been developed and successfully
deployed on multiple vessels within the IO RAS fleet
2.
The radar data processing algorithm enables the extraction of
SWH with a correlation coefficient 0.75, period of spectrum
with 0.86, direction with 0.78
3.
The SeaVision system allows to automatically receive real-time
objective data and transmit it to the global network
Tilinina et al. 2022:
Wind waves in the North Atlantic from ship navigational radar: SeaVision development and its
validation with the Spotter wave buoy and WaveWatch III. Earth System Science Data, 14(8), 3615-3633.
12