


 Медицина
 Социология
Похожие презентации:


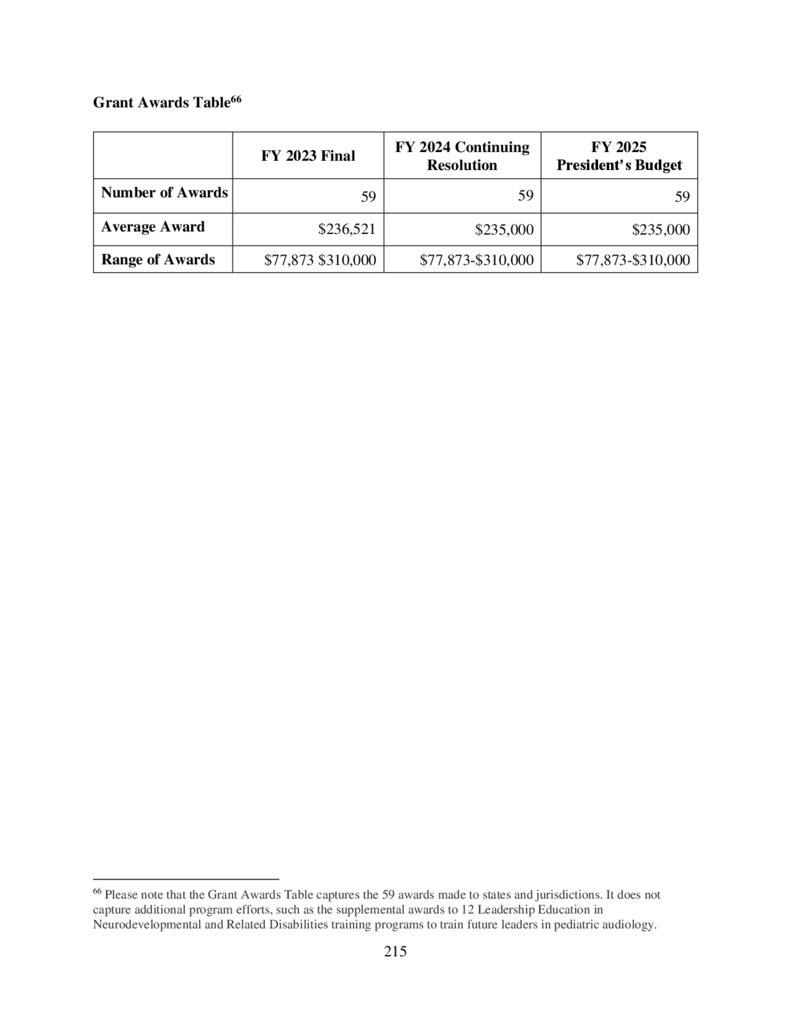
")


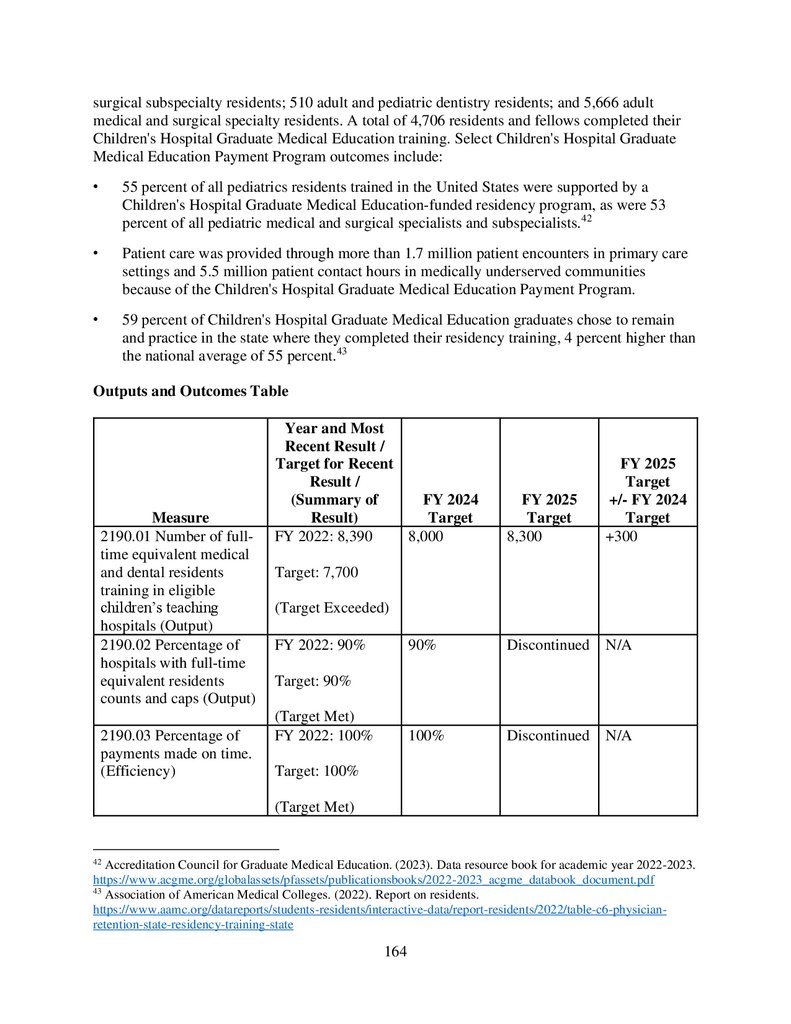
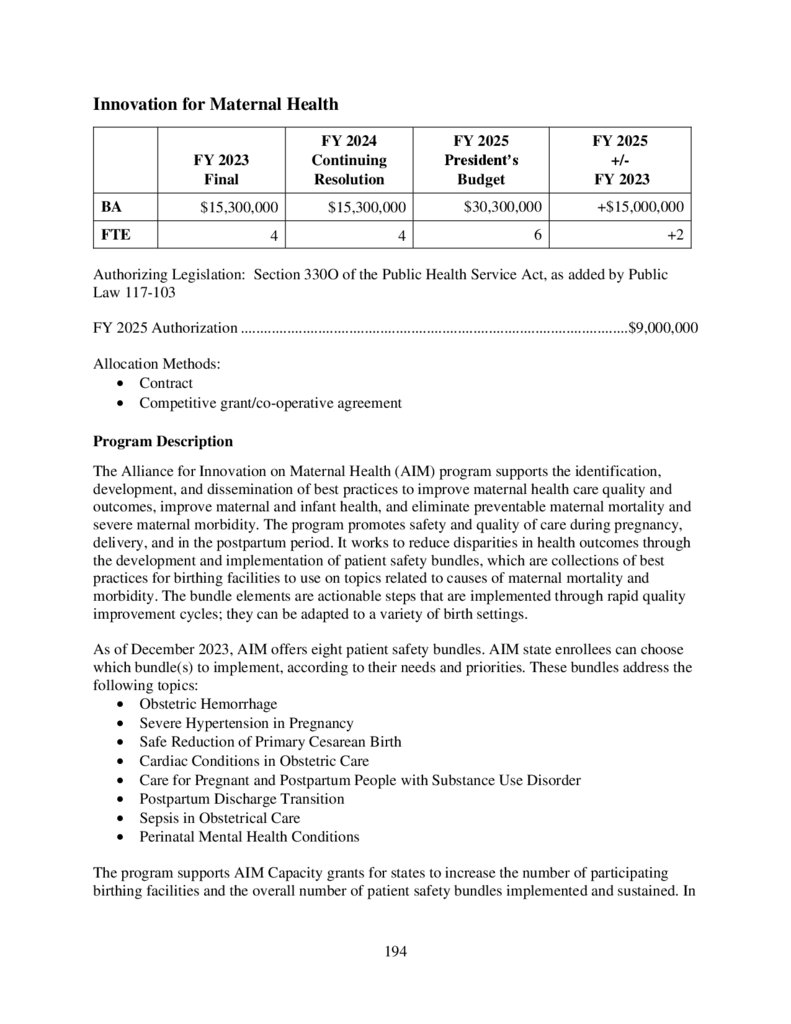
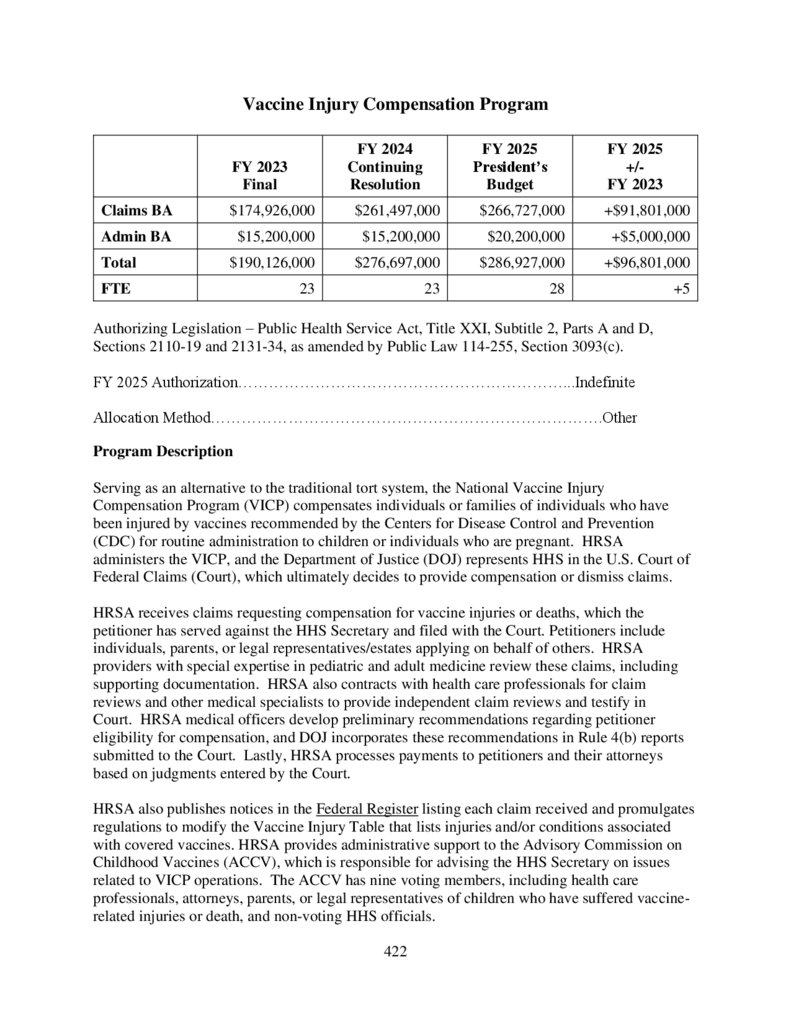
Department of health and human services
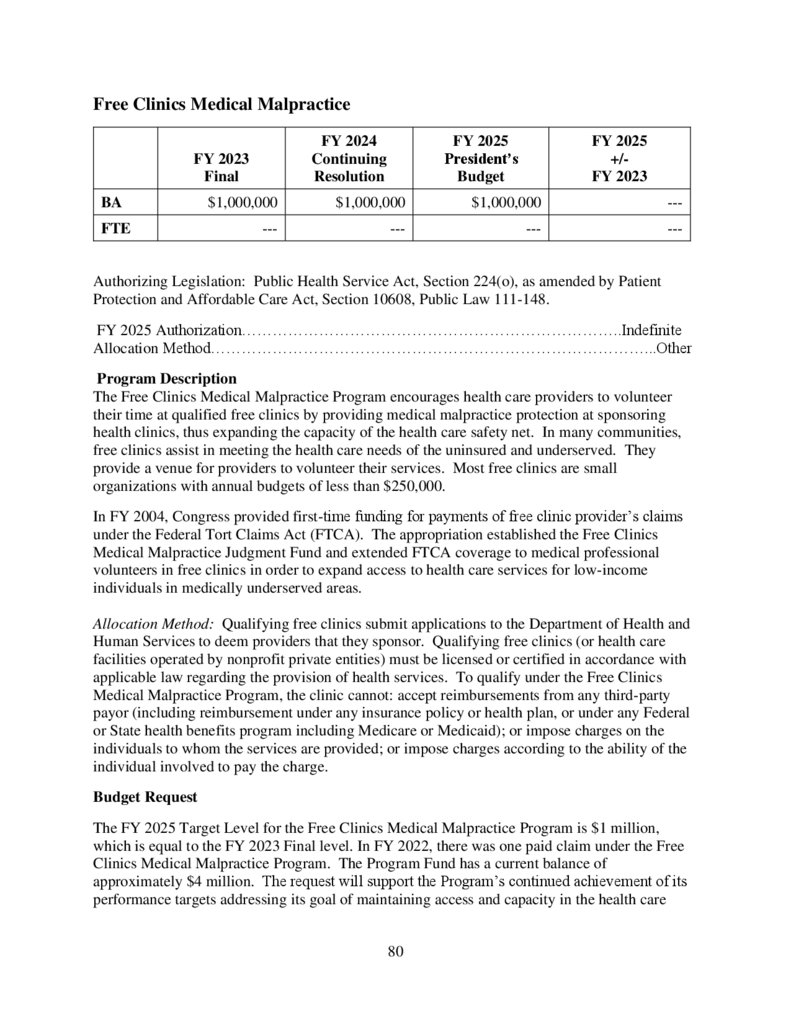
1.
DEPARTMENTof HEALTH
and HUMAN
SERVICES
Fiscal Year
2025
Health Resources and
Services Administration
Justification of
Estimates for
Appropriations Committees
2.
5600 Fishers LaneRockville, MD 20857
MESSAGE FROM THE ADMINISTRATOR
I am pleased to transmit the Congressional Justification of the Health Resources and Services
Administration (HRSA) request for the Fiscal Year (FY) 2025 Budget. Our FY 2025 Budget
request includes $16.3 billion to support HRSA’s vital work to expand access to health care
services in the communities that need them most; grow, diversify, and promote the well-being of
the health workforce; reduce maternal mortality and enhance maternal health; invest in rural
health; increase access to behavioral health care; and modernize the organ transplant system.
Providing Health Care in Underserved and Rural Communities: Through 1,400 HRSAsupported health centers with 15,000 sites in underserved and rural communities across the
country, HRSA’s Health Center Program is a foundational element of the nation’s health care
safety net, providing primary care services regardless of patients’ ability to pay. Through these
investments, HRSA helps communities improve their health and well-being; prevent and manage
chronic conditions like diabetes and hypertension; and care for families, children, and individuals
with low incomes, experiencing homelessness, living with HIV, and who otherwise would not
have access to a usual source of care. The FY 2025 Budget includes the second installment of
mandatory funding for the President’s plan to create a pathway to double the program and makes
mental health and substance use disorder services essential health center services. The Budget
supports accelerating cancer screening, increasing access to services for maternal and behavioral
health, growing the health center workforce, and expanding street medicine services to ensure
people experiencing homelessness have access to primary care.
Growing the Health Care Workforce: One of HRSA’s highest priorities is growing the health
care workforce and connecting skilled health care providers to communities in need. The Budget
supports the second year of mandatory funding requested in the FY 2024 Budget for two critical
workforce programs – the National Health Service Corps and the Teaching Health Center
Graduate Medical Education Program – that support loans, scholarships, and residency training
focused on underserved and rural communities. The Budget makes important investments in
innovative new approaches to workforce development and training. It also invests in increasing
the number of behavioral health professionals, peers and other providers to expand access to
mental health and substance use disorder services and provides targeted investments to support
the next generation of nurses, including addressing the need to grow the nursing workforce that
makes it possible to sustain labor and delivery services in underserved communities.
Reducing Maternal Mortality and Enhancing Maternal Health: In recent decades, the United
States’ maternal mortality rate has been among the highest of any developed nation. Yet, more
than 80% of pregnancy-related deaths are preventable. The Budget invests in several initiatives
to respond to this crisis and improve maternal health outcomes. New investments include
growing the nursing workforce to support maternal care, strengthening the home visiting
Health Resources and Services Administration
www.hrsa.gov
3.
Page 2workforce, building an obstetric safety-net in maternity care deserts, and growing the doula
workforce to provide direct support before, during, and after childbirth. Other initiatives focus
on social determinants of maternal health, including screening and connection to services,
expanding the uptake of evidence-based models of maternity care, and investment in state data
collection and innovation to improve local response strategies.
Supporting Mental Health and Substance Use Disorder Services: The Budget includes a
proposal to make mental health and substance use disorder an essential service in community
health centers which serve more than 30 million people regardless of ability to pay. It also
focuses on the critical need to grow the behavioral health workforce and recruit providers to
underserved and rural communities by investing in growing the National Health Service Corps,
which provides loan repayment and scholarships to providers in return for practicing in these
high need communities, as well as supporting the training of new providers like psychologists,
social workers, peer support counselors and therapists, to make behavioral health care more
accessible. The Budget also makes important investments in expanding access to behavioral
health care in rural communities through workforce supports and direct services, including
treatment, in rural communities.
Improving the Organ Transplant System: More than 100,000 people are on the organ
transplant waitlist. In 2023, HRSA launched the Organ Procurement and Transplantation
Network (OPTN) Modernization Initiative to better serve patients in need of transplants and their
families by strengthen accountability and the performance of the OPTN, which is responsible for
organ matching. With enactment of the Securing the U.S. Organ Procurement and
Transplantation Network Act, the Budget makes strategic investments to implement the new law
and modernize the OPTN focused on critical areas such as technology, governance,
transparency, quality, and operations.
Supporting Rural Health: The Budget invests in improving access to care in rural communities,
ranging from the recruitment and retention of health care professionals to maintaining the
economic viability of hospitals and rural health clinics to supporting innovative practices in rural
communities. The Budget supports substance use disorder services in rural communities. It also
provides targeted resources to support maternal health services in rural communities to help
address the challenge of sustaining hospital obstetric services.
We look forward to working with Congress on these vital programs that serve the nation’s
highest need communities.
/ Carole Johnson /
Carole Johnson
Administrator
Health Resources and Services Administration
www.hrsa.gov
4.
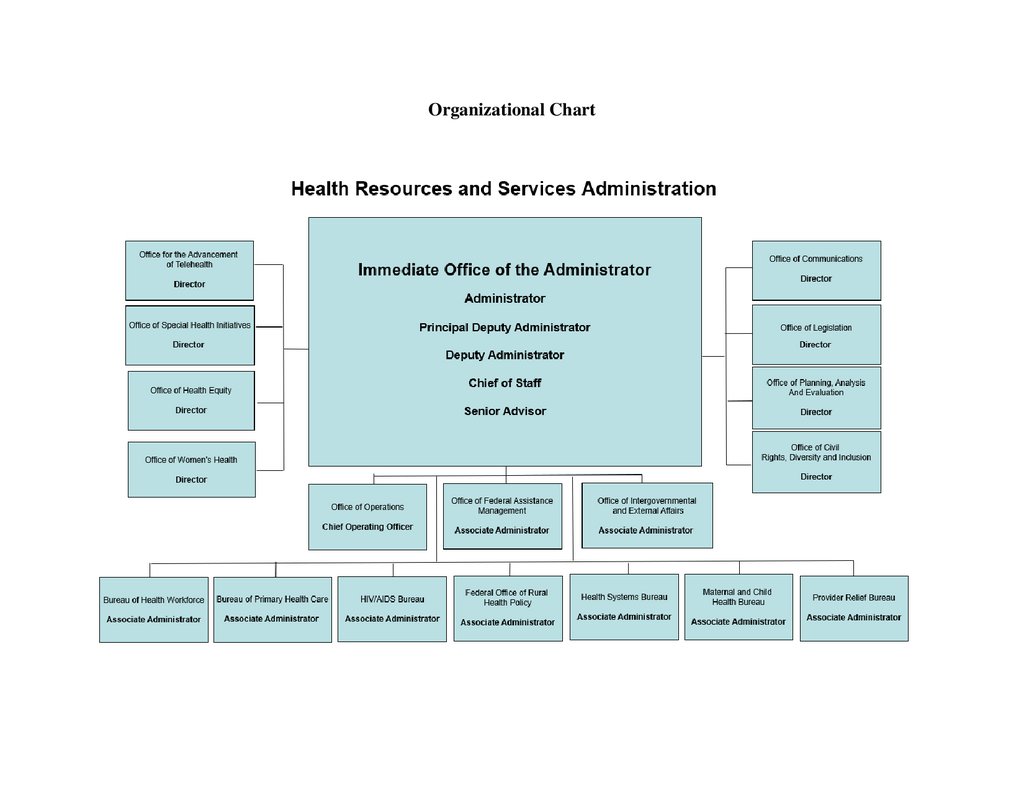
Organizational Chart5.
Table of ContentsOrganizational Chart ....................................................................................................................... 4
EXECUTIVE SUMMARY .......................................................................................................... 9
Introduction and Mission .............................................................................................................. 10
Overview of Budget ...................................................................................................................... 11
Overview of Performance ............................................................................................................. 15
All Purpose Table ......................................................................................................................... 19
BUDGET EXHIBITS ................................................................................................................. 23
Appropriations Language.............................................................................................................. 24
Language Analysis ........................................................................................................................ 30
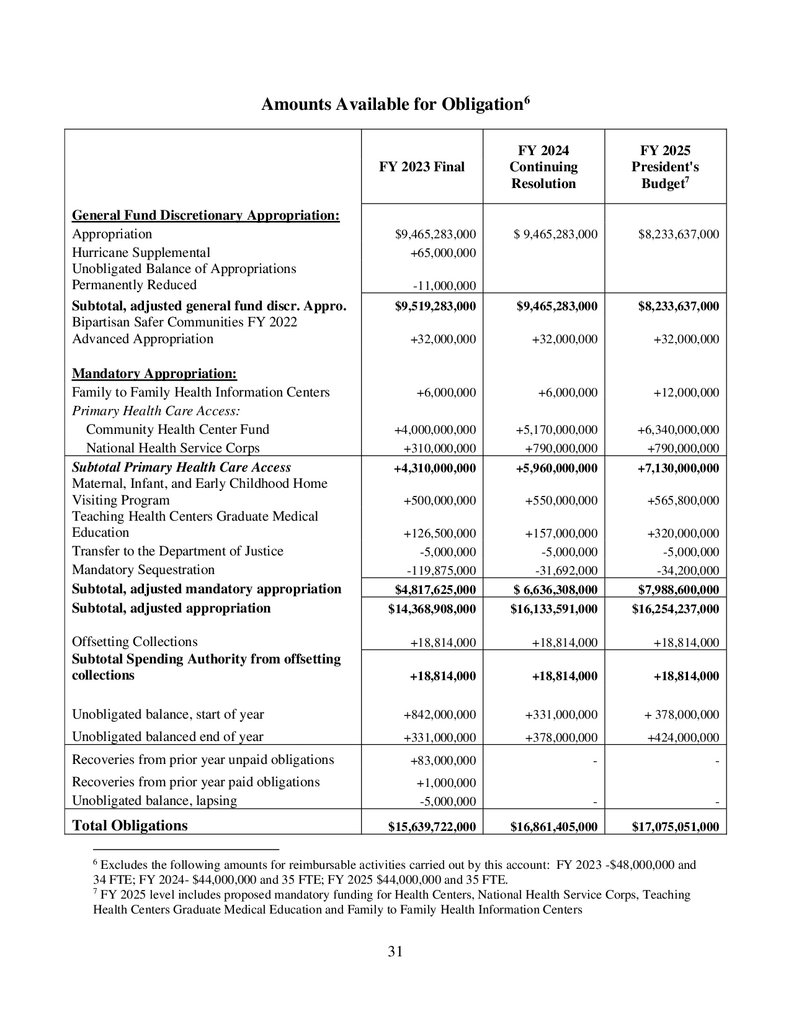
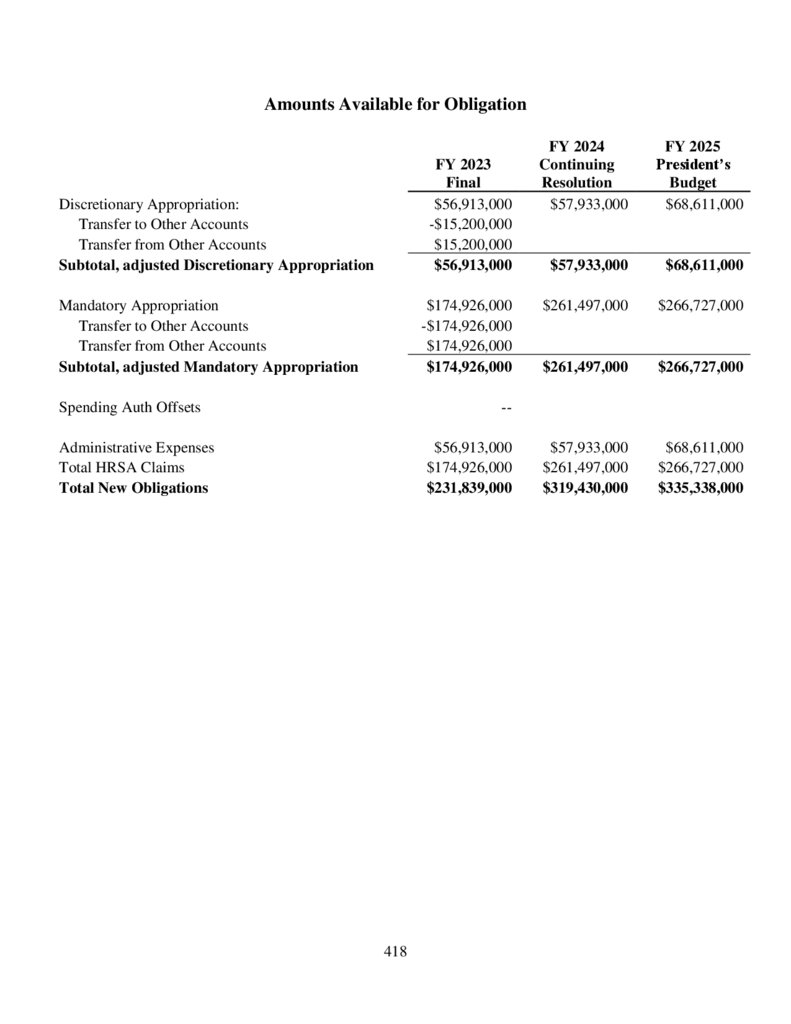
Amounts Available for Obligation................................................................................................ 31
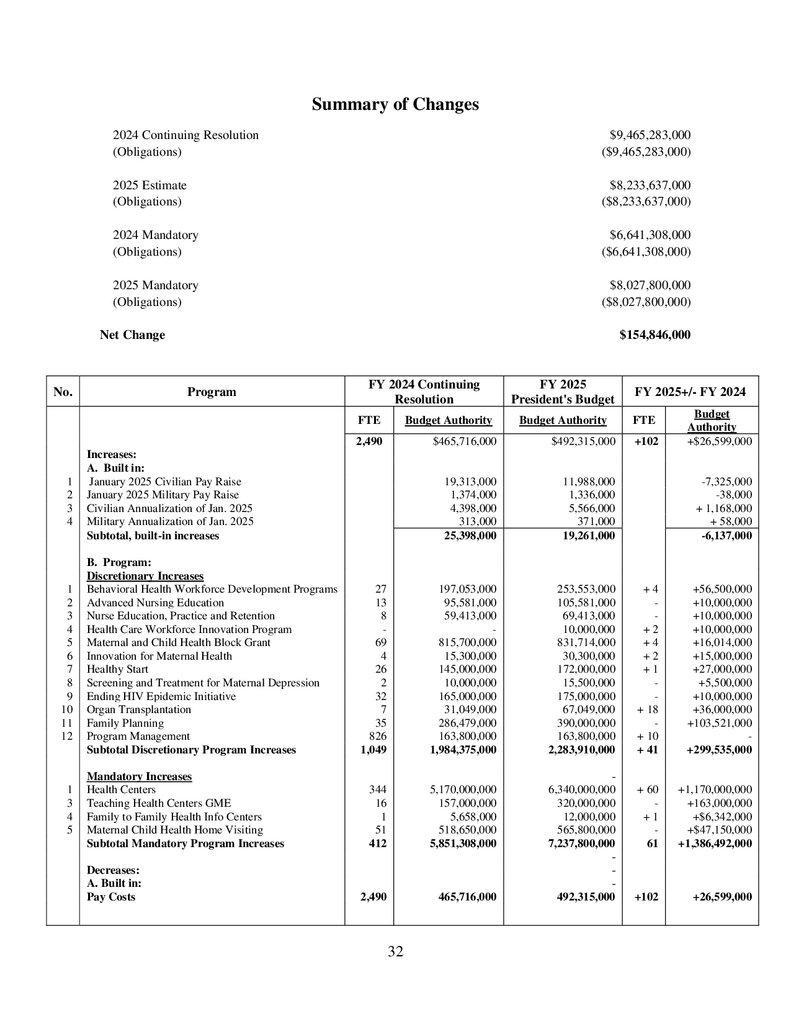
Summary of Changes .................................................................................................................... 32
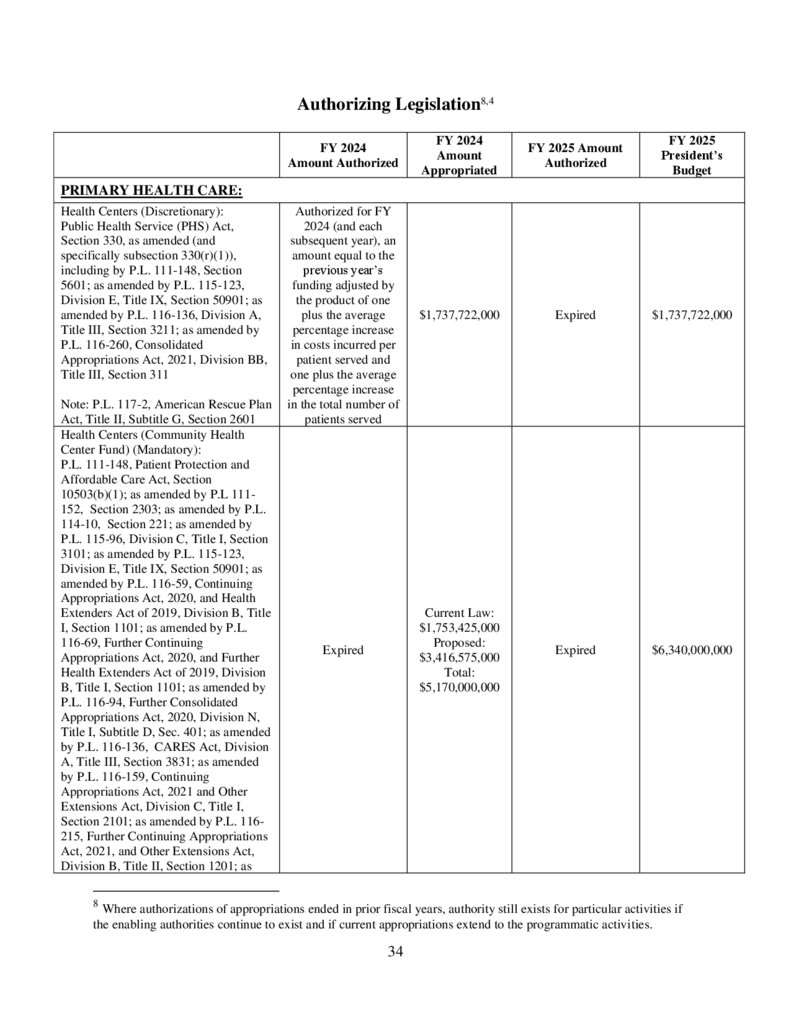
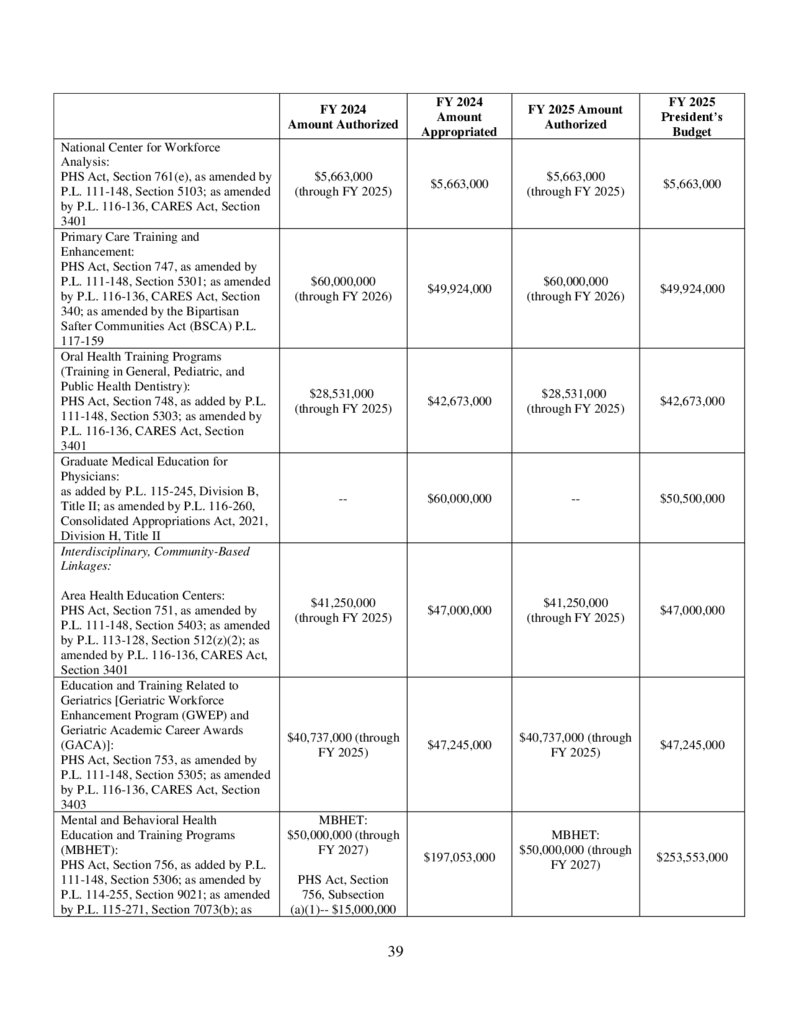
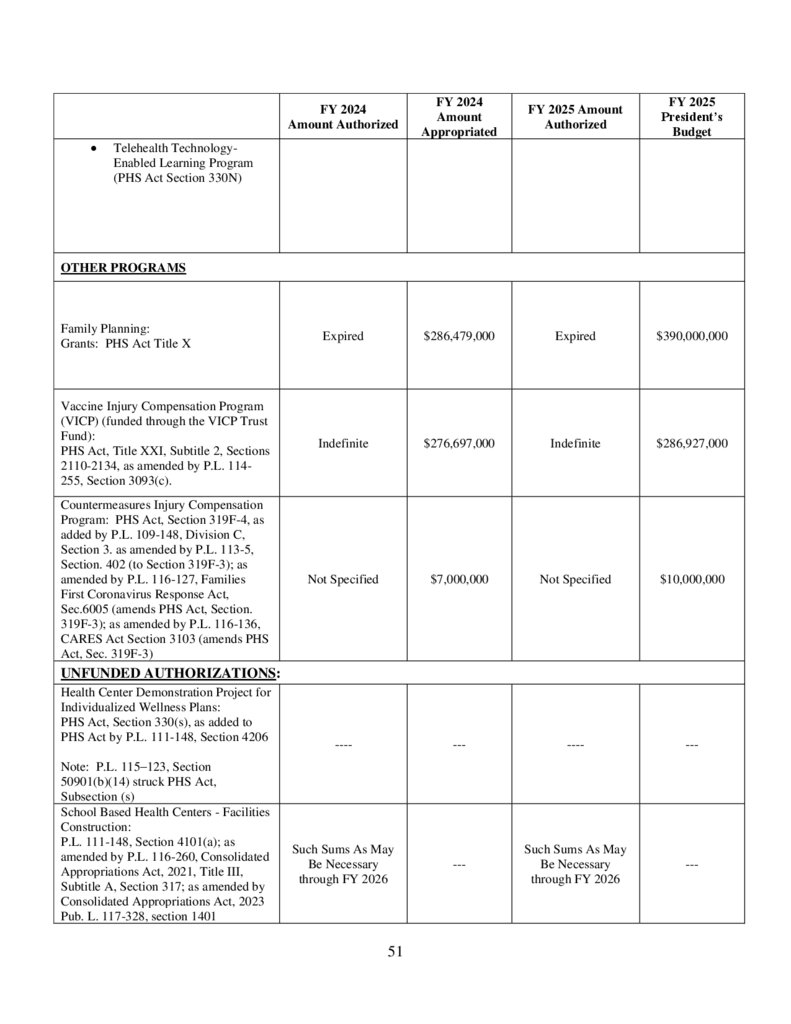
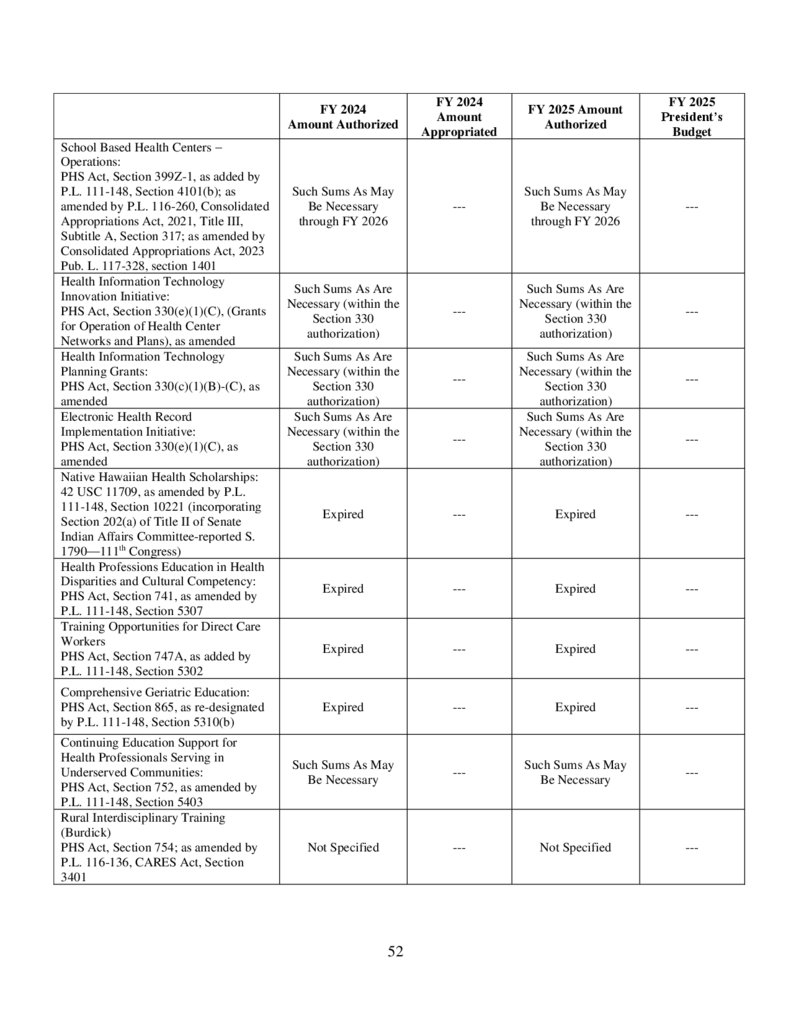
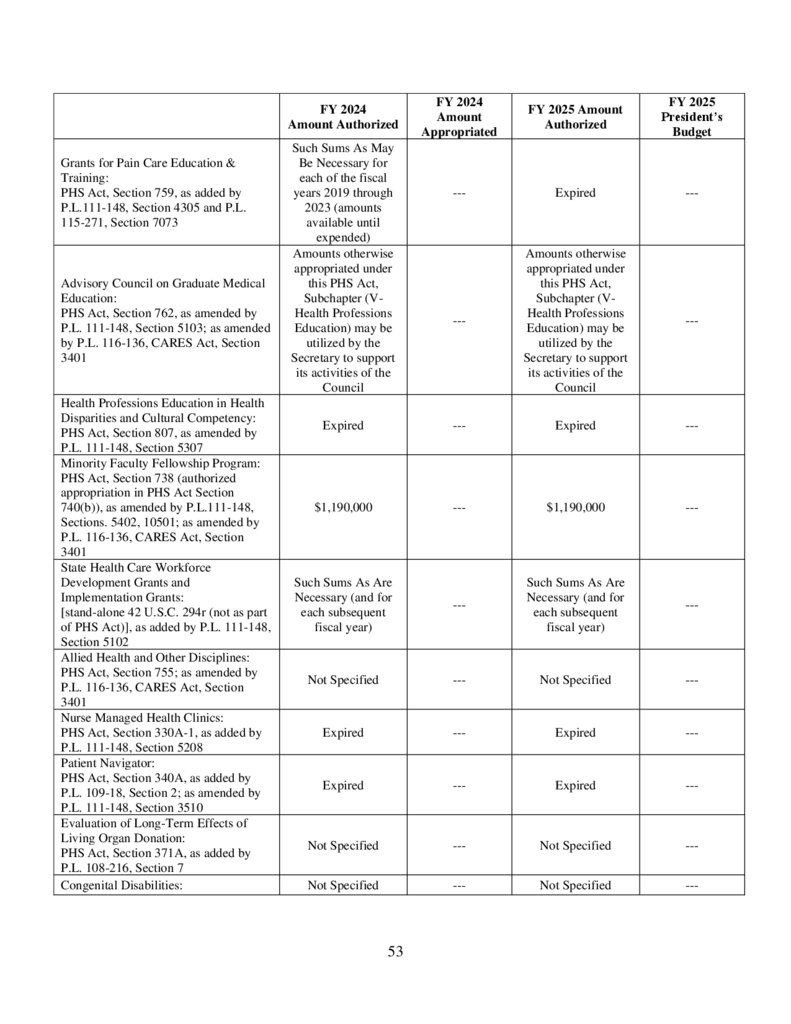
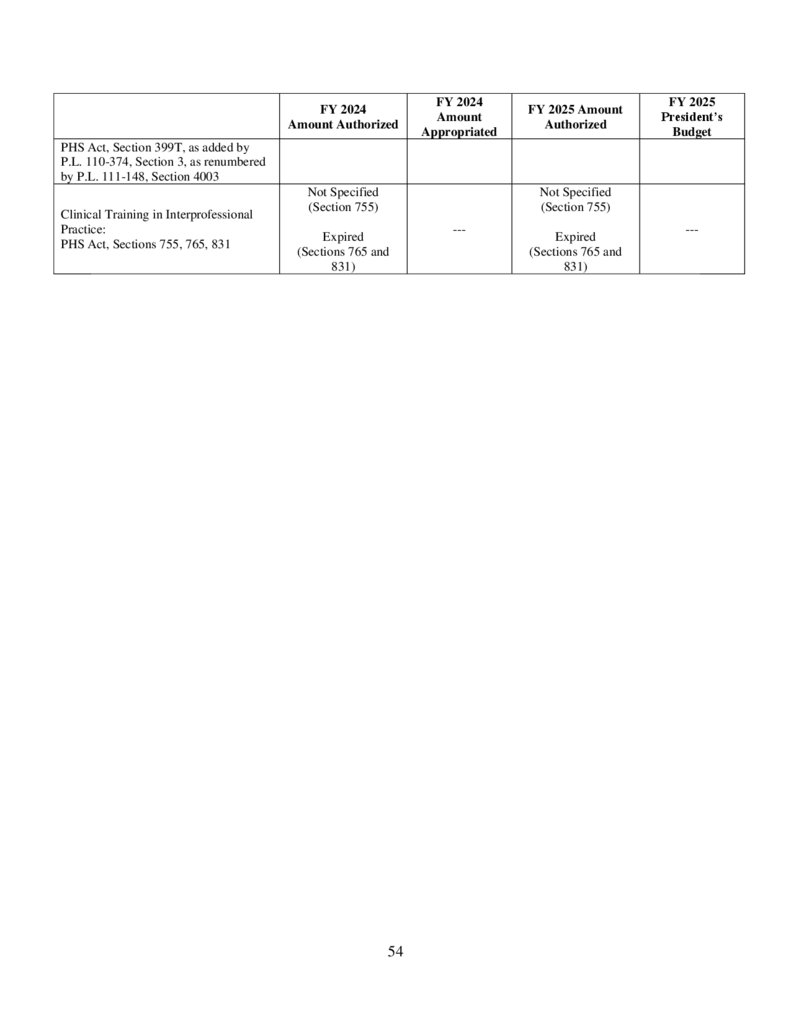
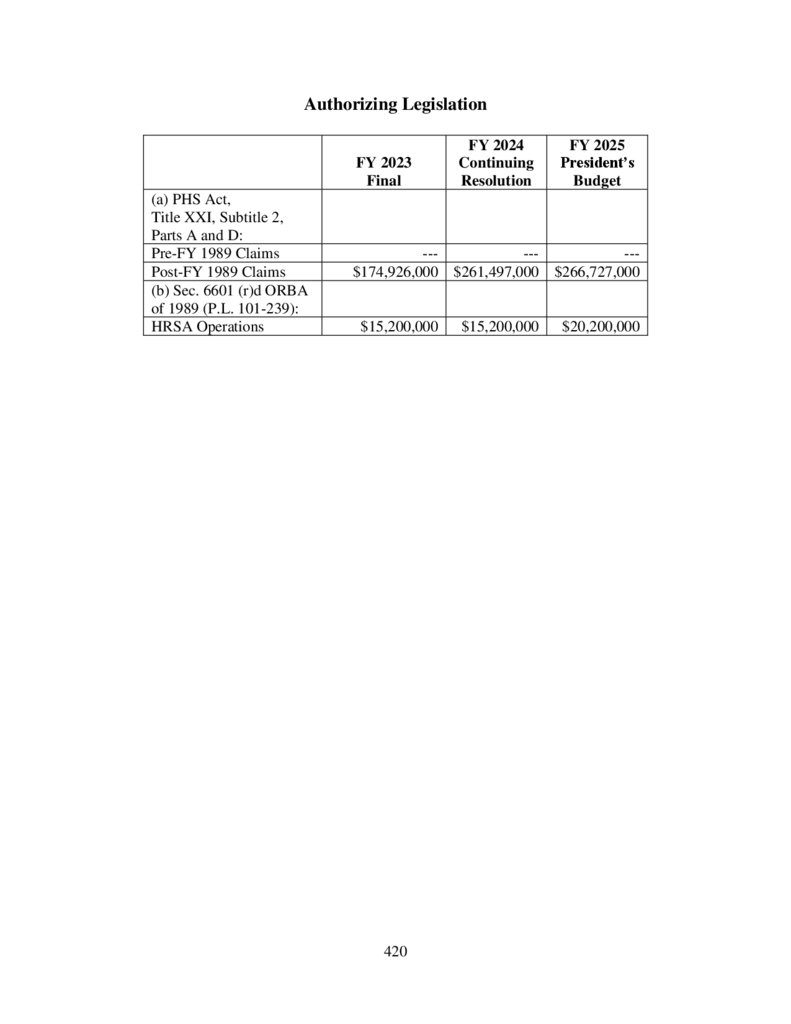
Authorizing Legislation ................................................................................................................ 34
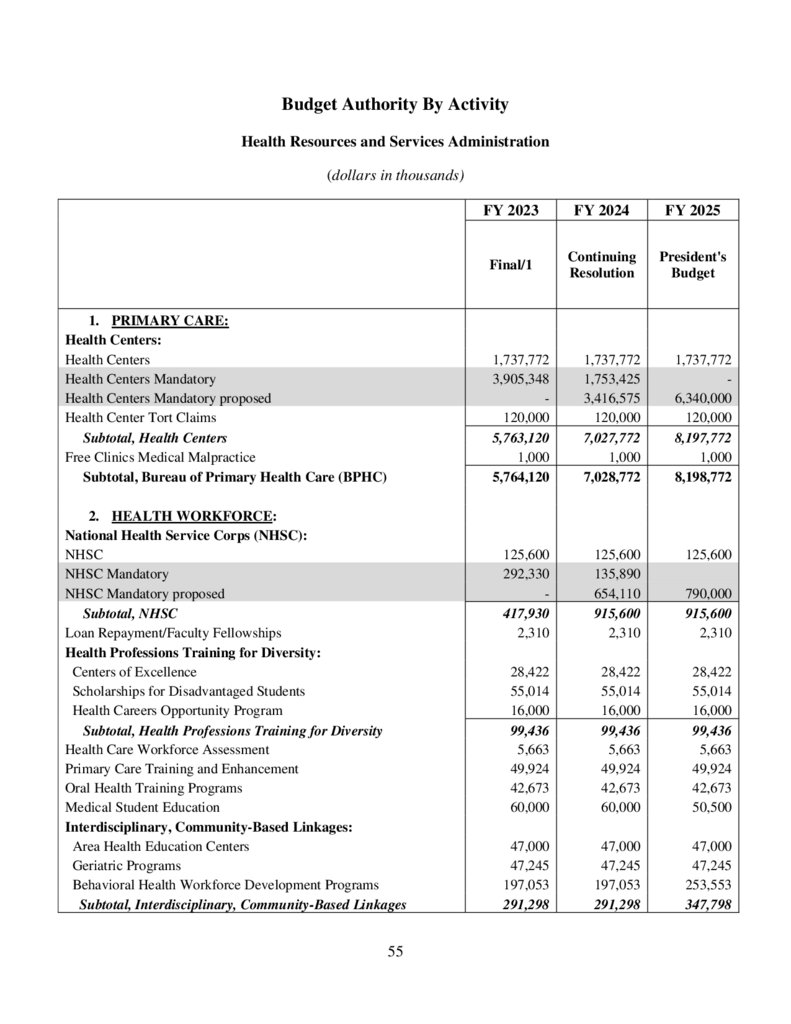
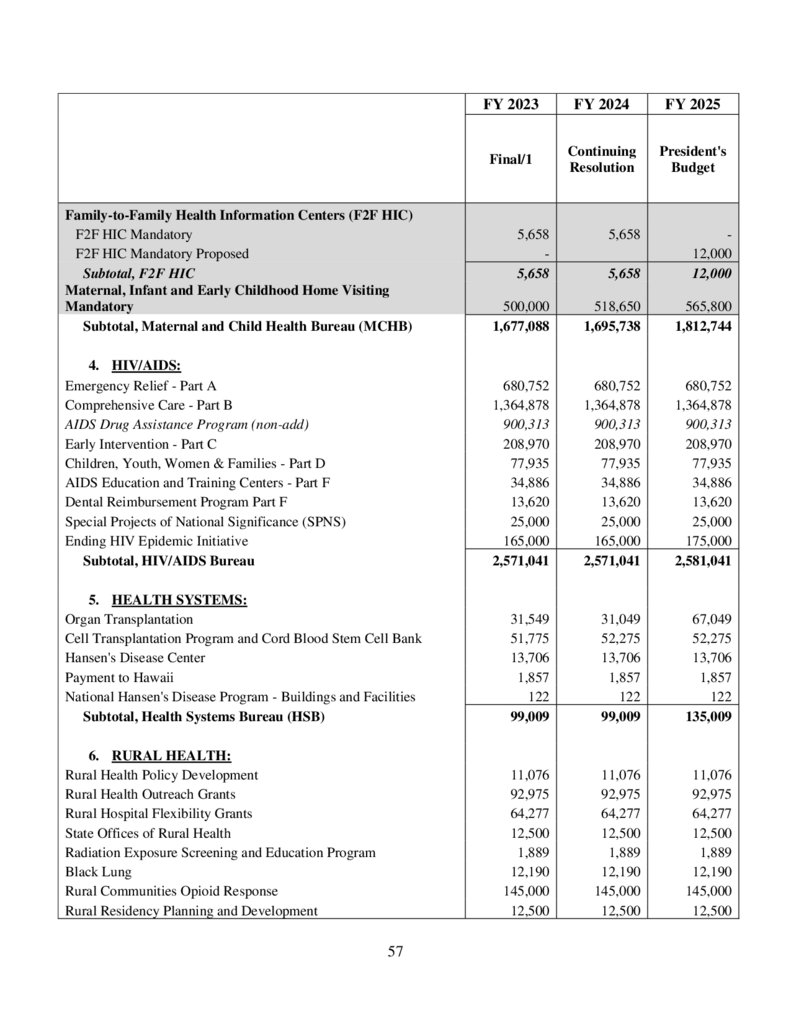
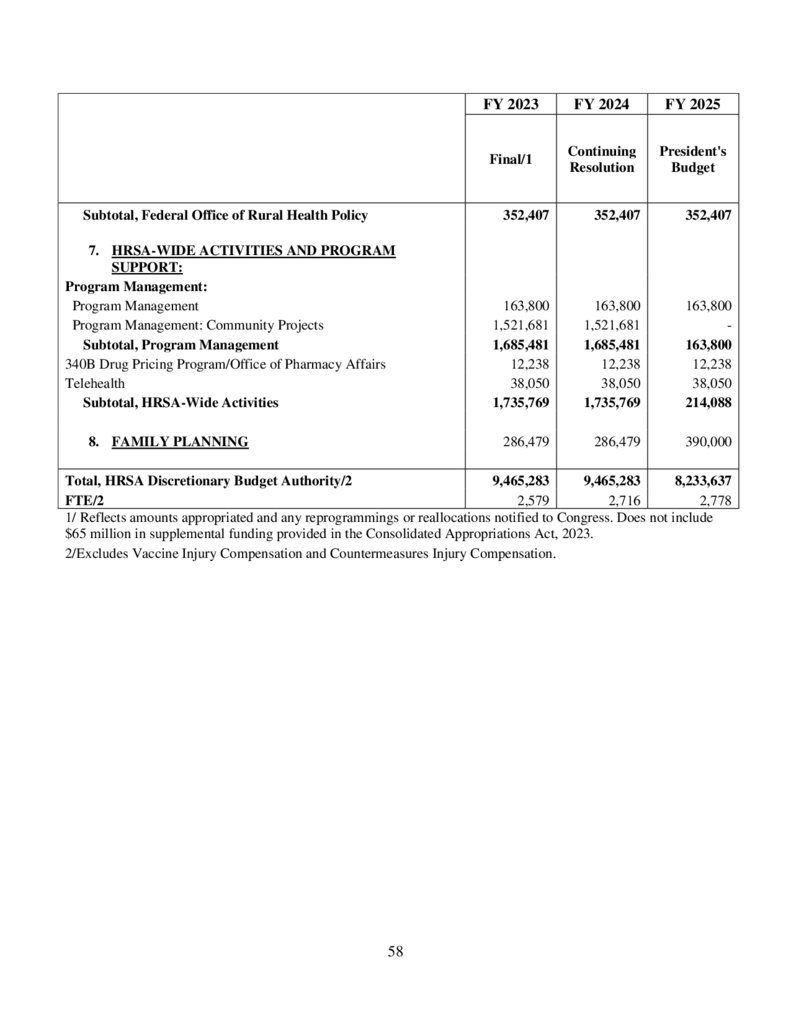
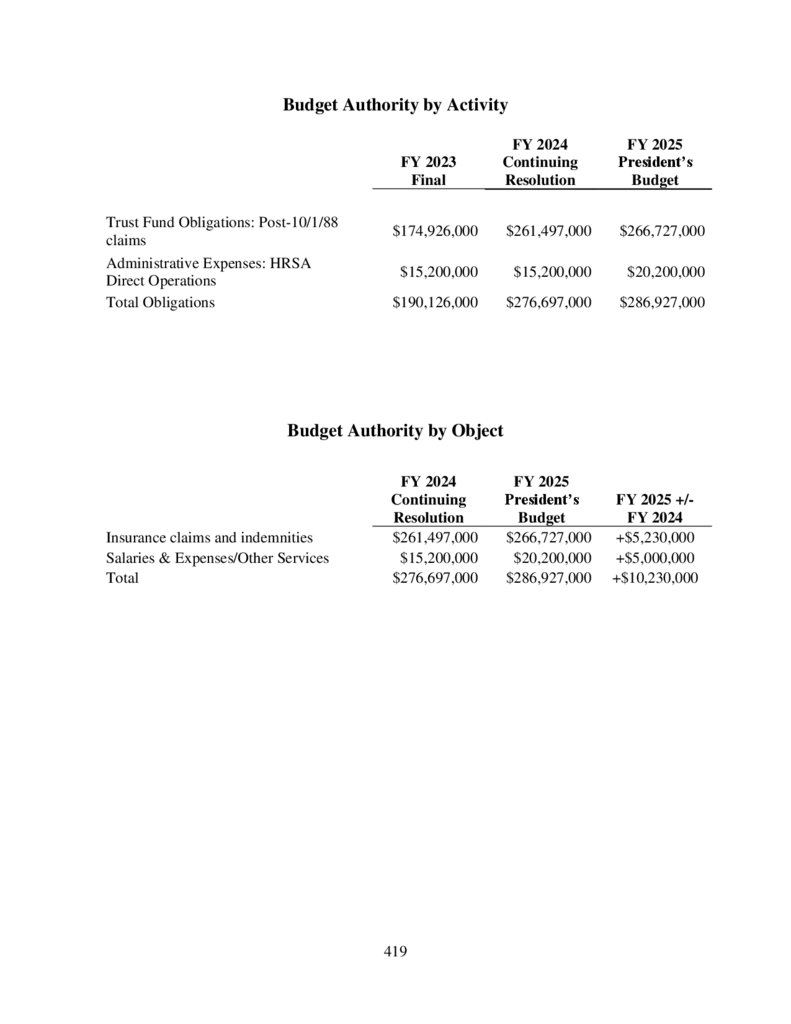
Budget Authority By Activity....................................................................................................... 55
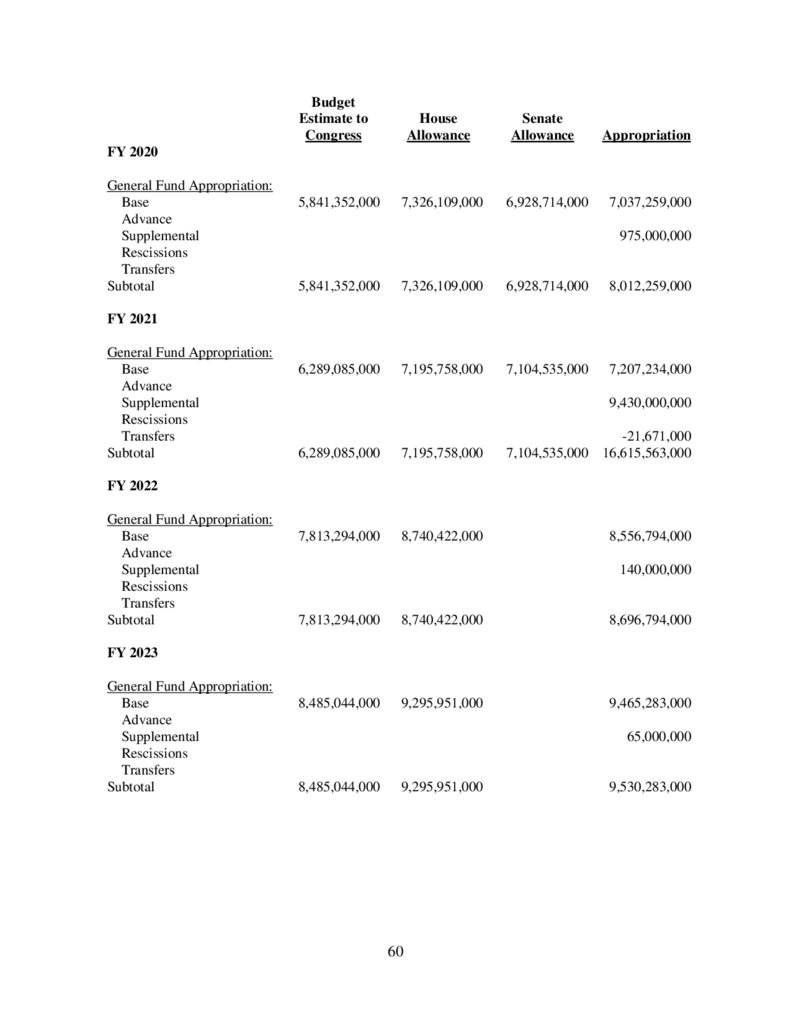
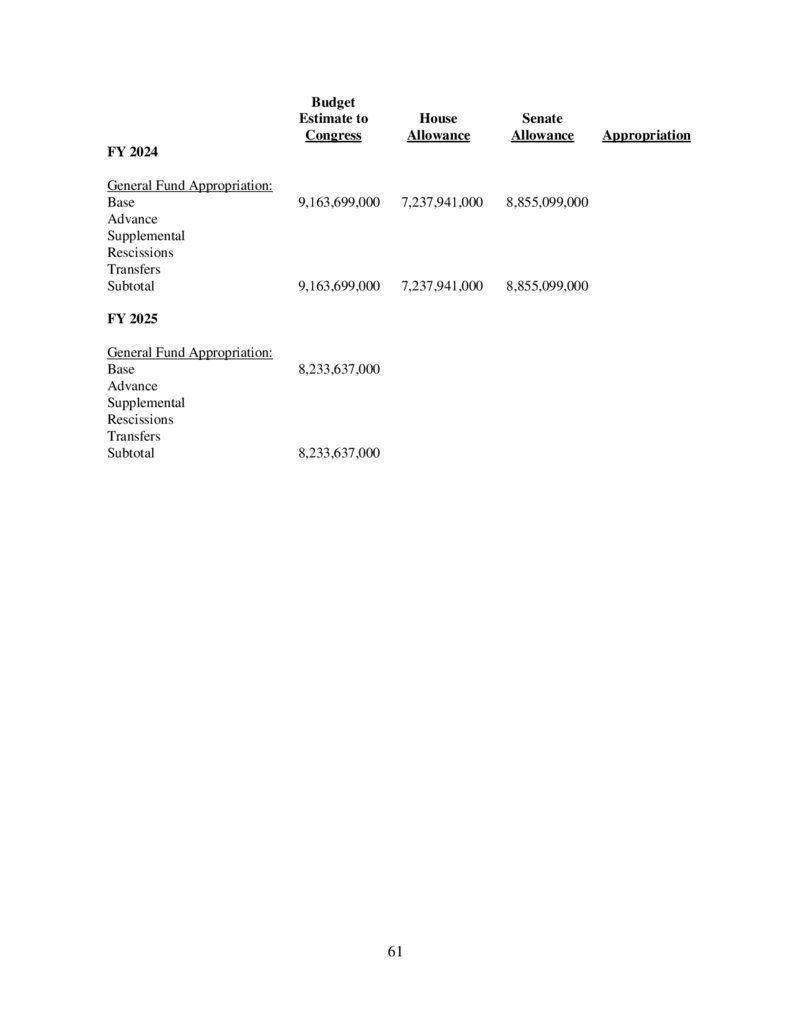
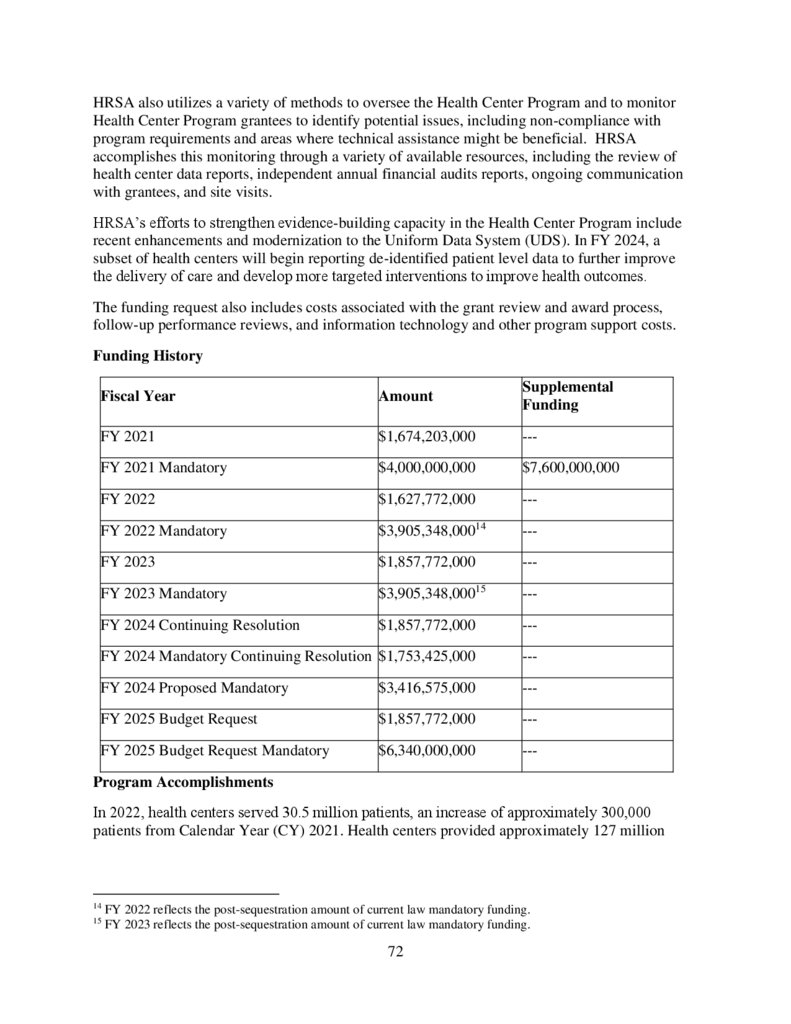
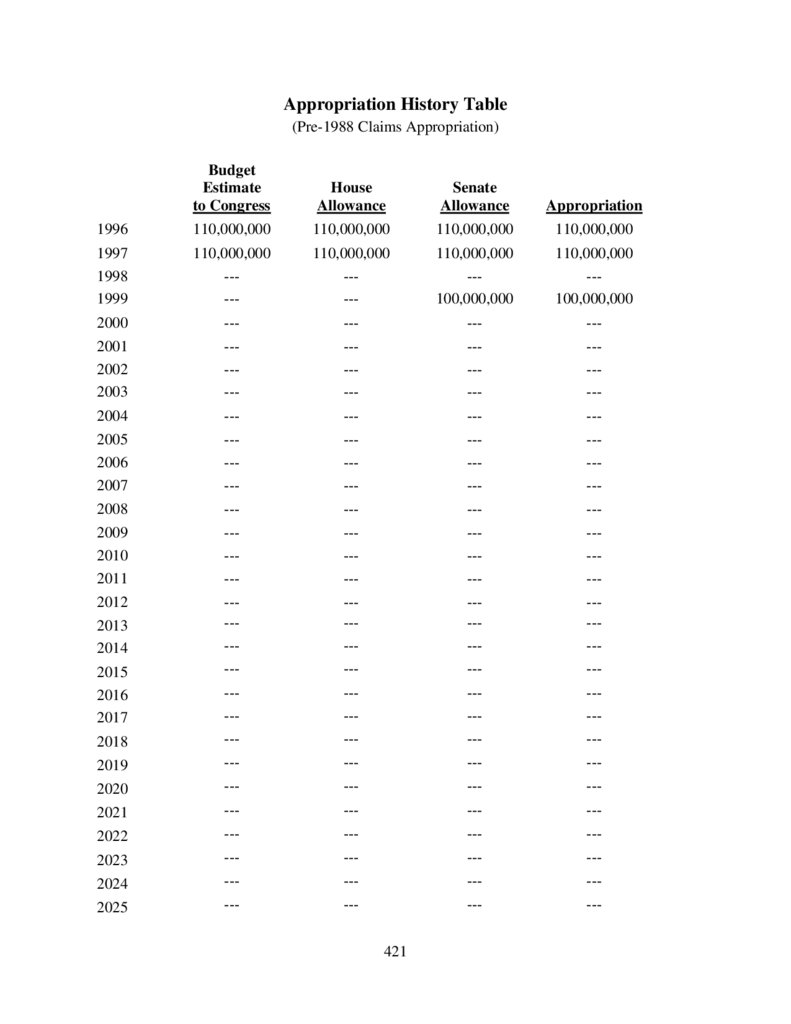
Appropriations History Table ....................................................................................................... 59
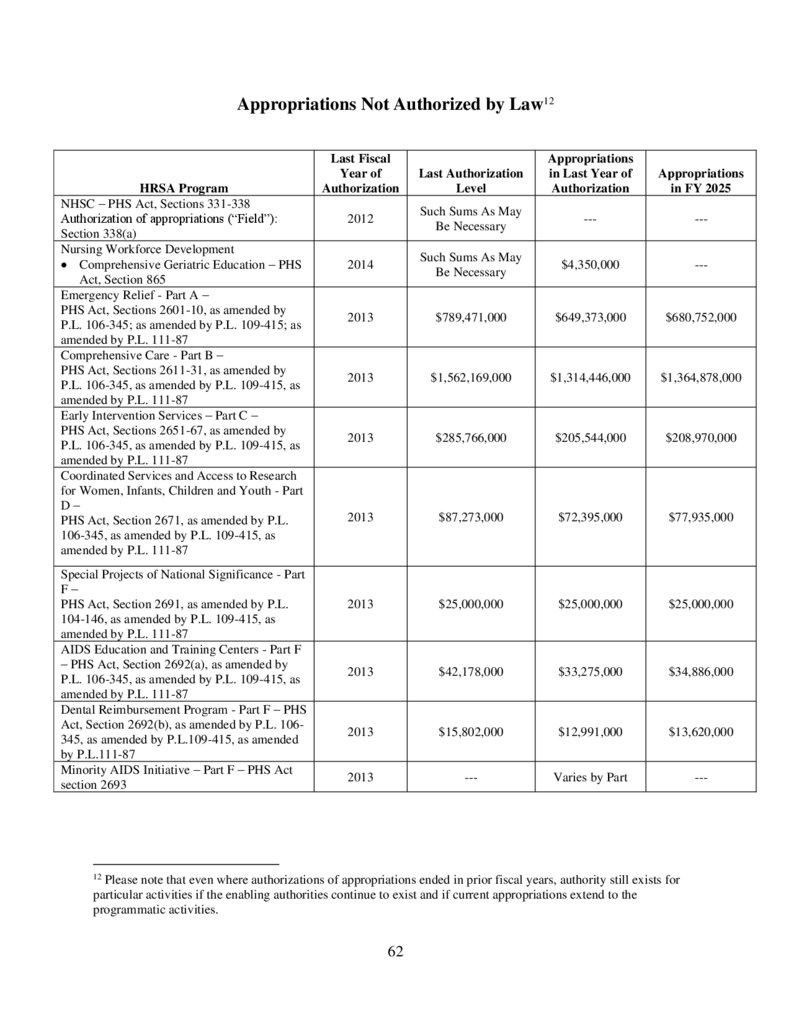
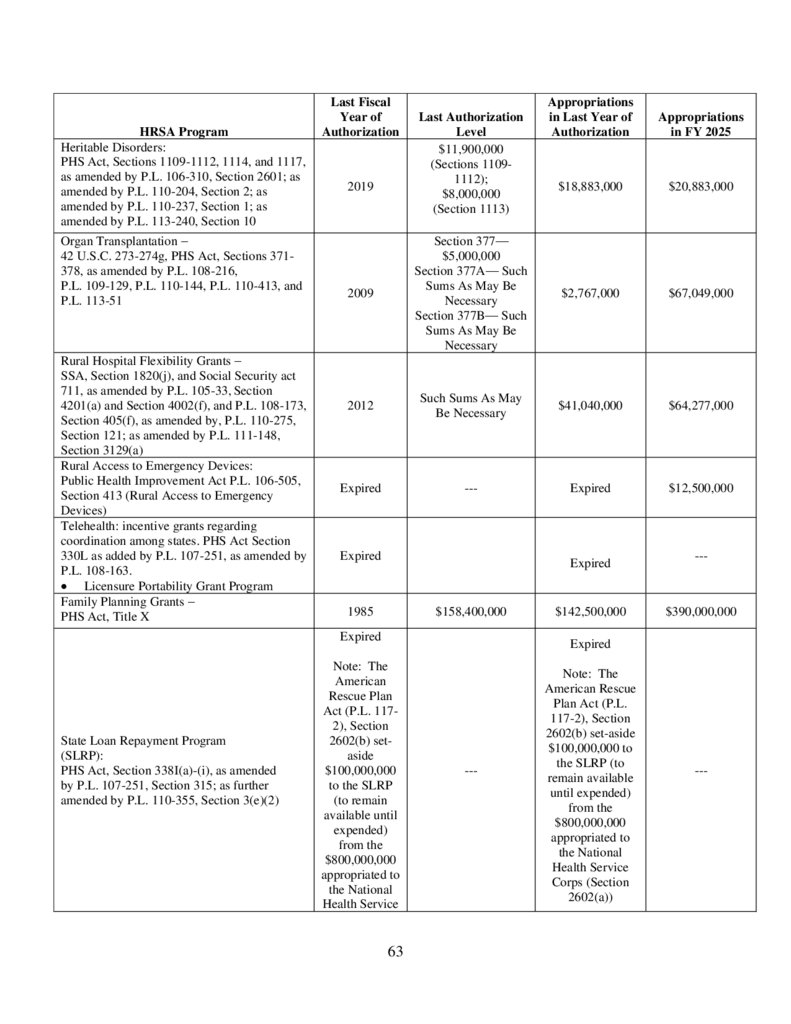
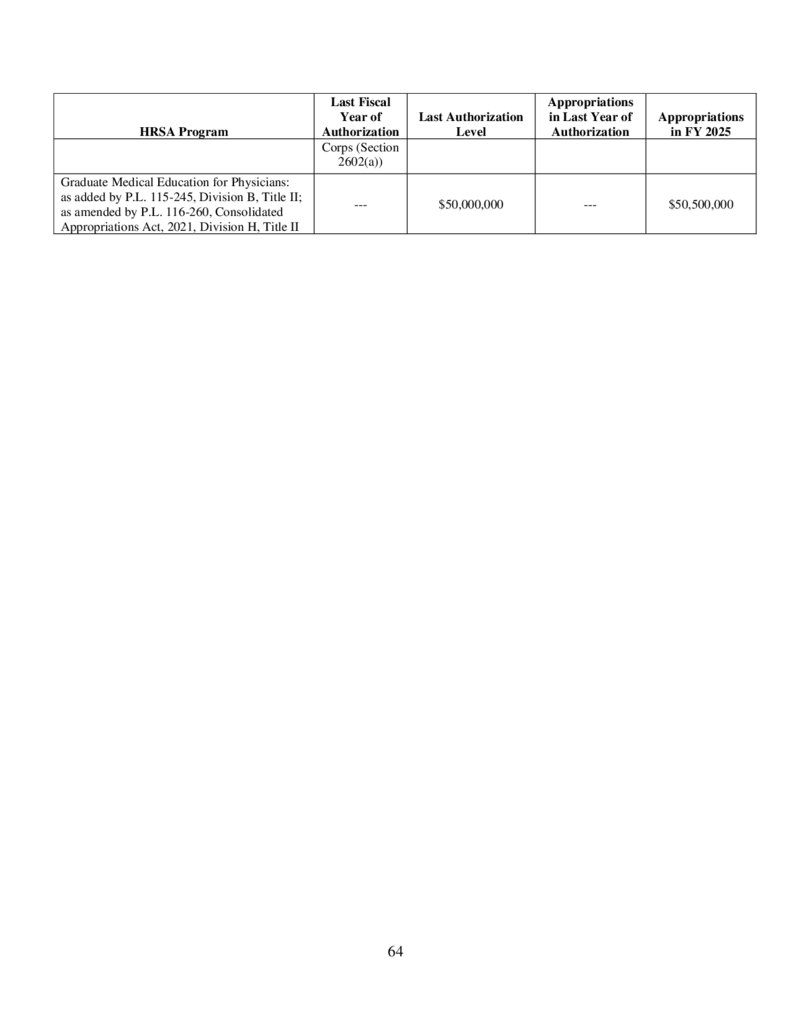
Appropriations Not Authorized by Law ....................................................................................... 62
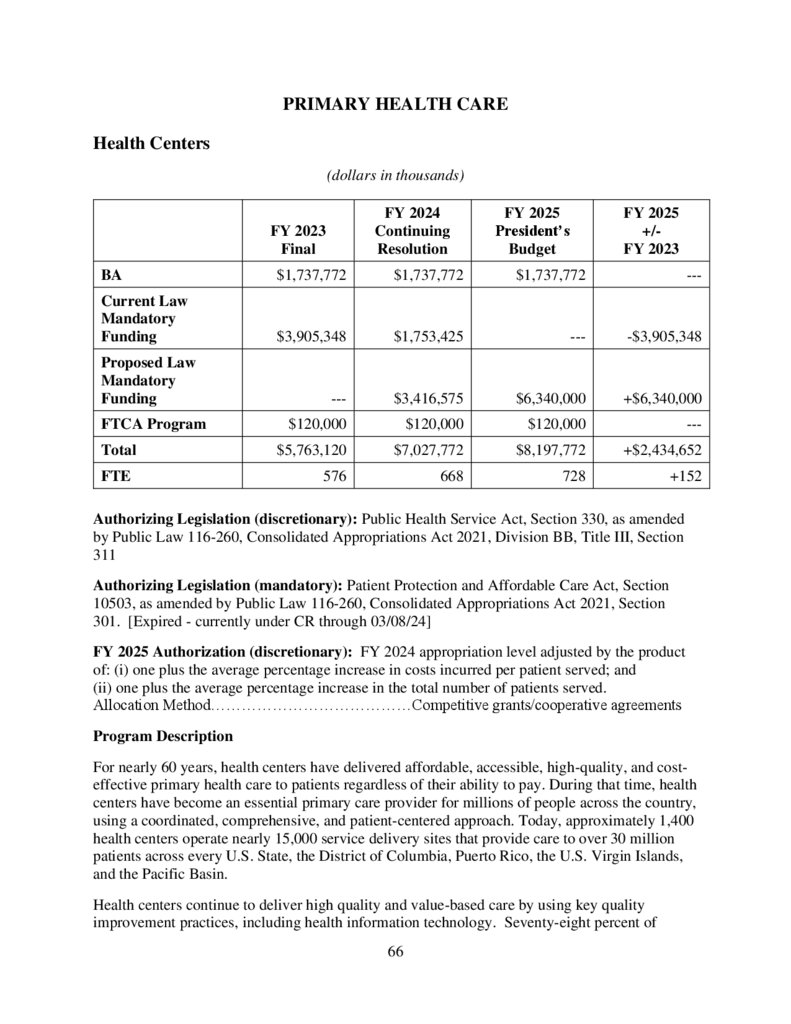
PRIMARY HEALTH CARE ..................................................................................................... 66
Health Centers ........................................................................................................................... 66
Free Clinics Medical Malpractice ............................................................................................. 80
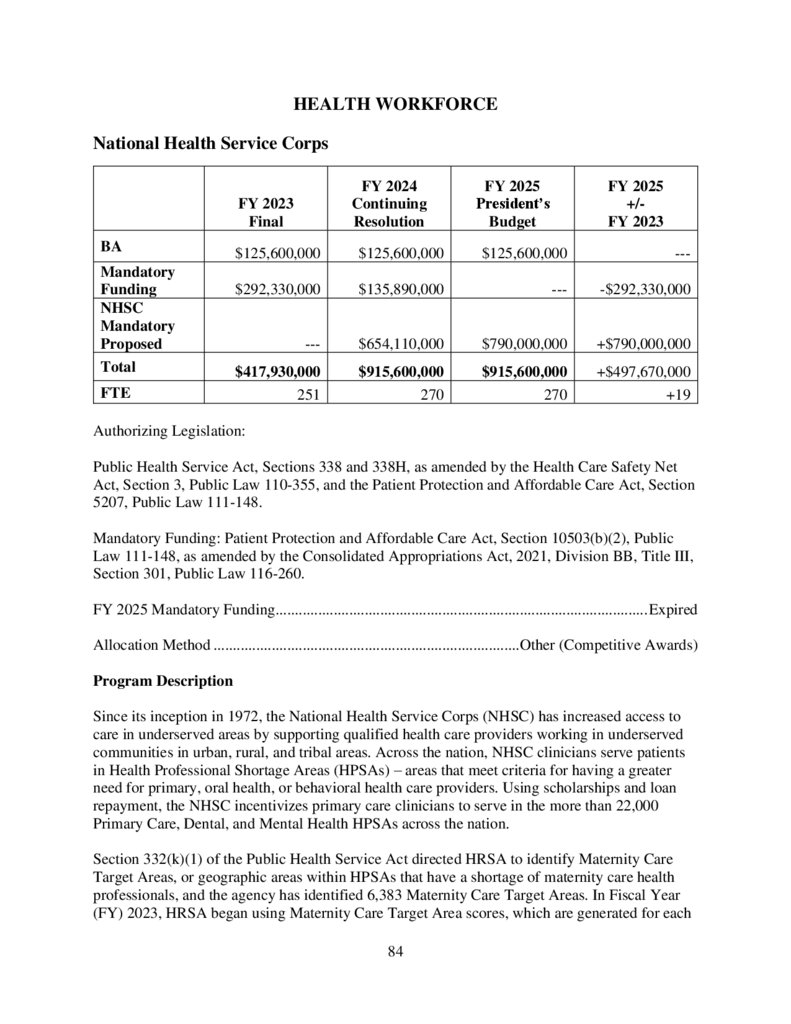
HEALTH WORKFORCE ......................................................................................................... 84
National Health Service Corps .................................................................................................. 84
Faculty Loan Repayment Program ............................................................................................ 95
Health Professions Training for Diversity ................................................................................ 97
Centers of Excellence ............................................................................................................ 97
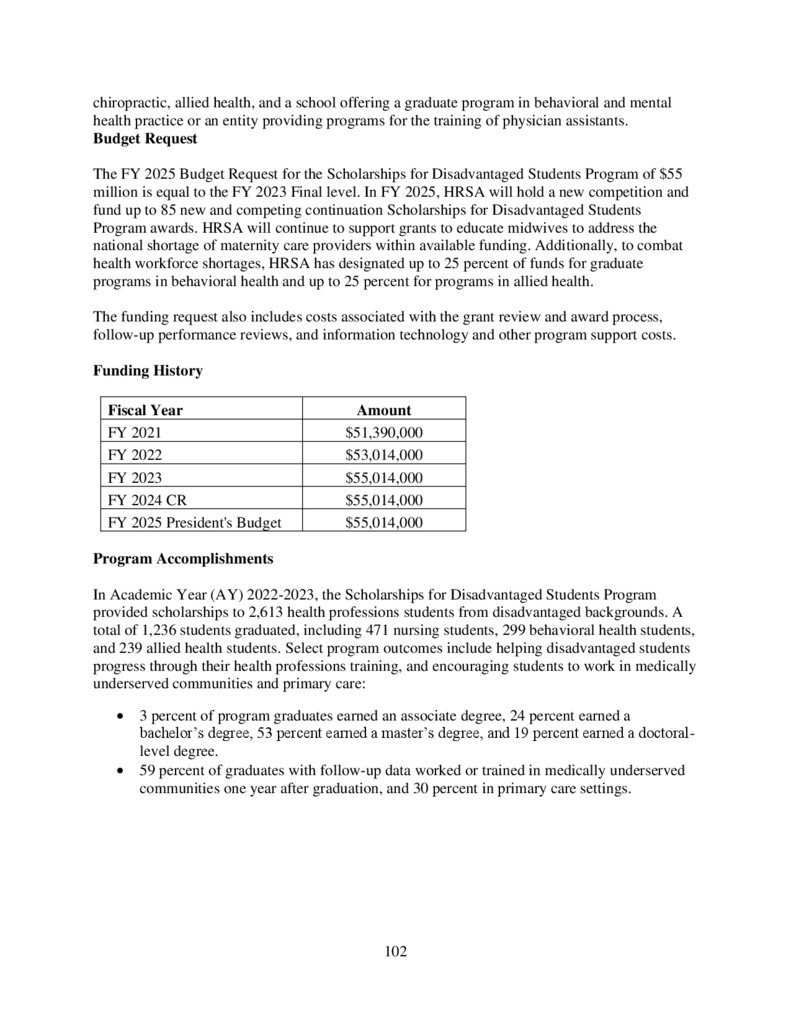
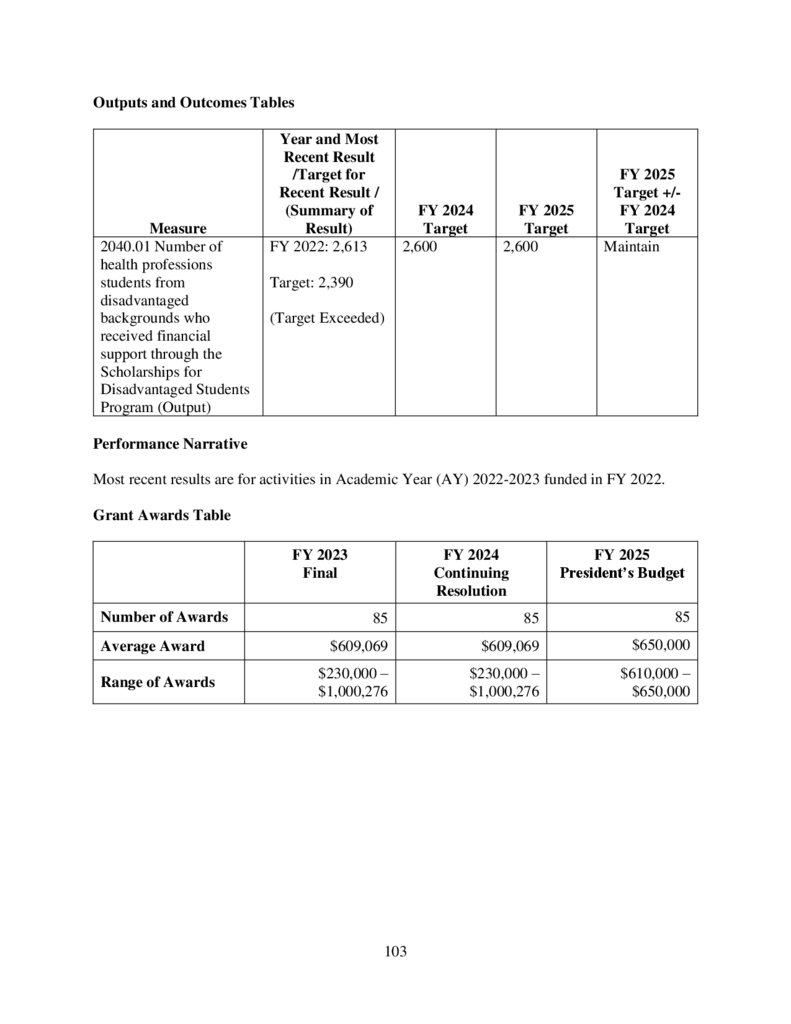
Scholarships for Disadvantaged Students............................................................................ 101
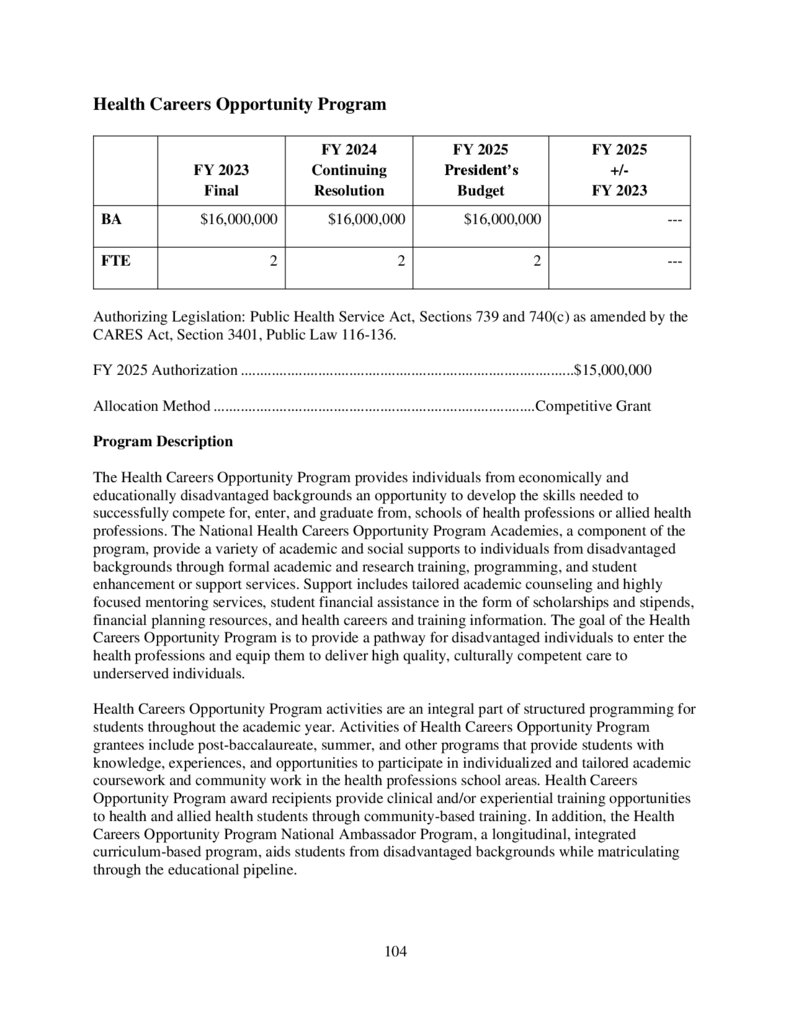
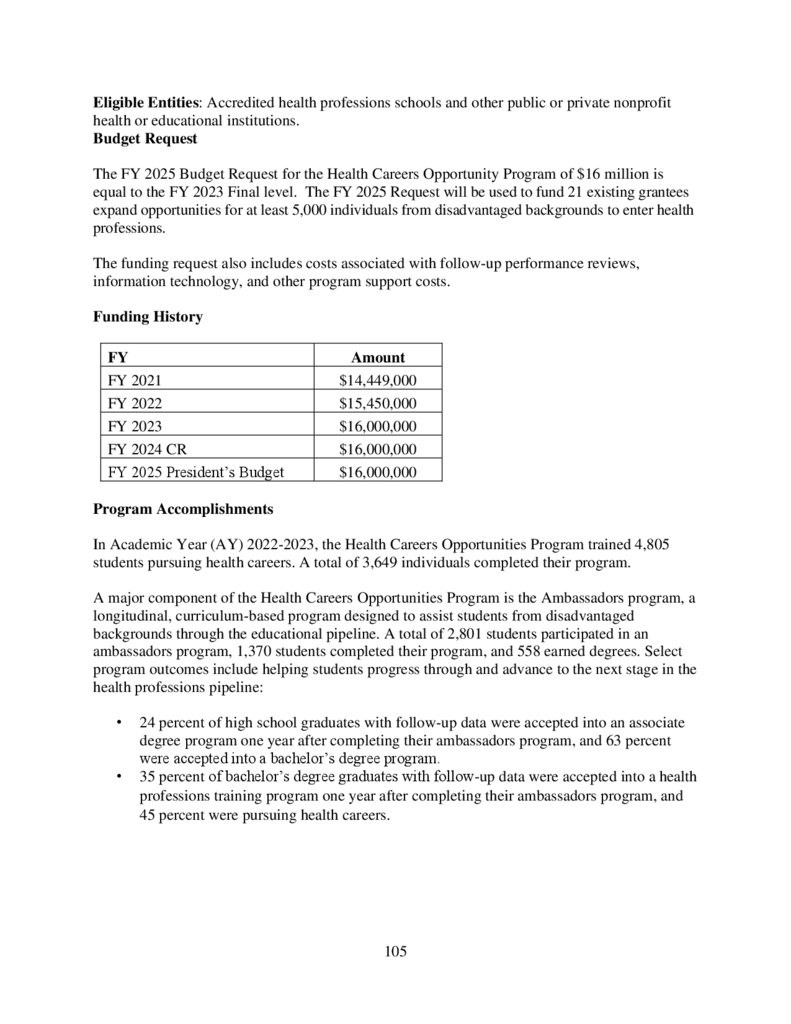
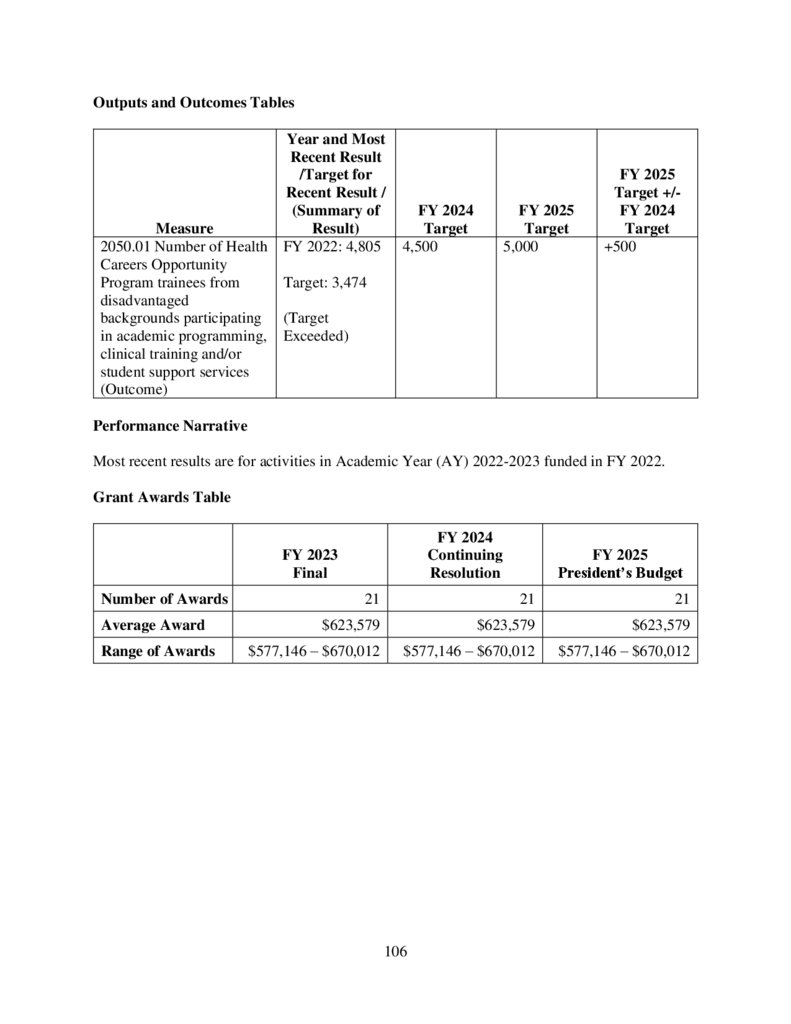
Health Careers Opportunity Program .................................................................................. 104
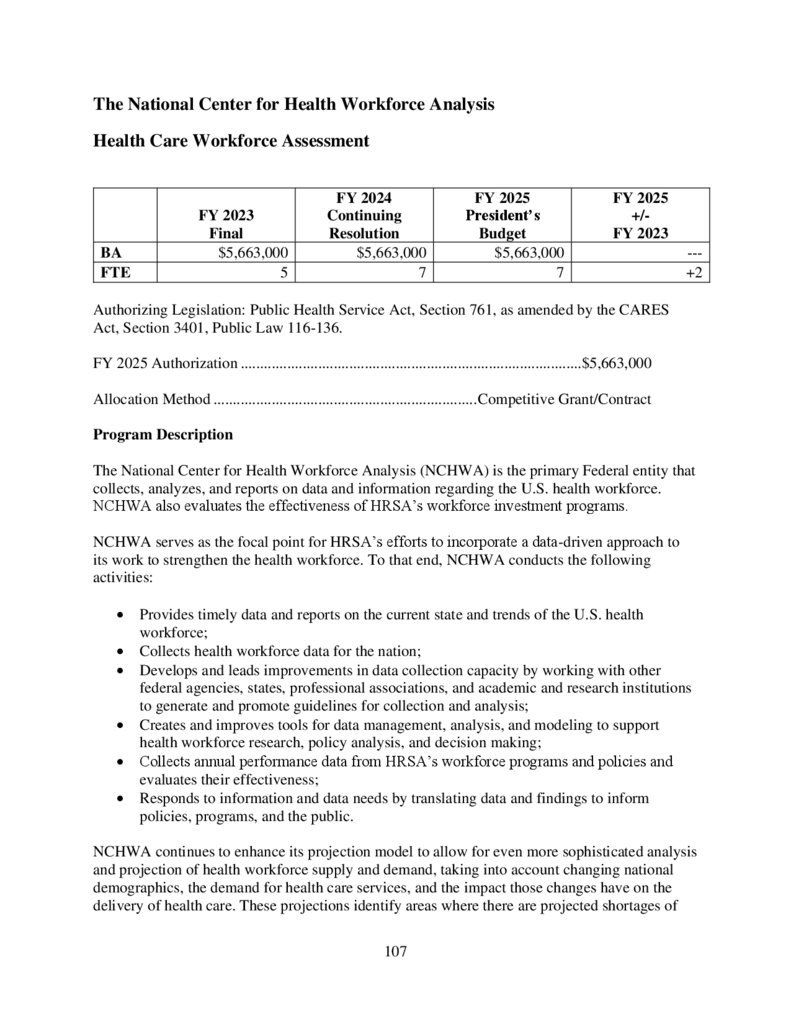
The National Center for Health Workforce Analysis.............................................................. 107
Health Care Workforce Assessment .................................................................................... 107
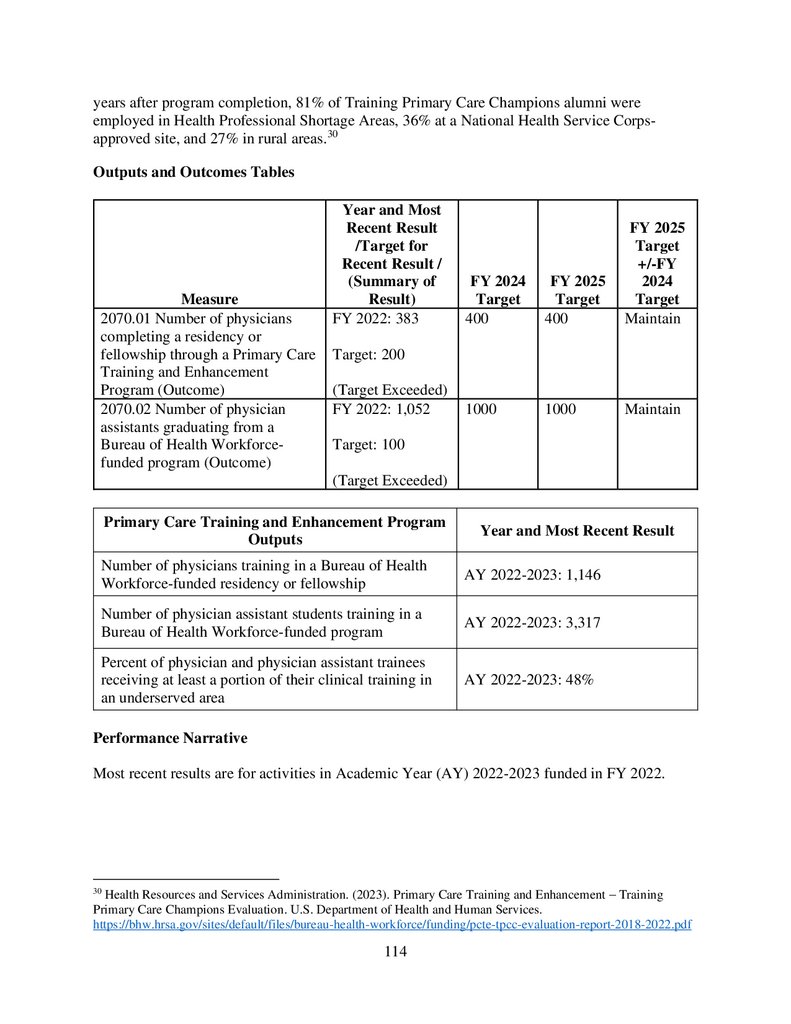
Primary Care Training and Enhancement Program ................................................................ 112
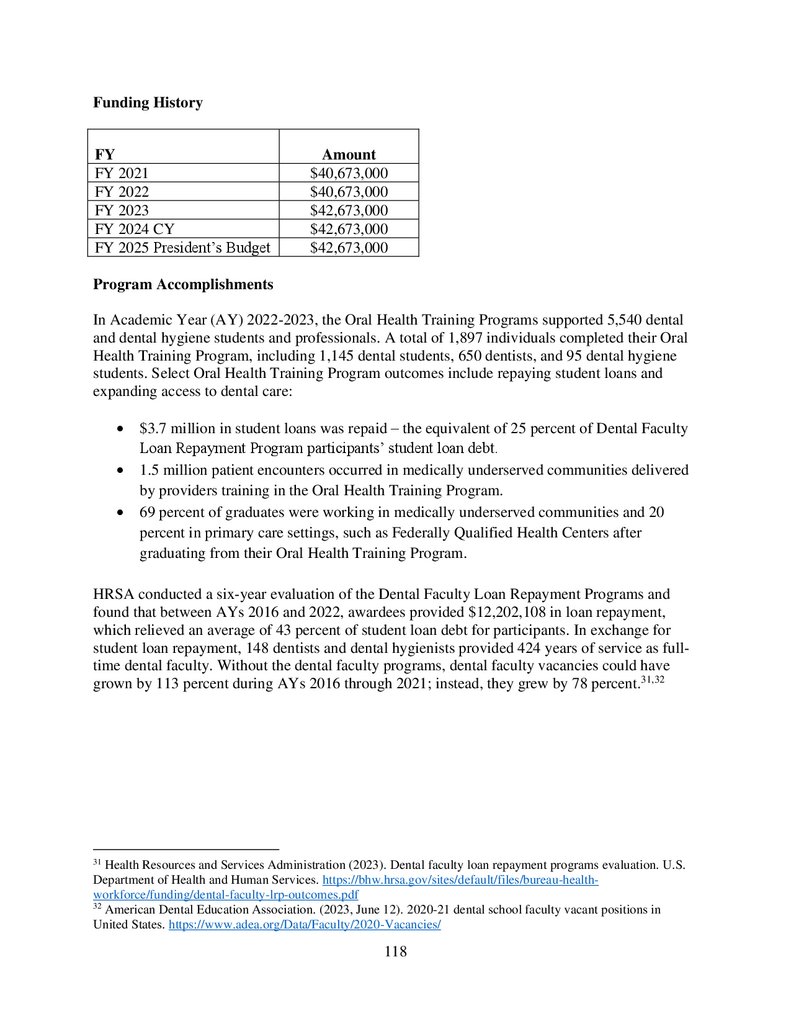
Oral Health Training Programs ............................................................................................... 116
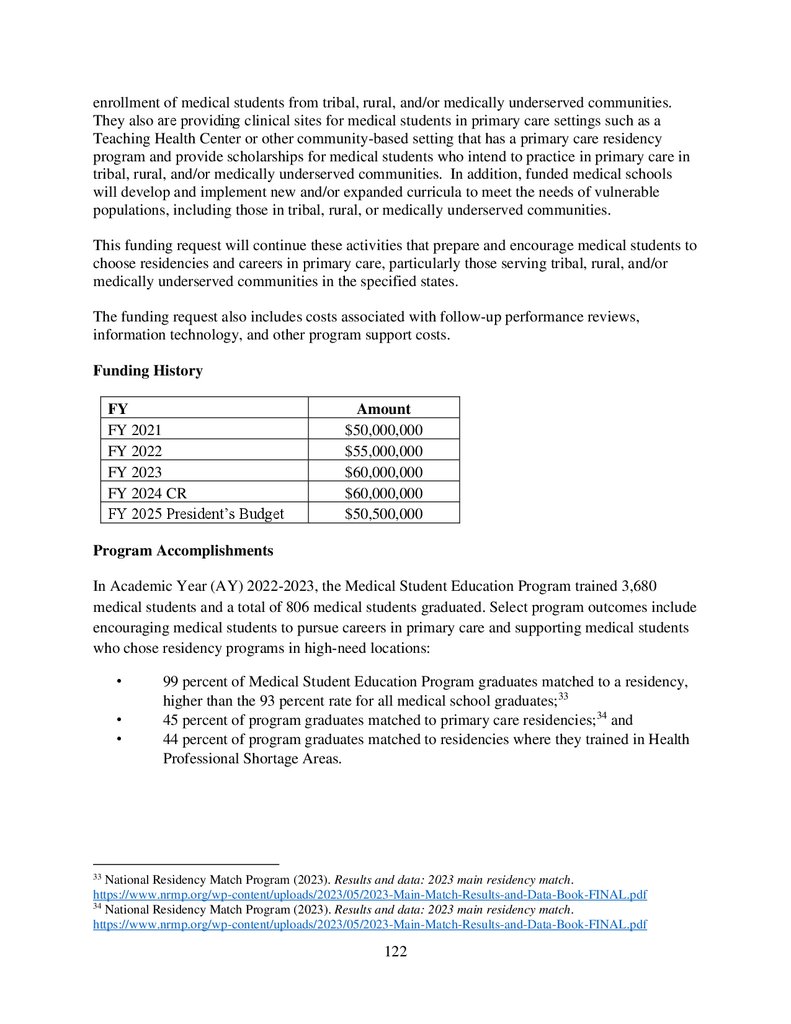
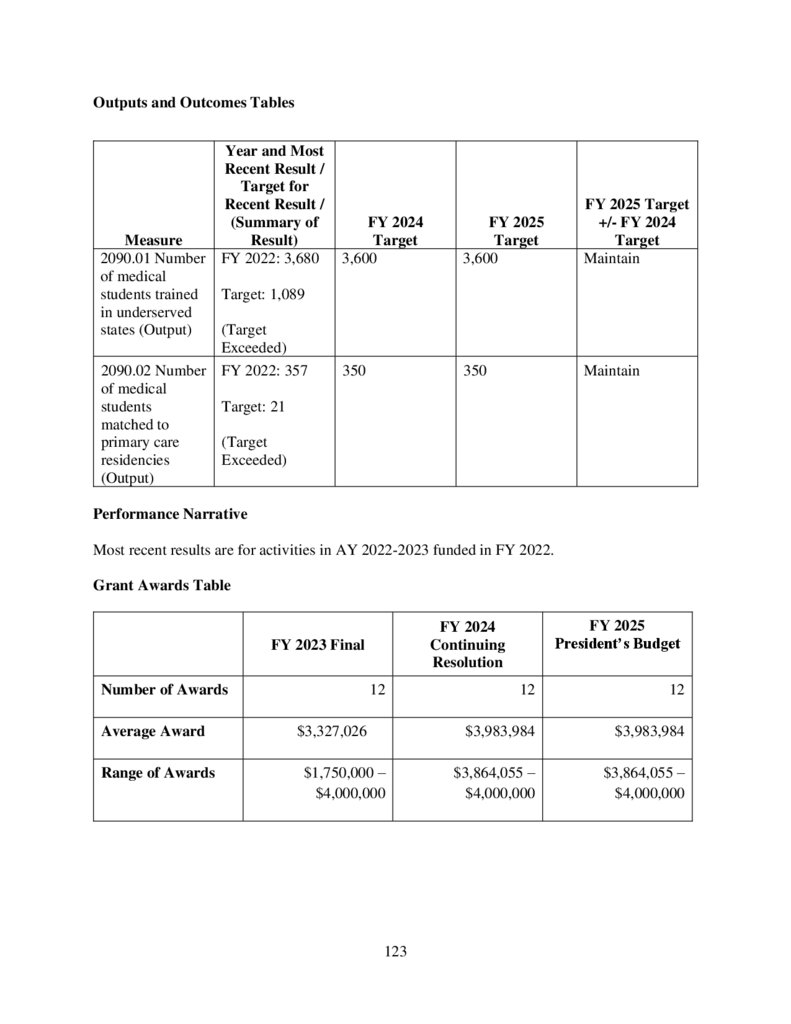
Medical Student Education Program....................................................................................... 121
Interdisciplinary, Community-Based Linkages....................................................................... 124
5
6.
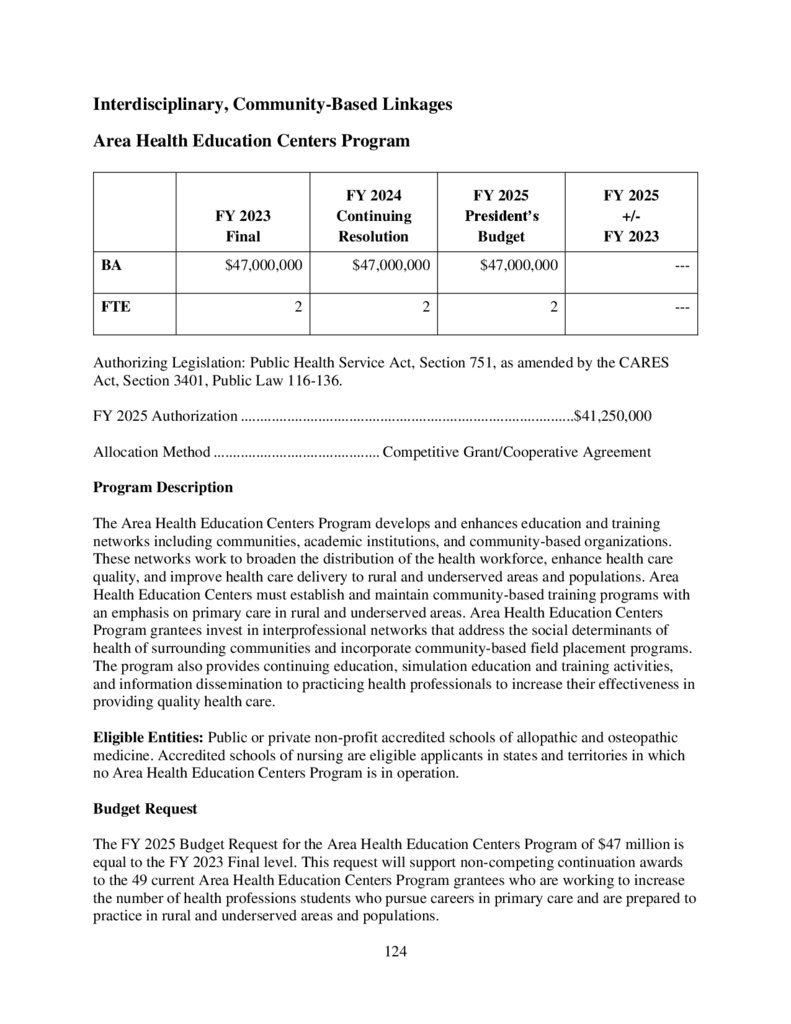
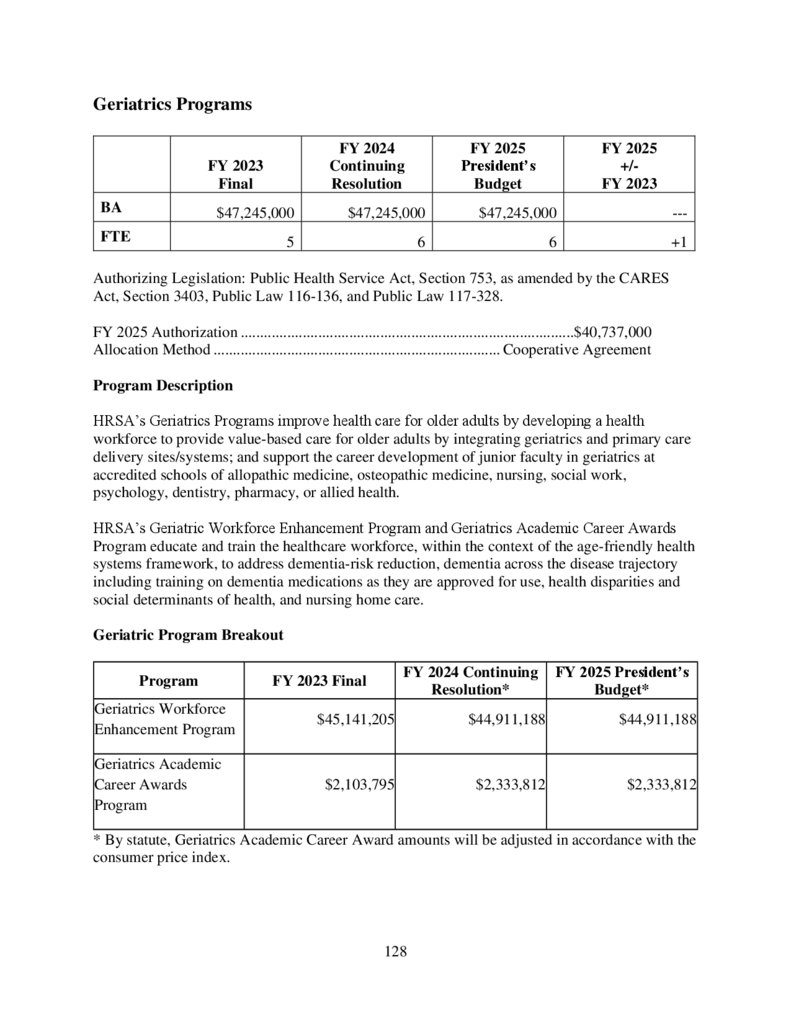
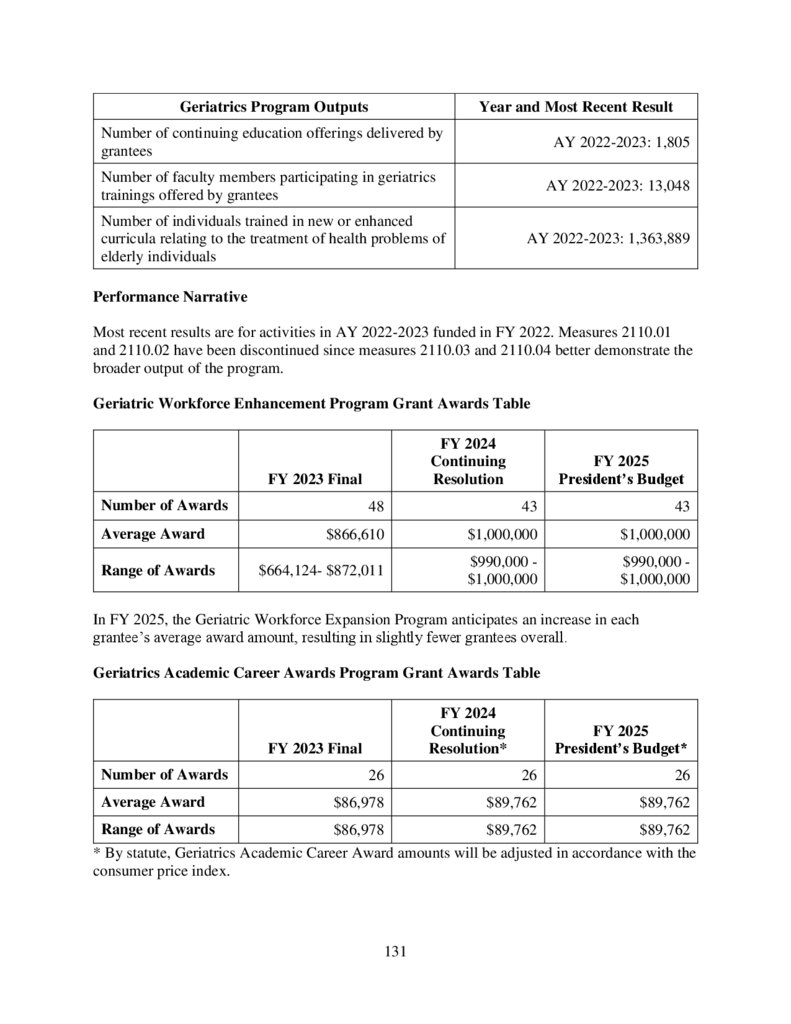
Area Health Education Centers Program ............................................................................. 124Geriatrics Programs ............................................................................................................. 128
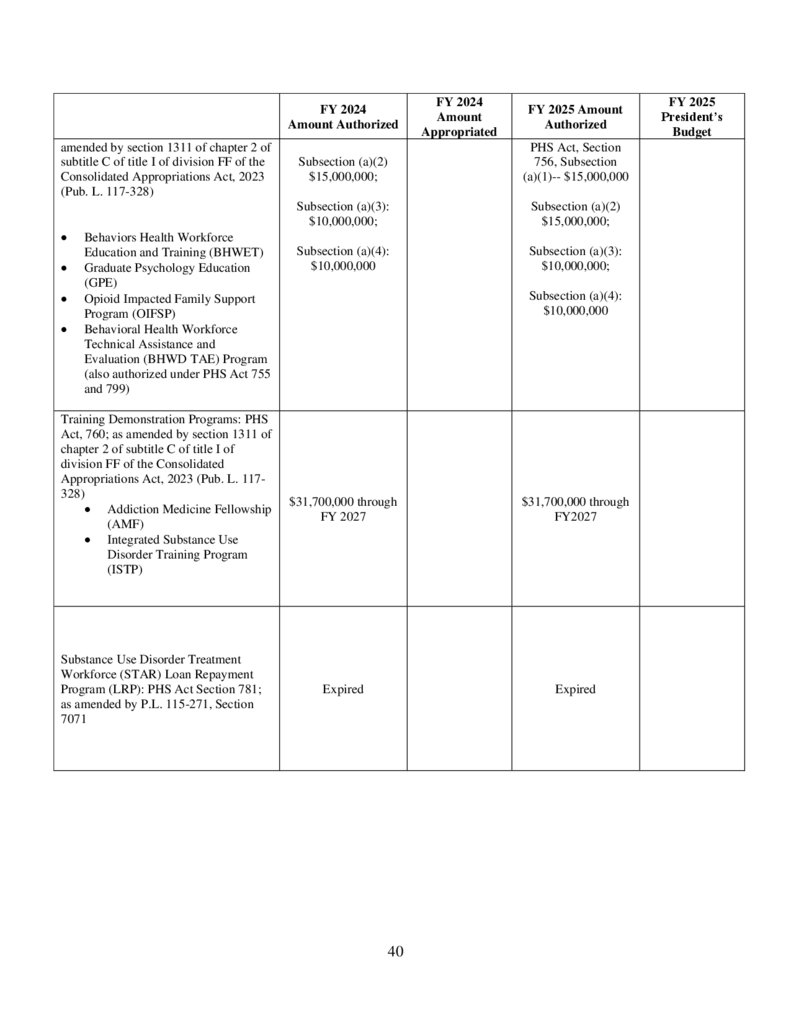
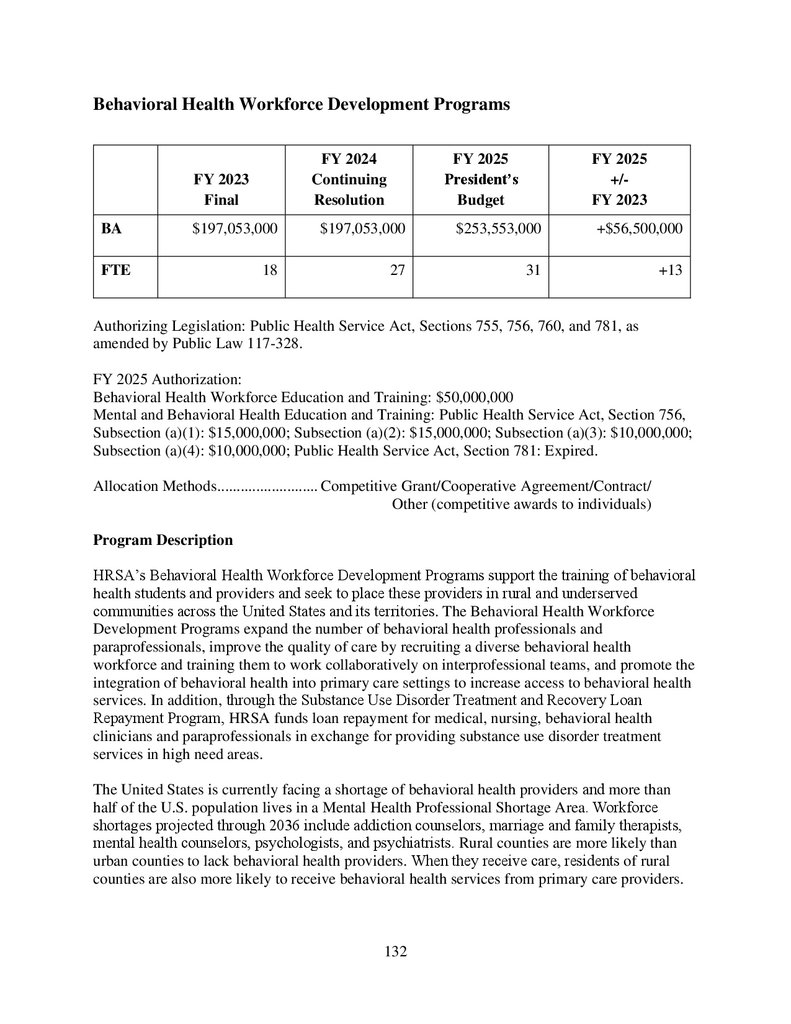
Behavioral Health Workforce Development Programs .......................................................... 132
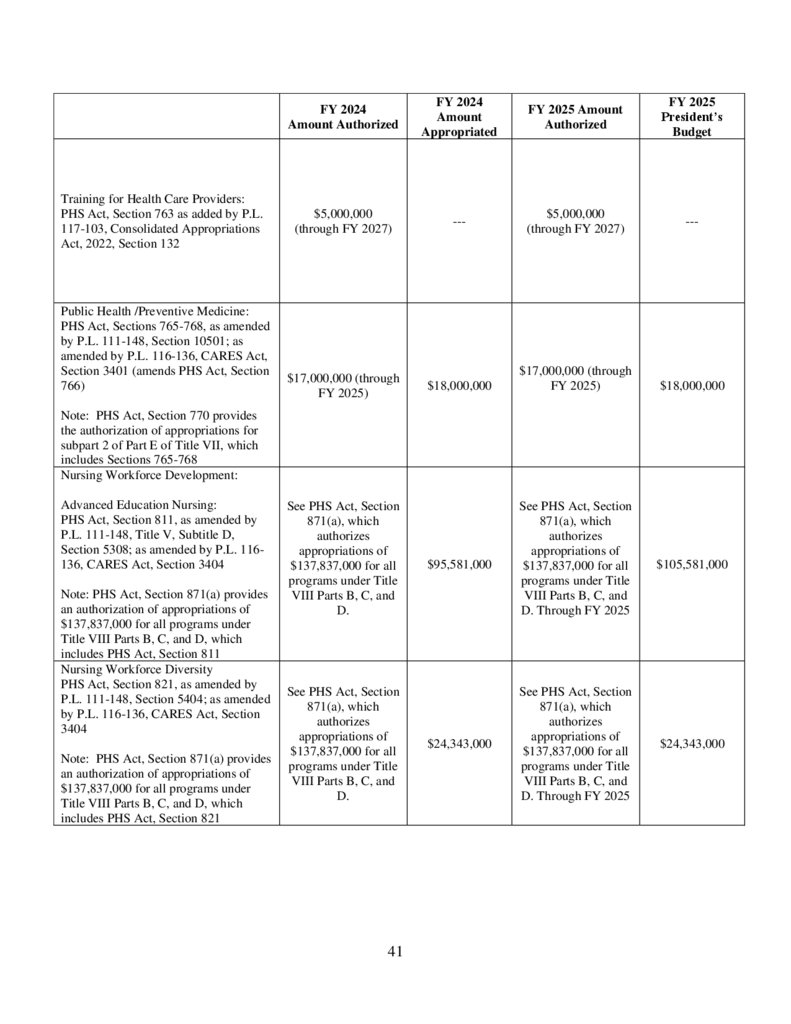
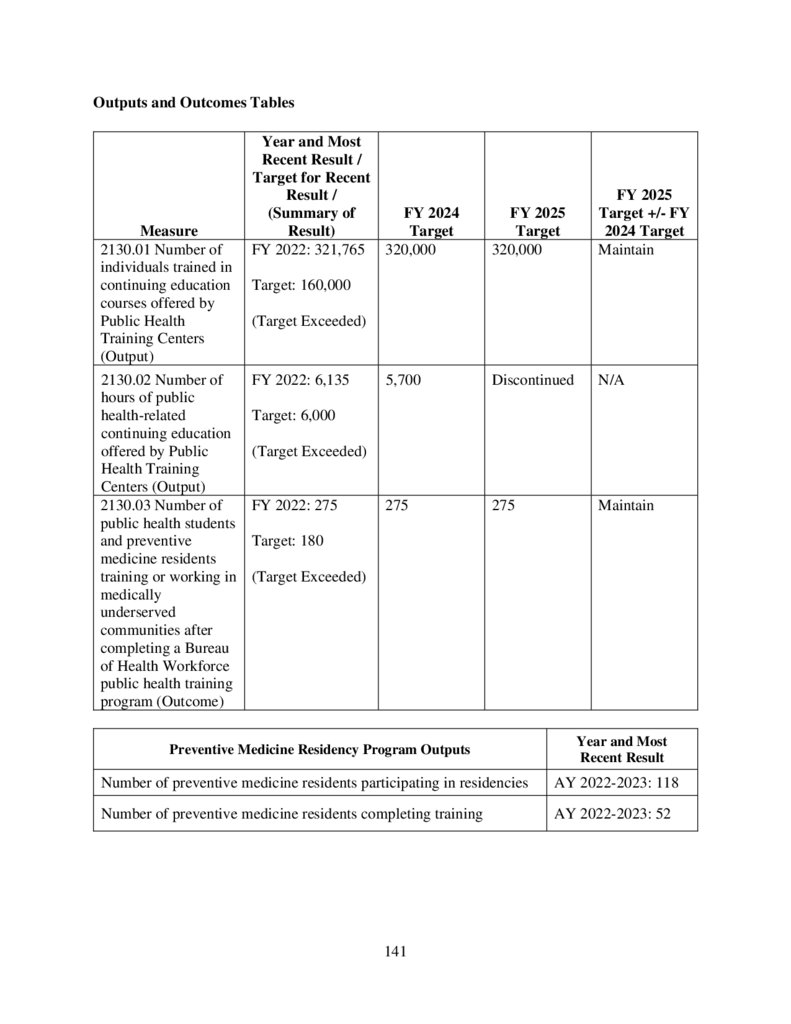
Public Health Workforce Development .................................................................................. 139
Public Health and Preventive Medicine Training Grant Programs ..................................... 139
Nursing Workforce Development ........................................................................................... 143
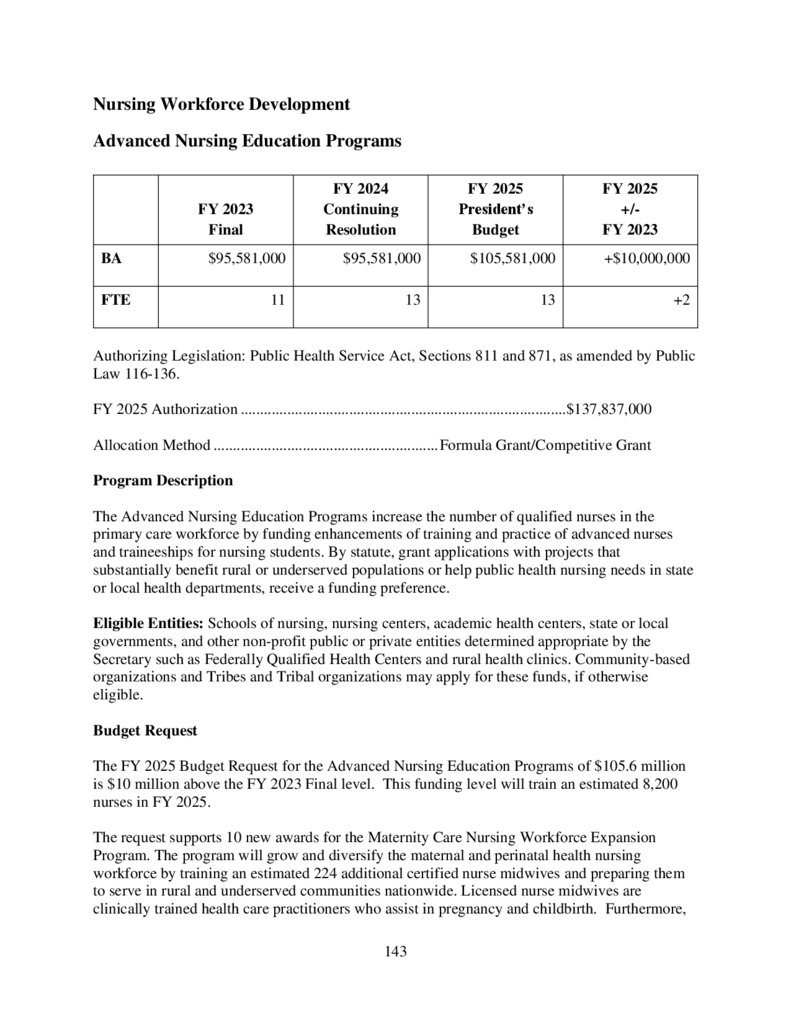
Advanced Nursing Education Programs.............................................................................. 143
Nursing Workforce Diversity .............................................................................................. 147
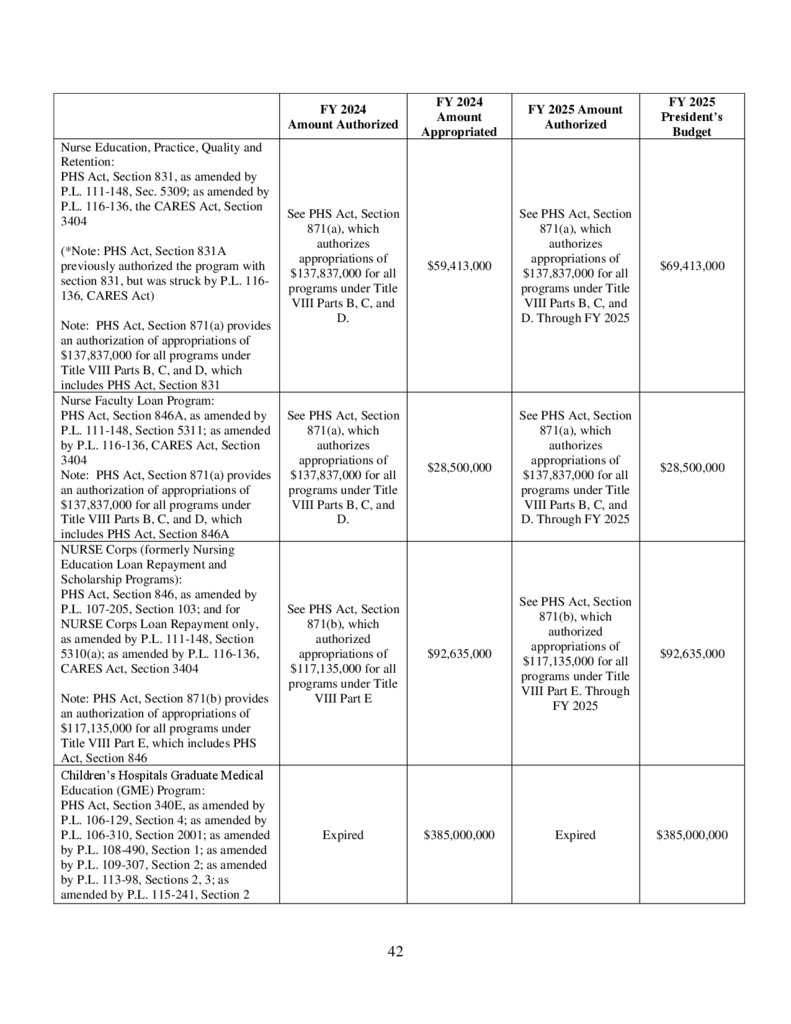
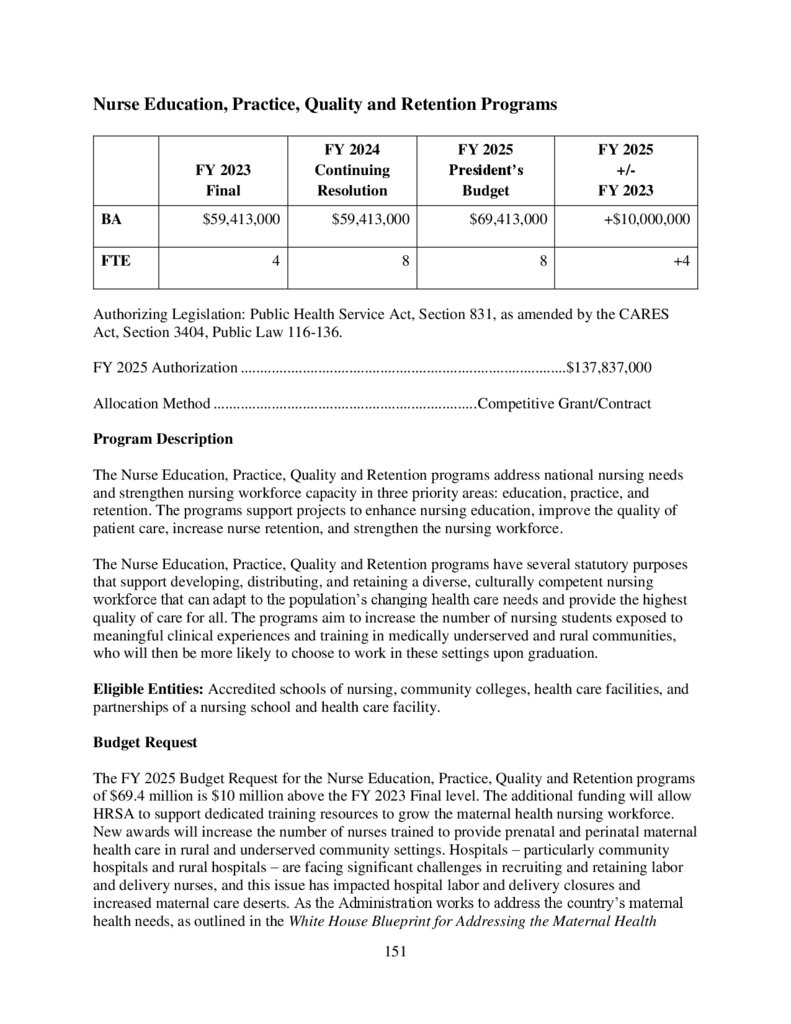
Nurse Education, Practice, Quality and Retention Programs .............................................. 151
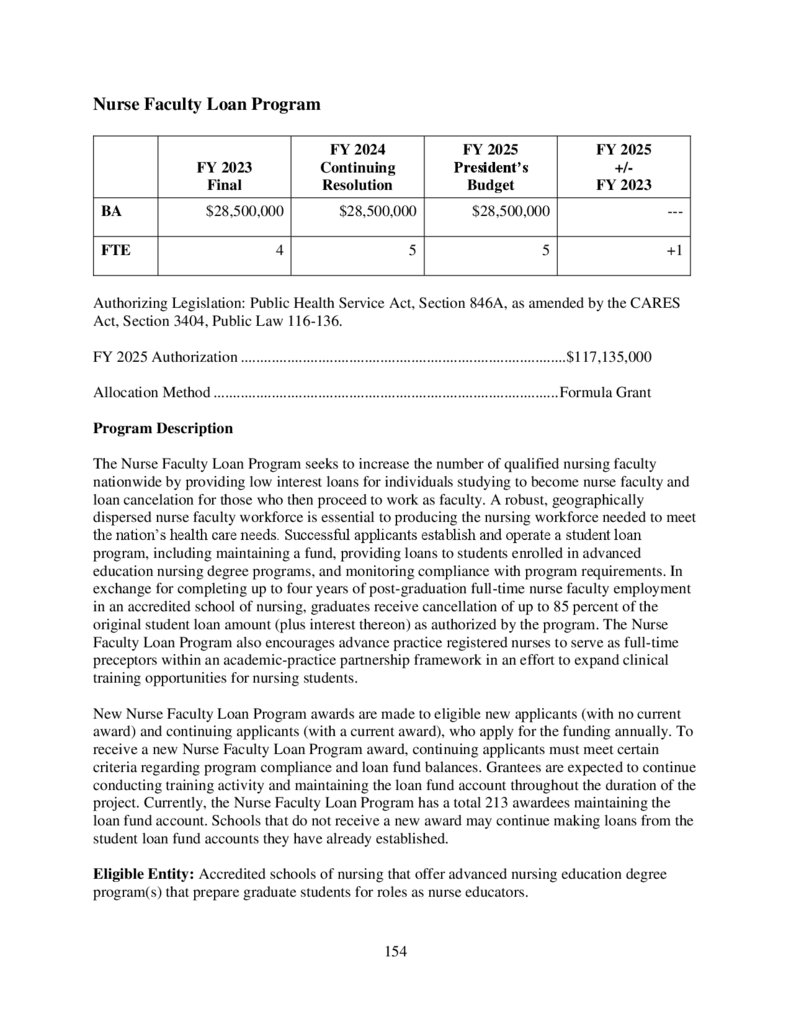
Nurse Faculty Loan Program ............................................................................................... 154
Nurse Corps ......................................................................................................................... 157
Children’s Hospitals Graduate Medical Education Payment Program ................................... 162
Teaching Health Center Graduate Medical Education Program ............................................. 166
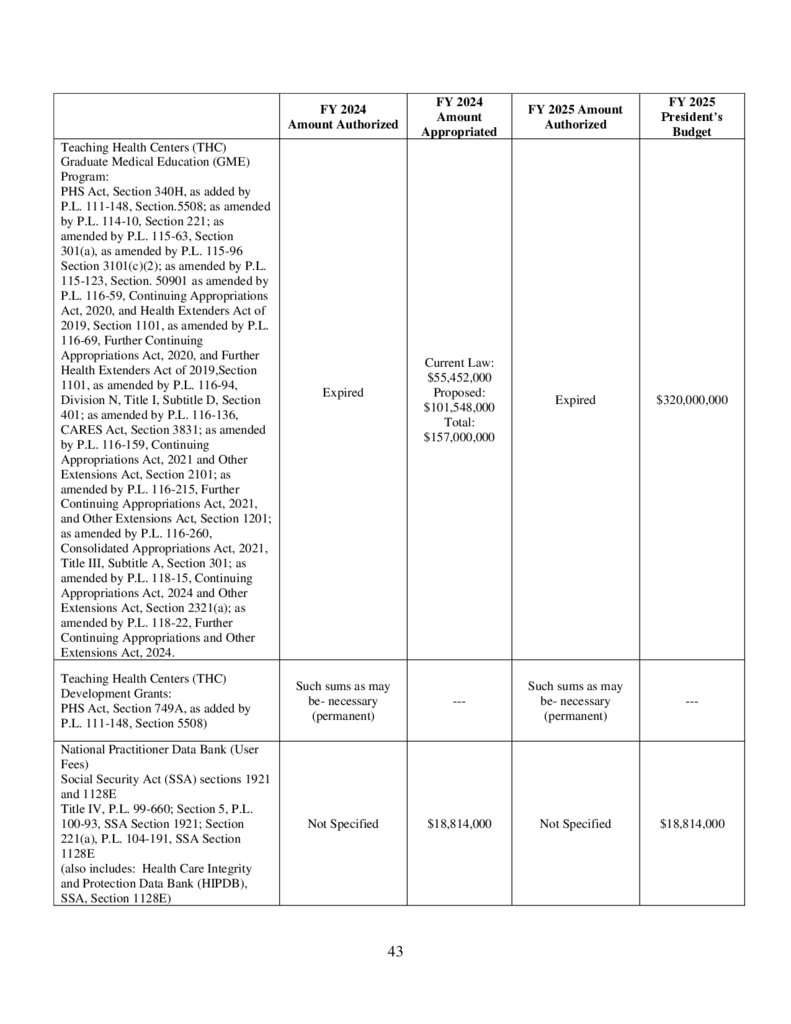
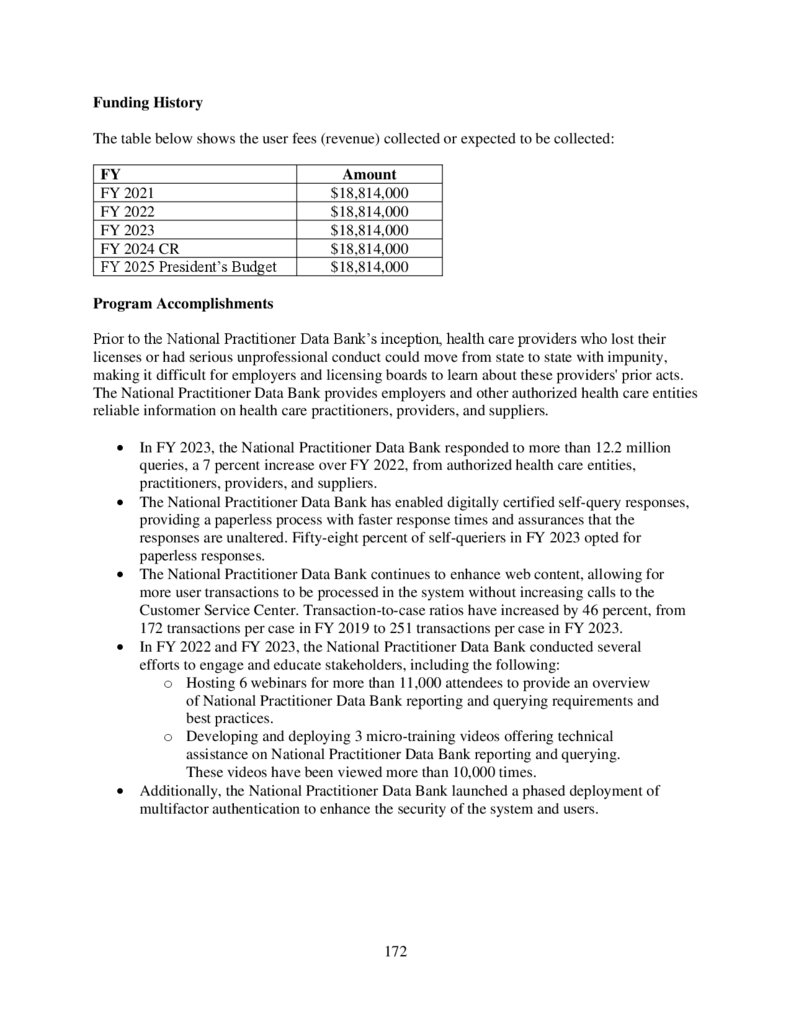
National Practitioner Data Bank ............................................................................................. 171
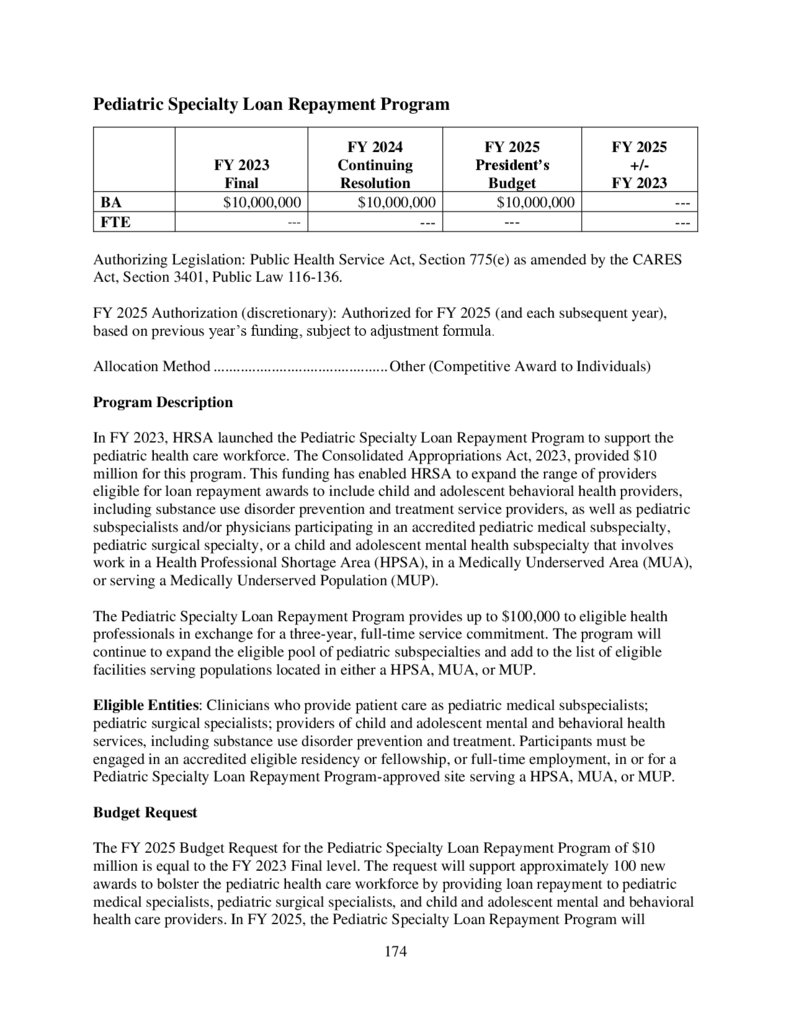
Pediatric Specialty Loan Repayment Program........................................................................ 174
Health Care Workforce Innovation Program .......................................................................... 177
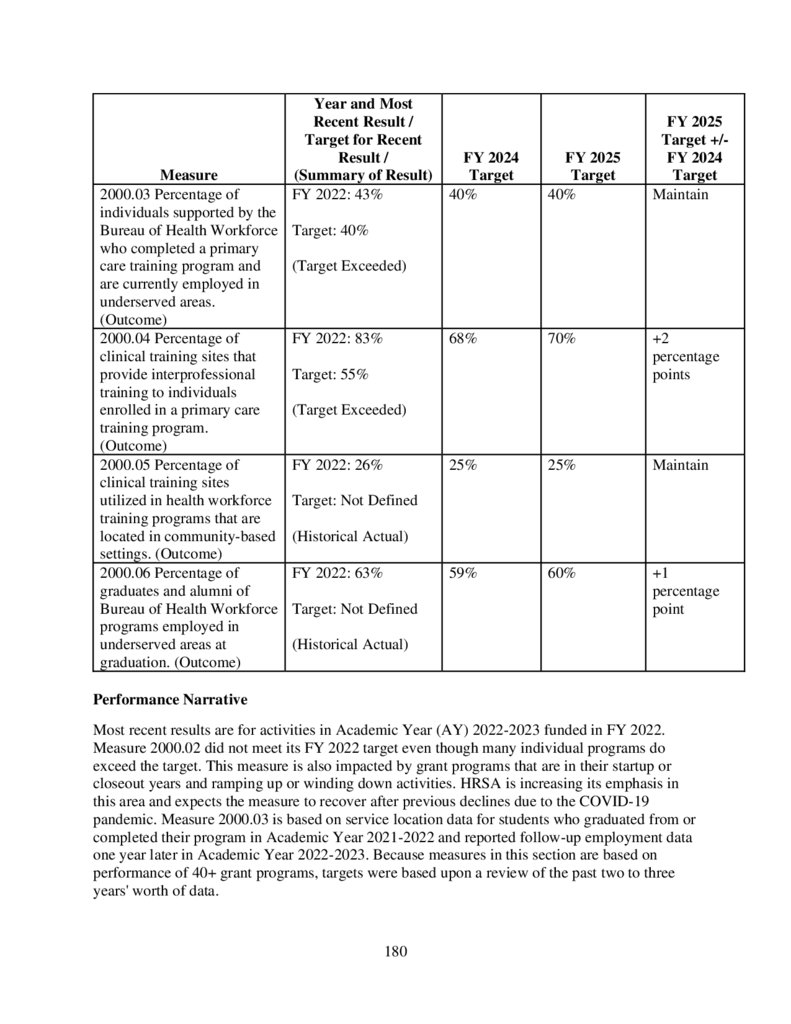
Health Workforce Cross-Cutting Performance Measures ....................................................... 179
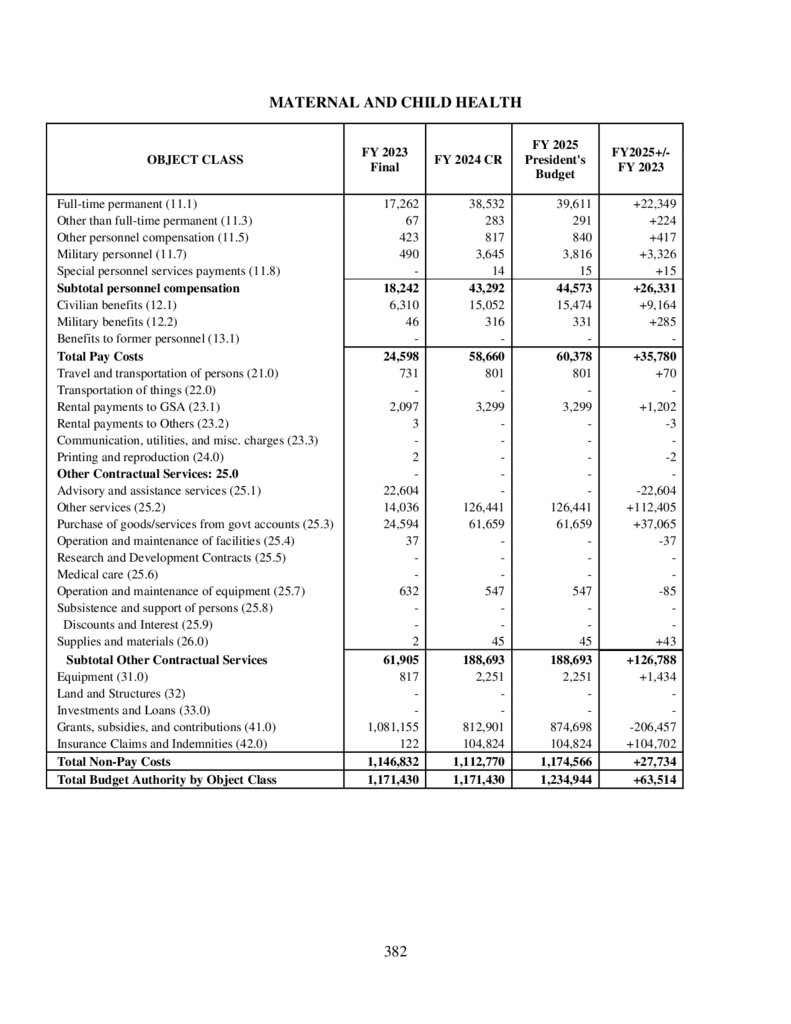
MATERNAL AND CHILD HEALTH ................................................................................... 182
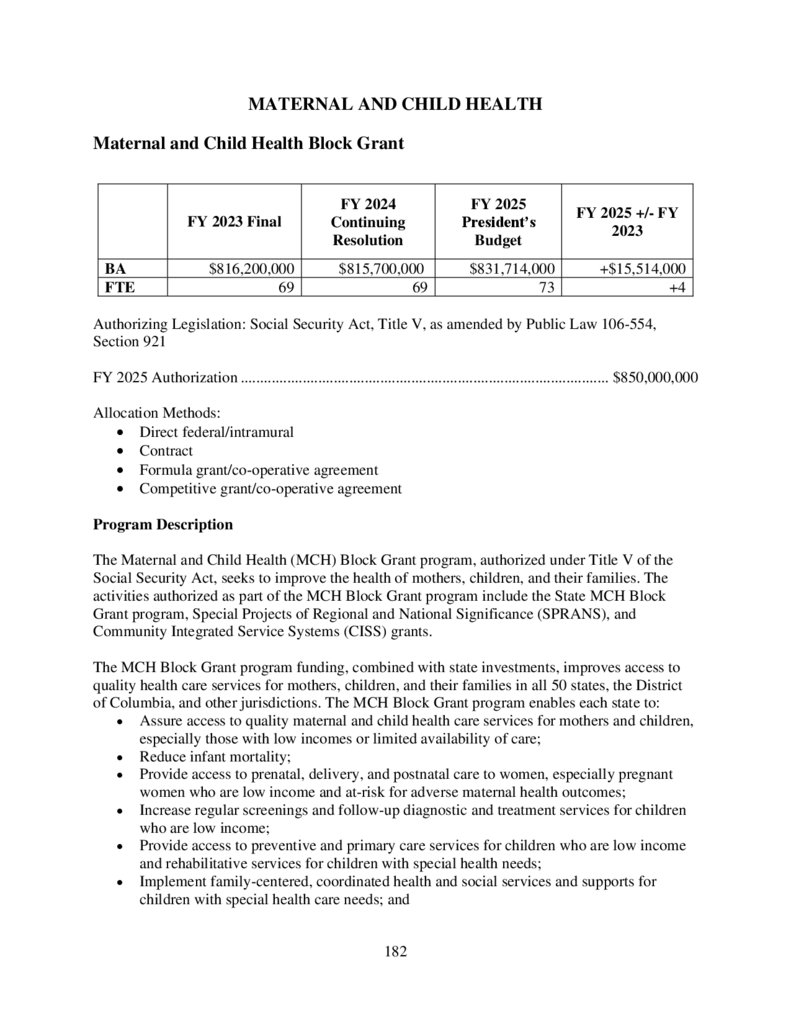
Maternal and Child Health Block Grant ................................................................................. 182
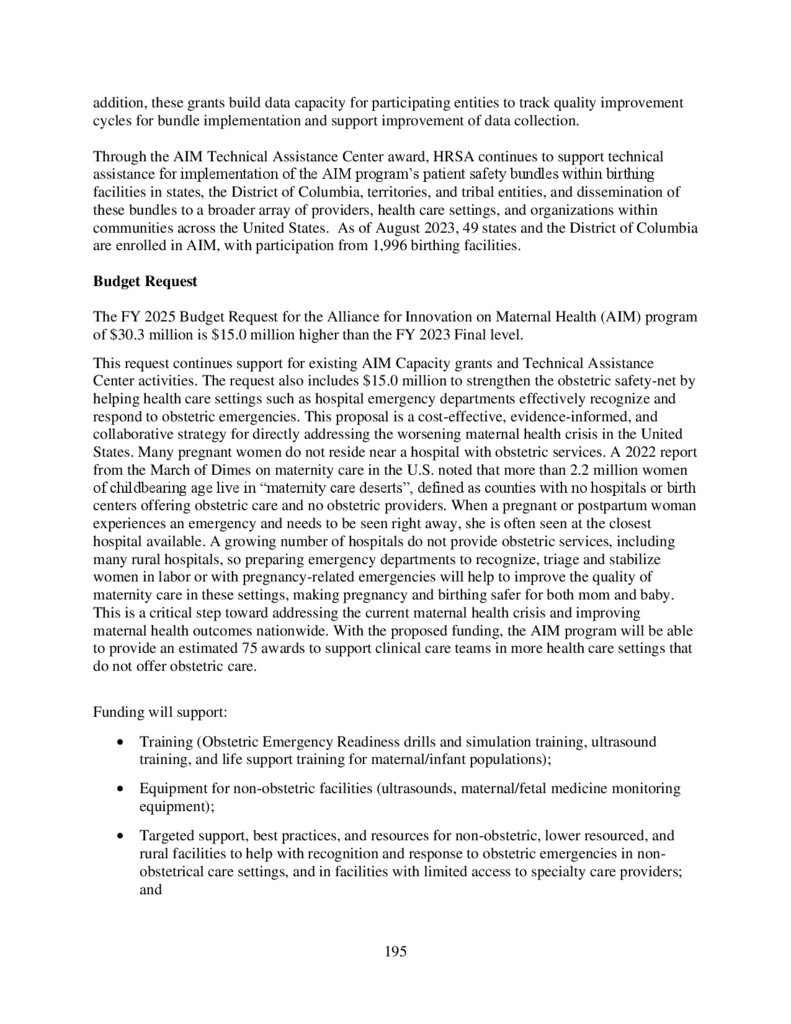
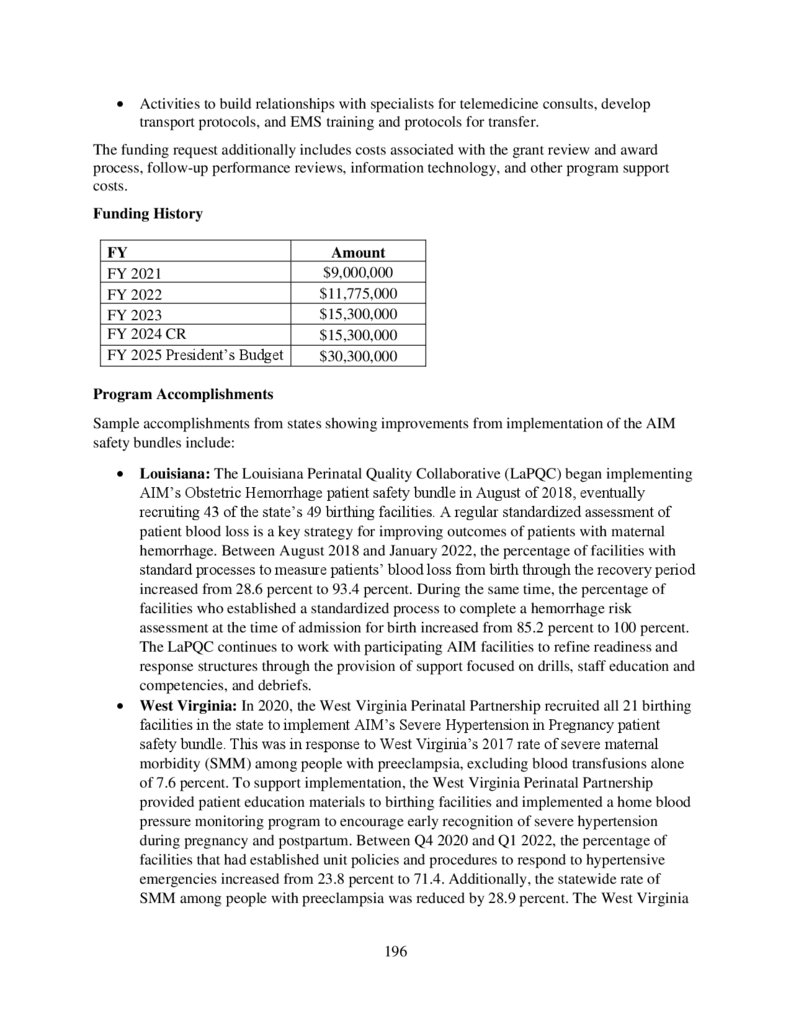
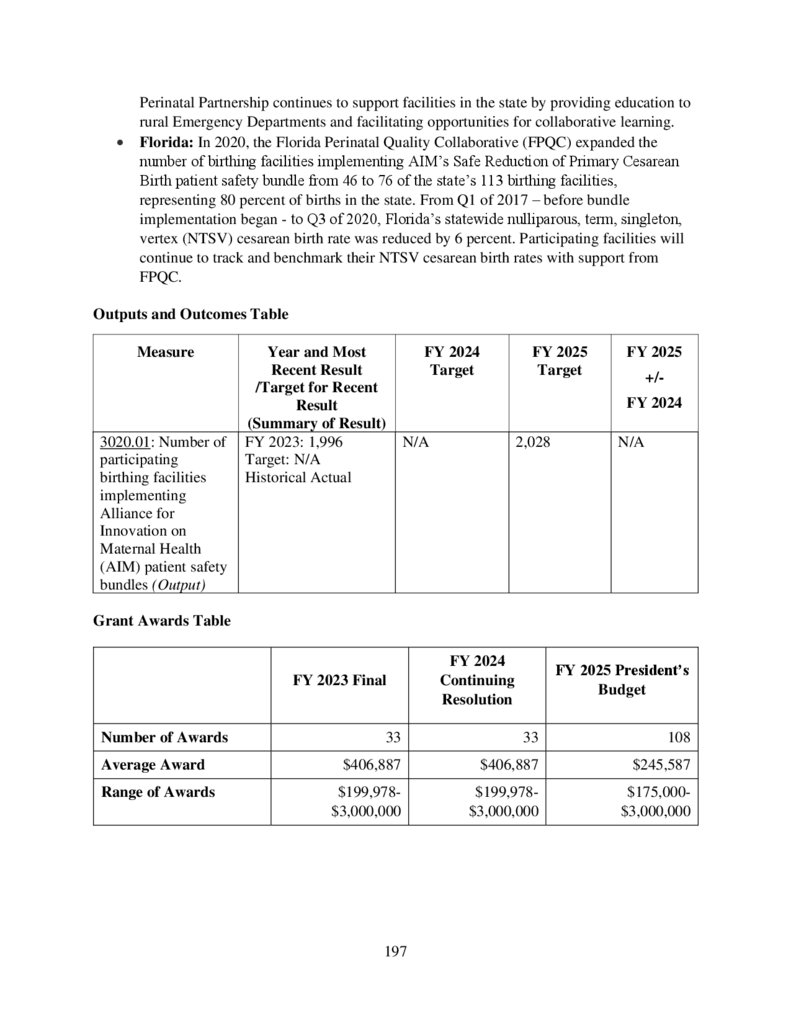
Innovation for Maternal Health ............................................................................................... 194
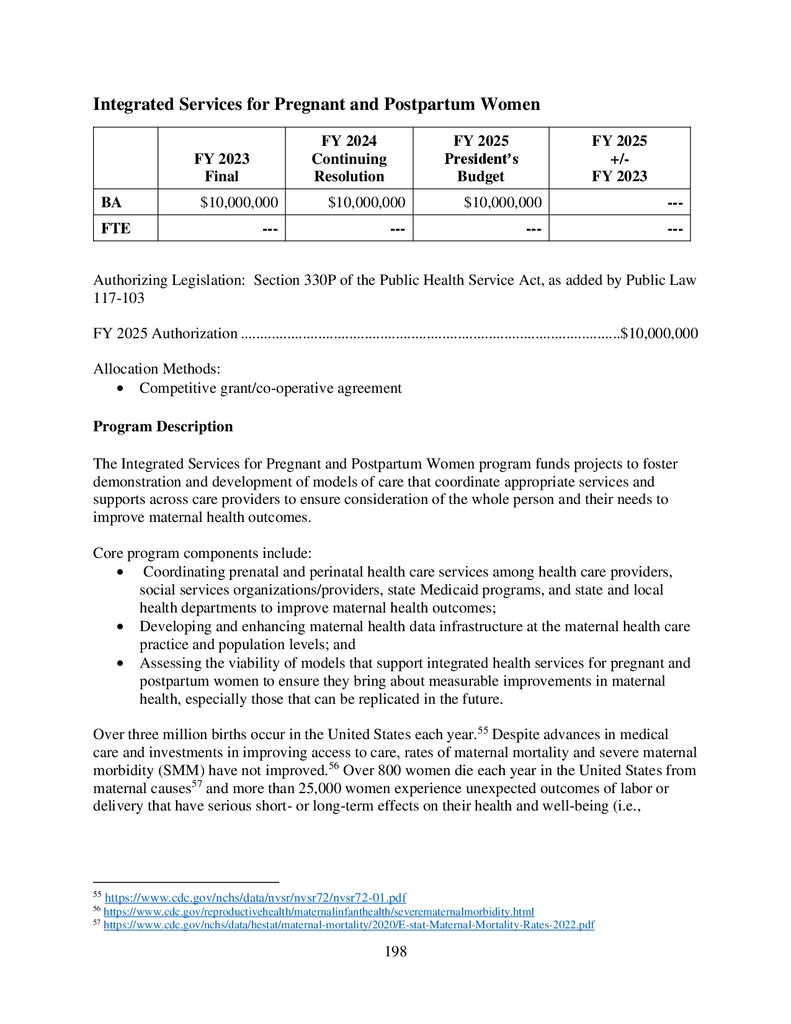
Integrated Services for Pregnant and Postpartum Women...................................................... 198
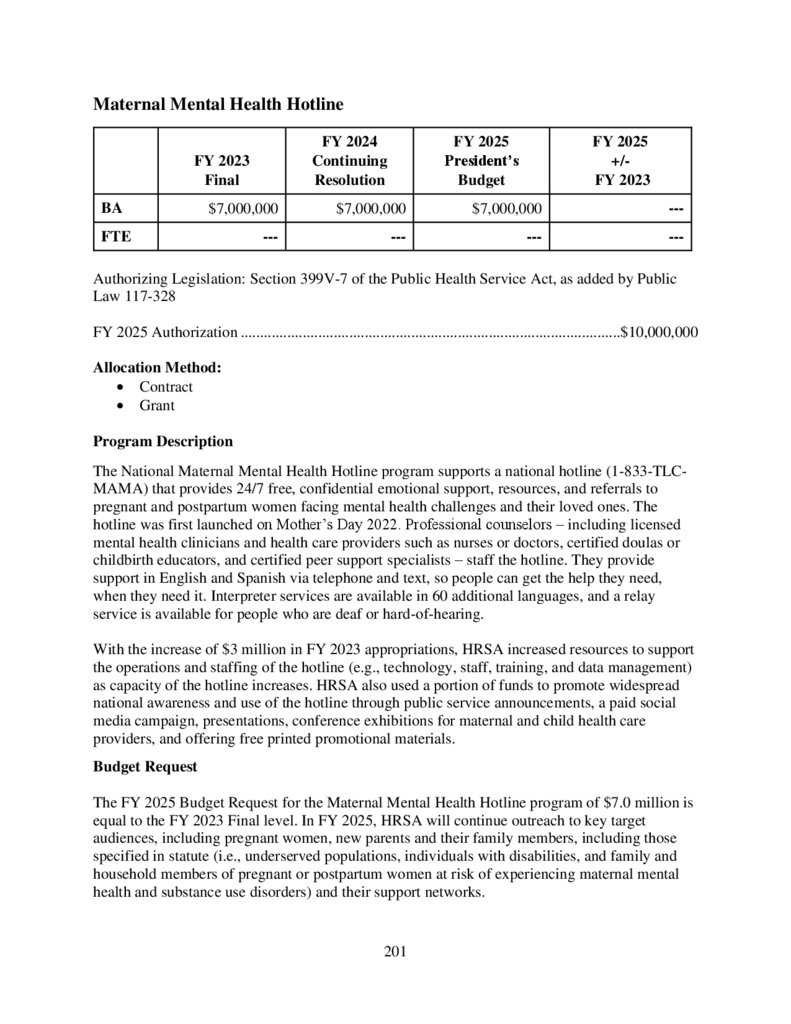
Maternal Mental Health Hotline ............................................................................................. 201
Autism and Other Developmental Disabilities........................................................................ 203
Sickle Cell Disease Treatment Demonstration Program ......................................................... 208
Early Hearing Detection and Intervention .............................................................................. 212
Emergency Medical Services for Children ............................................................................. 216
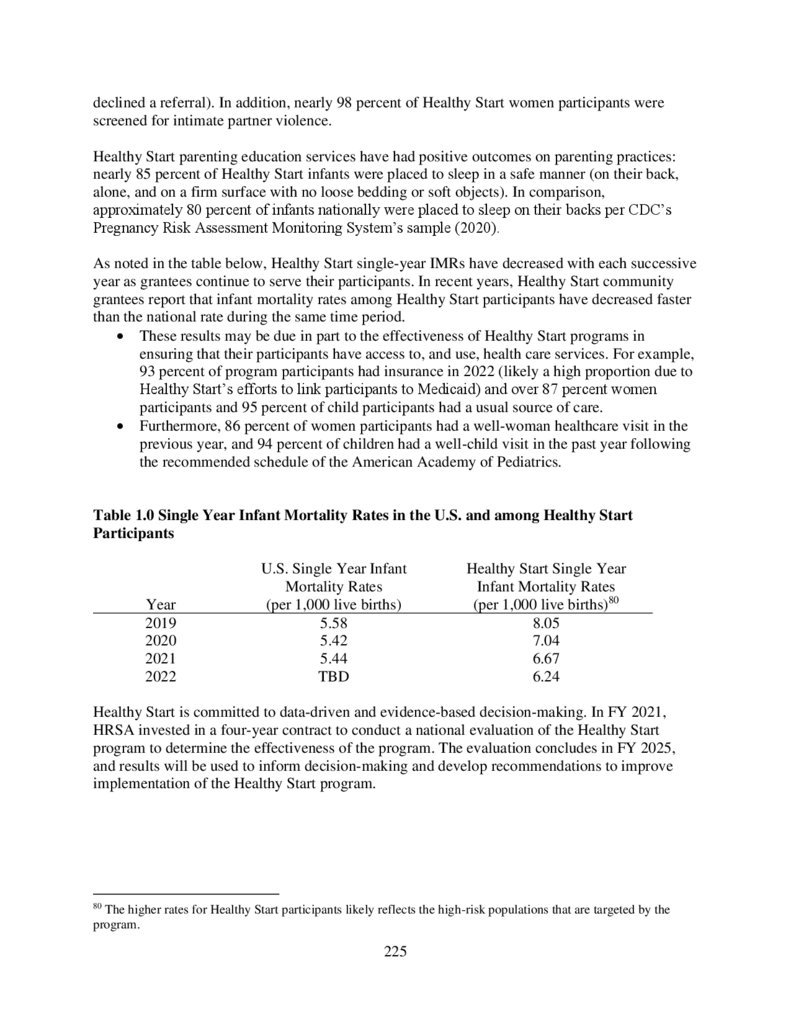
Healthy Start ............................................................................................................................ 221
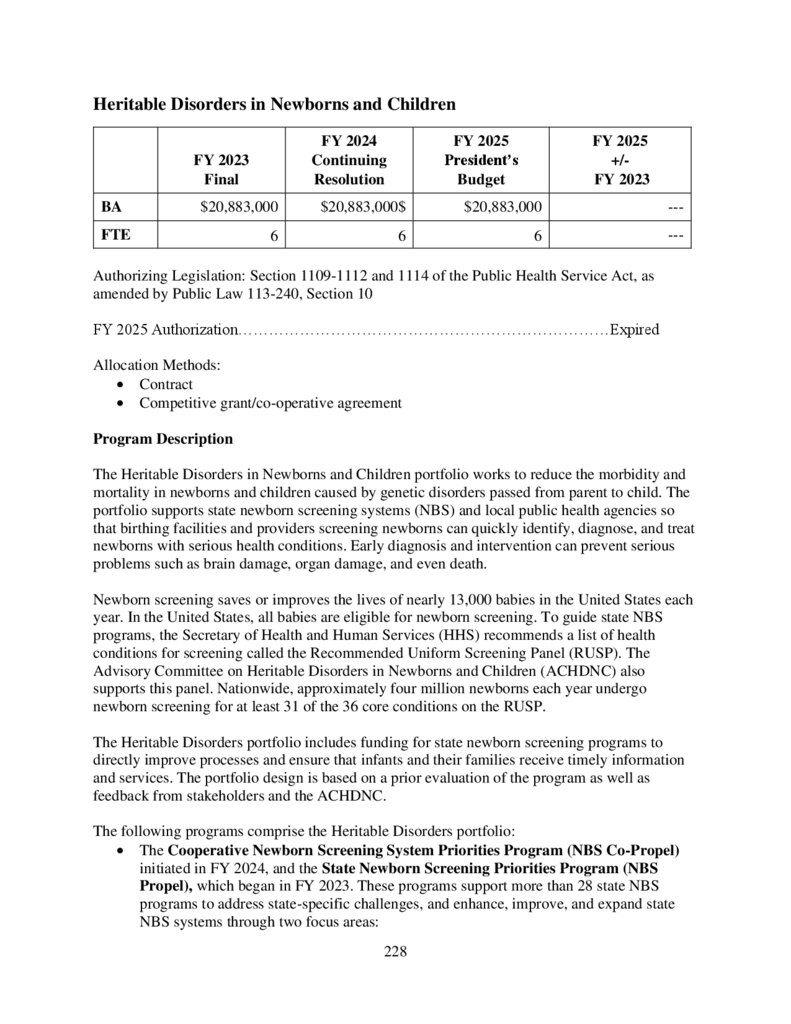
Heritable Disorders in Newborns and Children ...................................................................... 228
Pediatric Mental Health Care Access ...................................................................................... 232
Screening and Treatment for Maternal Mental Health and Substance Use Disorders ............ 236
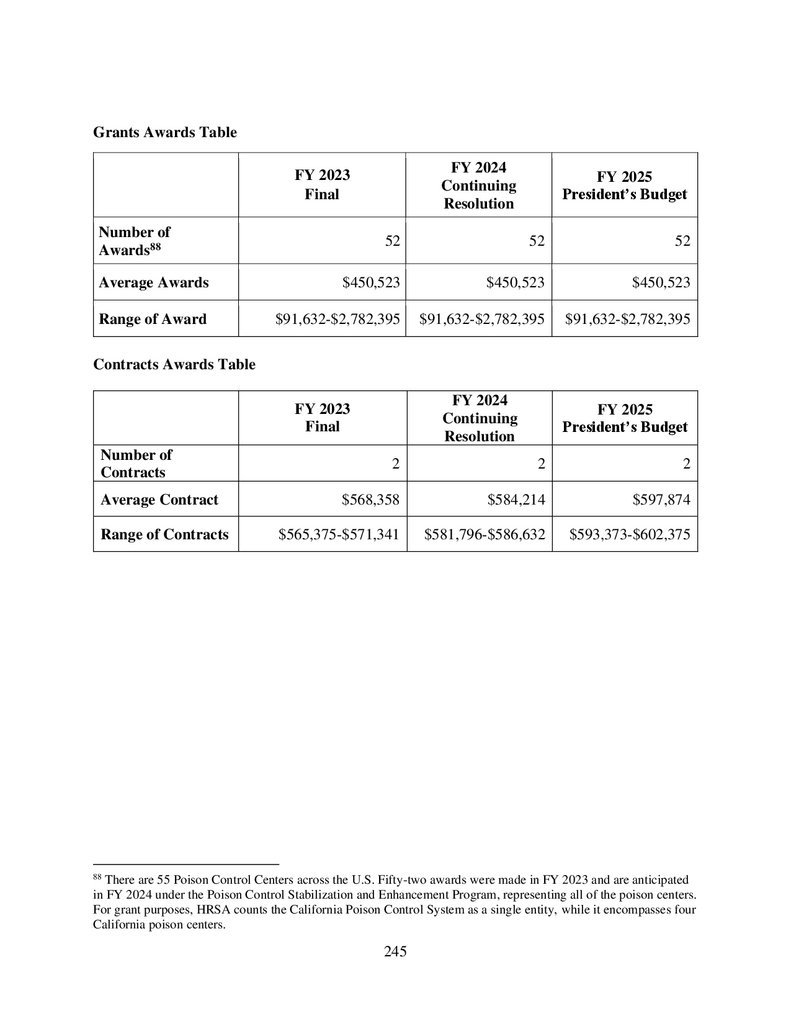
Poison Control Program .......................................................................................................... 241
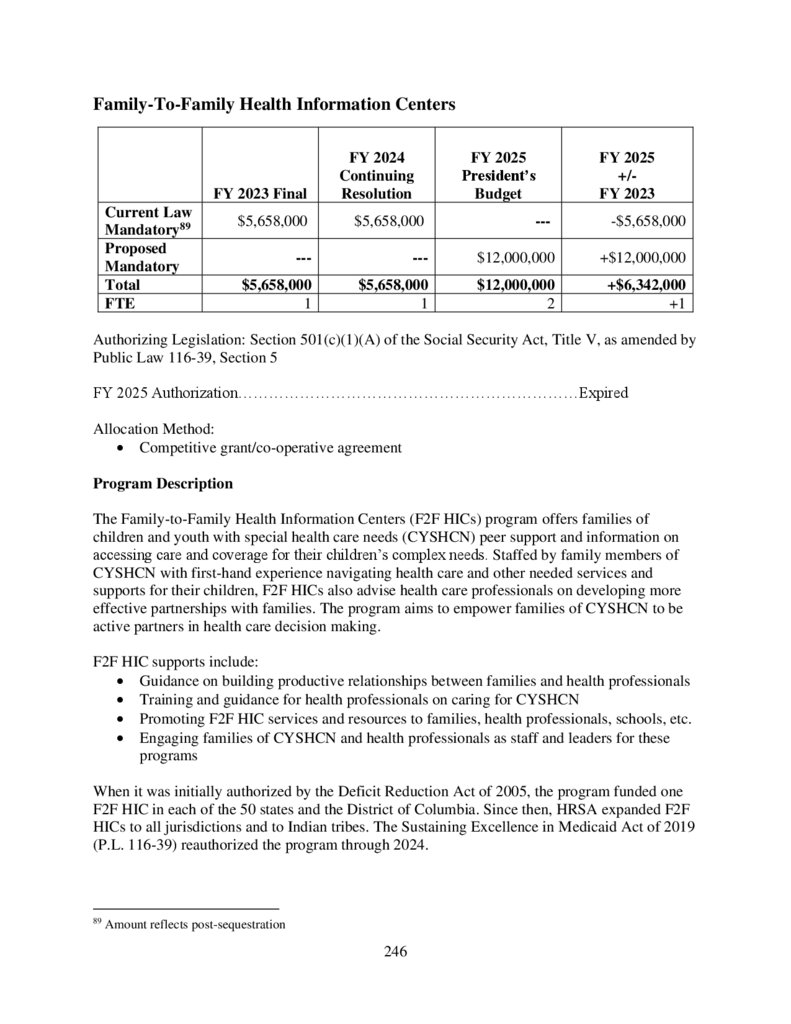
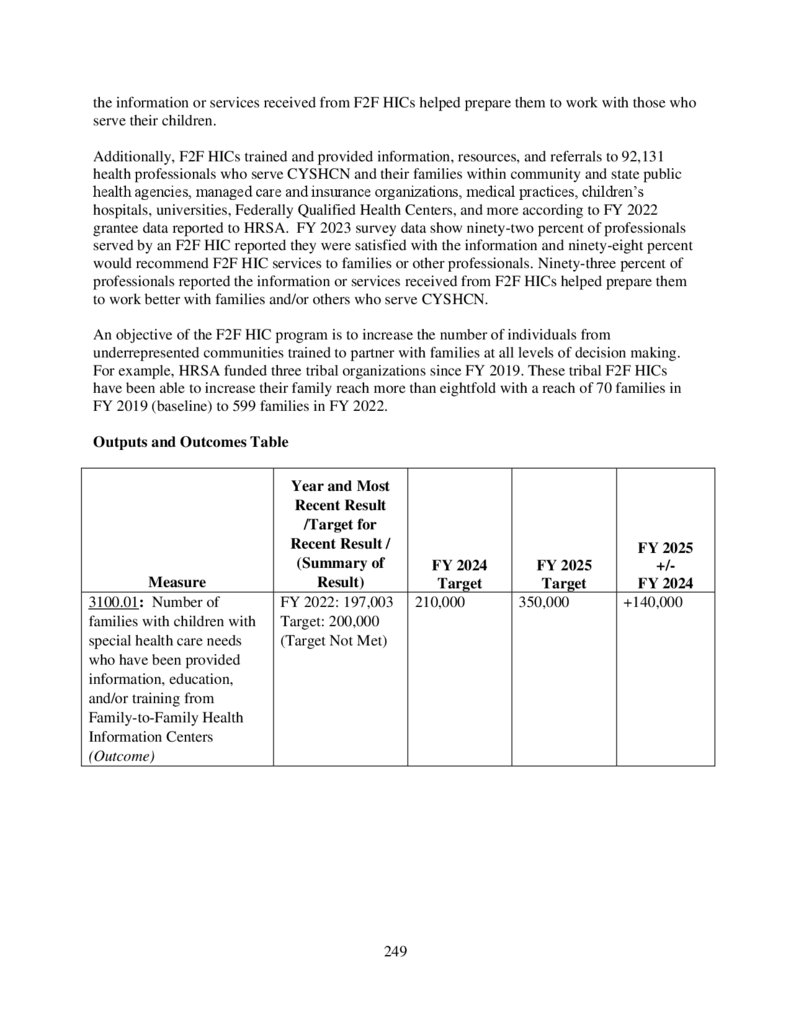
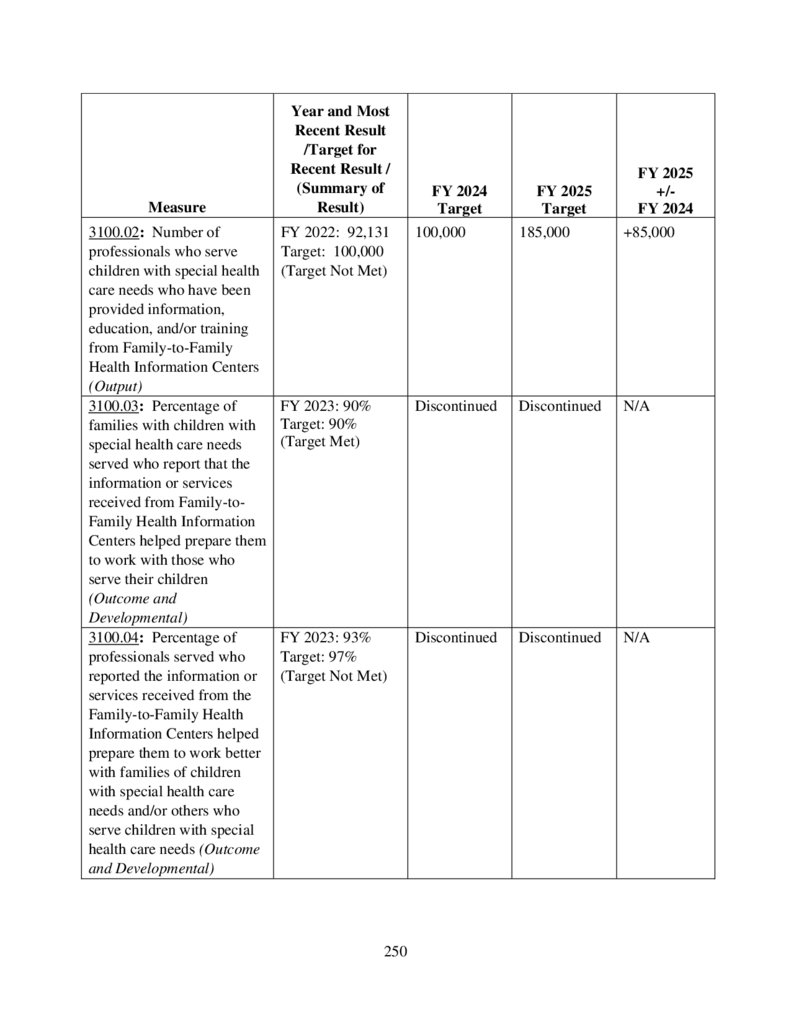
Family-To-Family Health Information Centers ...................................................................... 246
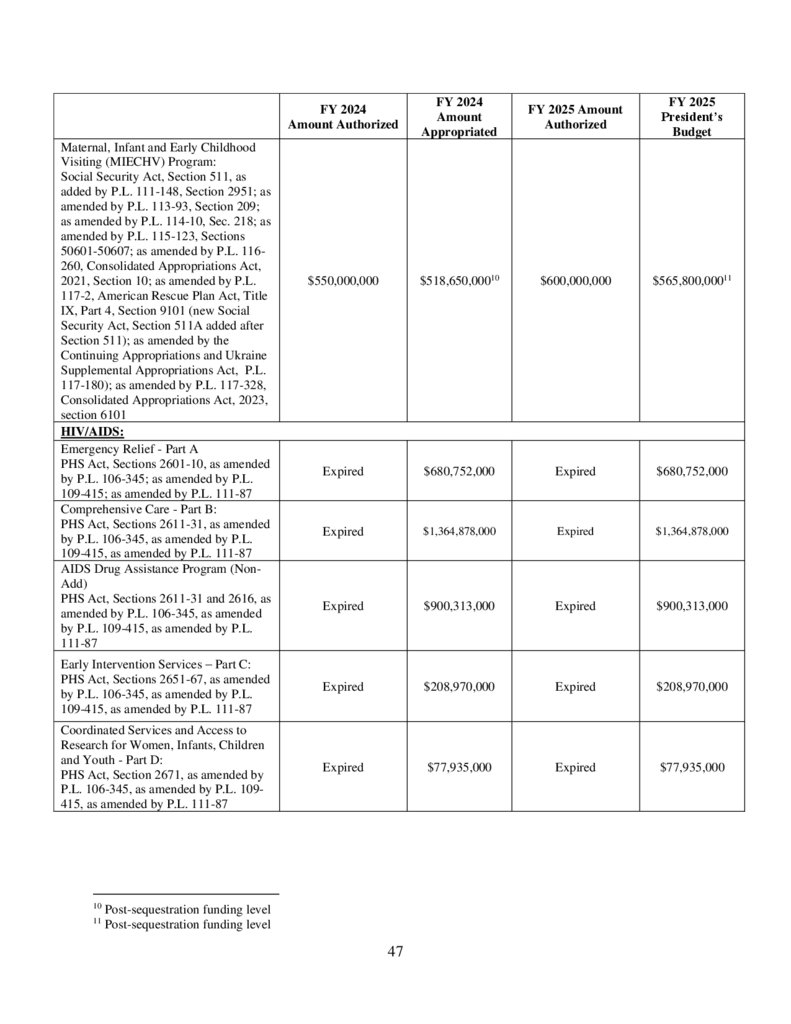
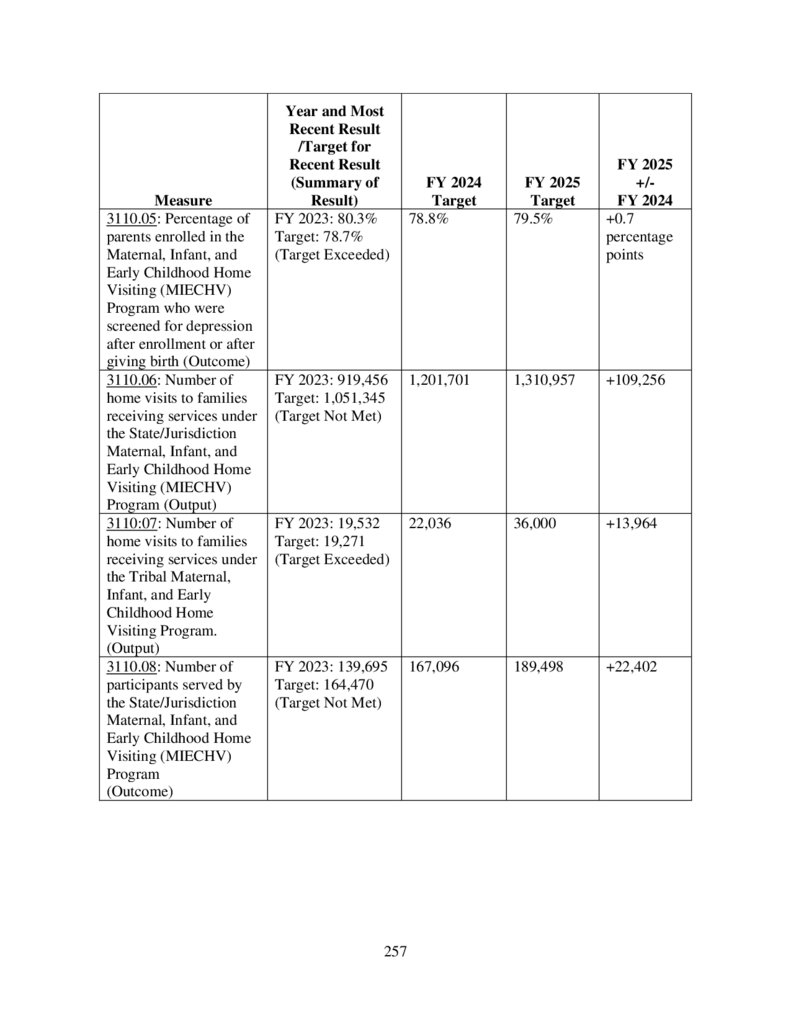
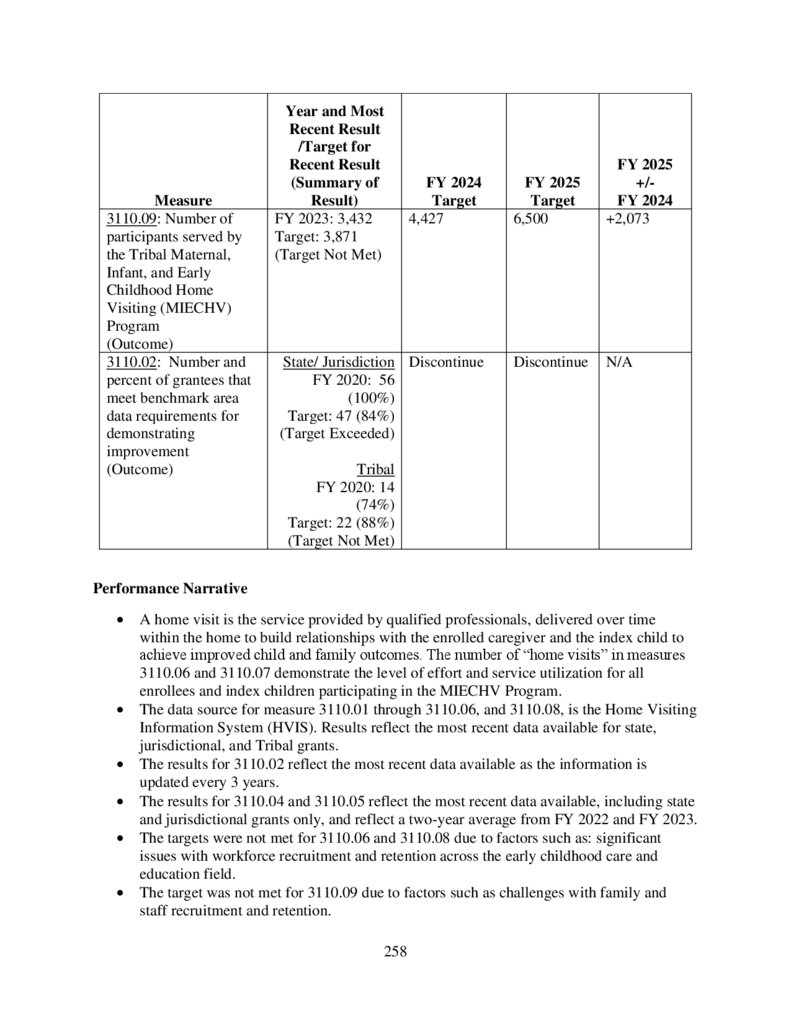
Maternal, Infant, and Early Childhood Home Visiting Program ............................................ 252
6
7.
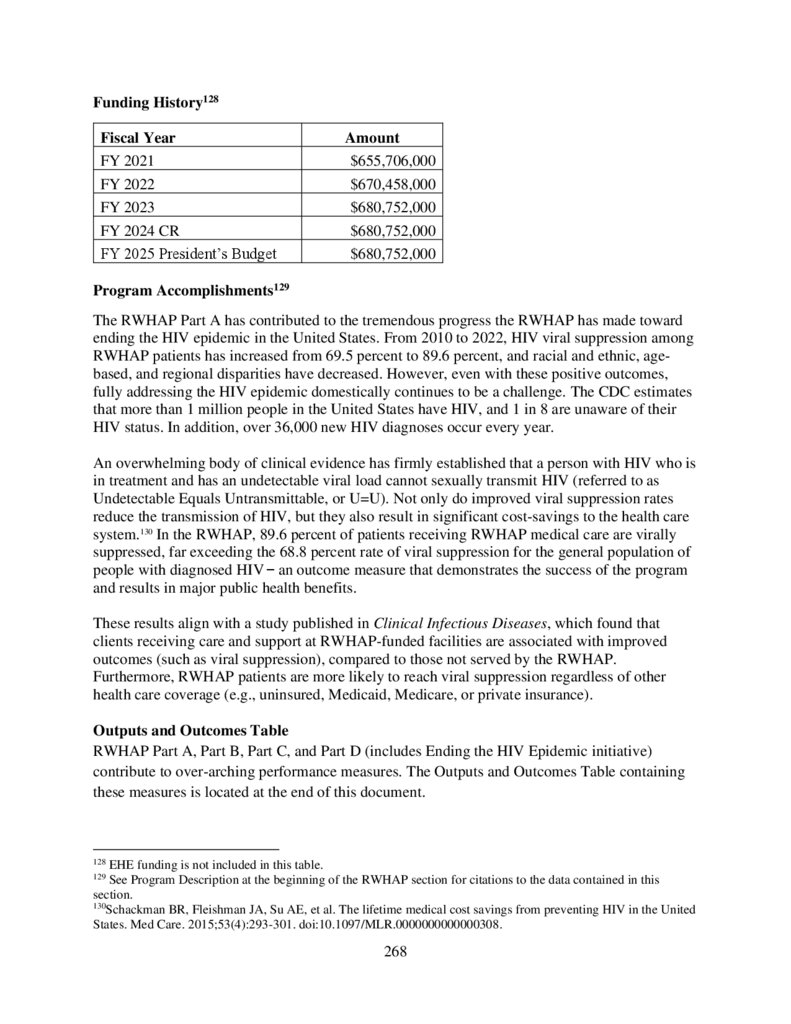
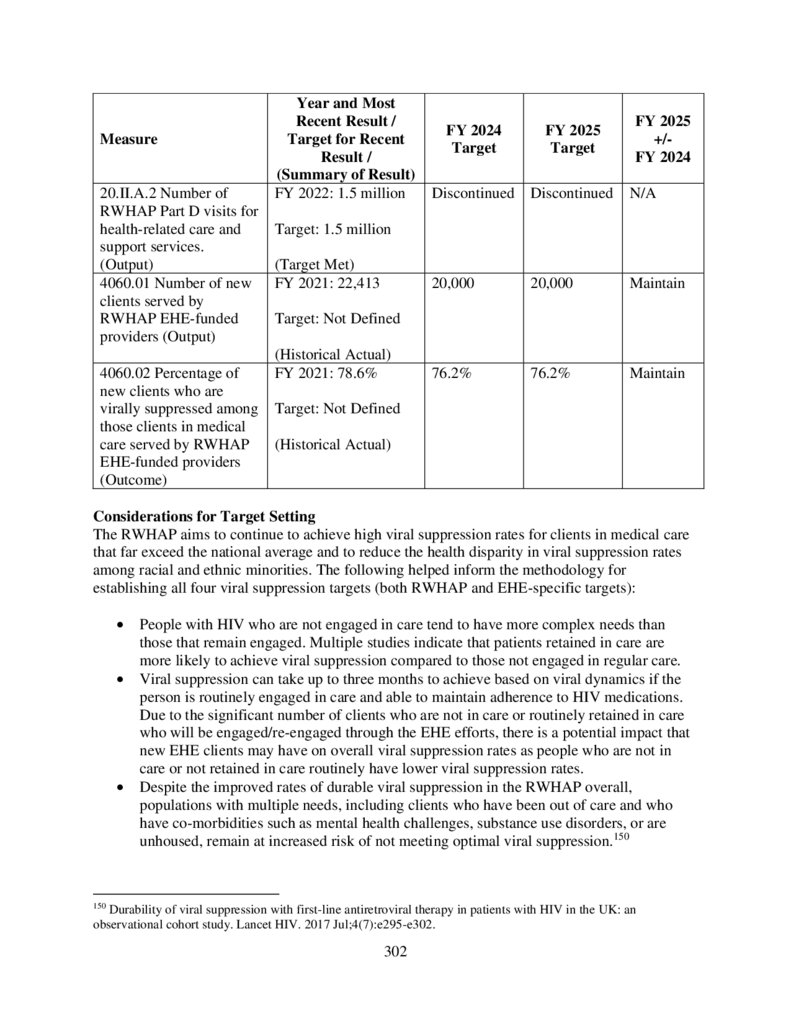
RYAN WHITE HIV/AIDS ....................................................................................................... 261Program Description ............................................................................................................... 261
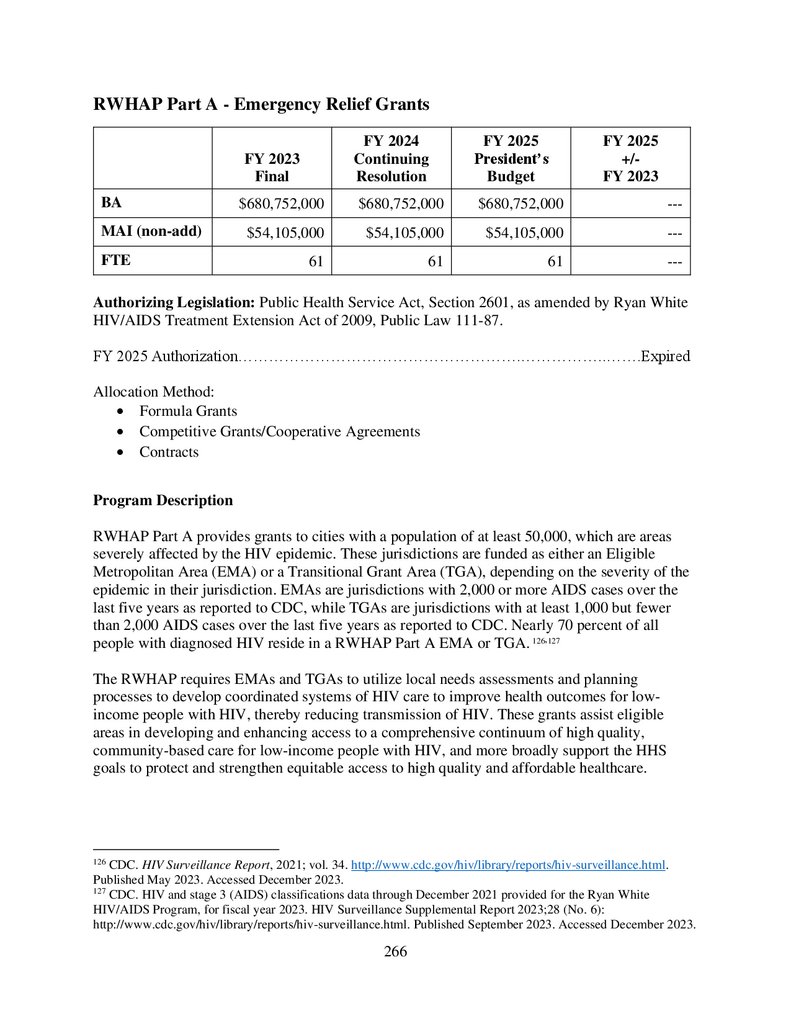
RWHAP Part A - Emergency Relief Grants ........................................................................... 266
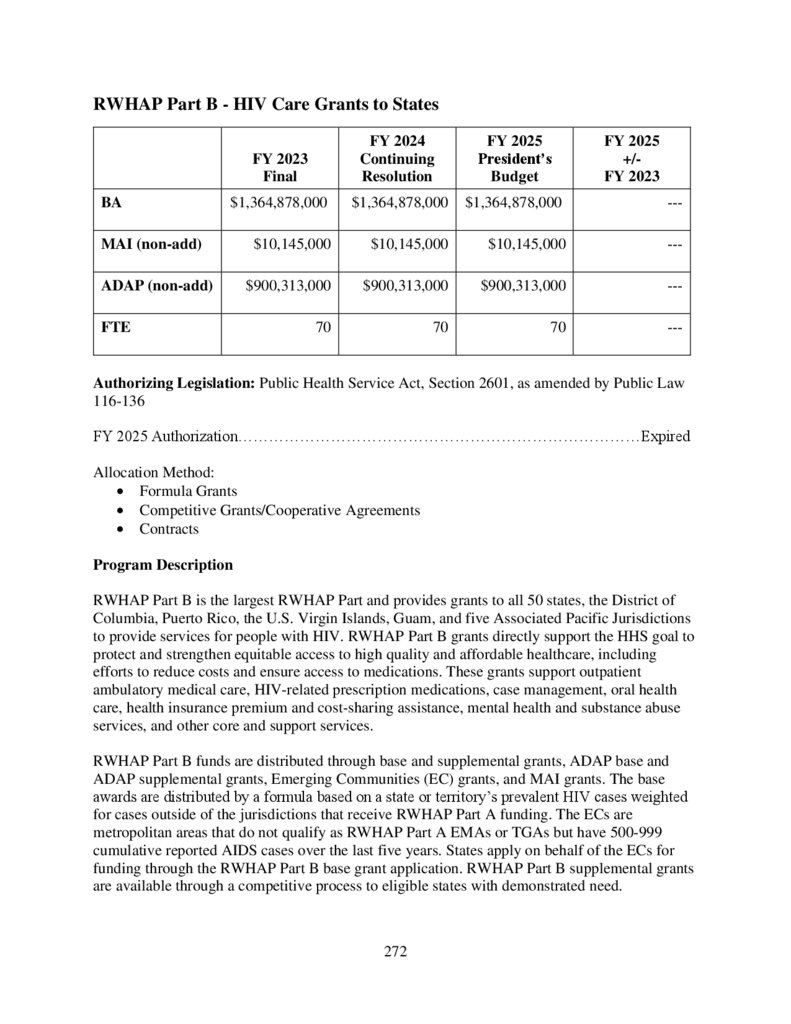
RWHAP Part B - HIV Care Grants to States .......................................................................... 272
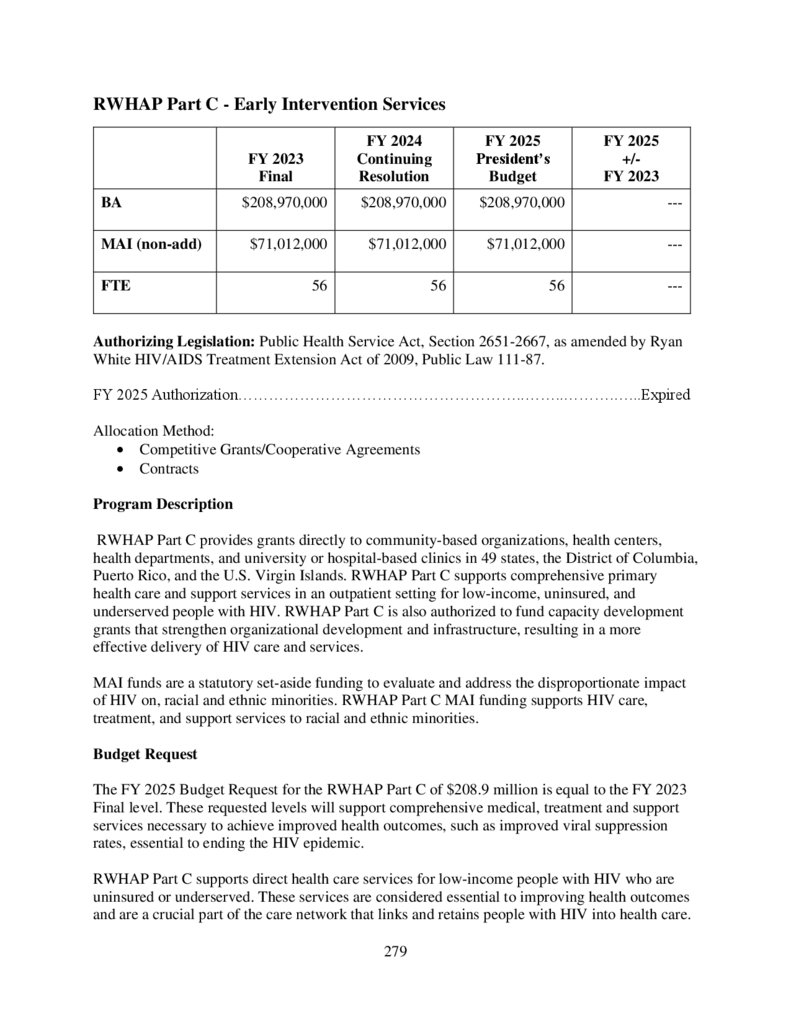
RWHAP Part C - Early Intervention Services ........................................................................ 279
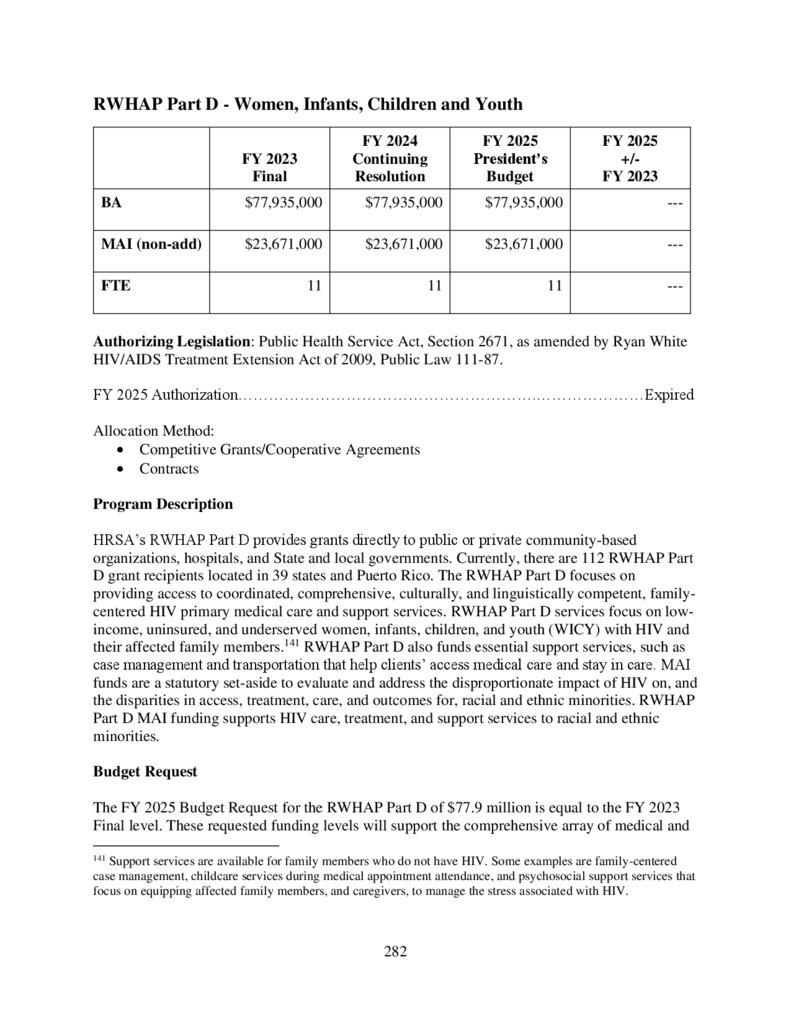
RWHAP Part D - Women, Infants, Children and Youth ........................................................ 282
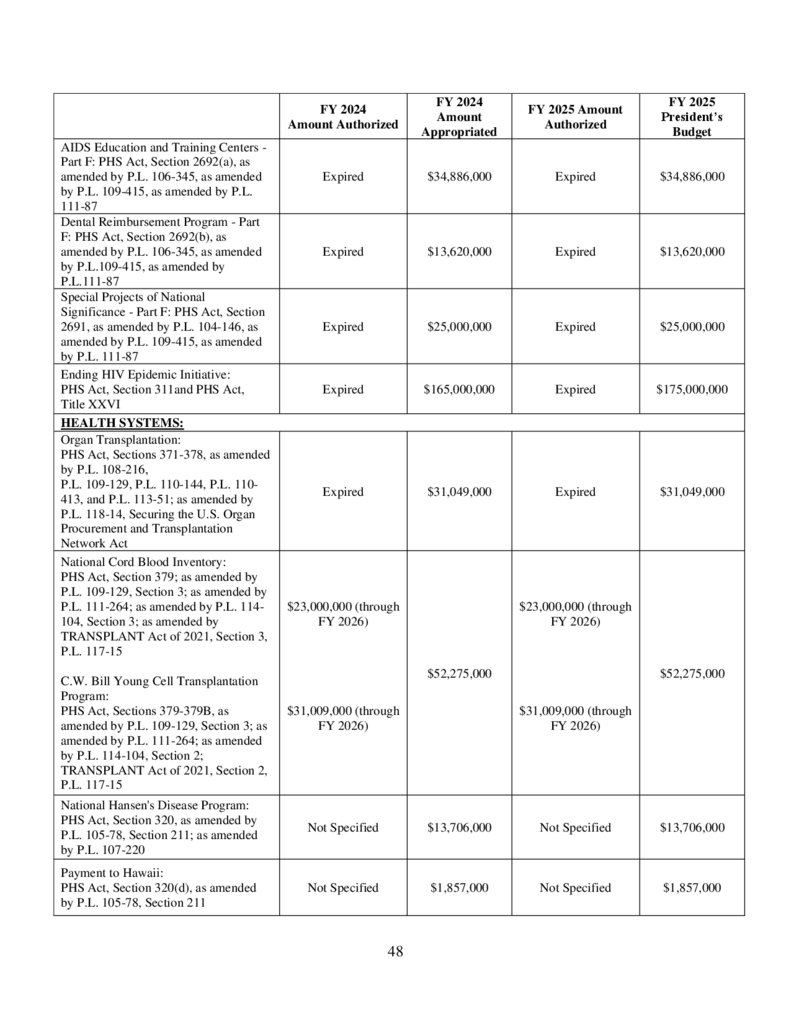
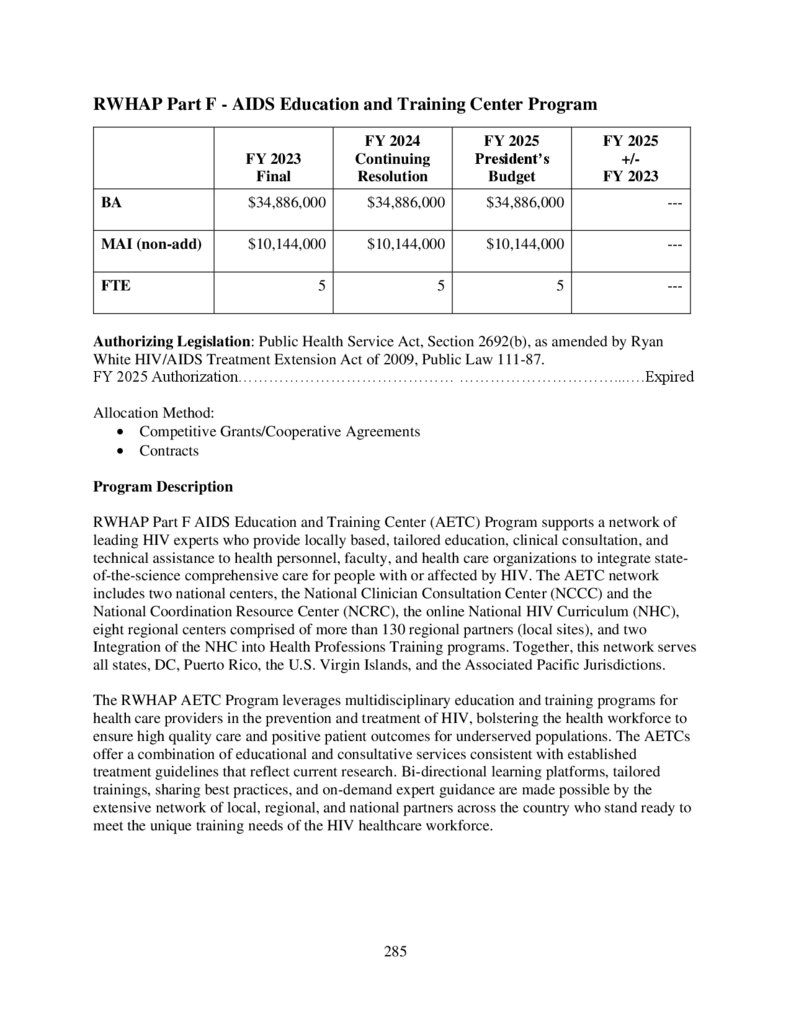
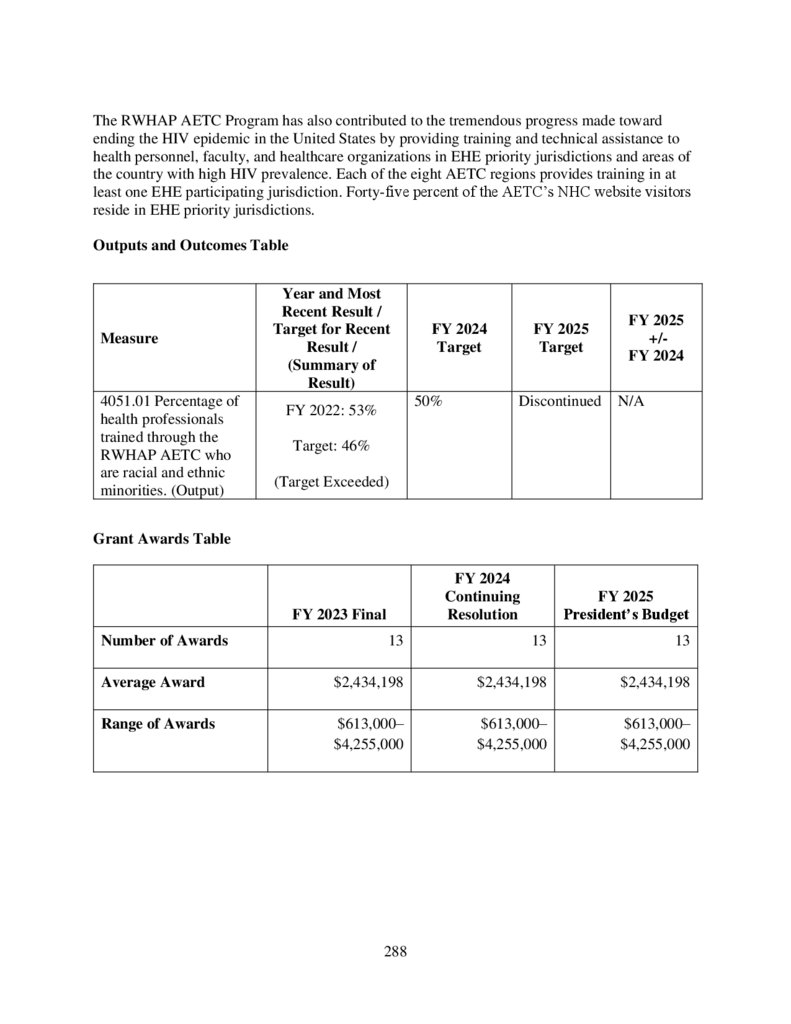
RWHAP Part F - AIDS Education and Training Center Program .......................................... 285
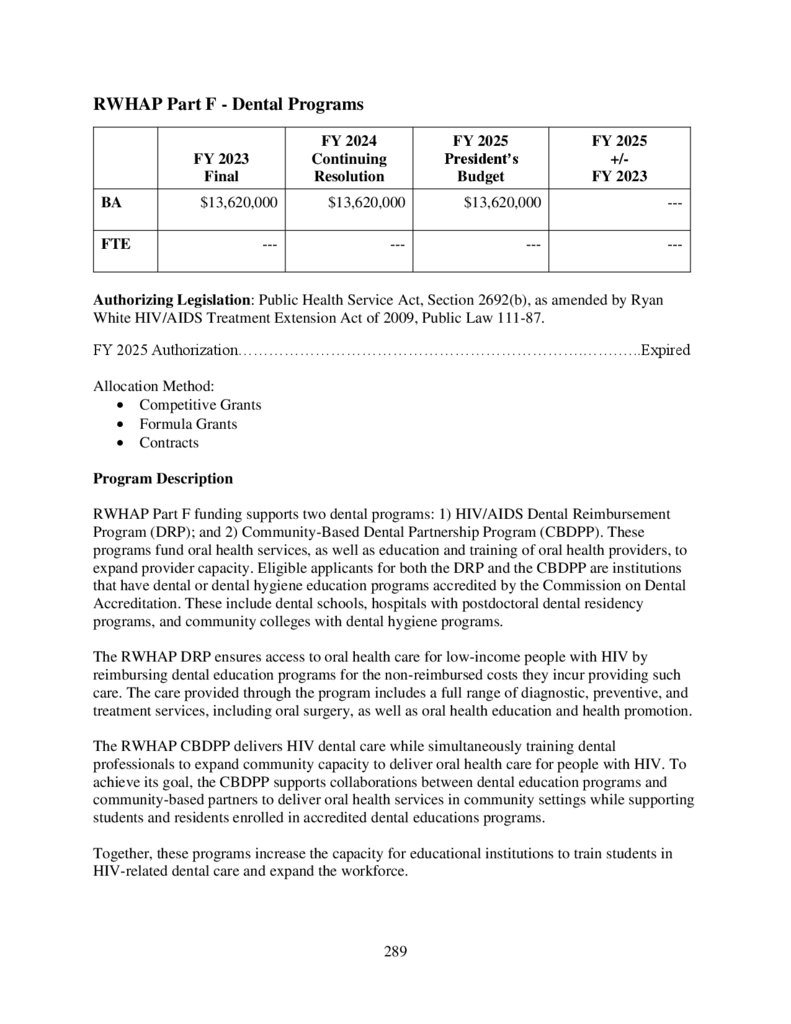
RWHAP Part F - Dental Programs ......................................................................................... 289
RWHAP Part F - Special Projects of National Significance ................................................... 292
RWHAP – Ending the HIV Epidemic Initiative (EHE) .......................................................... 296
HEALTH SYSTEMS ................................................................................................................ 305
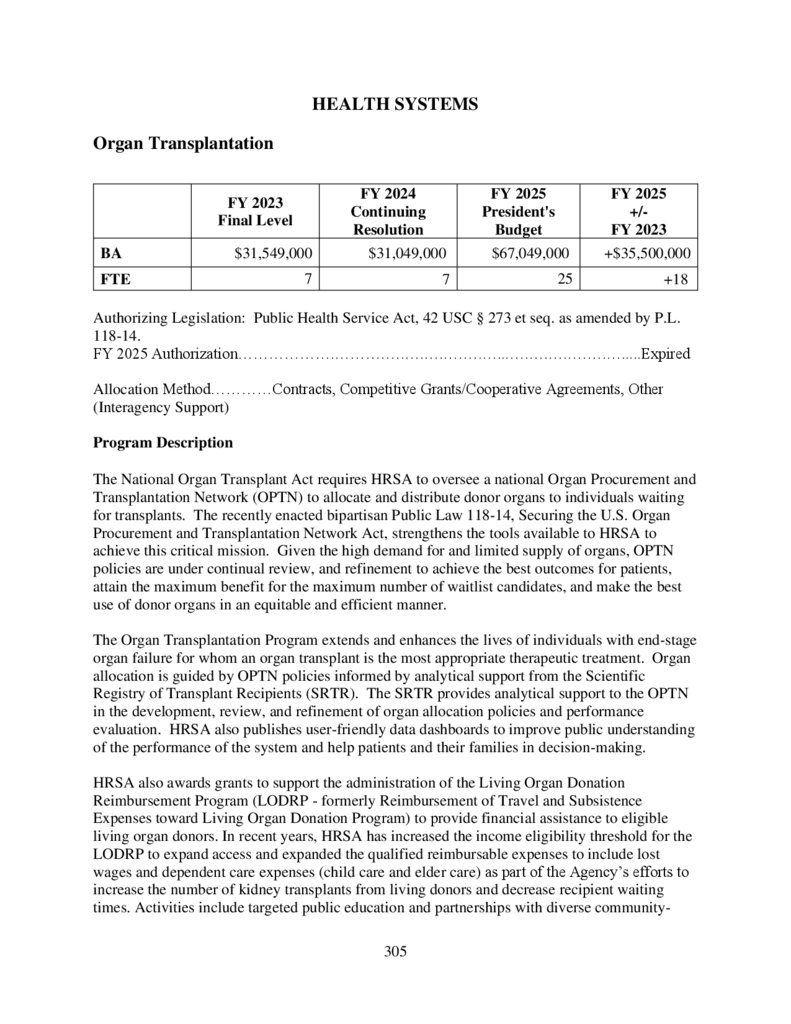
Organ Transplantation ............................................................................................................. 305
Blood Stem Cell Transplantation Program ............................................................................. 310
National Hansen’s Disease Program ....................................................................................... 316
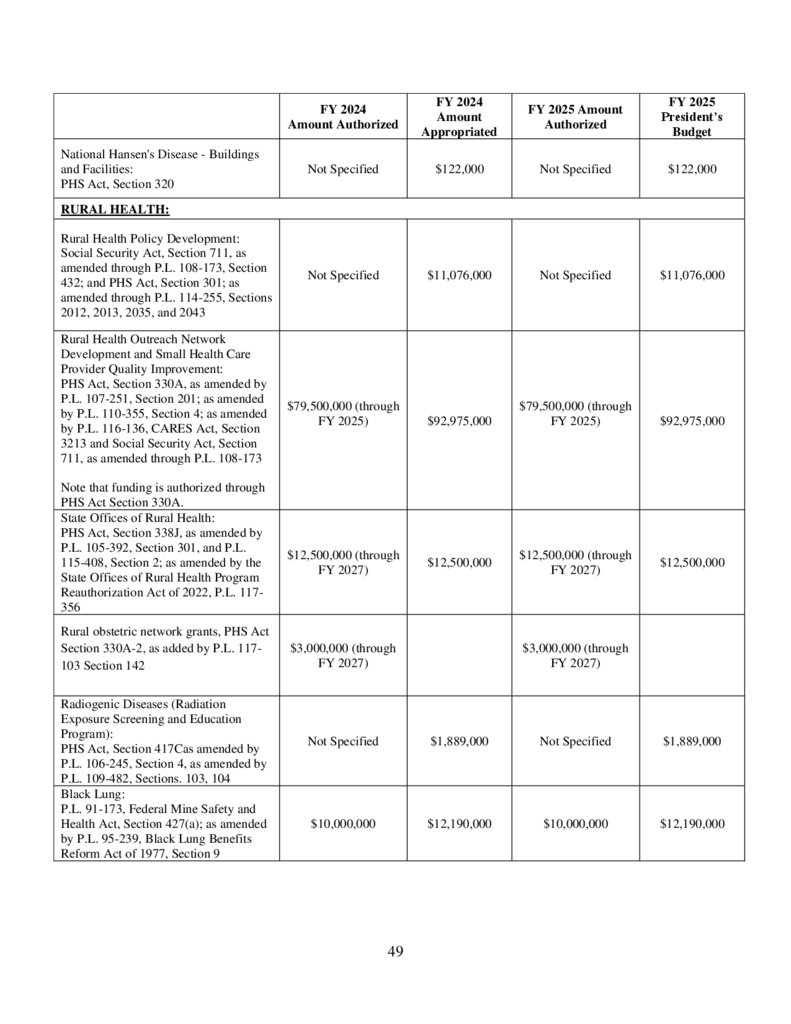
National Hansen’s Disease Program – Buildings and Facilities ............................................. 320
National Hansen’s Disease Program - Payment to Hawaii ..................................................... 321
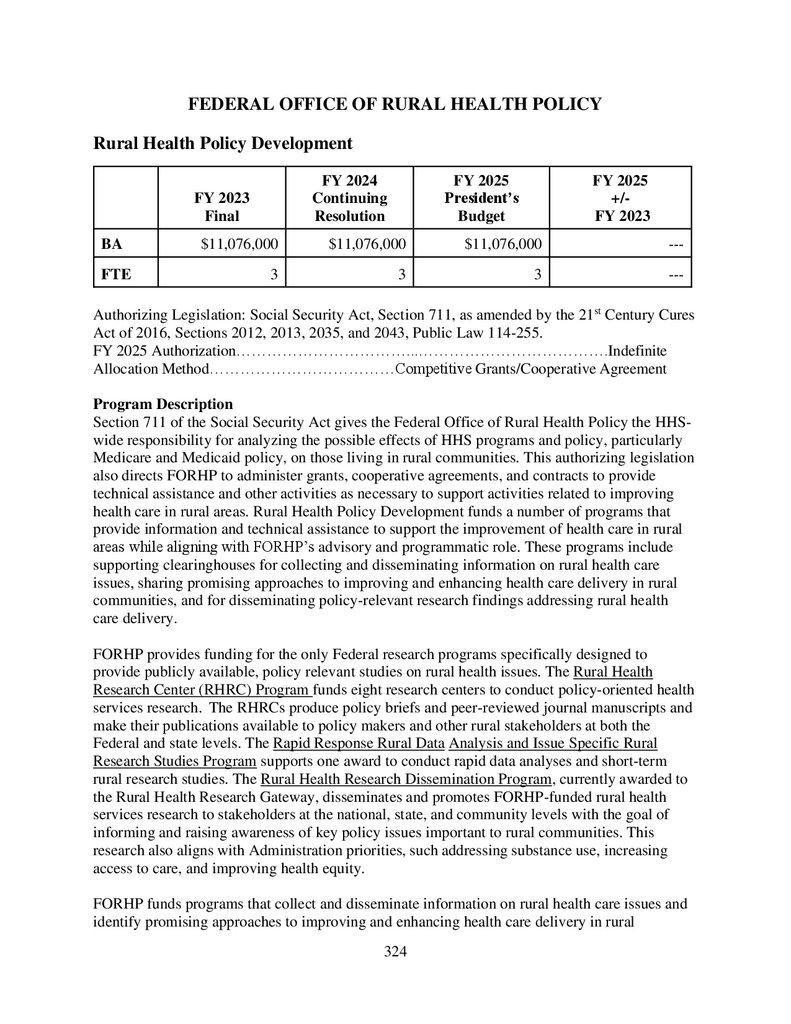
FEDERAL OFFICE OF RURAL HEALTH POLICY ......................................................... 324
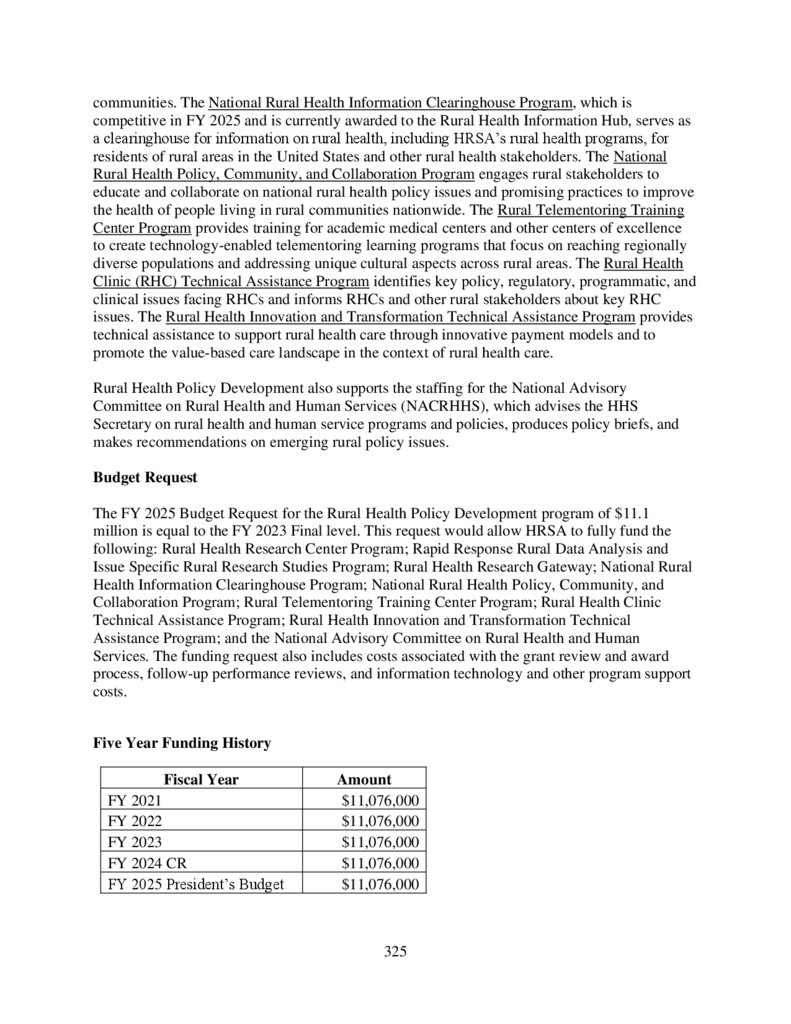
Rural Health Policy Development........................................................................................... 324
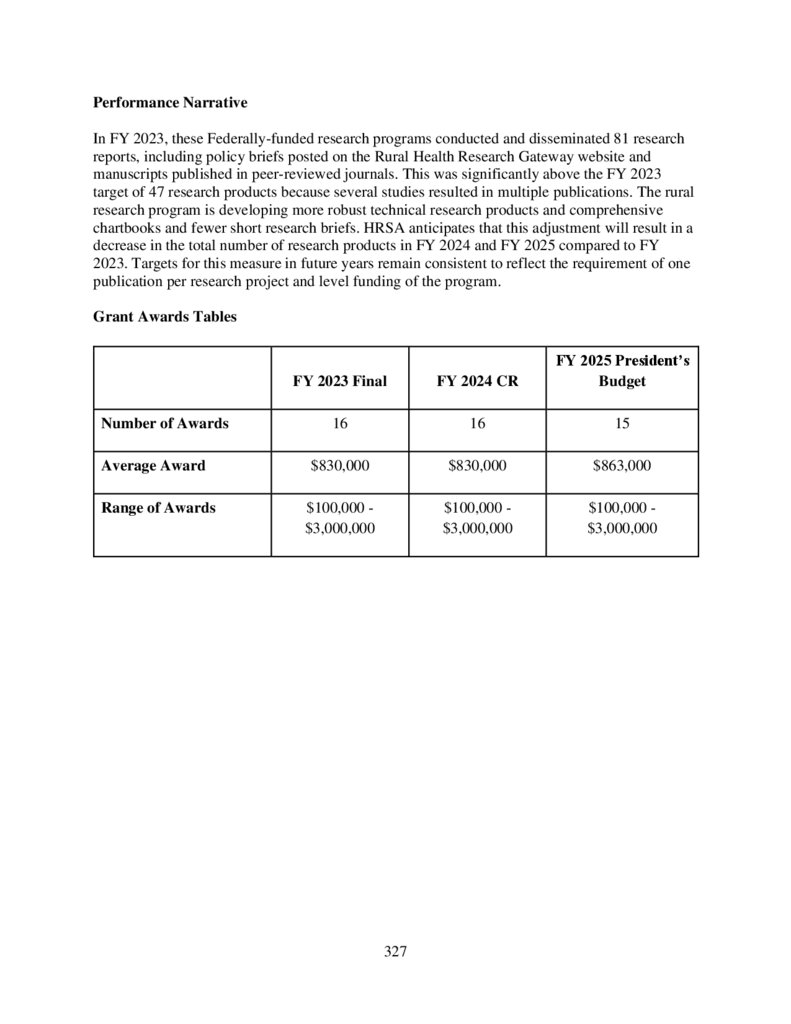
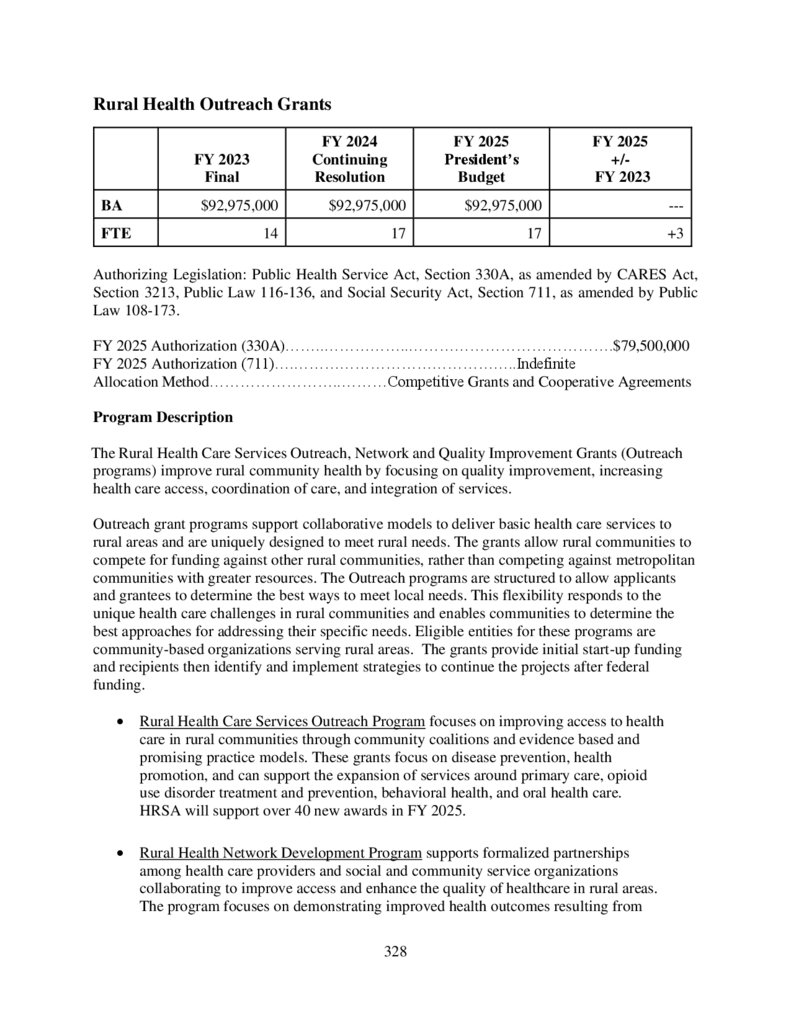
Rural Health Outreach Grants ................................................................................................. 328
Rural Hospital Flexibility Grants ............................................................................................ 334
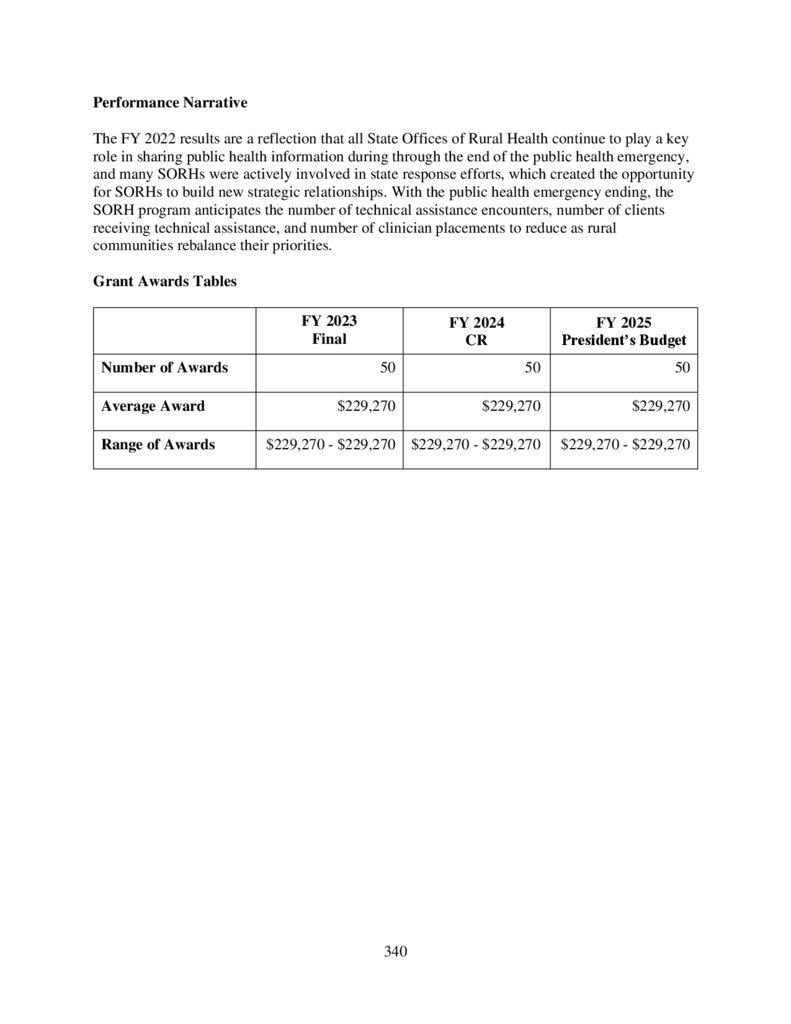
State Offices of Rural Health .................................................................................................. 338
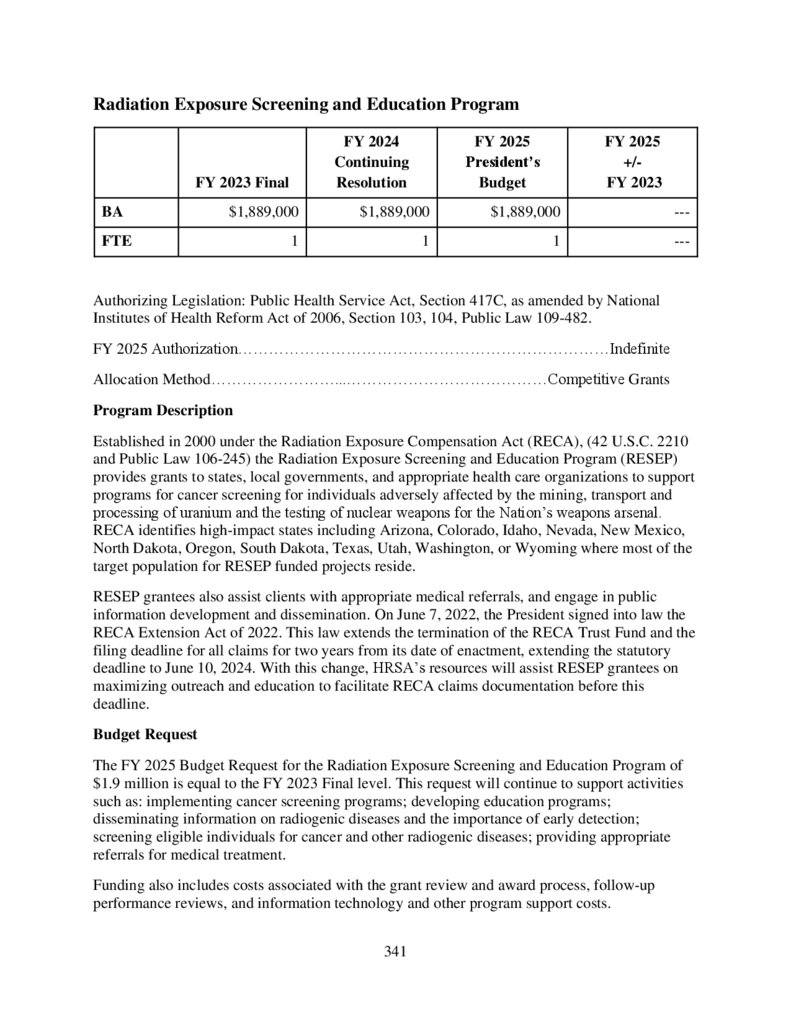
Radiation Exposure Screening and Education Program ......................................................... 341
Black Lung .............................................................................................................................. 344
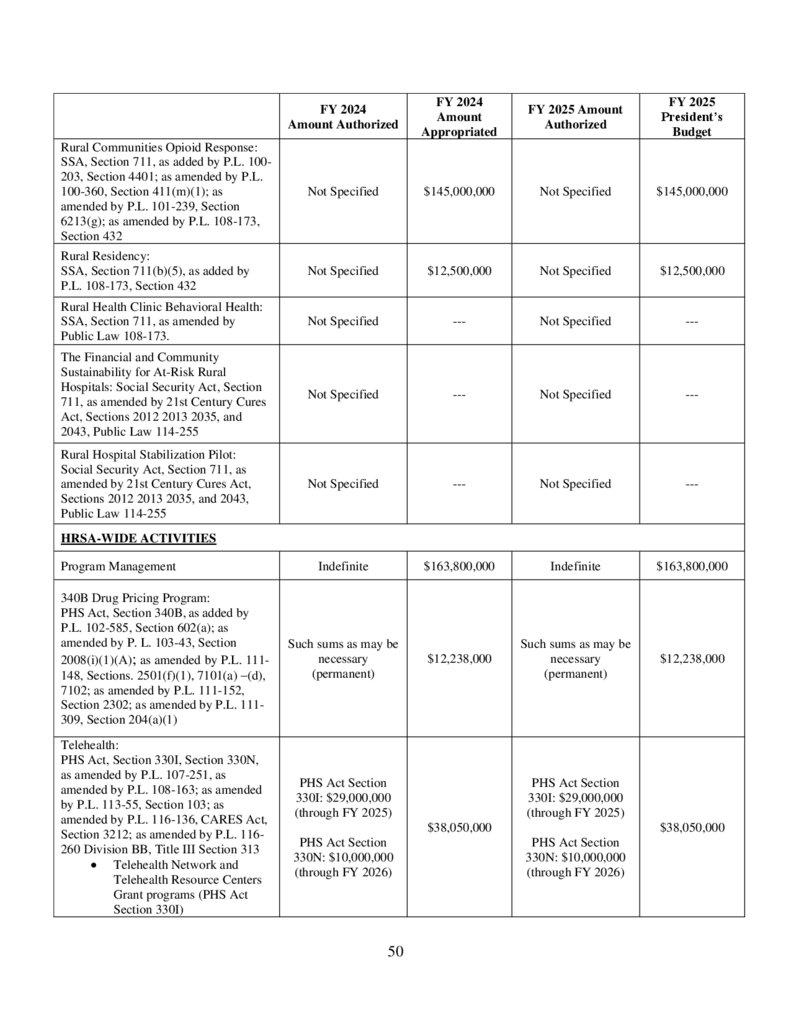
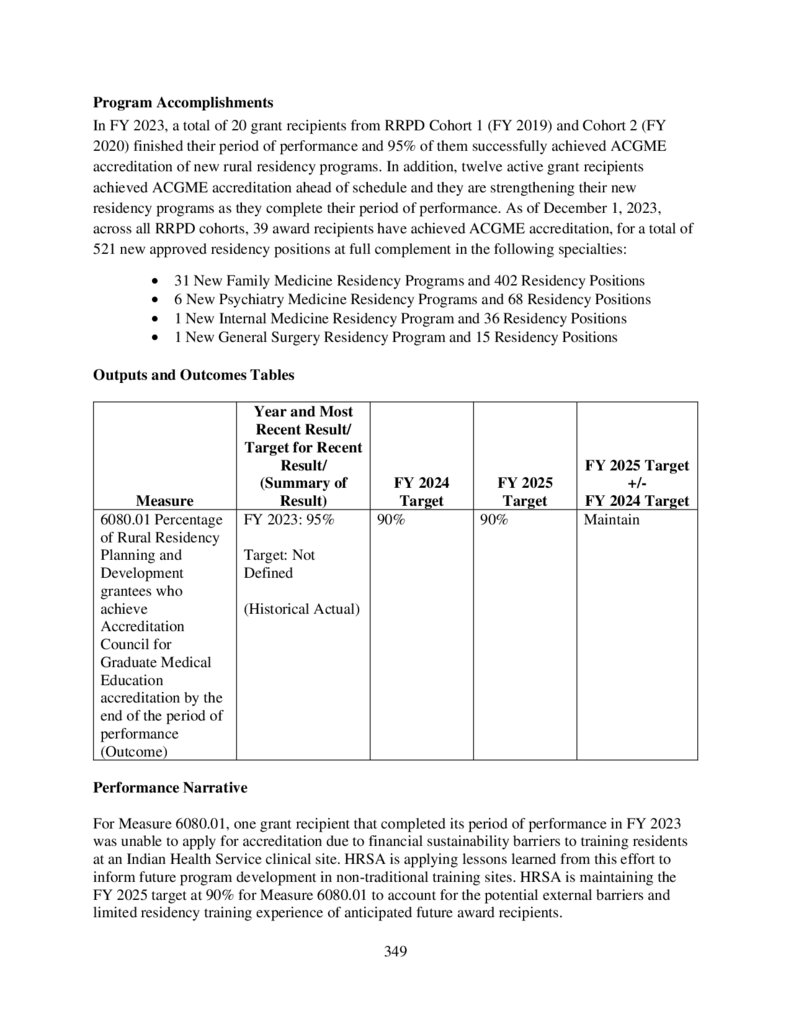
Rural Residency Planning and Development .......................................................................... 347
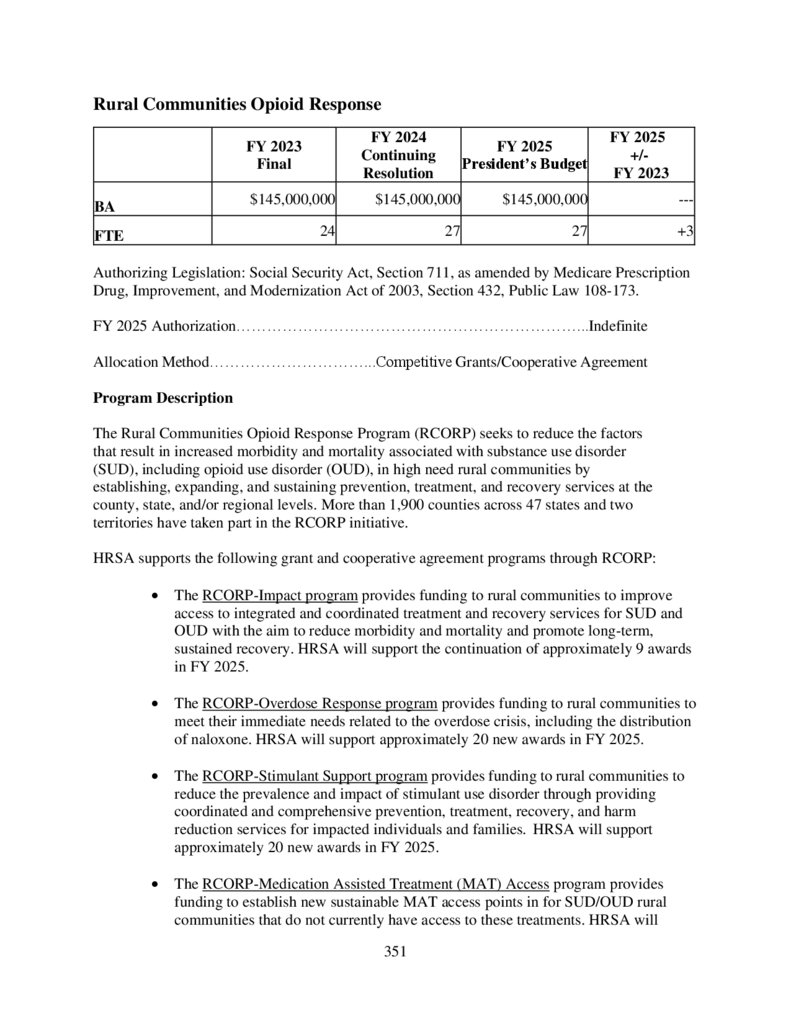
Rural Communities Opioid Response ..................................................................................... 351
HRSA-WIDE ACTIVITIES AND PROGRAM SUPPORT ................................................. 357
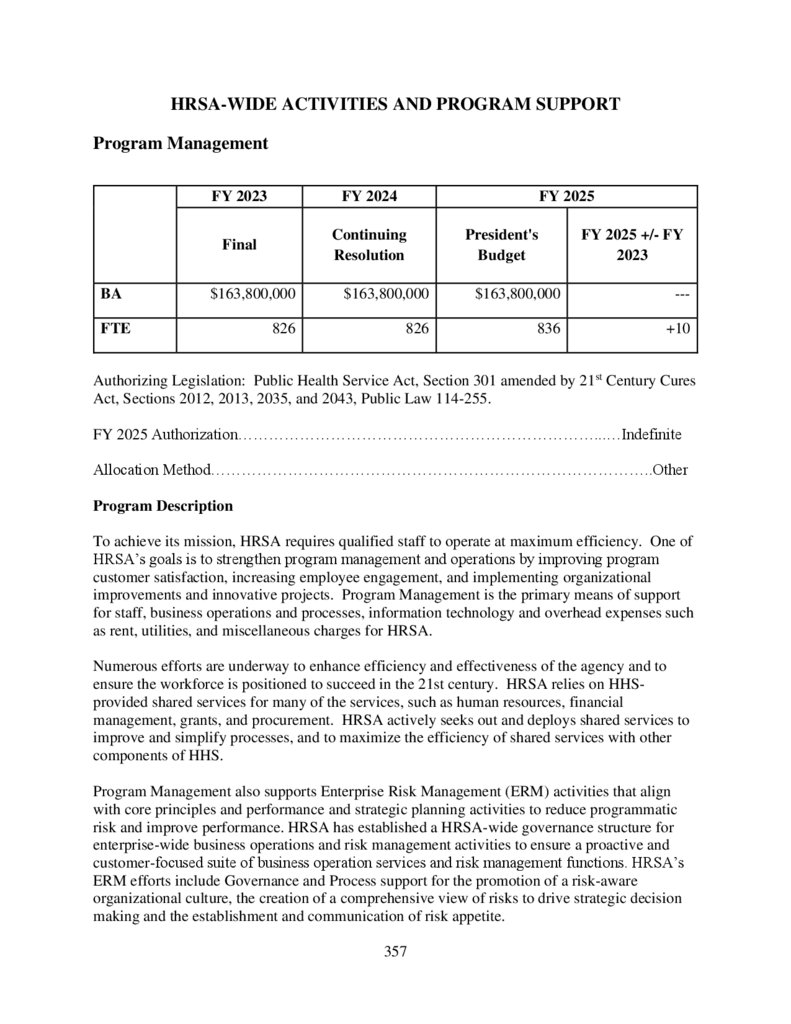
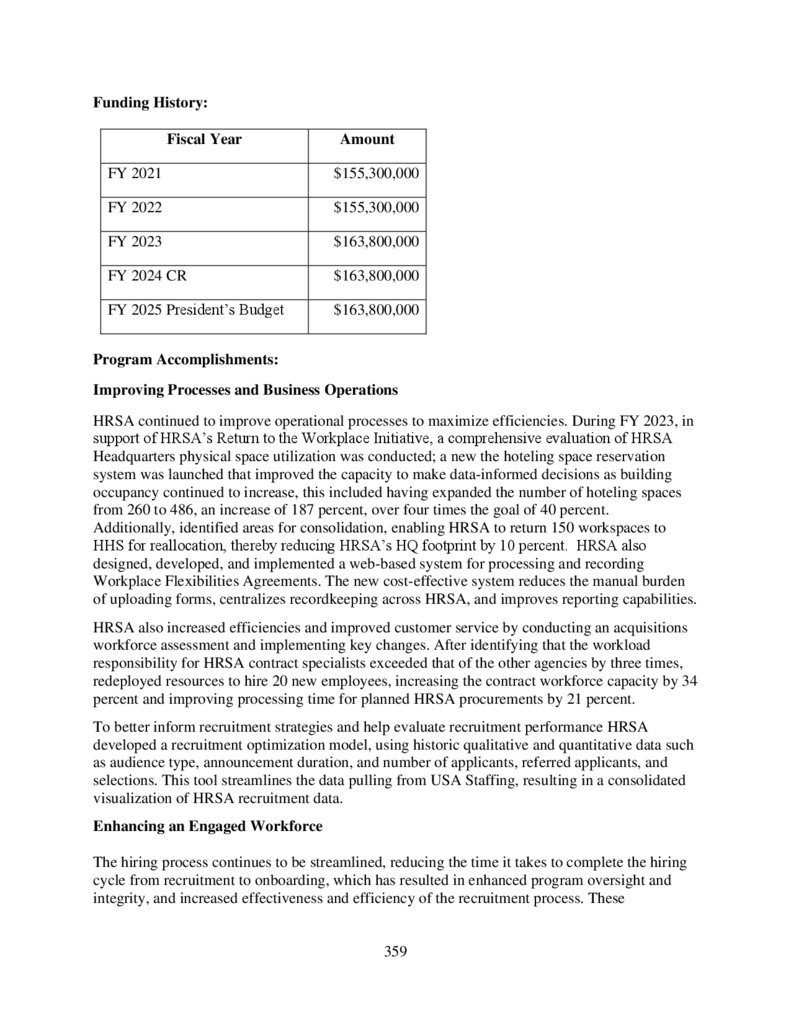
Program Management ............................................................................................................. 357
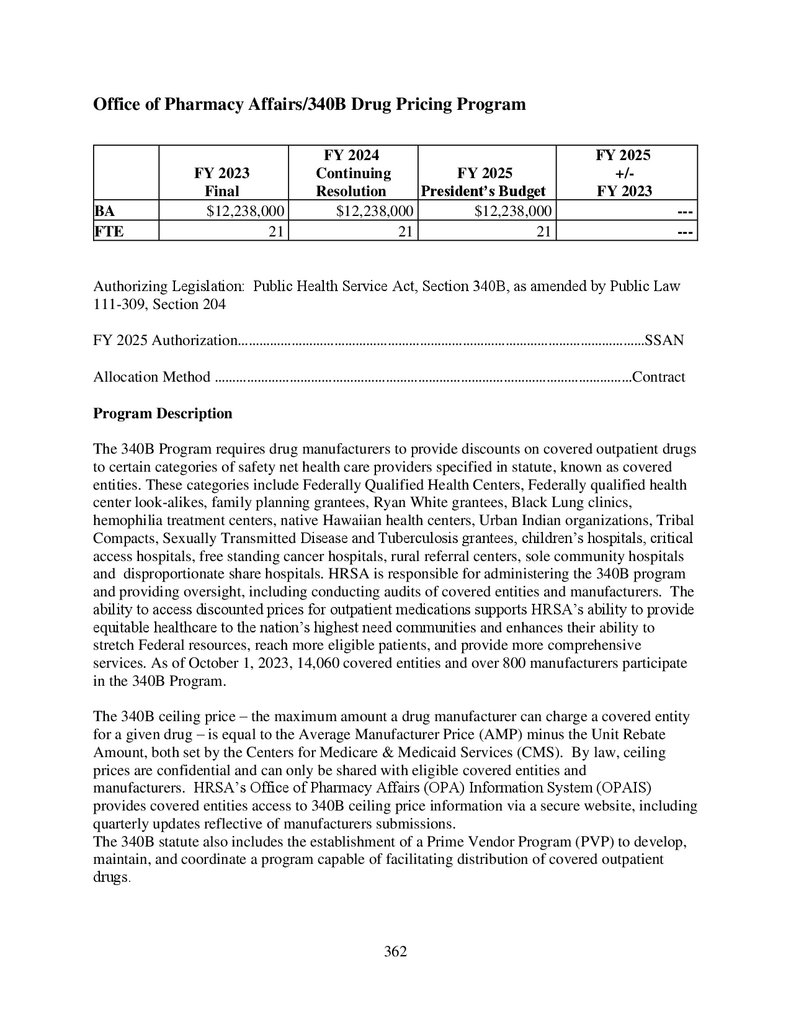
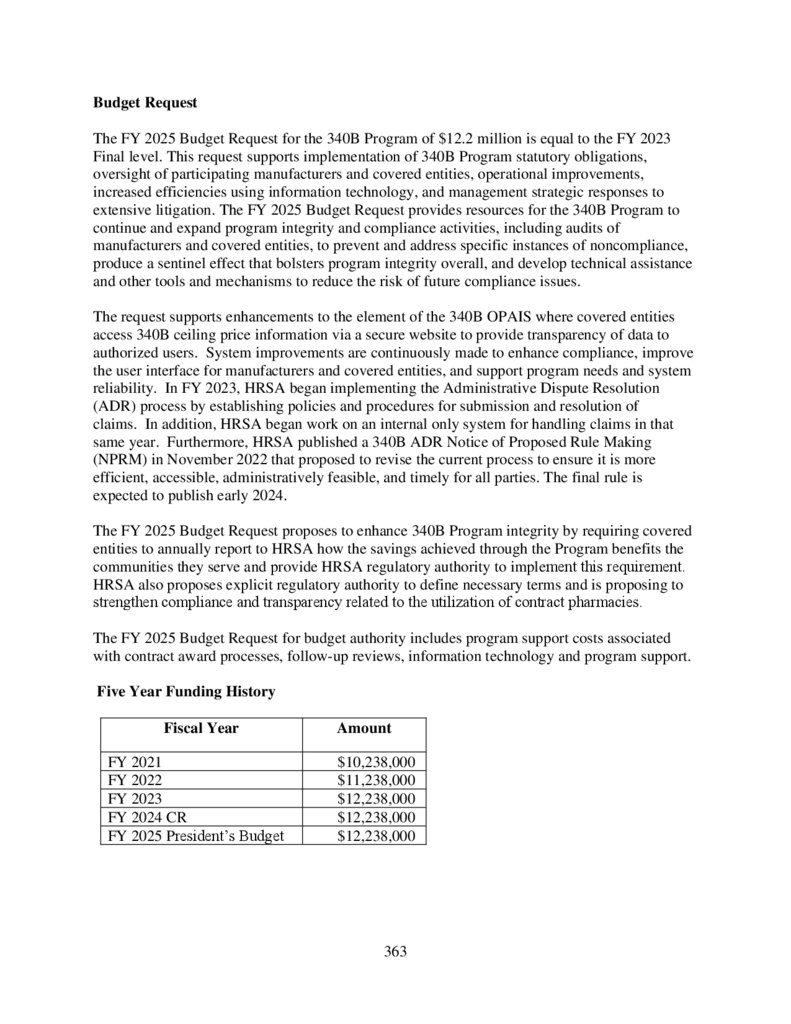
Office of Pharmacy Affairs/340B Drug Pricing Program ....................................................... 362
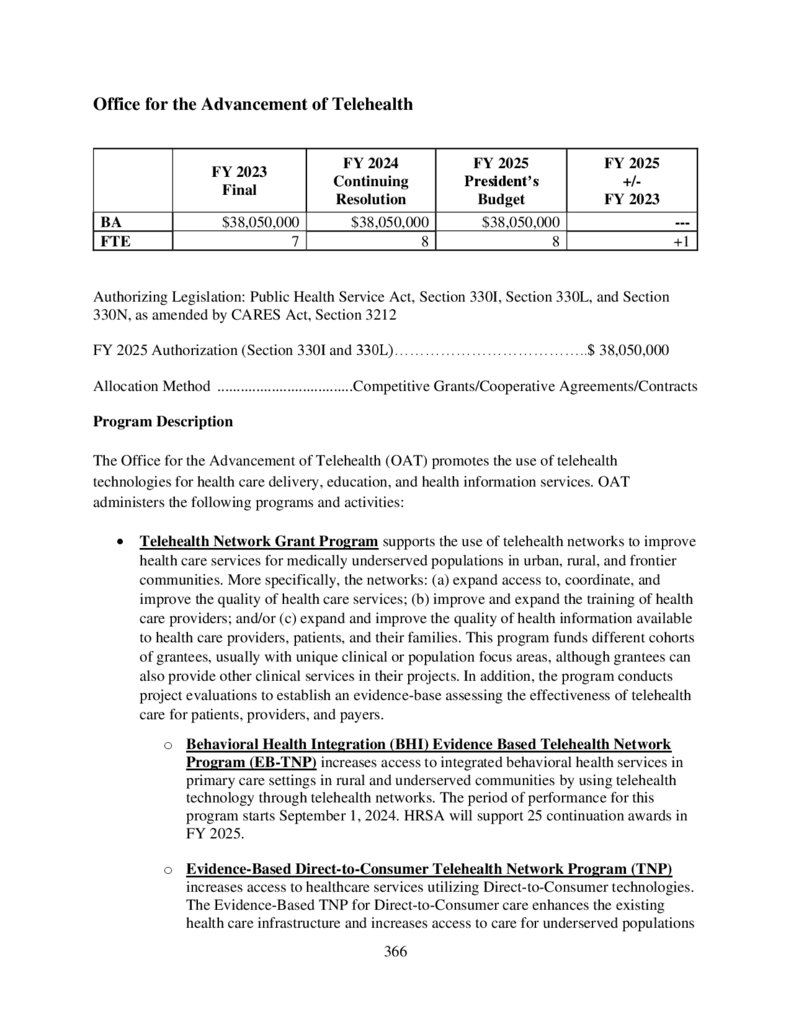
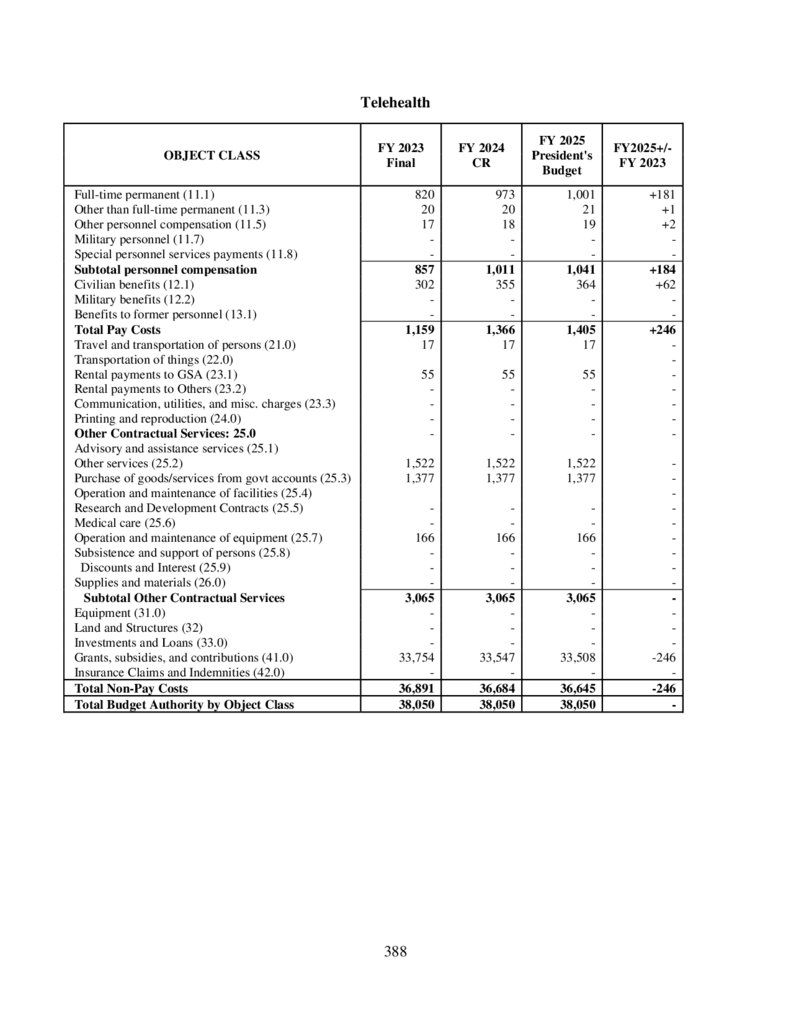
Office for the Advancement of Telehealth .............................................................................. 366
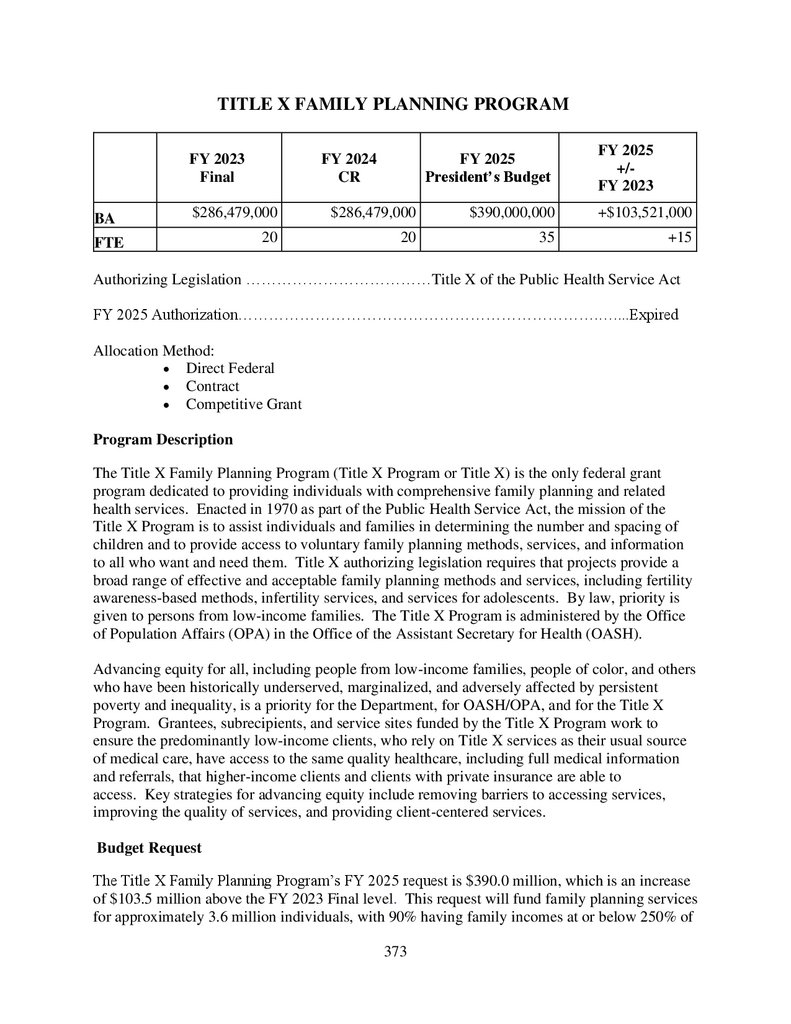
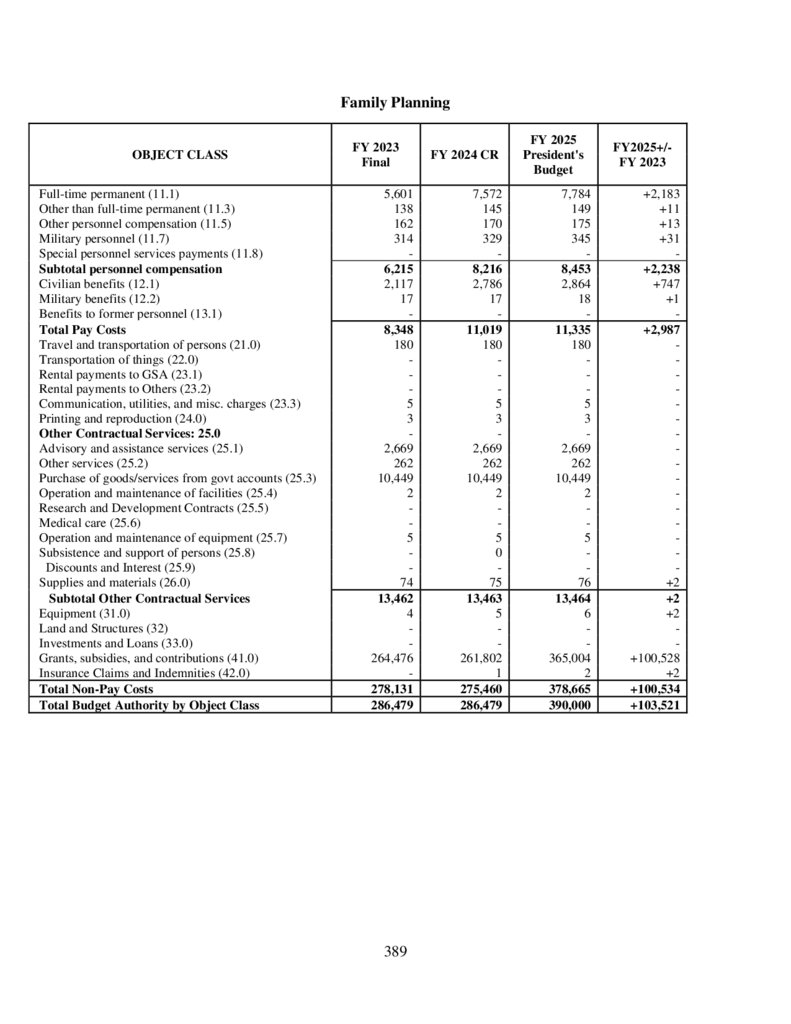
TITLE X FAMILY PLANNING PROGRAM ....................................................................... 373
SUPPLEMENTARY TABLES ................................................................................................ 378
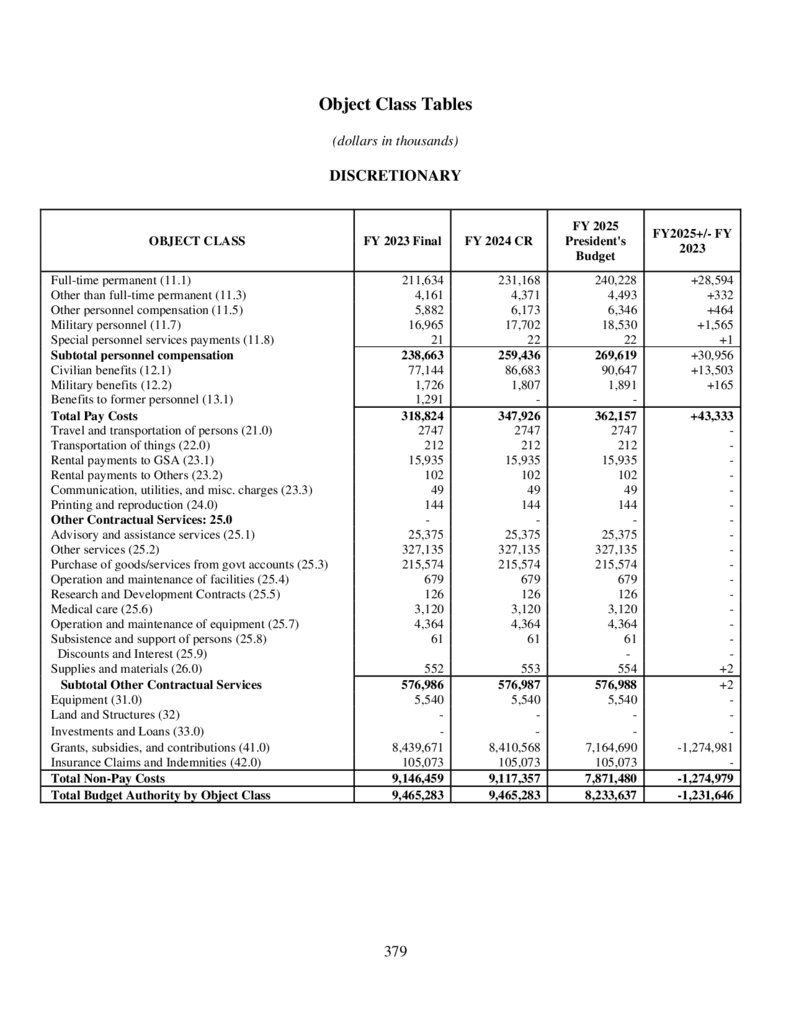
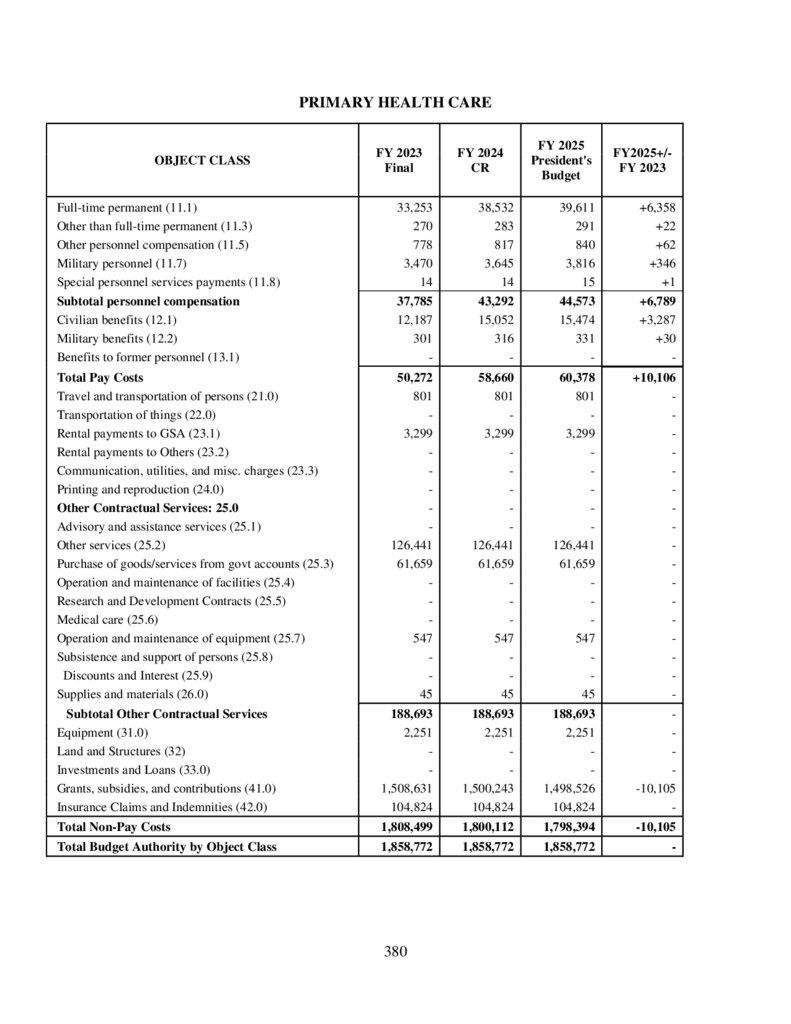
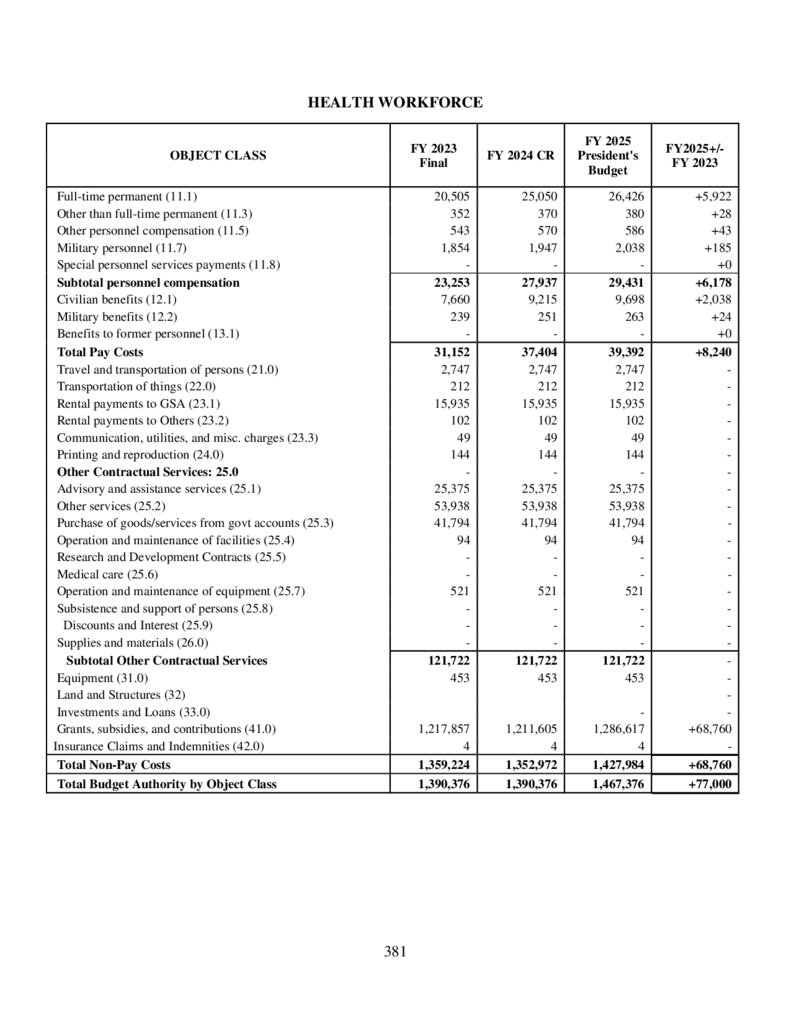
Object Class Tables..................................................................................................................... 379
7
8.
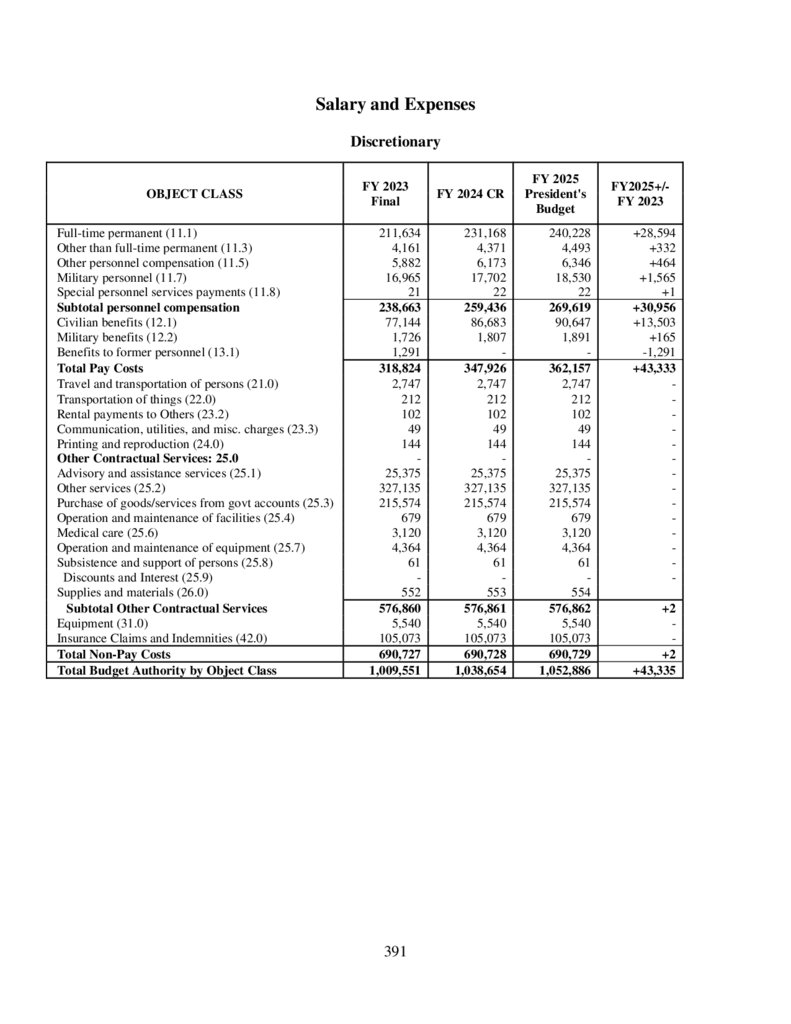
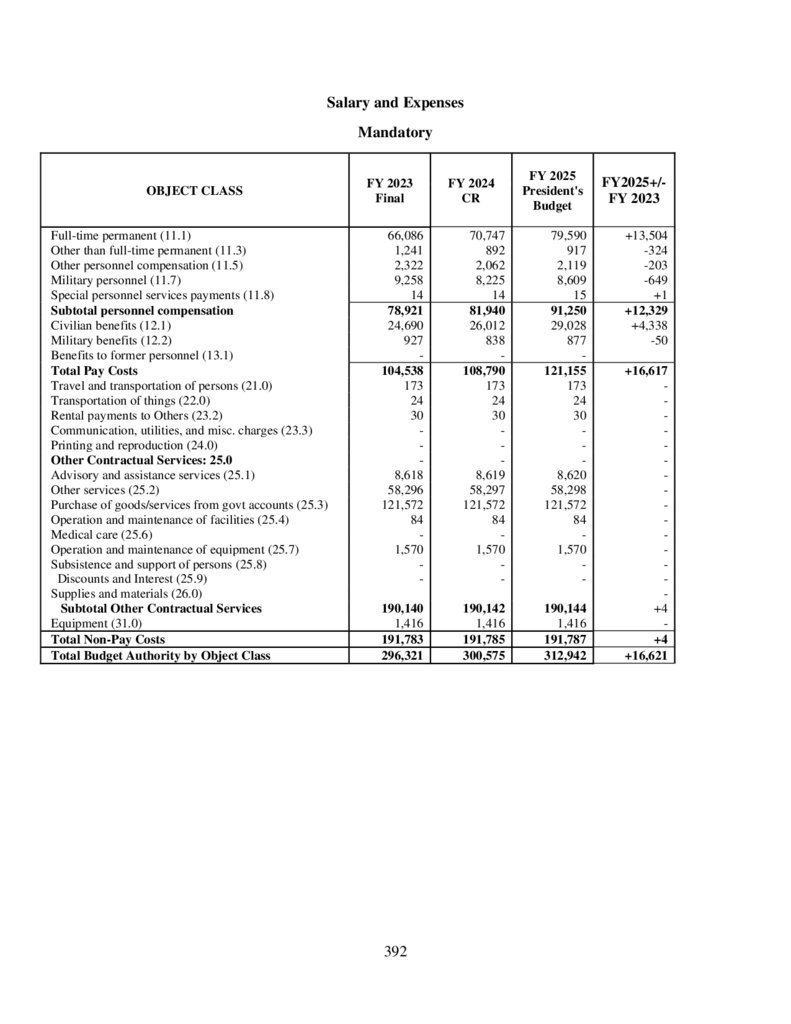
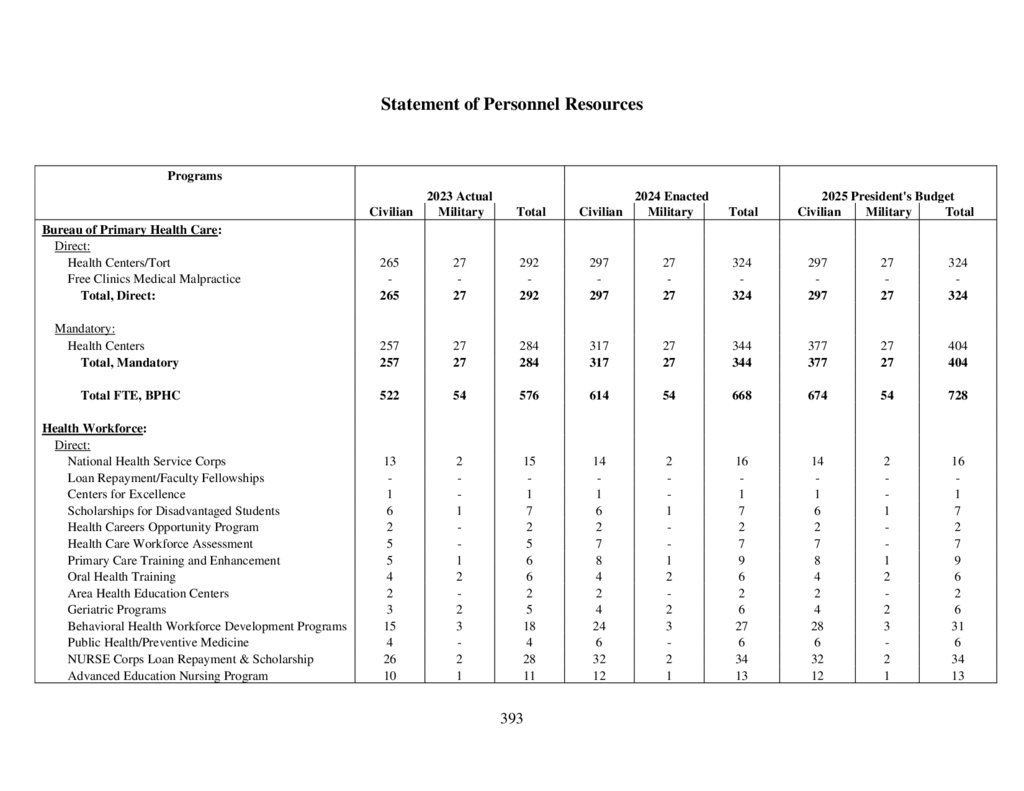
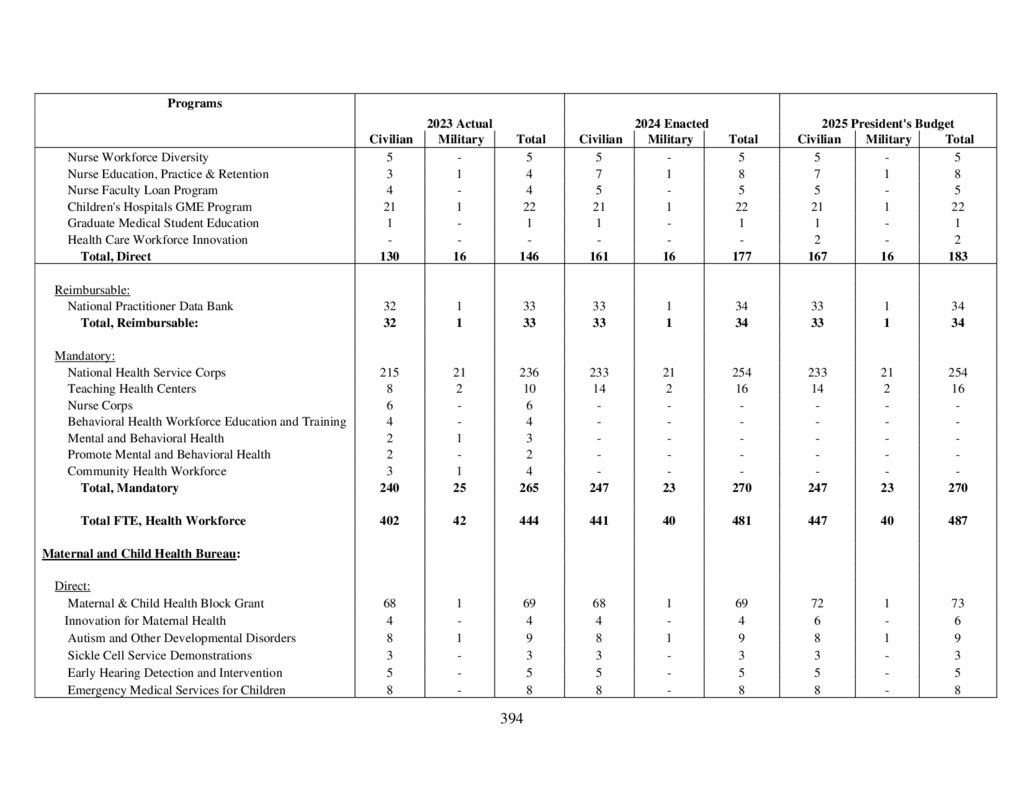
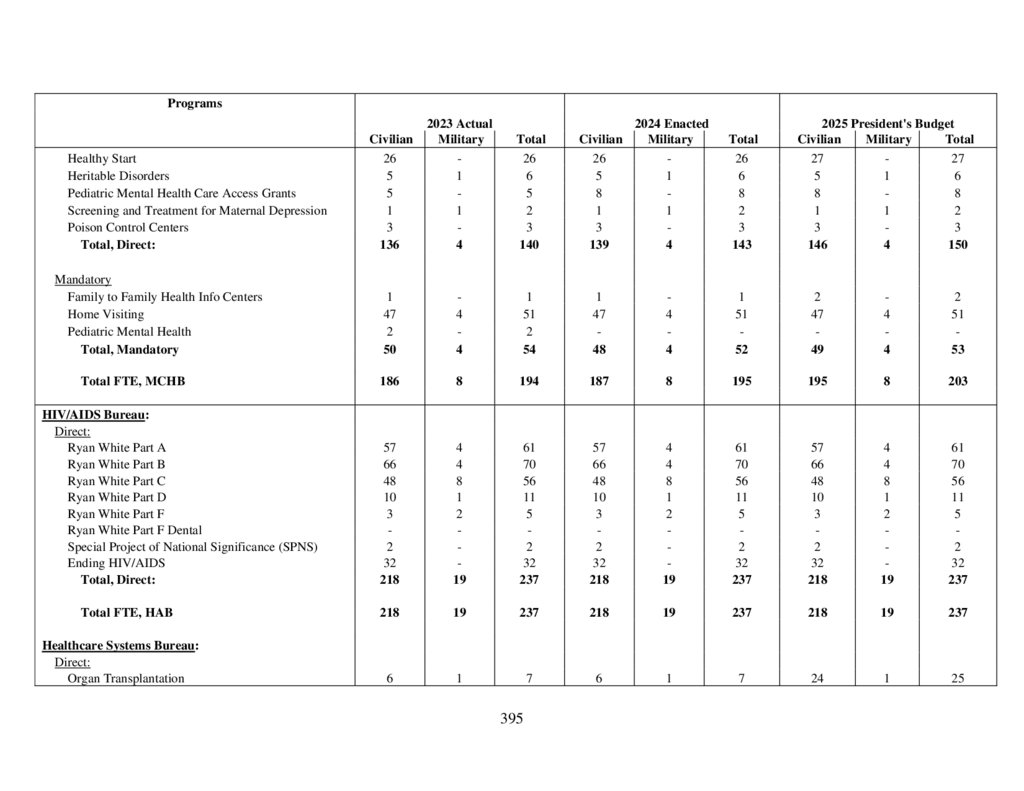
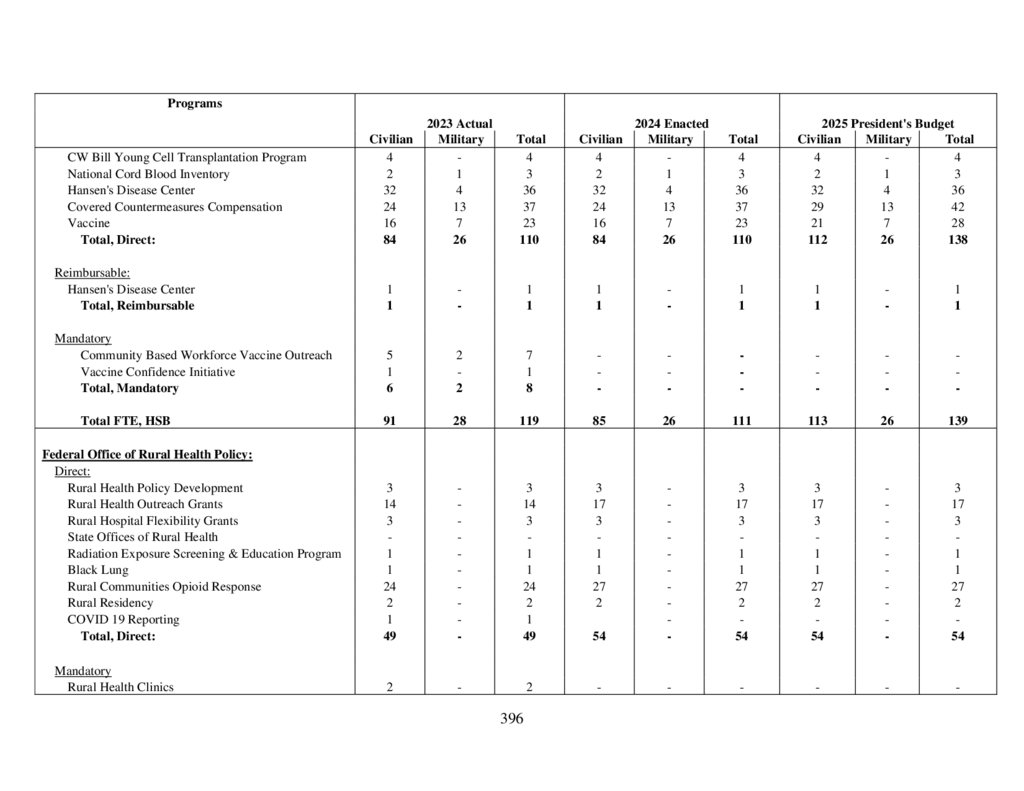
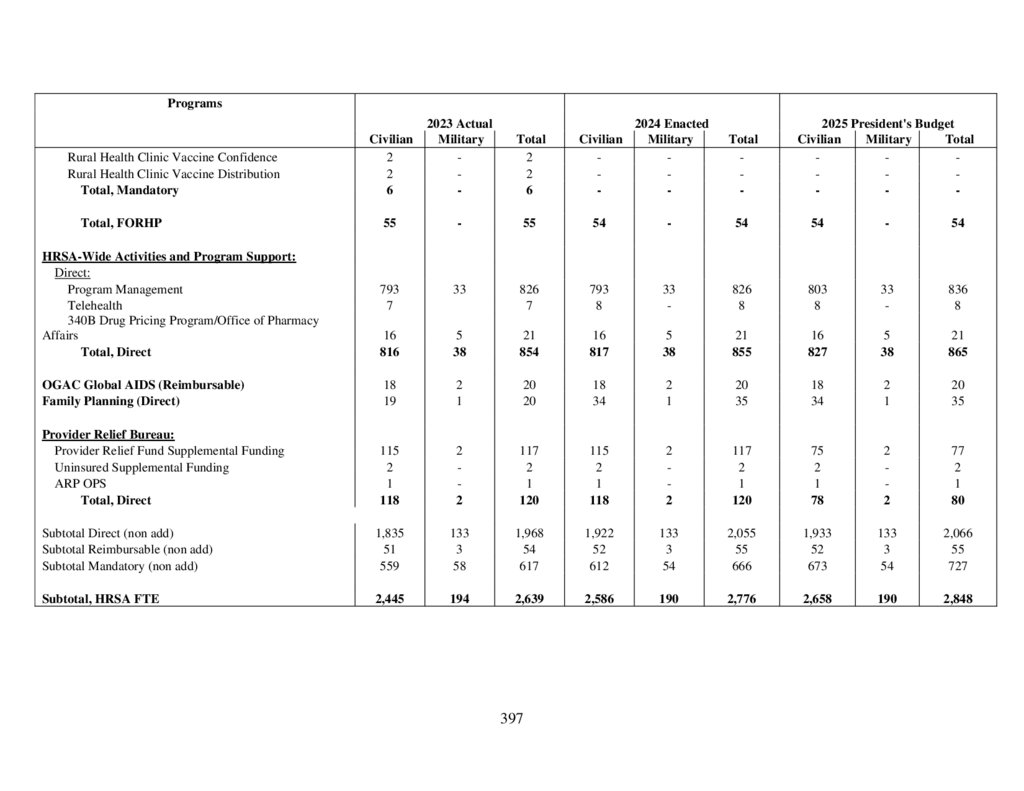
Salary and Expenses ................................................................................................................... 391Statement of Personnel Resources .............................................................................................. 393
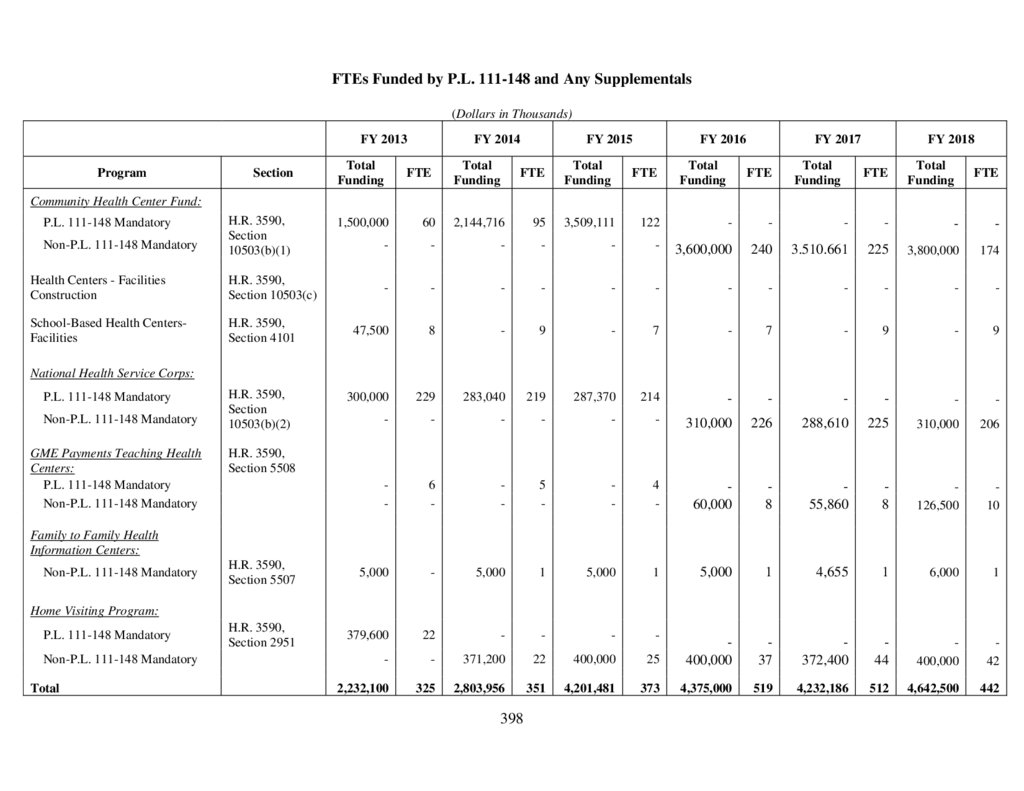
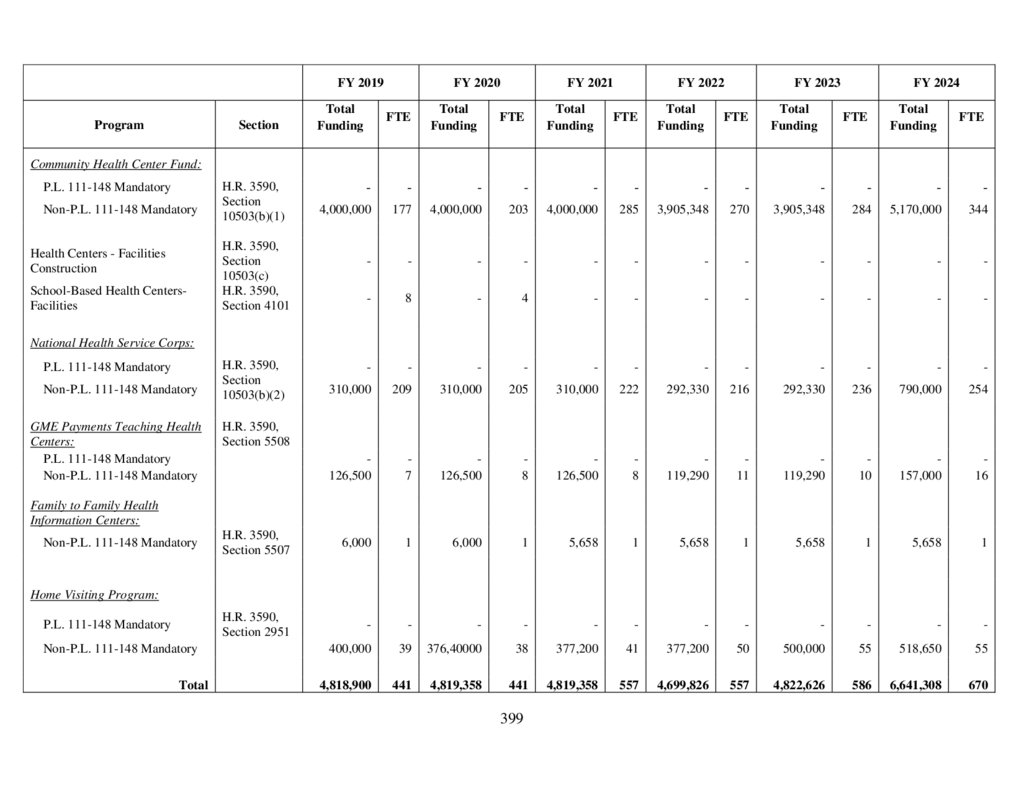
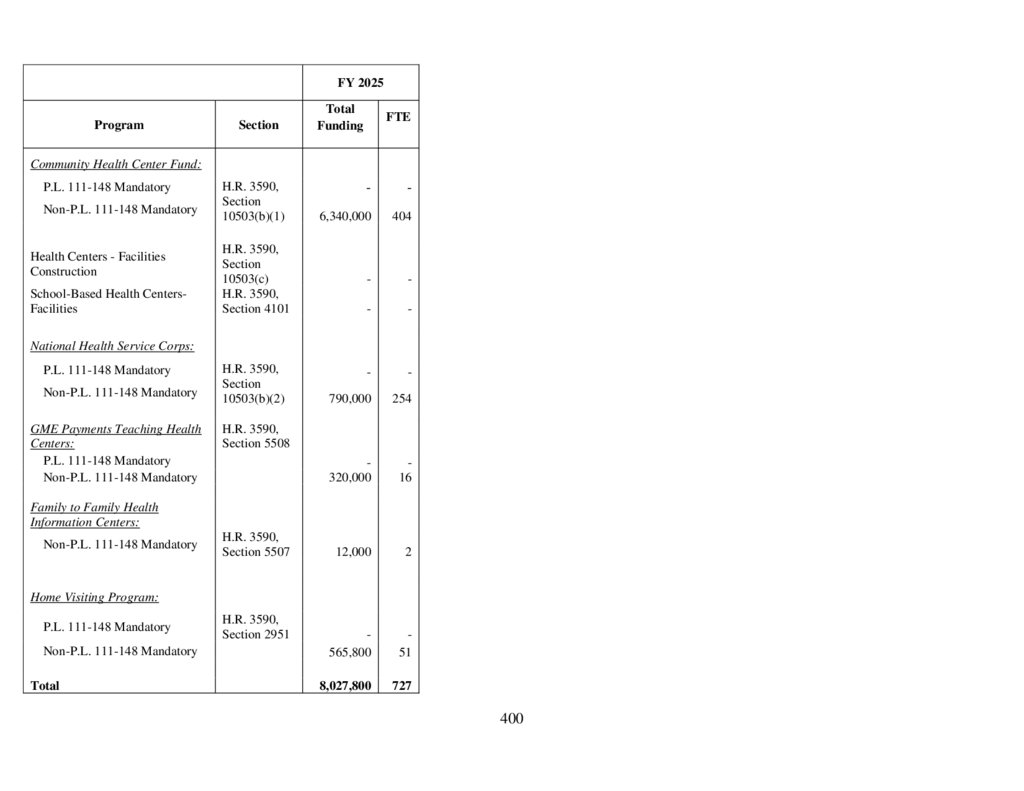
FTEs Funded by P.L. 111-148 and Any Supplementals ............................................................. 398
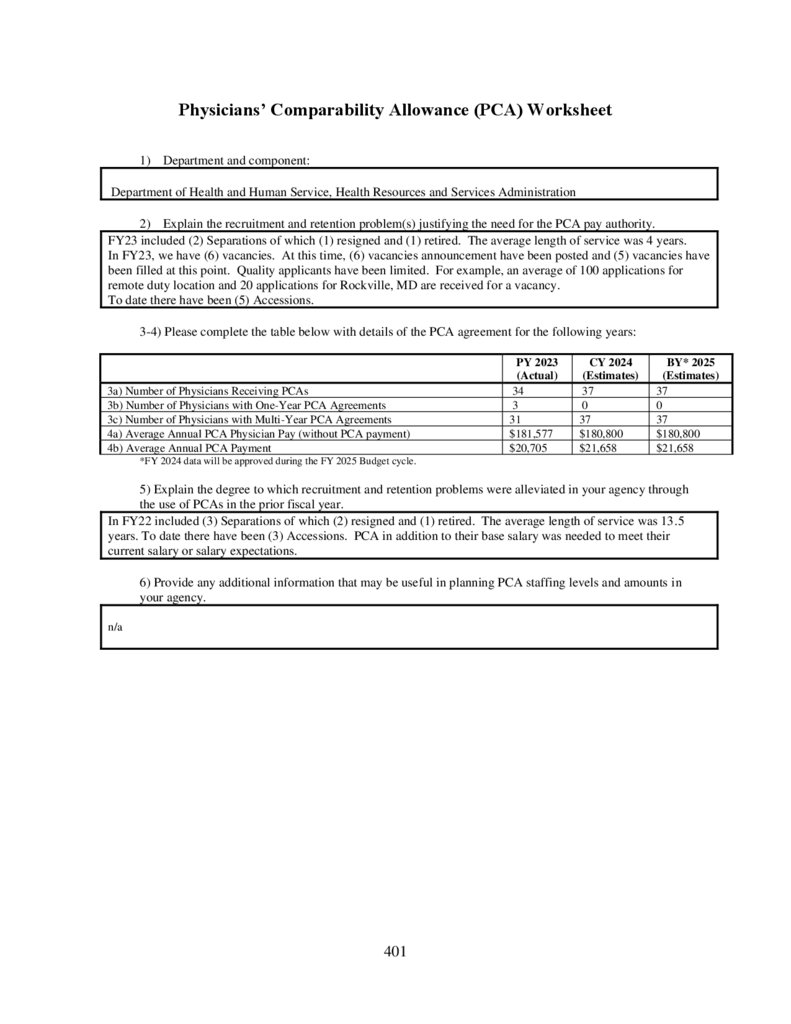
Physicians’ Comparability Allowance (PCA) Worksheet .......................................................... 401
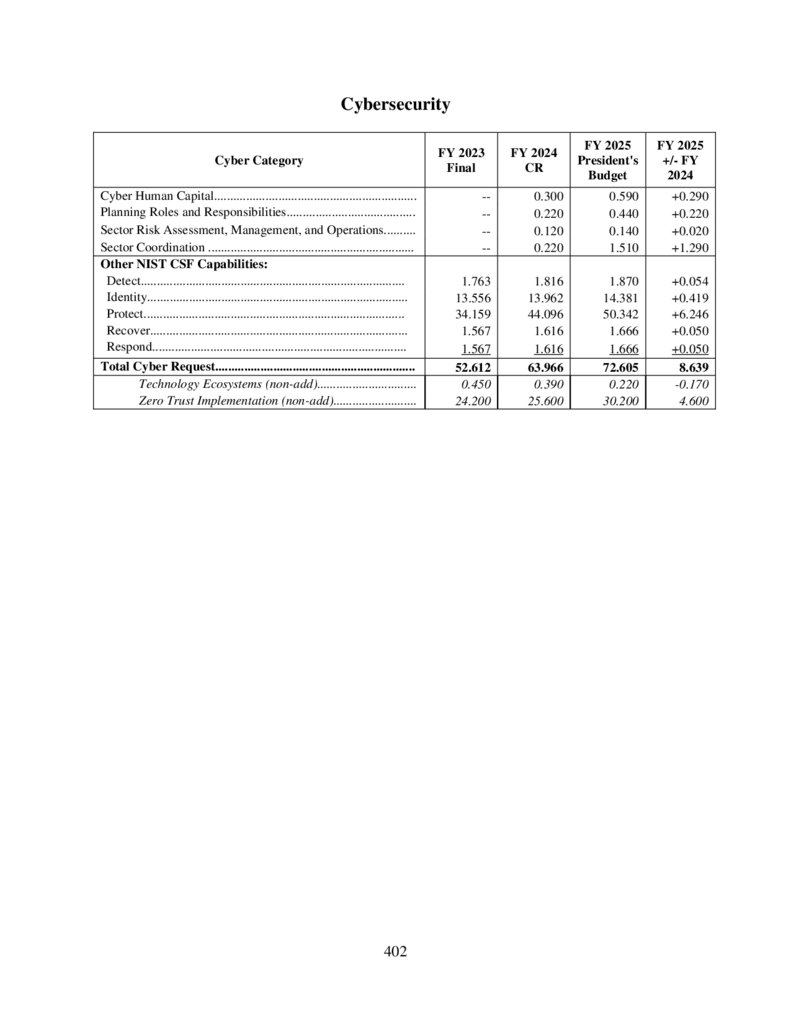
Cybersecurity .............................................................................................................................. 402
Drug Control Budget................................................................................................................... 403
LEGISLATIVE PROPOSALS ................................................................................................ 411
VACCINE INJURY COMPENSATION PROGRAM ......................................................... 416
COUNTERMEASURES INJURY COMPENSATION PROGRAM .................................. 430
NONRECURRING EXPENSES FUND ................................................................................. 437
8
9.
EXECUTIVESUMMARY
9
10.
Introduction and MissionThe Health Resources and Services Administration (HRSA) is an Operating Division within the
U.S. Department of Health and Human Services. The Department’s mission is, in part, to
enhance the health and well-being of Americans by providing effective health and human
services. In alignment with this mission, HRSA provides equitable health care to the nation’s
highest-need communities—serving people who are geographically isolated and economically or
medically vulnerable. HRSA programs support people with low incomes, people with HIV,
pregnant people, children, parents, rural communities, transplant patients, and the health
workforce.
HRSA supports programs and services that improve health equity. HRSA serves:
• More than 30.5 million people in rural and underserved communities;1
• More than 60 million pregnant women, infants, and children;2
• More than 560,000 people with HIV;3
• More than 1,900 rural counties and municipalities across the country;4 and
• More than 18,500 clinicians that received loan services from the National Health
Service Corps and Nurse Corps.5
1
FY 2022 UDS data, as noted in the Primary Care Tab, performance measure 1010.01.
FY 2022 MCH data, as noted in Maternal and Child Health Tab, Maternal and Child Health Block Grant, Program
Description section.
3
FY 2022 data, as noted in Ryan White HIV/AIDS Tab, measure number 4000.04.
4
Between FY 2018 and FY 2022, as noted in Federal Office of Rural Health Policy Tab, Rural Communities Opioid
Response, Program Description section.
5
Health Resources and Services Administration. 2023, October 1. Bureau of Health Workforce Clinician
Dashboards. https://data.hrsa.gov/topics/health-workforce/clinician-dashboard, accessed January 17, 2024. This
number includes clinicians who reported that they work in the communities that they were deployed to or who report
working in health provider shortage areas.
2
10
11.
Overview of BudgetThe FY 2025 President’s Budget request is $16.3 billion for the Health Resources and Services
Administration (HRSA). This level is $2 billion, or 13.8 percent, above the FY 2023 Final level.
The FY 2025 Budget focuses on the critical Biden-Harris Administration priorities of reducing
maternal mortality and improving maternal health outcomes; growing the health workforce,
including nursing, primary care, and behavioral health workforces; and expanding access to care
to meet mental health and substance use disorder needs in underserved and rural communities.
The FY 2025 Budget Request of $16.3 billion includes $8 billion in mandatory funding. The
Budget prioritizes improving maternal health outcomes, provides investments in the next
generation of the health workforce, provides funding to recruit and retain nurses, expands
funding to support mental health services for children and youth, and provides additional family
planning resources.
The Budget extends and increases mandatory funding for the Health Center Program, National
Health Service Corps, and the Teaching Health Center Graduate Medical Education programs
through FY 2026, consistent with the extension included in the previous budget and currently
under consideration in Congress. Additionally, the Budget proposes to extend and increase
mandatory funding for the Family-to-Family Health Information Centers Program.
Highlights of the major changes to programs are listed below:
Health Centers and Free Clinics: +$2.4 billion; total program $8.2 billion
The Budget includes $1.9 billion in discretionary resources and $6.3 billion in mandatory
funding, which is $1.2 billion above the FY 2024 proposed mandatory level for a total increase
of $2.4 billion above FY 2023. The Budget provides resources for Health Centers to serve
approximately 37.4 million patients in FY 2025.
The Budget includes the second annual installment of the President’s plan to create a pathway to
double the program’s funding. The first installment proposed in FY 2024 supports extended
hours, new health centers and health center sites and increased behavioral health services at
health centers. The second installment in FY 2025 targets expanding services across health
centers, including high quality, patient-centered maternal health services, patient support and
enabling services like transportation and case managers, and supporting health centers in better
serving people experiencing homelessness. It also invests in recruitment, retention, and growth
of the health center workforce.
In addition, the Budget retains the FY 2024 President’s Budget proposal adding mental health
and substance use disorder services under Section 330 of the Public Health Service Act.
Health Workforce: +$775.4 million; total program $2.6 billion
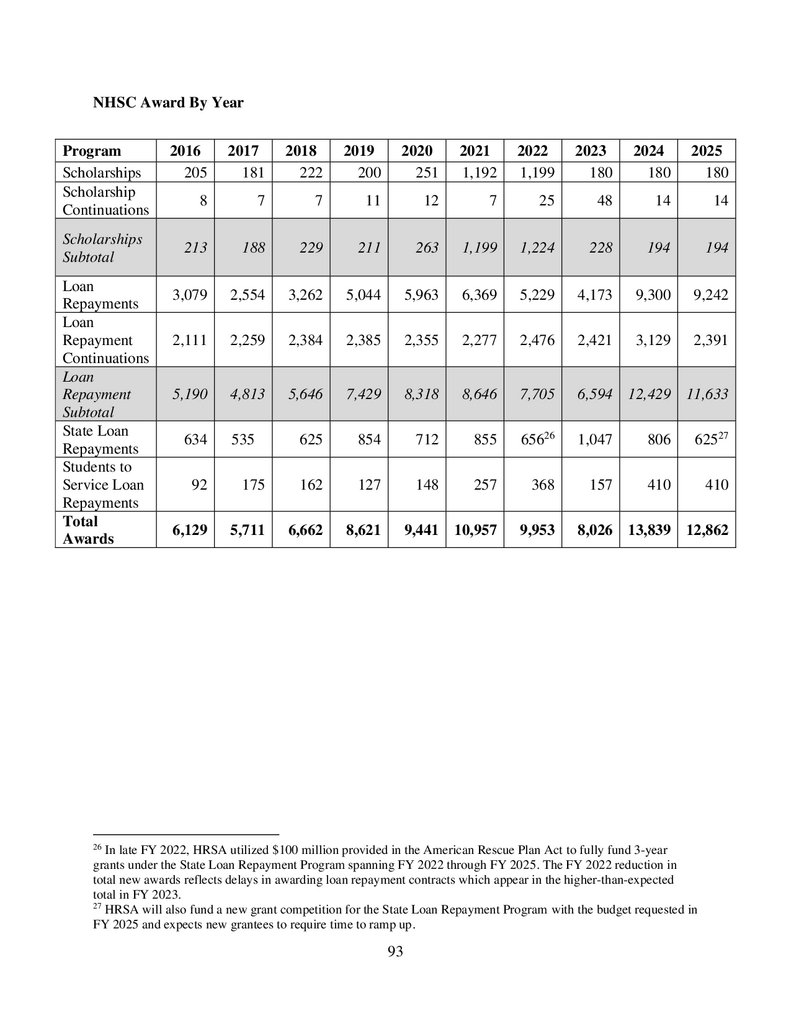
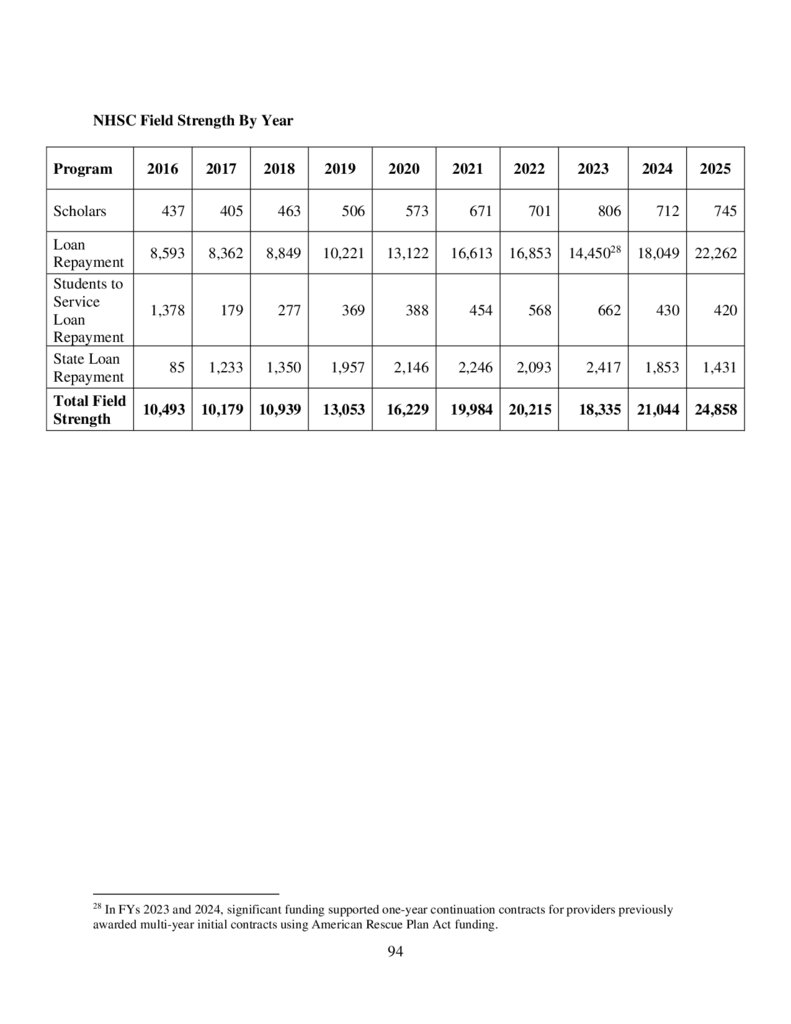
National Health Service Corps (NHSC): total program $915.6 million
The Budget, consistent with the FY 2024 request, increases and extends mandatory funding
of $790 million per year through FY 2026 to ensure primary care clinicians practice in high
11
12.
need underserved and rural areas in exchange for loan repayment and scholarships throughthe National Health Service Corps.
Behavioral Health Workforce Development Programs: +$56.5 million; total program $253.6
million
The Budget would grow the behavioral health workforce by funding the training of more
mental health and substance use disorder providers. This investment will support the training
of approximately 12,000 students in the Behavioral Health Education and Training programs.
The Budget also includes a $10 million investment to develop a peer-to-peer support
program to address current behavioral health needs among youth and young adults while also
building an early pathway program for behavioral health careers for youth peers.
Nursing Workforce Development Programs: +$20 million, total programs $320.5 million
The Budget includes funding to grow the next generation of nurses. It also includes
investments, consistent with the White House Blueprint on Addressing the Maternal Health
Crisis, to increase the number of certified nurse midwives to expand maternal health care
options and access as well as grow the nursing workforce to support sustaining labor and
delivery services that are under stress in community hospitals across the country.
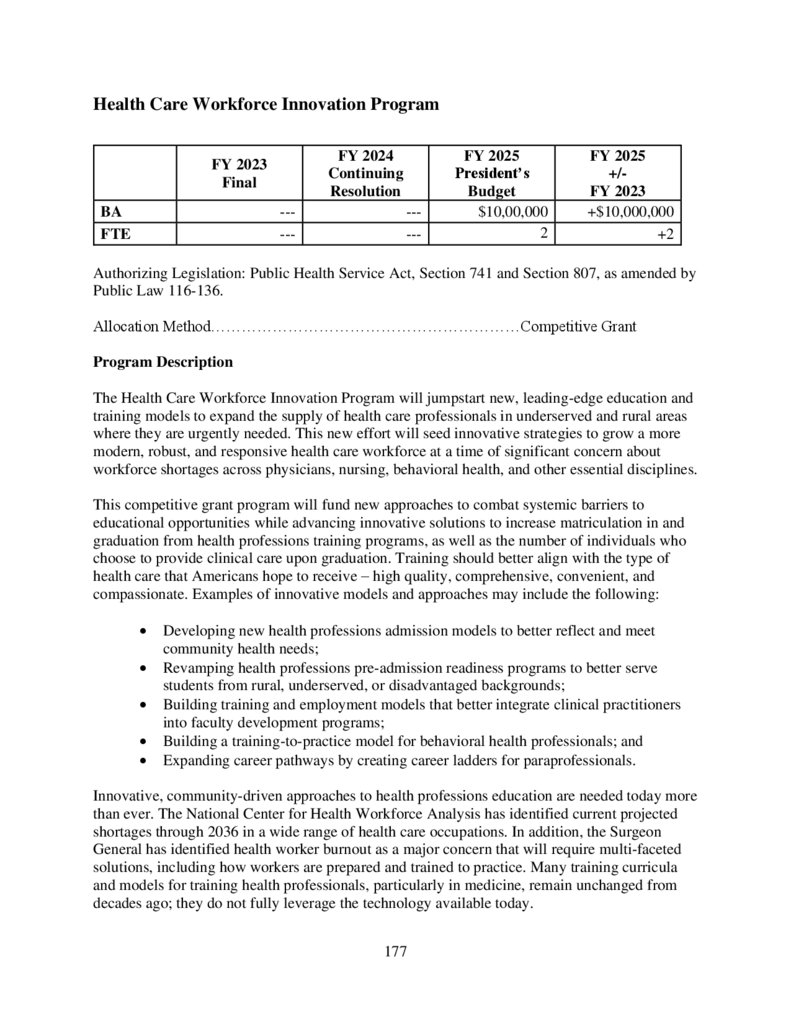
Health Care Workforce Innovation Program: +$10 million; total program $10 million
The Budget includes $10 million for a Health Care Workforce Innovation program that seeks
to incentivize the development of innovative new ways to recruit and train health
professionals in order to accelerate progress in addressing workforce shortages.
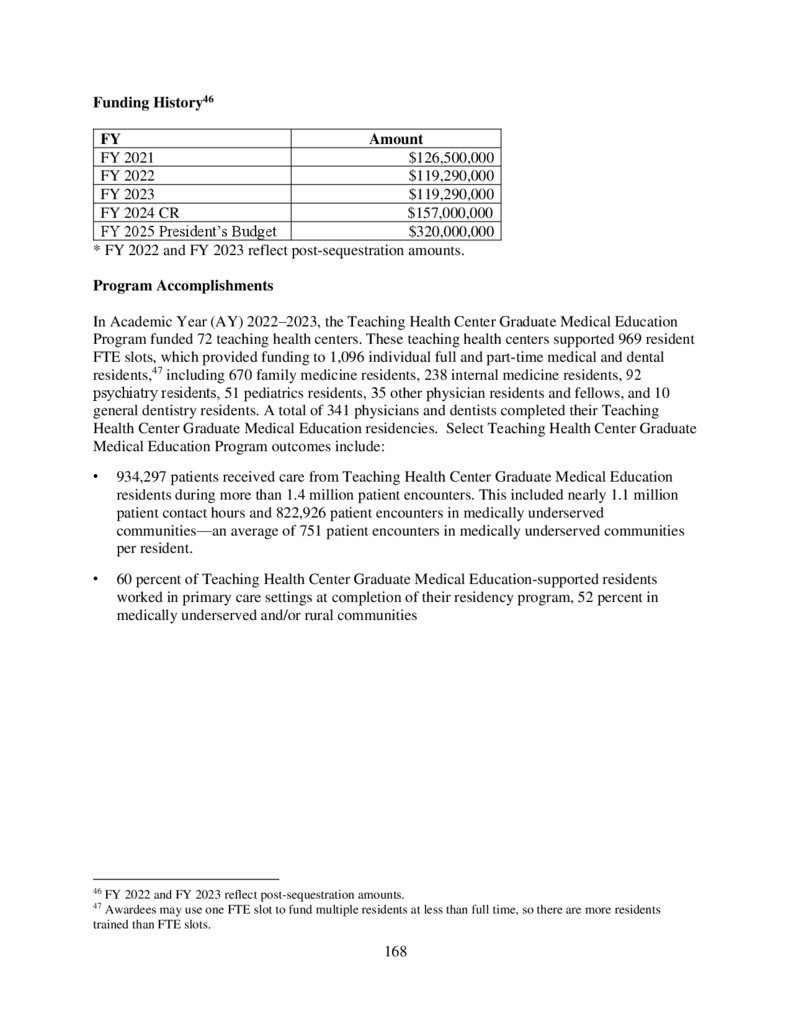
Teaching Health Center Graduate Medical Education: +$200.7 million; total program $320
million
The Budget proposes, consistent with the FY 2024 President’s Budget proposal, to increase
and extend mandatory funding through FY 2026 for the Teaching Health Center Graduate
Medical Education Program, to train more primary care physicians in community-based
settings, such as community health centers, where most primary care is delivered. The
Budget includes $163 million above FY 2024 proposed mandatory for a total increase of
$200.7 million over FY 2023. In FY 2025, the program will support over 1,800 resident fulltime equivalent slots.
Medical Student Education: -$9.5 million; total program $50.5 million
The Budget includes $50.5 million to fund continuation awards to support graduate education
for medical students preparing to become physicians in states with a projected primary care
provider shortage. Proposed funding would support all eligible continuations.
HIV/AIDS: +$10 million; total program $2.6 billion
The Budget provides a comprehensive system of HIV primary medical care, medications, and
essential support services for individuals with low-incomes with HIV. This includes $175
million, an increase of $10 million, to continue the Ending the HIV Epidemic (EHE) Initiative
and build on its successes of connecting and re-connecting high-need people with HIV to high
quality care. The total EHE investment will support HIV care and treatment needs for an
estimated 46,000 clients.
12
13.
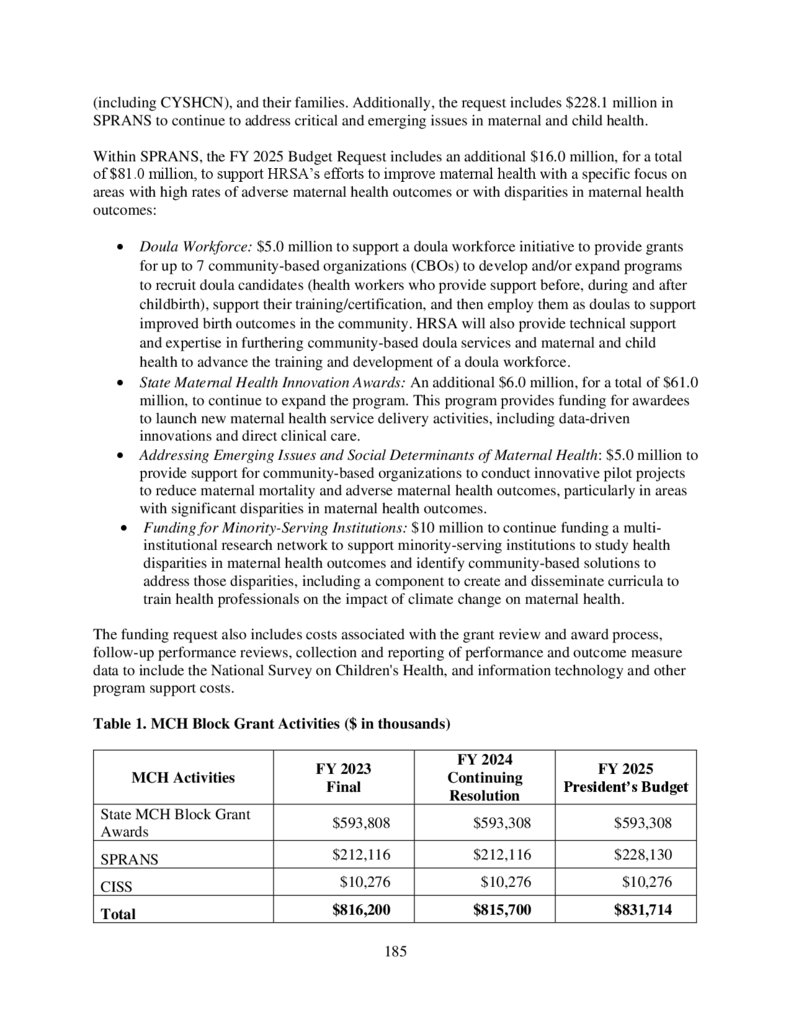
Maternal and Child Health (MCH): +$135.7 million; total program $1.8 billionIn support of the Biden-Harris Administration’s focus on maternal health and the White House
Blueprint for Addressing the Maternal Health Crisis, the Budget invests in a broad array of
activities aimed at reducing the maternal death rate, addressing unacceptable disparities in
maternal health, and improving maternal health outcomes.
In addition to the proposed new maternal health workforce funding outlined above, the Budget
includes $30 million for HRSA-supported Alliance for Innovation on Maternal Health, including
an additional $15 million to build obstetric safety-net capacity in maternity care deserts to
effectively recognize and respond to urgent and emergent obstetric-related emergencies in areas
without ready access to obstetric care.
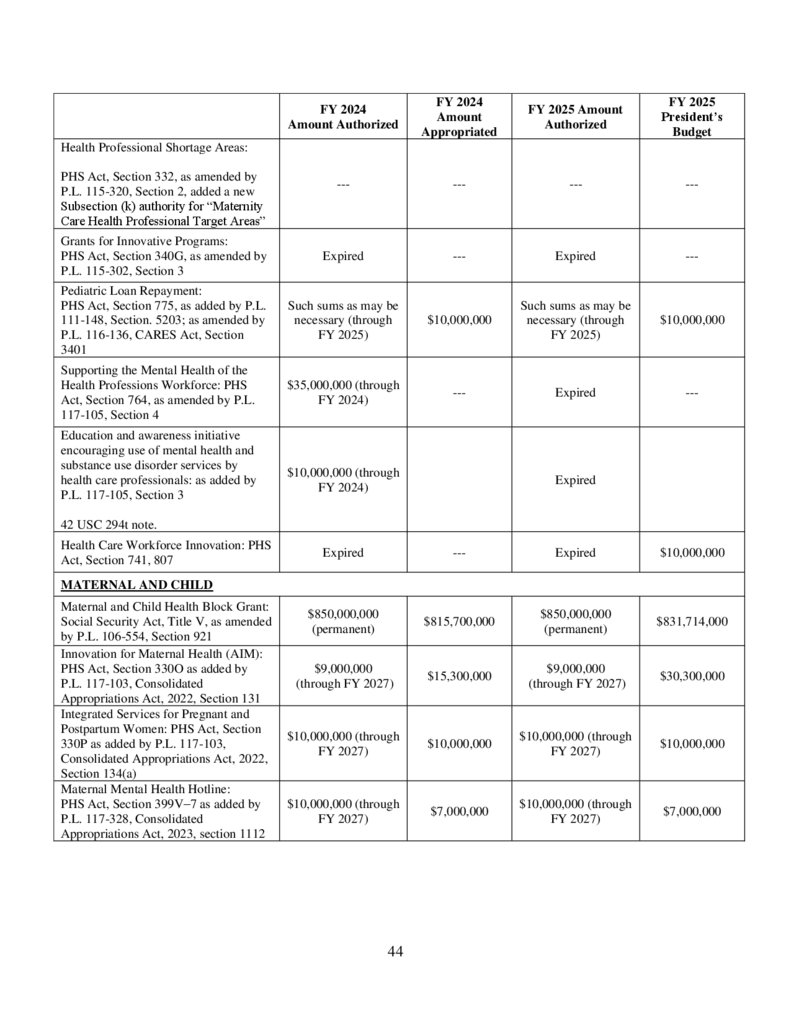
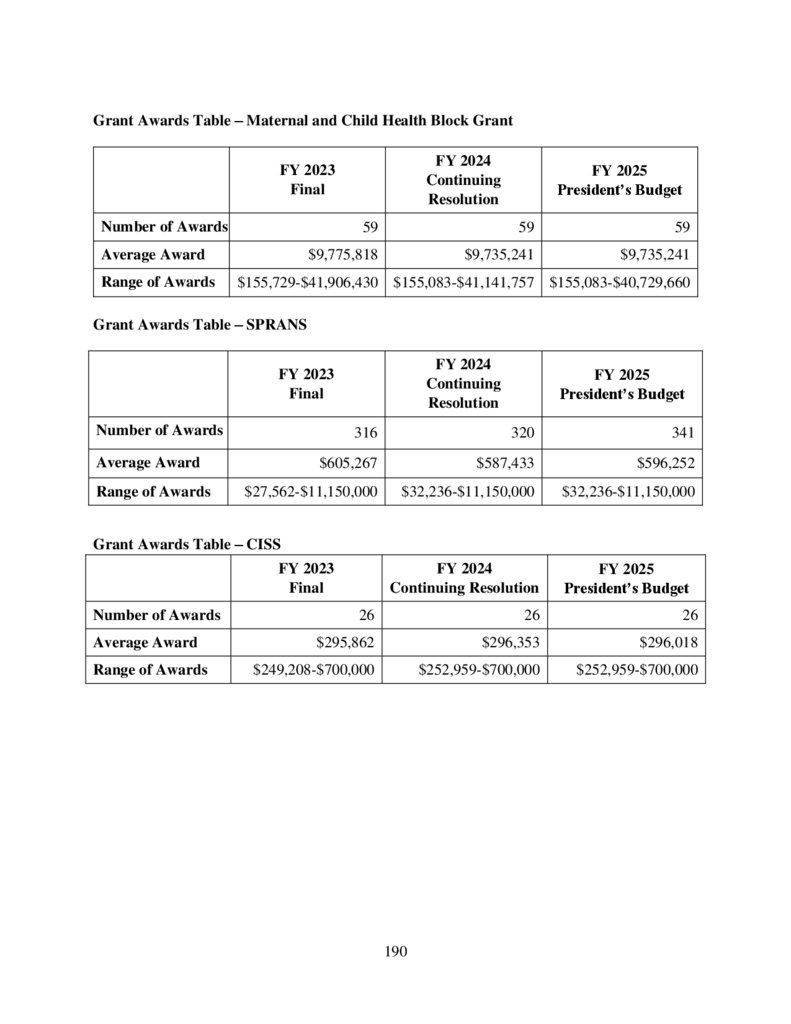
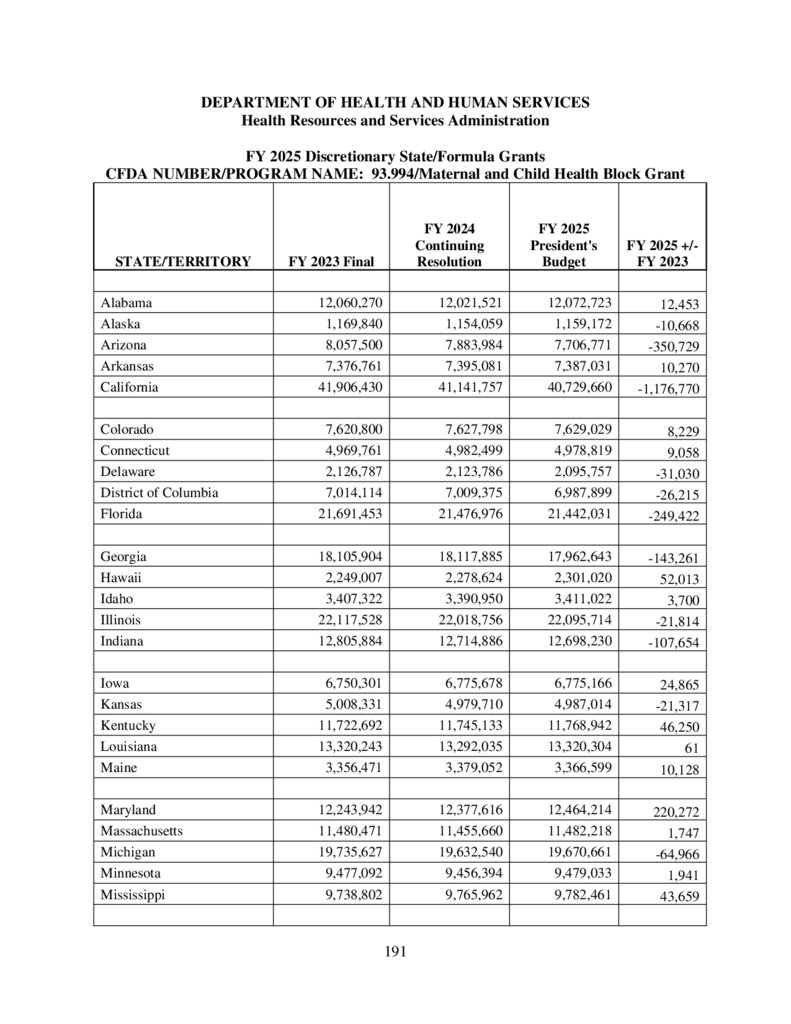
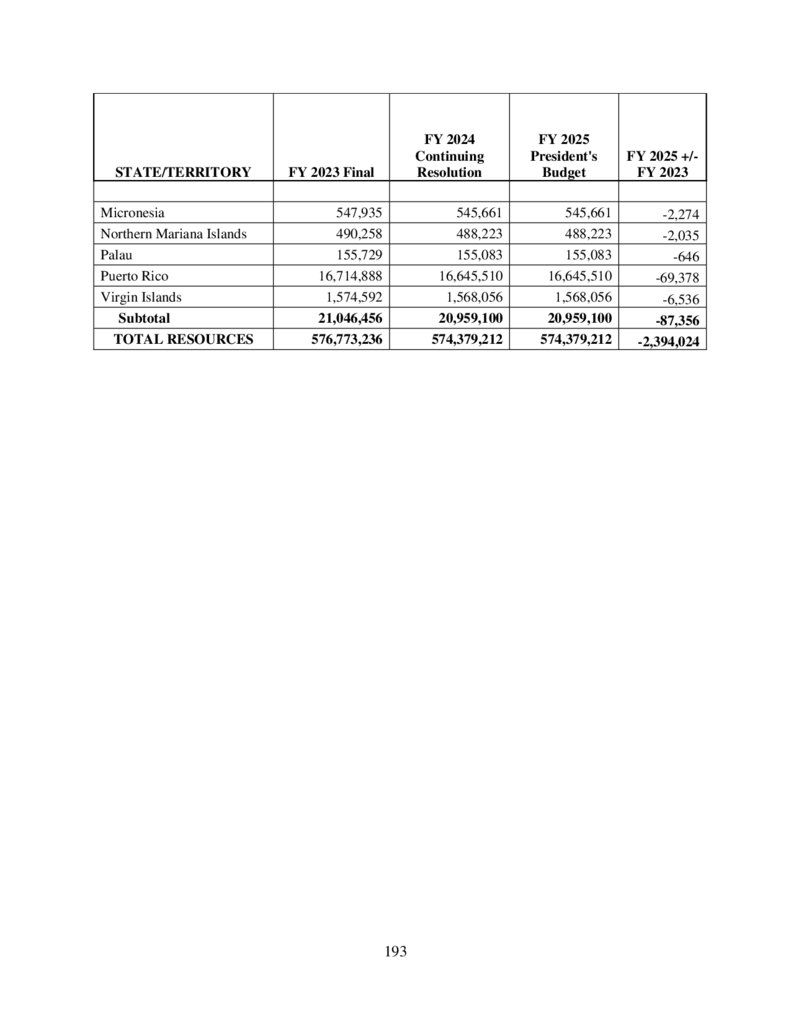
The Budget also provides $831.7 million for the Maternal and Child Health Block Grant, which
provides core support for maternal and child health services provided across the country. This
includes a proposed $16 million increase above the FY 2023 Final level for Special Projects of
Regional and National Significance (SPRANS), consisting of an additional $6 million for State
Maternal Innovation awards to improve maternal health care service delivery, an increase of $5
million to grow and diversify the community-based doula workforce and an increase of $5
million to address the social determinants of maternal health. The Budget also provides $15.5
million, an increase of additional $5.5 million, for the Screening and Treatment for Maternal
Mental Health and Substance Use Disorders Program to expand access to critical mental health
supports for pregnant and new mothers.
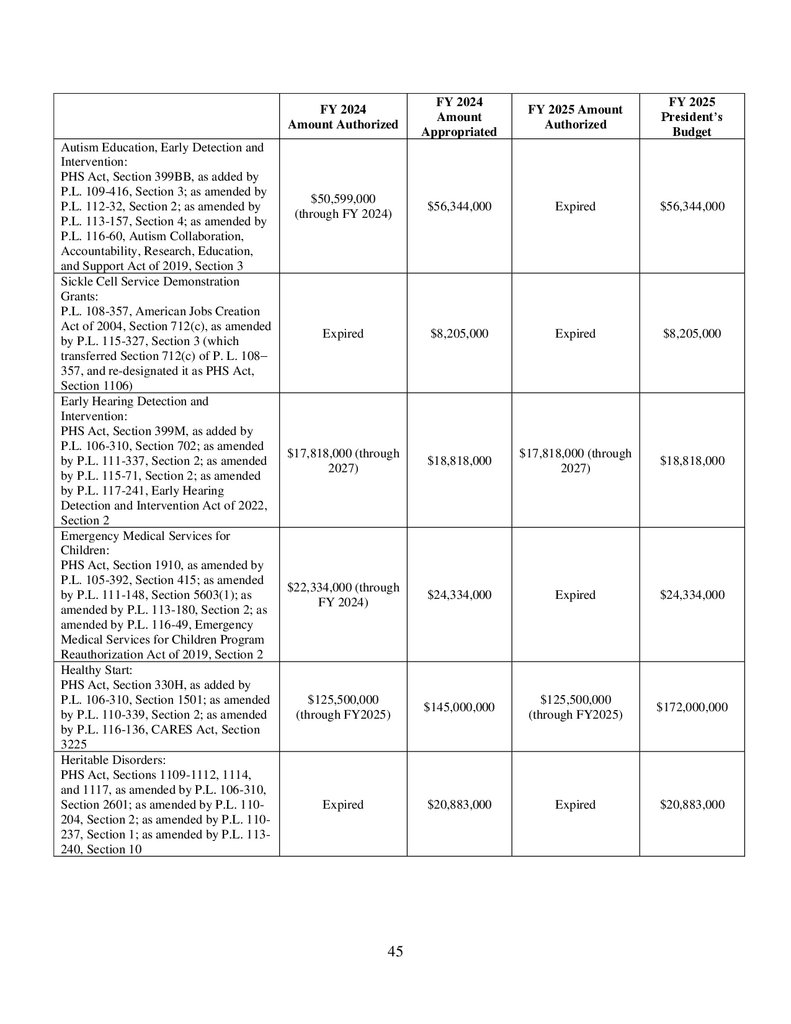
The Budget provides $172 million for the Healthy Start program, and includes an additional $27
million for the Healthy Start program to support workforce development, including through
building on lessons learned from the “Benefits Bundle” Peer Navigator pilot to train recent
Healthy Start alumni to work with current Healthy Start families to improve access to
community resources that address social determinants of health such as food insecurity, unstable
housing, and a lack of transportation.
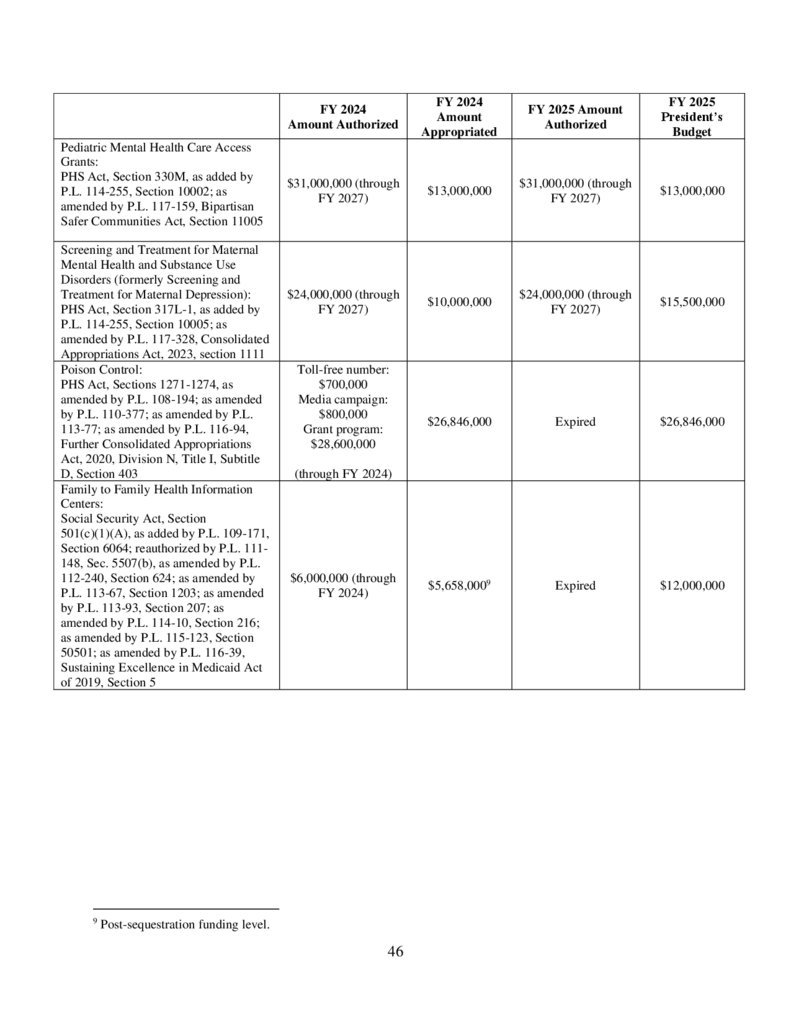
The Budget proposes an increase of $6.3 million in mandatory funding to extend and expand the
Family-to-Family Health Information Centers Program to enable awardees – community-based
organizations located in every state – to serve more families of children and youth with special
health care needs and expand their capacity to partner and engage families, providers, and other
community and state stakeholders. The Budget proposes to reauthorize and expand the program
for FY 2025 – FY 2029 at $12 million per year for a total of $60 million over five years, and to
include a new technical assistance component. Additionally, the Budget reflects an increase in
the Maternal, Infant, and Early Childhood Home Visiting program as reauthorized in the
Consolidated Appropriations Act, 2023.
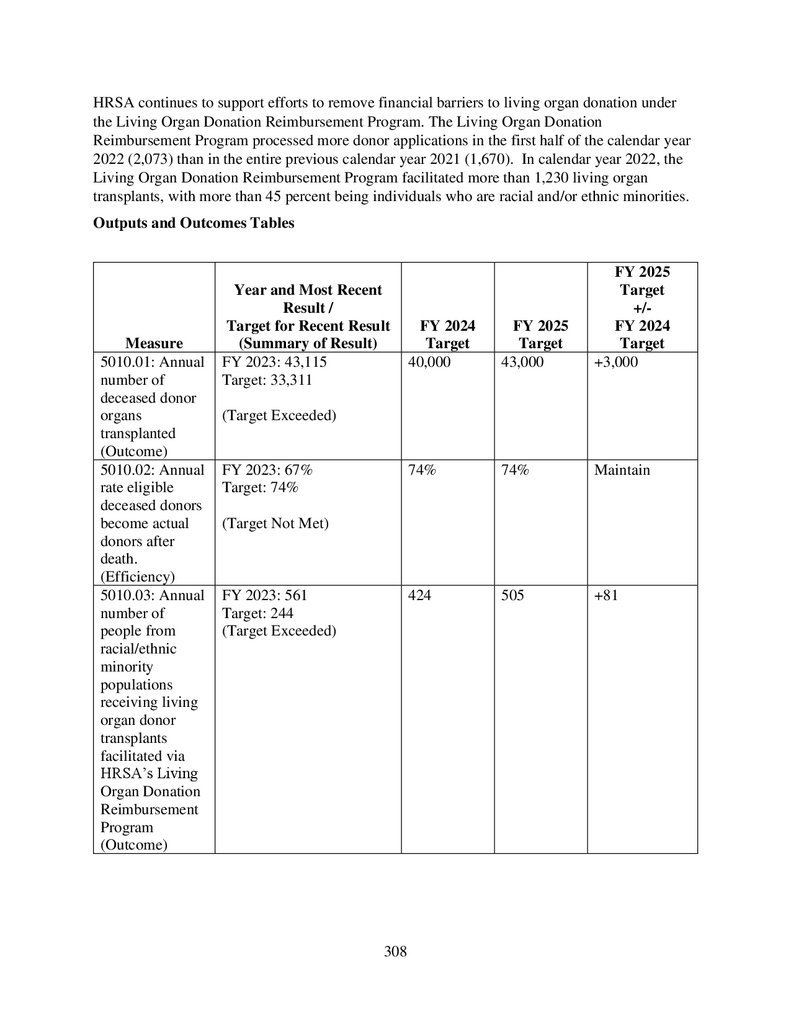
Organ Transplantation: +$36 million, total program $67 million
Within the total for Health Systems, the Budget invests $67 million, an additional $36 million, to
modernize the Organ Procurement and Transplantation Network (OPTN). In September 2023,
the President signed bipartisan legislation to modernize and reform the OPTN to work better for
13
14.
patients, families and providers. The FY 2025 request will enable HRSA to fully support a newand independent Board of Directors, multiple vendors for operations and Next-Generation IT
activities to support the building of a modernized OPTN IT system that leverages industryleading standards.
Family Planning +$103.5 million; total program $390 million
The Budget supports family planning services for approximately 3.6 million individuals, with
approximately 90 percent having family incomes at or below 250 percent of the federal poverty
level. The request expands services to additional clients and additional communities.
14
15.
Overview of PerformanceAs articulated in HRSA’s Strategic Plan, HRSA works to achieve health equity and improve
public health. HRSA aims to improve access to quality health services, foster a health workforce
and health infrastructure able to address current and emerging needs, and optimize HRSA
operations and strengthen program engagement. The section below includes key program
performance highlights and FY 2025 targets for select priority areas.
Primary Care
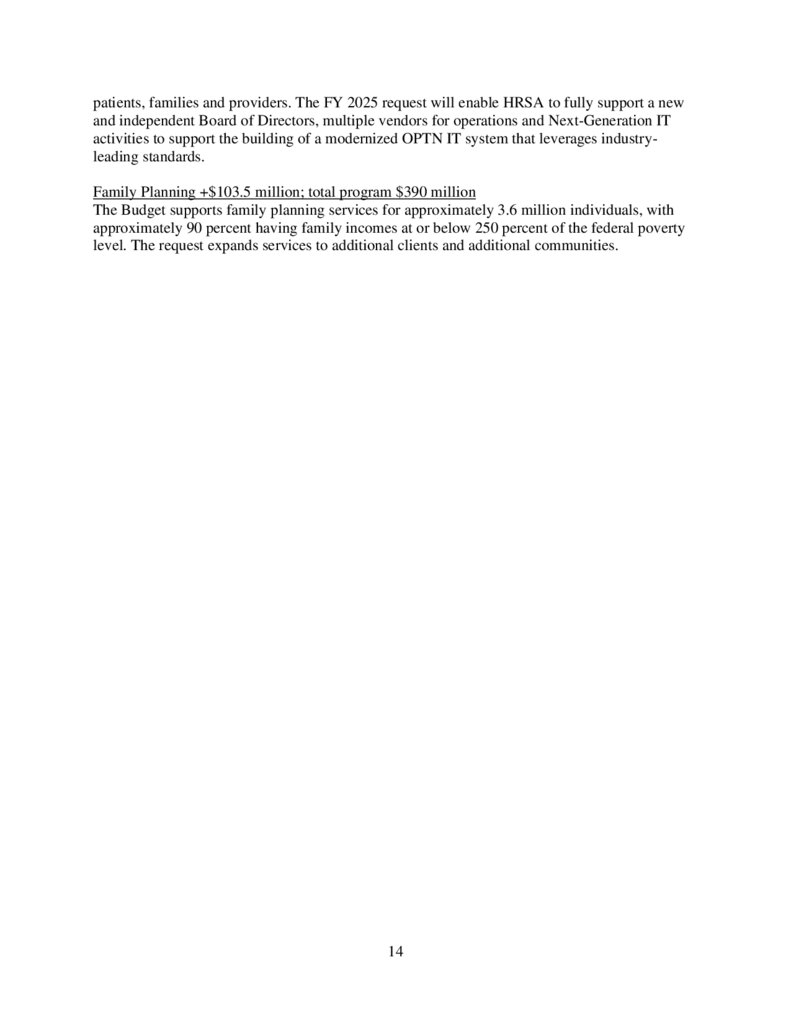
HRSA programs support the direct delivery of health services and health system improvements
to improve access to quality health services and help reduce health disparities. The number of
people served by health centers has grown by more than 6 percent between FY 2020 and FY
2022 and is anticipated to grow by more than 17 percent between FY 2020 and FY 2025. In FY
2025, the Health Centers Program expects to provide affordable, accessible, quality, and costefficient care to 37.4 million patients, anticipating that 91 percent of whom will have incomes at
or below 200 percent of poverty.
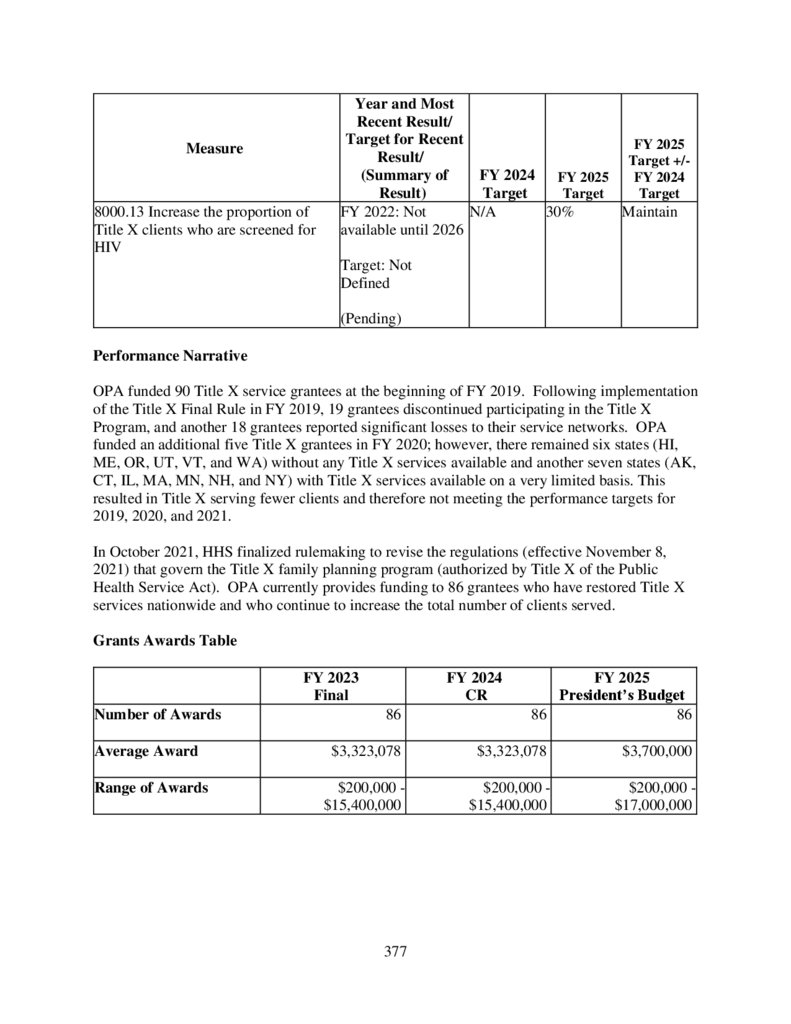
Figure 1. Number of People Served by the Health Centers Program (UDS, 2022)
Organ, Cord Blood, and Tissue Donation and Transplantation
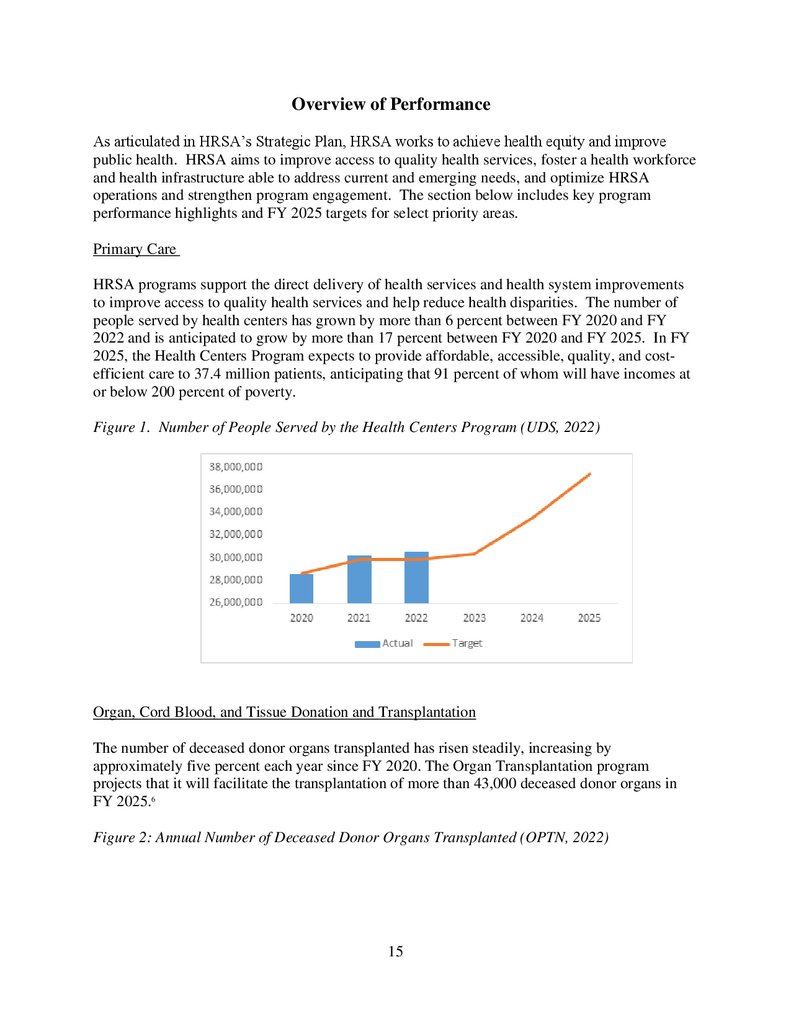
The number of deceased donor organs transplanted has risen steadily, increasing by
approximately five percent each year since FY 2020. The Organ Transplantation program
projects that it will facilitate the transplantation of more than 43,000 deceased donor organs in
FY 2025.6
Figure 2: Annual Number of Deceased Donor Organs Transplanted (OPTN, 2022)
15
16.
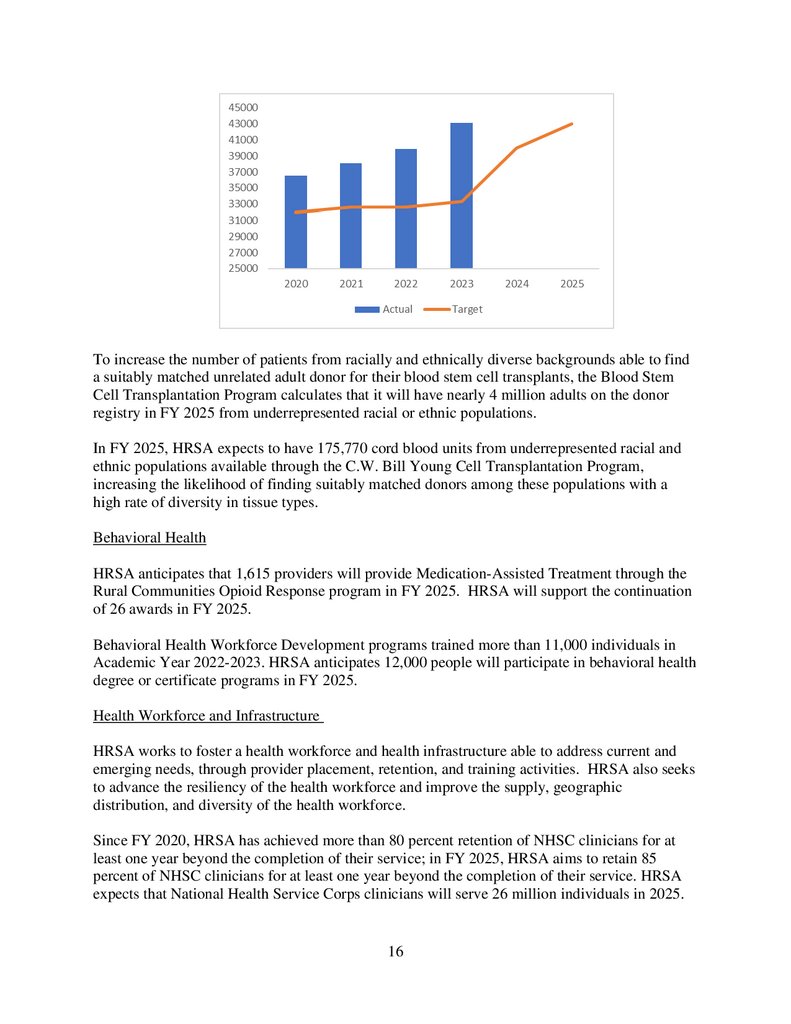
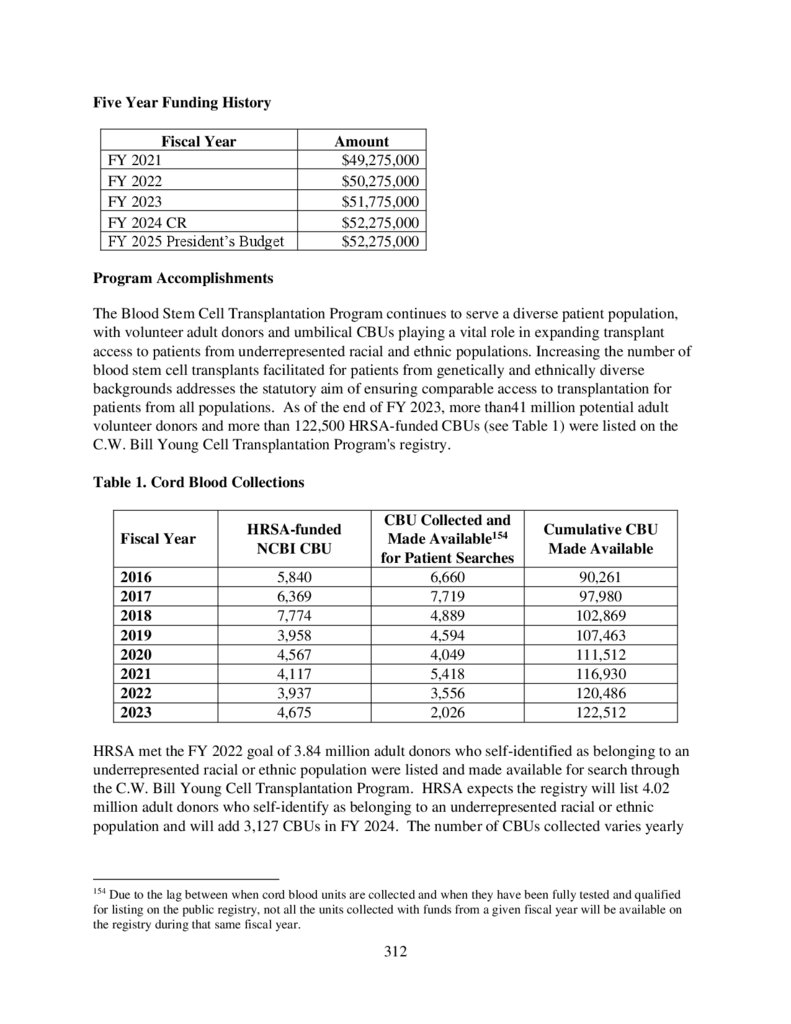
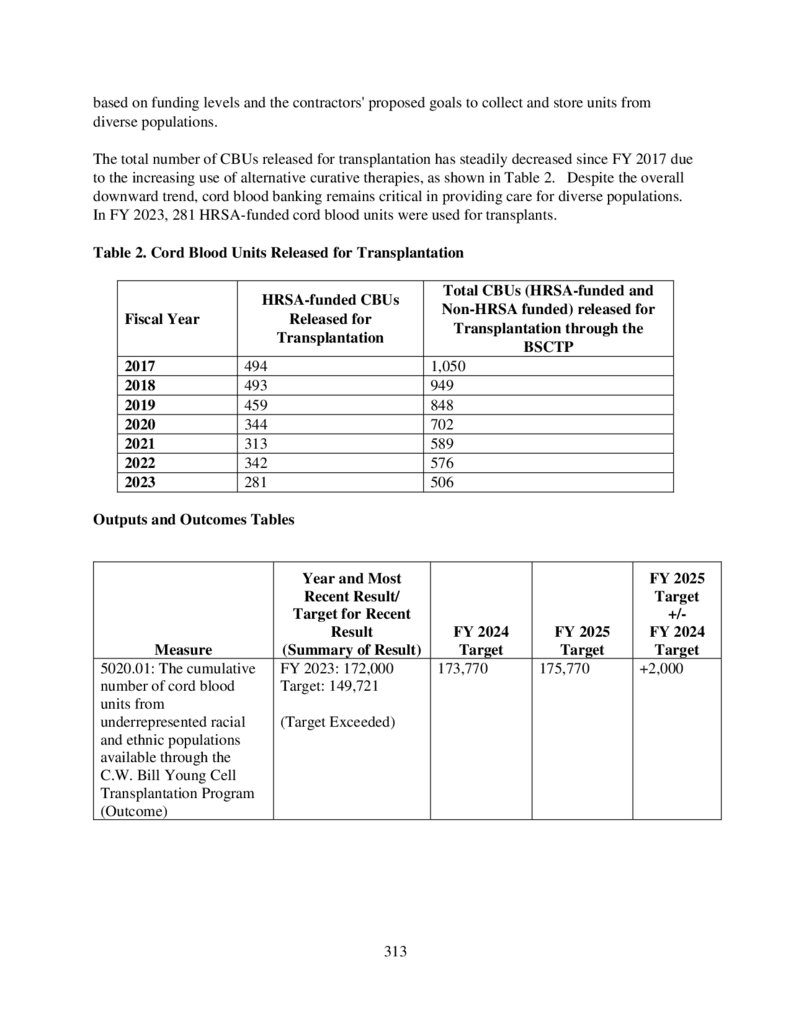
To increase the number of patients from racially and ethnically diverse backgrounds able to finda suitably matched unrelated adult donor for their blood stem cell transplants, the Blood Stem
Cell Transplantation Program calculates that it will have nearly 4 million adults on the donor
registry in FY 2025 from underrepresented racial or ethnic populations.
In FY 2025, HRSA expects to have 175,770 cord blood units from underrepresented racial and
ethnic populations available through the C.W. Bill Young Cell Transplantation Program,
increasing the likelihood of finding suitably matched donors among these populations with a
high rate of diversity in tissue types.
Behavioral Health
HRSA anticipates that 1,615 providers will provide Medication-Assisted Treatment through the
Rural Communities Opioid Response program in FY 2025. HRSA will support the continuation
of 26 awards in FY 2025.
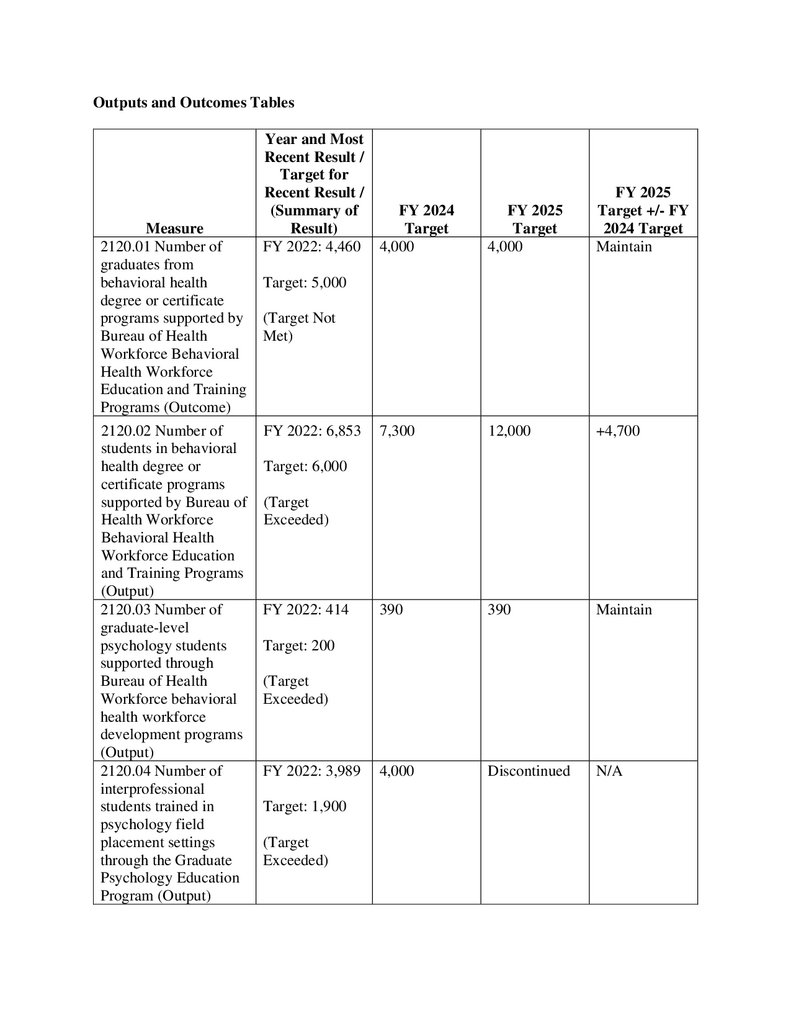
Behavioral Health Workforce Development programs trained more than 11,000 individuals in
Academic Year 2022-2023. HRSA anticipates 12,000 people will participate in behavioral health
degree or certificate programs in FY 2025.
Health Workforce and Infrastructure
HRSA works to foster a health workforce and health infrastructure able to address current and
emerging needs, through provider placement, retention, and training activities. HRSA also seeks
to advance the resiliency of the health workforce and improve the supply, geographic
distribution, and diversity of the health workforce.
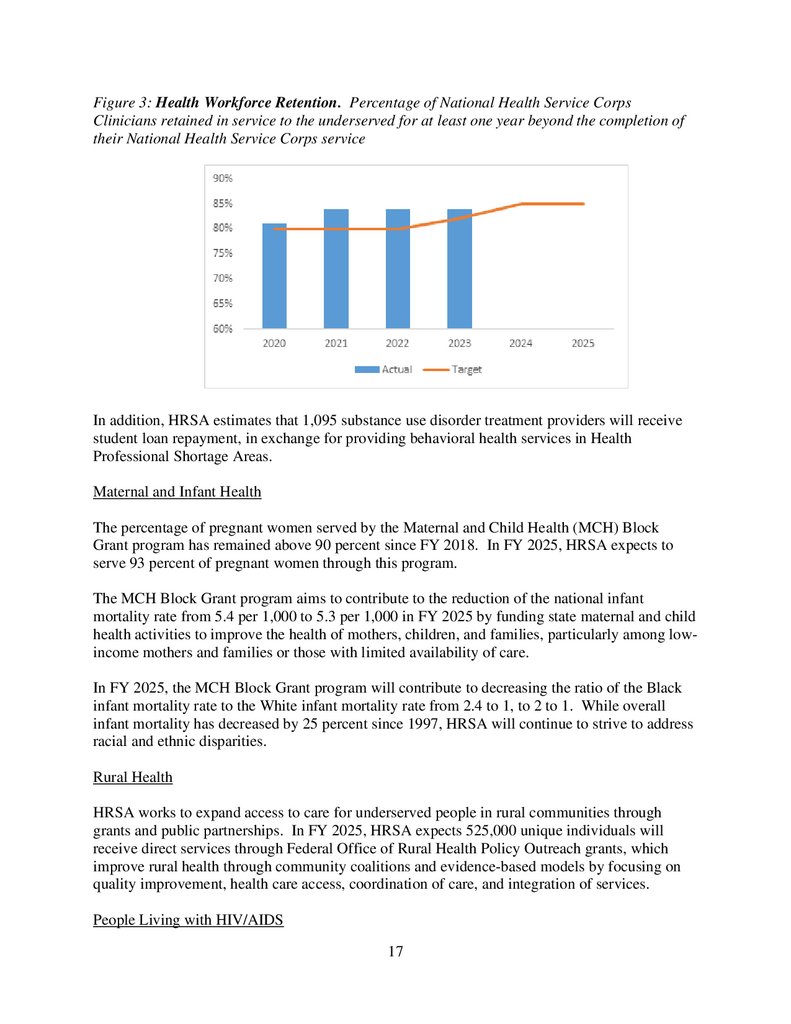
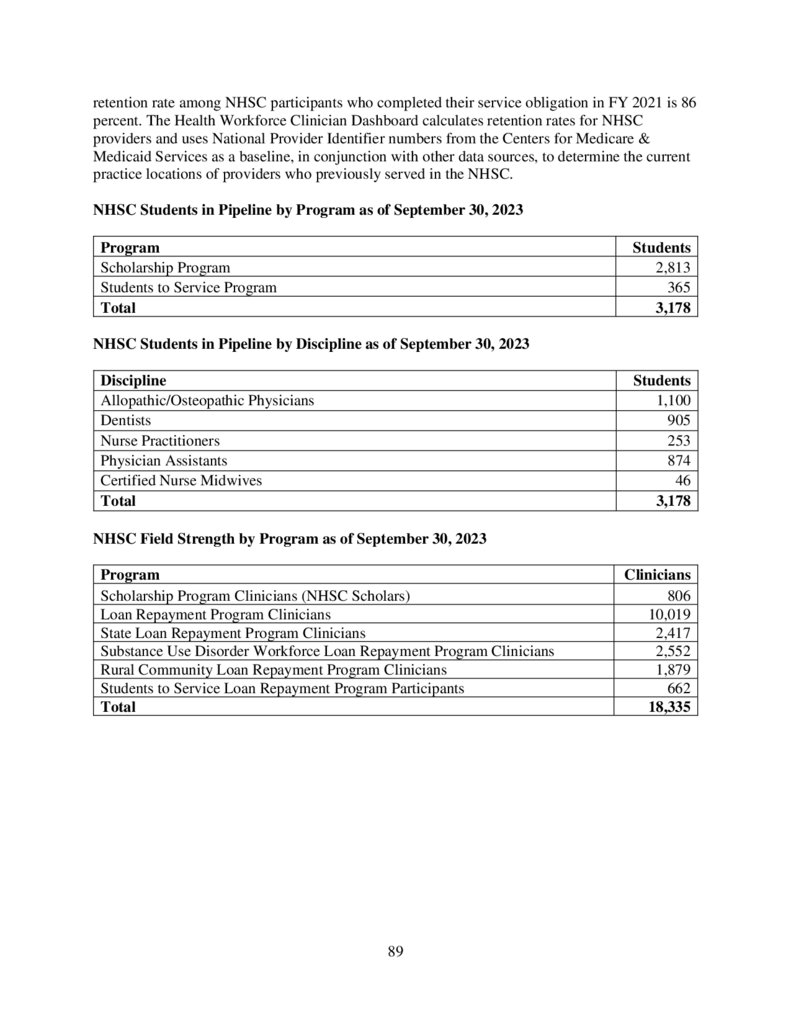
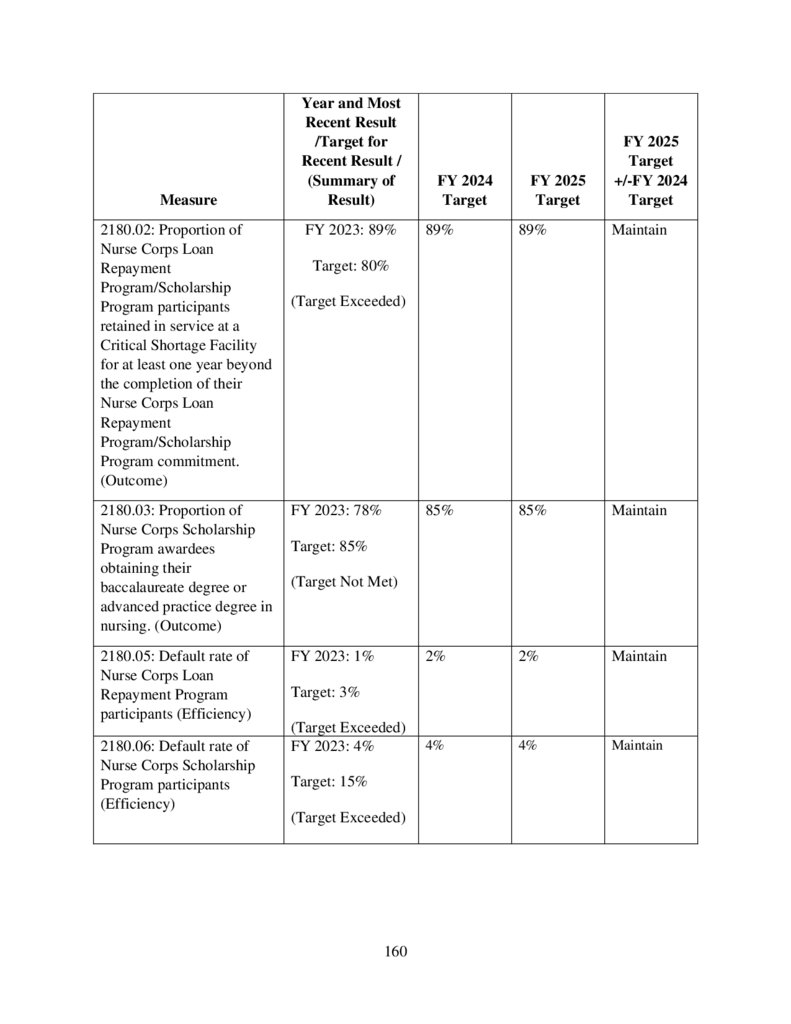
Since FY 2020, HRSA has achieved more than 80 percent retention of NHSC clinicians for at
least one year beyond the completion of their service; in FY 2025, HRSA aims to retain 85
percent of NHSC clinicians for at least one year beyond the completion of their service. HRSA
expects that National Health Service Corps clinicians will serve 26 million individuals in 2025.
16
17.
Figure 3: Health Workforce Retention. Percentage of National Health Service CorpsClinicians retained in service to the underserved for at least one year beyond the completion of
their National Health Service Corps service
In addition, HRSA estimates that 1,095 substance use disorder treatment providers will receive
student loan repayment, in exchange for providing behavioral health services in Health
Professional Shortage Areas.
Maternal and Infant Health
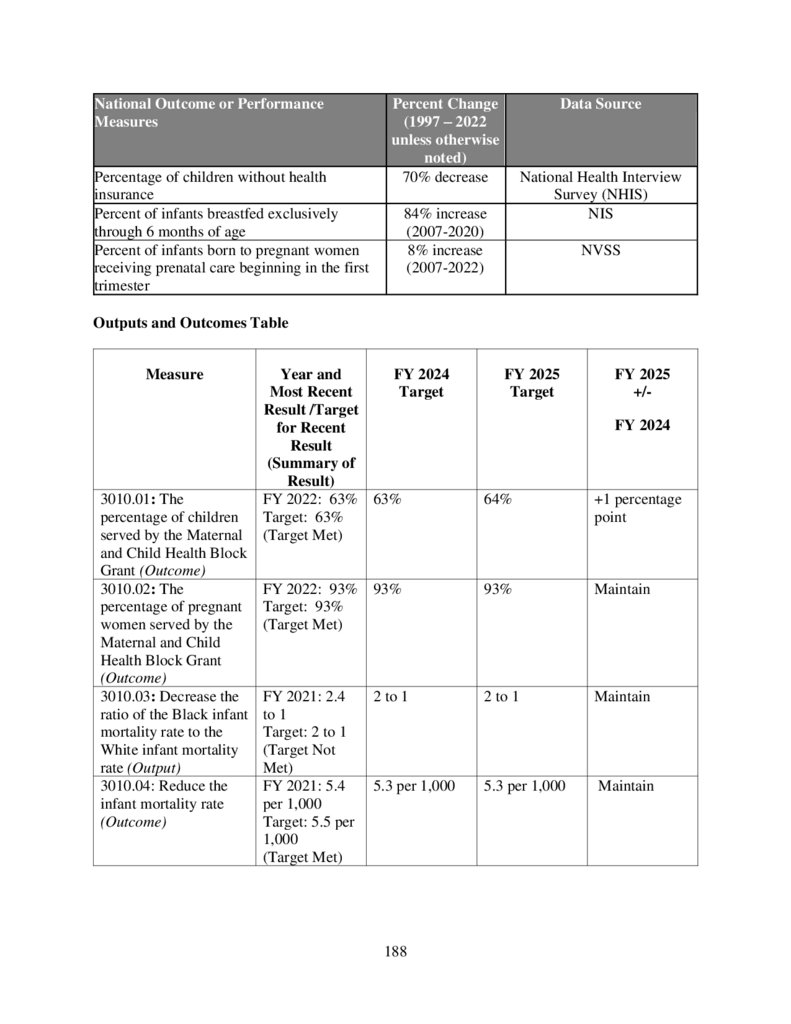
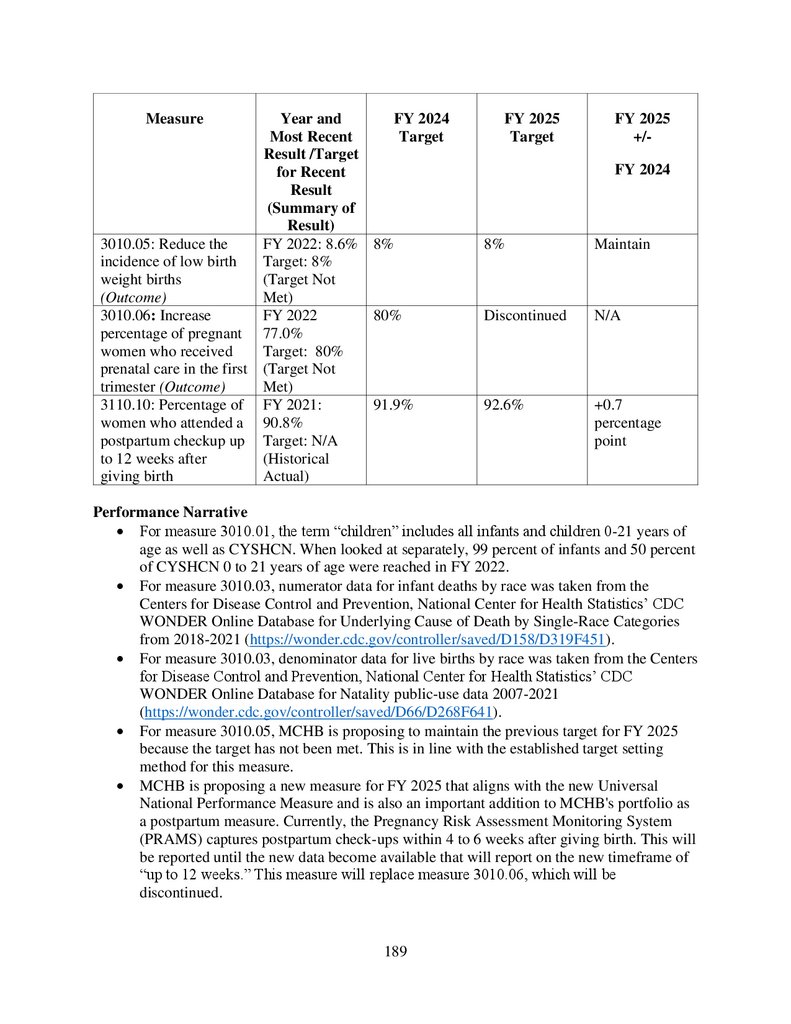
The percentage of pregnant women served by the Maternal and Child Health (MCH) Block
Grant program has remained above 90 percent since FY 2018. In FY 2025, HRSA expects to
serve 93 percent of pregnant women through this program.
The MCH Block Grant program aims to contribute to the reduction of the national infant
mortality rate from 5.4 per 1,000 to 5.3 per 1,000 in FY 2025 by funding state maternal and child
health activities to improve the health of mothers, children, and families, particularly among lowincome mothers and families or those with limited availability of care.
In FY 2025, the MCH Block Grant program will contribute to decreasing the ratio of the Black
infant mortality rate to the White infant mortality rate from 2.4 to 1, to 2 to 1. While overall
infant mortality has decreased by 25 percent since 1997, HRSA will continue to strive to address
racial and ethnic disparities.
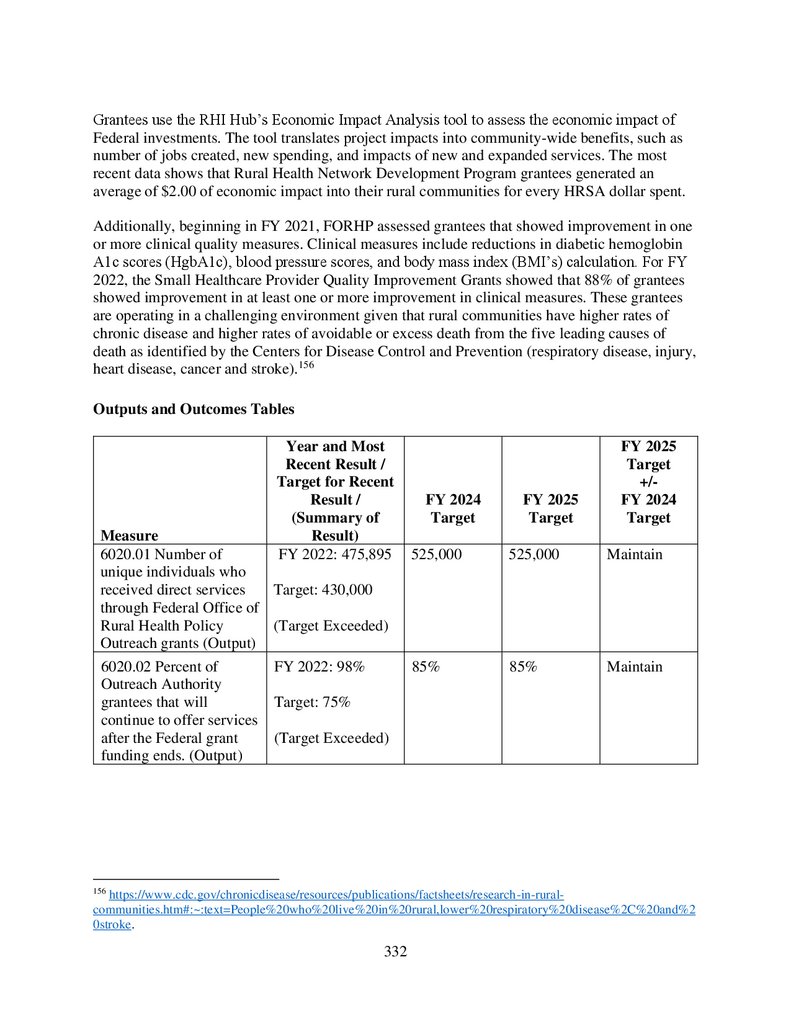
Rural Health
HRSA works to expand access to care for underserved people in rural communities through
grants and public partnerships. In FY 2025, HRSA expects 525,000 unique individuals will
receive direct services through Federal Office of Rural Health Policy Outreach grants, which
improve rural health through community coalitions and evidence-based models by focusing on
quality improvement, health care access, coordination of care, and integration of services.
People Living with HIV/AIDS
17
18.
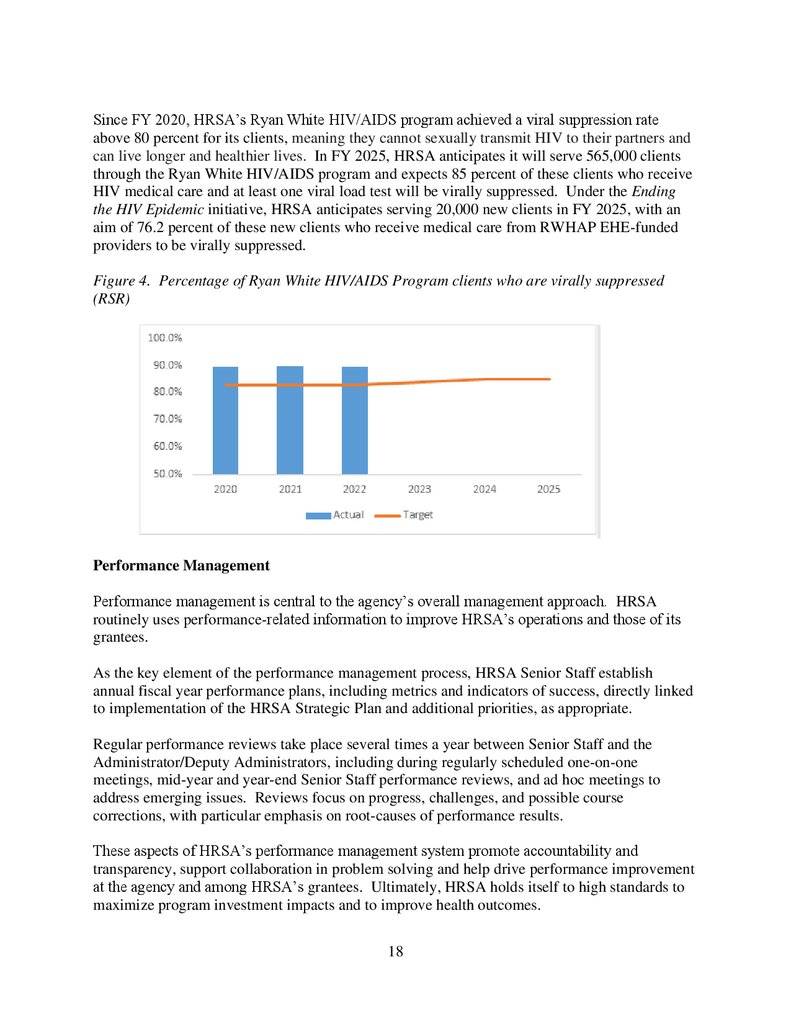
Since FY 2020, HRSA’s Ryan White HIV/AIDS program achieved a viral suppression rateabove 80 percent for its clients, meaning they cannot sexually transmit HIV to their partners and
can live longer and healthier lives. In FY 2025, HRSA anticipates it will serve 565,000 clients
through the Ryan White HIV/AIDS program and expects 85 percent of these clients who receive
HIV medical care and at least one viral load test will be virally suppressed. Under the Ending
the HIV Epidemic initiative, HRSA anticipates serving 20,000 new clients in FY 2025, with an
aim of 76.2 percent of these new clients who receive medical care from RWHAP EHE-funded
providers to be virally suppressed.
Figure 4. Percentage of Ryan White HIV/AIDS Program clients who are virally suppressed
(RSR)
Performance Management
Performance management is central to the agency’s overall management approach. HRSA
routinely uses performance-related information to improve HRSA’s operations and those of its
grantees.
As the key element of the performance management process, HRSA Senior Staff establish
annual fiscal year performance plans, including metrics and indicators of success, directly linked
to implementation of the HRSA Strategic Plan and additional priorities, as appropriate.
Regular performance reviews take place several times a year between Senior Staff and the
Administrator/Deputy Administrators, including during regularly scheduled one-on-one
meetings, mid-year and year-end Senior Staff performance reviews, and ad hoc meetings to
address emerging issues. Reviews focus on progress, challenges, and possible course
corrections, with particular emphasis on root-causes of performance results.
These aspects of HRSA’s performance management system promote accountability and
transparency, support collaboration in problem solving and help drive performance improvement
at the agency and among HRSA’s grantees. Ultimately, HRSA holds itself to high standards to
maximize program investment impacts and to improve health outcomes.
18
19.
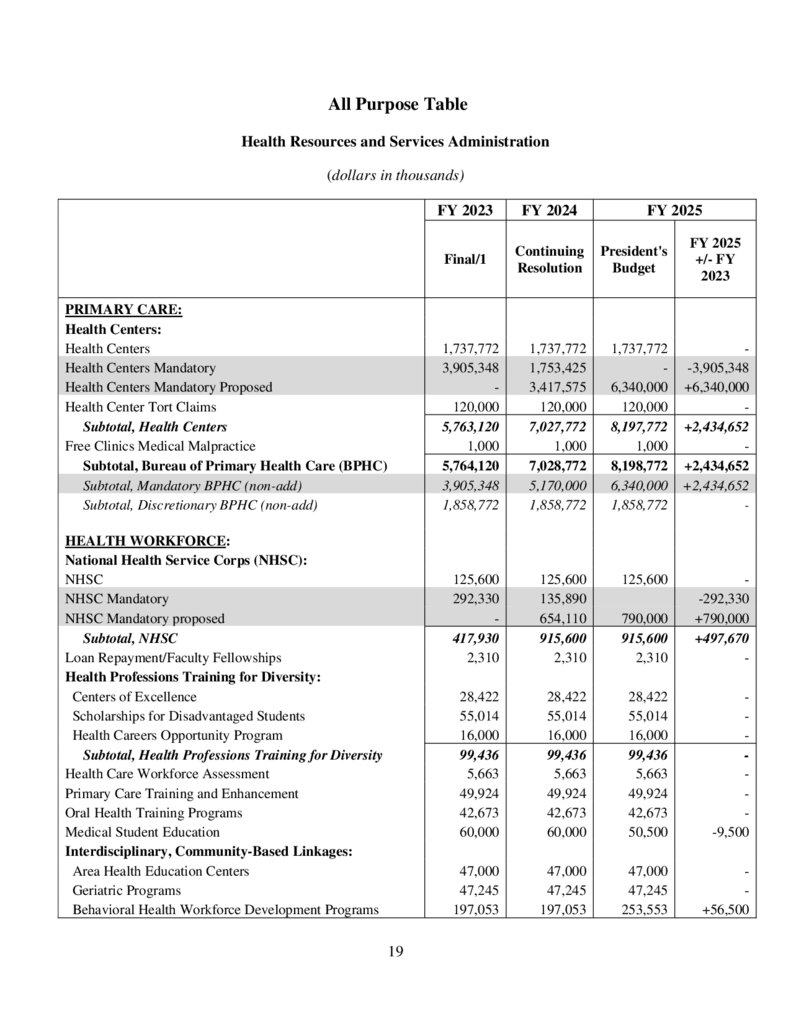
All Purpose TableHealth Resources and Services Administration
(dollars in thousands)
PRIMARY CARE:
Health Centers:
Health Centers
Health Centers Mandatory
Health Centers Mandatory Proposed
Health Center Tort Claims
Subtotal, Health Centers
Free Clinics Medical Malpractice
Subtotal, Bureau of Primary Health Care (BPHC)
Subtotal, Mandatory BPHC (non-add)
Subtotal, Discretionary BPHC (non-add)
HEALTH WORKFORCE:
National Health Service Corps (NHSC):
NHSC
NHSC Mandatory
NHSC Mandatory proposed
Subtotal, NHSC
Loan Repayment/Faculty Fellowships
Health Professions Training for Diversity:
Centers of Excellence
Scholarships for Disadvantaged Students
Health Careers Opportunity Program
Subtotal, Health Professions Training for Diversity
Health Care Workforce Assessment
Primary Care Training and Enhancement
Oral Health Training Programs
Medical Student Education
Interdisciplinary, Community-Based Linkages:
Area Health Education Centers
Geriatric Programs
Behavioral Health Workforce Development Programs
19
FY 2023
FY 2024
FY 2025
Final/1
Continuing
Resolution
President's
Budget
FY 2025
+/- FY
2023
1,737,772
3,905,348
120,000
5,763,120
1,000
5,764,120
3,905,348
1,858,772
1,737,772
1,753,425
3,417,575
120,000
7,027,772
1,000
7,028,772
5,170,000
1,858,772
1,737,772
6,340,000
120,000
8,197,772
1,000
8,198,772
6,340,000
1,858,772
-3,905,348
+6,340,000
+2,434,652
+2,434,652
+2,434,652
-
125,600
292,330
417,930
2,310
125,600
135,890
654,110
915,600
2,310
125,600
790,000
915,600
2,310
-292,330
+790,000
+497,670
-
28,422
55,014
16,000
99,436
5,663
49,924
42,673
60,000
28,422
55,014
16,000
99,436
5,663
49,924
42,673
60,000
28,422
55,014
16,000
99,436
5,663
49,924
42,673
50,500
-9,500
47,000
47,245
197,053
47,000
47,245
197,053
47,000
47,245
253,553
+56,500
20.
FY 2023FY 2024
FY 2025
Final/1
Continuing
Resolution
President's
Budget
FY 2025
+/- FY
2023
291,298
291,298
347,798
+56,500
18,000
18,000
18,000
-
Subtotal, Interdisciplinary, Community-Based Linkages
Public Health Workforce Development:
Public Health/Preventive Medicine
Nursing Workforce Development:
Advanced Nursing Education
Nursing Workforce Diversity
Nurse Education, Practice and Retention
Nurse Faculty Loan Program
NURSE Corps Scholarship and Loan Repayment Program
Subtotal, Nursing Workforce Development
CHGME
Teaching Health Center Graduate Medical Education
(THCGME):
THCGME Mandatory
THCGME Mandatory Proposed
Subtotal, THCGME
National Practitioner Data Bank (User Fees)
Pediatric Specialty LRP
Health Care Workforce Innovation Program
Subtotal, Bureau of Health Workforce (BHW)
Subtotal, User Fees BHW (non-add)
Subtotal, Discretionary BHW (non-add)
Subtotal, Mandatory BHW (non-add)
95,581
24,343
59,413
28,500
92,635
300,472
385,000
95,581
24,343
59,413
28,500
92,635
300,472
385,000
105,581
24,343
69,413
28,500
92,635
320,472
385,000
+10,000
+10,000
+20,000
-
119,290
119,290
18,814
10,000
1,820,810
18,814
1,390,376
411,620
55,452
101,548
157,000
18,814
10,000
2,356,190
18,814
1,390,376
947,000
320,000
320,000
18,814
10,000
10,000
2,596,190
18,814
1,467,376
1,110,000
-119,290
+320,000
+200,710
+10,000
+775,380
+1,187,000
-411,620
MATERNAL & CHILD HEALTH:
Maternal and Child Health Block Grant
Grants to States (non-add)
SPRANS (non-add)
CISS (non-add)
Innovation for Maternal Health
Integrated Services for Pregnant and Postpartum Women
Maternal Mental Health Hotline
Autism and Other Developmental Disorders
Sickle Cell Service Demonstrations
Early Hearing Detection and Intervention
Emergency Medical Services for Children
Healthy Start
Heritable Disorders
816,200
593,808
212,116
10,276
15,300
10,000
7,000
56,344
8,205
18,818
24,334
144,500
20,883
815,700
593,308
212,116
10,276
15,300
10,000
7,000
56,344
8,205
18,818
24,334
145,000
20,883
831,714
593,308
228,130
10,276
30,300
10,000
7,000
56,344
8,205
18,818
24,334
172,000
20,883
+15,514
-500
+16,014
+15,000
+27,500
-
20
21.
FY 2023FY 2024
FY 2025
Final/1
Continuing
Resolution
President's
Budget
13,000
13,000
13,000
-
10,000
26,846
10,000
26,846
15,500
26,846
+5,500
-
FY 2025
+/- FY
2023
Pediatric Mental Health Care Access Grants
Screening and Treatment for Maternal Mental Health and
SUD
Poison Control Centers
Family-to-Family Health Information Centers (F2F HIC)
F2F HIC Mandatory
F2F HIC Mandatory Proposed
Subtotal, F2F HIC
Maternal, Infant and Early Childhood Home Visiting
Mandatory
Subtotal, Maternal and Child Health Bureau (MCHB)
Subtotal, Discretionary MCHB (non-add)
Subtotal, Mandatory MCHB (non-add)
5,658
5,658
5,658
5,658
12,000
12,000
-5,658
+12,000
+6,342
500,000
1,677,088
1,171,430
505,658
518,650
1,695,738
1,171,430
524,308
565,800
1,812,744
1,234,944
577,800
+65,800
+135,656
+63,514
+72,142
HIV/AIDS:
Emergency Relief - Part A
Comprehensive Care - Part B
AIDS Drug Assistance Program (non-add)
Early Intervention - Part C
Children, Youth, Women & Families - Part D
AIDS Education and Training Centers - Part F
Dental Reimbursement Program Part F
Special Projects of National Significance (SPNS)
Ending HIV Epidemic Initiative
Subtotal, HIV/AIDS Bureau
680,752
1,364,878
900,313
208,970
77,935
34,886
13,620
25,000
165,000
2,571,041
680,752
1,364,878
900,313
208,970
77,935
34,886
13,620
25,000
165,000
2,571,041
680,752
1,364,878
900,313
208,970
77,935
34,886
13,620
25,000
175,000
2,581,041
+10,000
+10,000
31,549
31,049
67,049
+35,500
51,775
13,706
1,857
122
99,009
52,275
13,706
1,857
122
99,009
52,275
13,706
1,857
122
135,009
+500
+36,000
11,076
92,975
11,076
92,975
11,076
92,975
-
HEALTH SYSTEMS:
Organ Transplantation
Cell Transplantation Program and Cord Blood Stem Cell
Bank
Hansen's Disease Center
Payment to Hawaii
National Hansen's Disease Program - Buildings and Facilities
Subtotal, Health Systems Bureau (HSB)
RURAL HEALTH:
Rural Health Policy Development
Rural Health Outreach Grants
21
22.
FY 2023FY 2024
FY 2025
Final/1
Continuing
Resolution
President's
Budget
FY 2025
+/- FY
2023
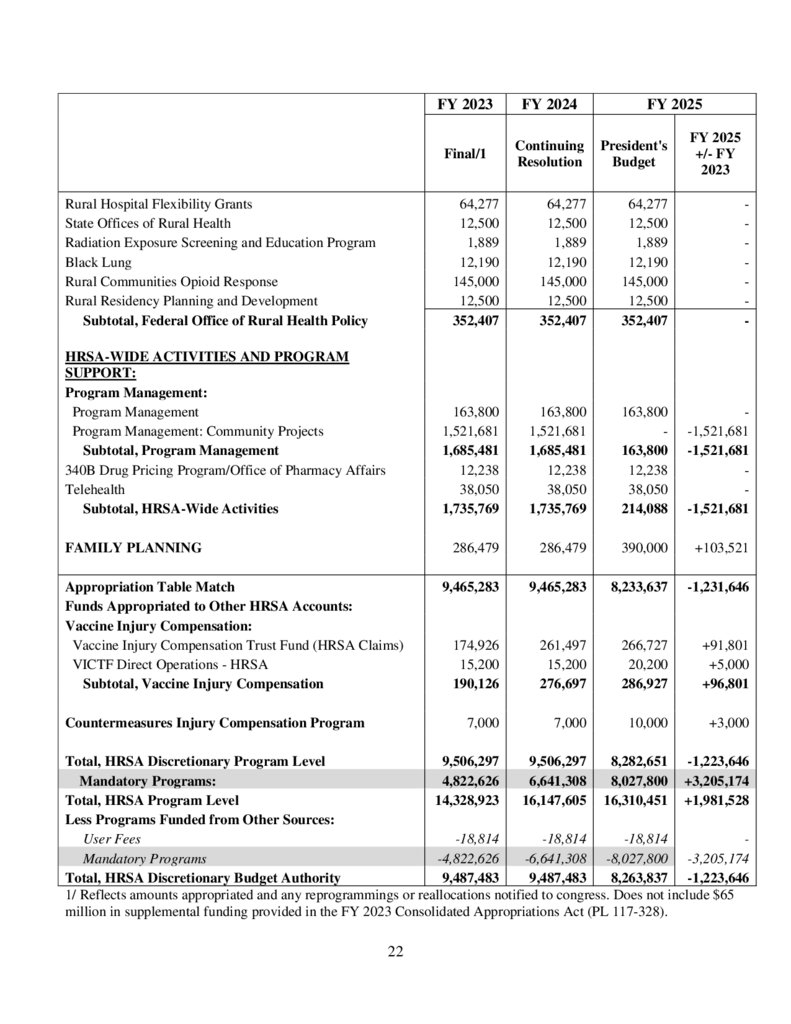
Rural Hospital Flexibility Grants
State Offices of Rural Health
Radiation Exposure Screening and Education Program
Black Lung
Rural Communities Opioid Response
Rural Residency Planning and Development
Subtotal, Federal Office of Rural Health Policy
64,277
12,500
1,889
12,190
145,000
12,500
352,407
64,277
12,500
1,889
12,190
145,000
12,500
352,407
64,277
12,500
1,889
12,190
145,000
12,500
352,407
-
HRSA-WIDE ACTIVITIES AND PROGRAM
SUPPORT:
Program Management:
Program Management
Program Management: Community Projects
Subtotal, Program Management
340B Drug Pricing Program/Office of Pharmacy Affairs
Telehealth
Subtotal, HRSA-Wide Activities
163,800
1,521,681
1,685,481
12,238
38,050
1,735,769
163,800
1,521,681
1,685,481
12,238
38,050
1,735,769
163,800
163,800
12,238
38,050
214,088
-1,521,681
-1,521,681
-1,521,681
286,479
286,479
390,000
+103,521
9,465,283
9,465,283
8,233,637
-1,231,646
174,926
15,200
190,126
261,497
15,200
276,697
266,727
20,200
286,927
+91,801
+5,000
+96,801
7,000
7,000
10,000
+3,000
FAMILY PLANNING
Appropriation Table Match
Funds Appropriated to Other HRSA Accounts:
Vaccine Injury Compensation:
Vaccine Injury Compensation Trust Fund (HRSA Claims)
VICTF Direct Operations - HRSA
Subtotal, Vaccine Injury Compensation
Countermeasures Injury Compensation Program
Total, HRSA Discretionary Program Level
9,506,297
9,506,297
8,282,651 -1,223,646
Mandatory Programs:
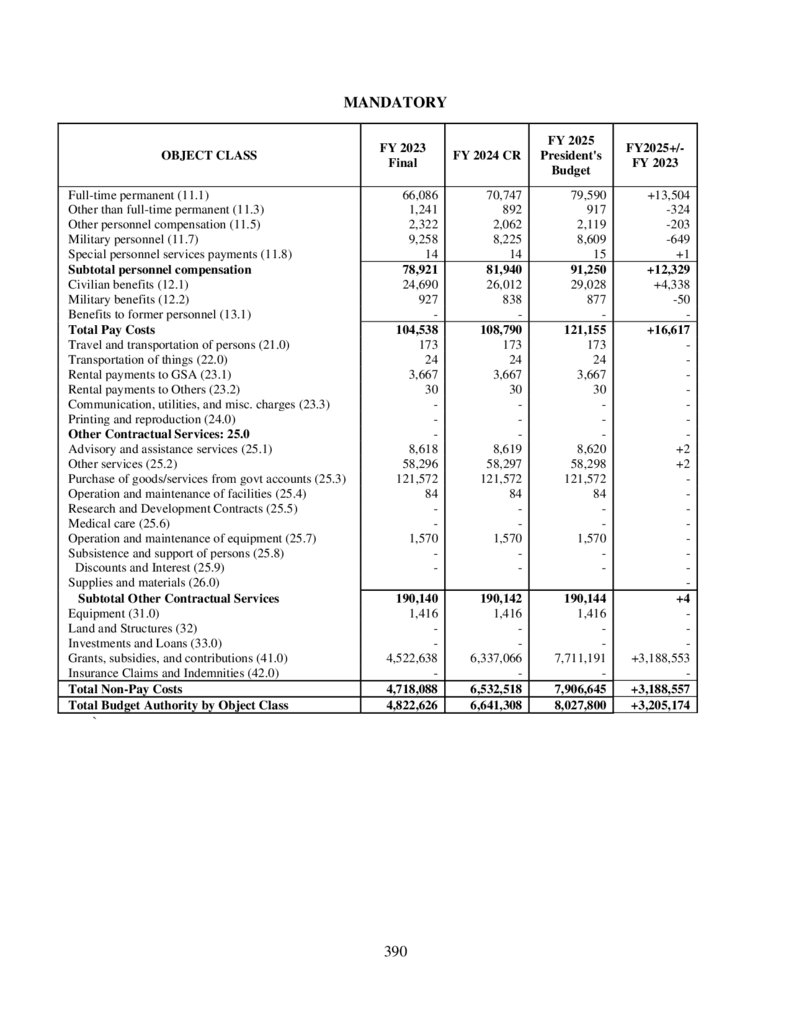
4,822,626
6,641,308
8,027,800 +3,205,174
Total, HRSA Program Level
14,328,923
16,147,605 16,310,451 +1,981,528
Less Programs Funded from Other Sources:
User Fees
-18,814
-18,814
-18,814
Mandatory Programs
-4,822,626
-6,641,308 -8,027,800 -3,205,174
Total, HRSA Discretionary Budget Authority
9,487,483
9,487,483
8,263,837 -1,223,646
1/ Reflects amounts appropriated and any reprogrammings or reallocations notified to congress. Does not include $65
million in supplemental funding provided in the FY 2023 Consolidated Appropriations Act (PL 117-328).
22
23.
BUDGET EXHIBITS23
24.
Appropriations LanguagePRIMARY HEALTH CARE
For carrying out titles II and III of the Public Health Service Act (referred to in this Act as the
"PHS Act") with respect to primary health care and the Native Hawaiian Health Care Act of
1988, $1,858,772,000: Provided, That no more than $1,000,000 shall be available until
expended for carrying out the provisions of section 224(o) of the PHS Act: Provided further,
That no more than $120,000,000 shall be available until expended for carrying out subsections
(g) through (n) and (q) of section 224 of the PHS Act, and for expenses incurred by the
Department of Health and Human Services (referred to in this Act as "HHS") pertaining to
administrative claims made under such law: Provided further, That amounts made available
under this heading in this Act are available for expenses incurred by HHS in administering
programs under section 1905(l)(2)(B)(ii) and (iii) of the Social Security Act.
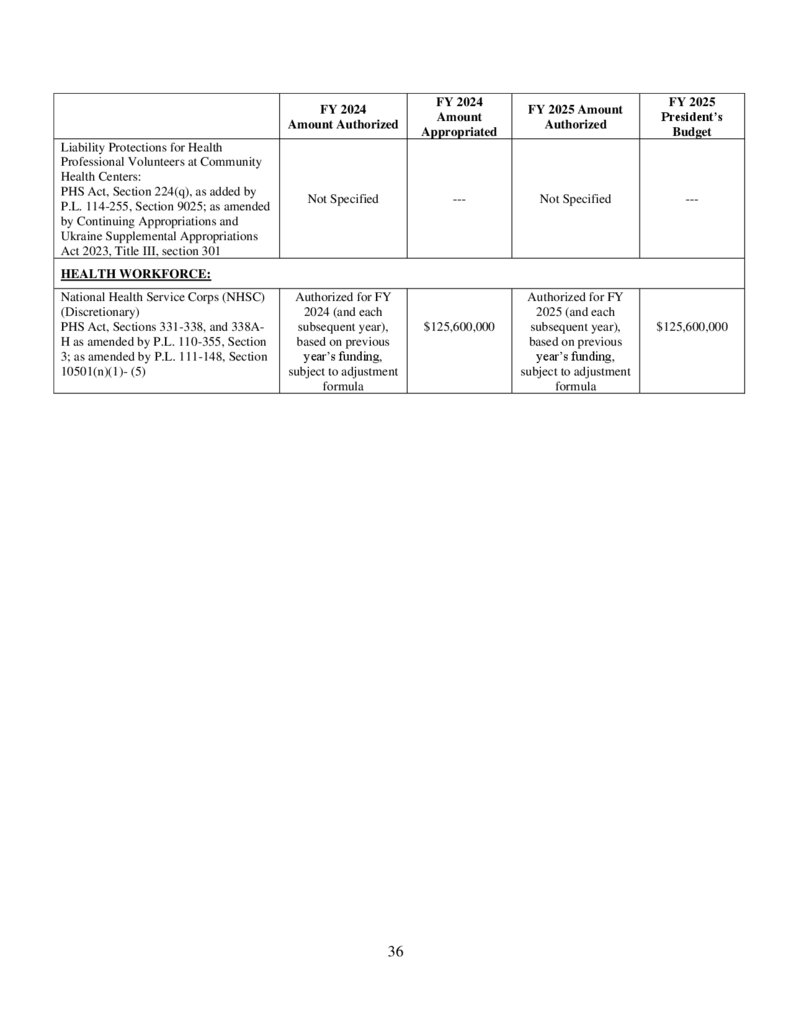
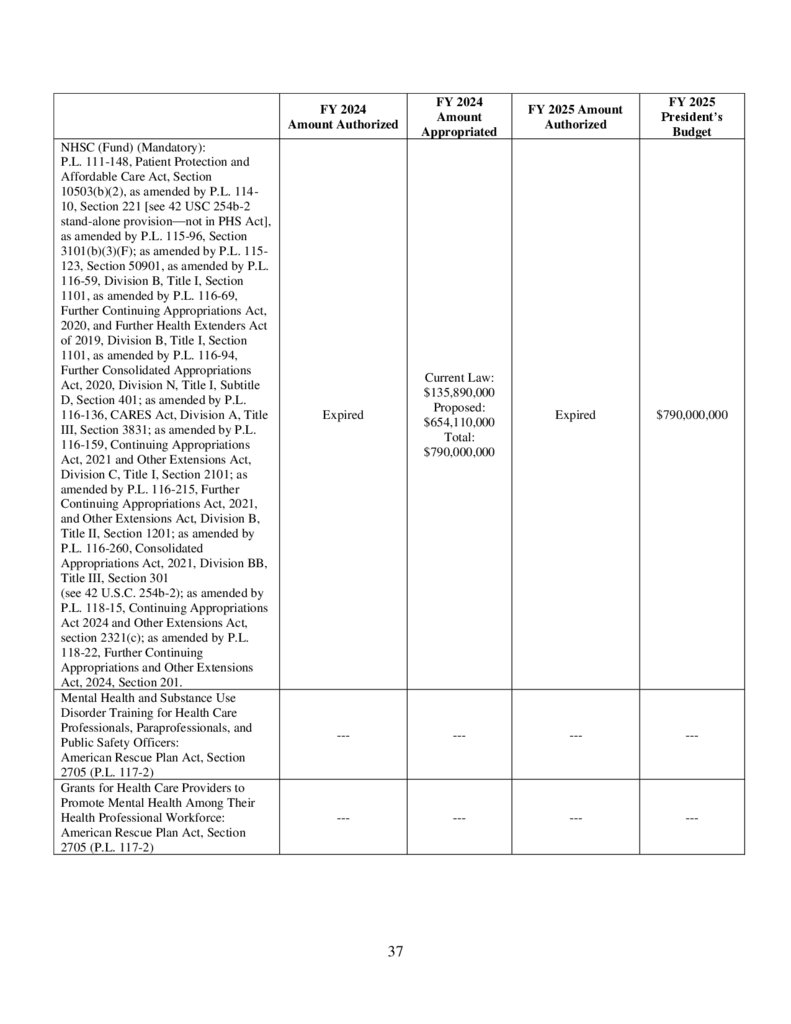
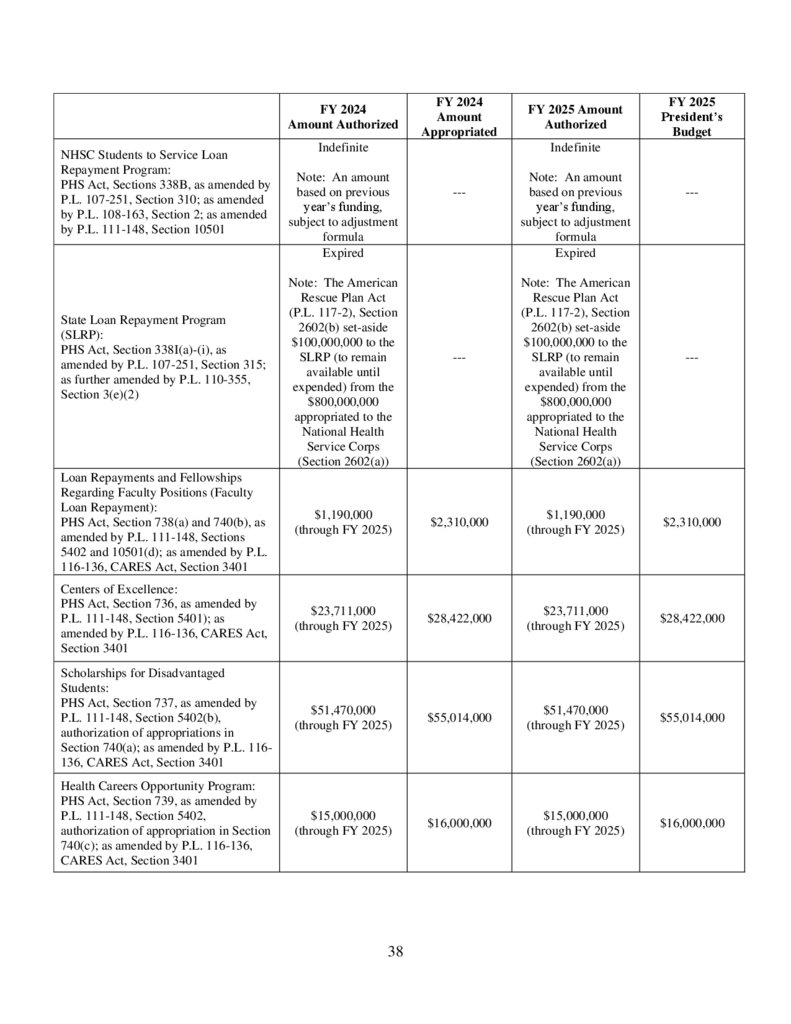
HEALTH WORKFORCE
For carrying out titles III, VII, and VIII of the PHS Act with respect to the health workforce,
sections 1128E and 1921 of the Social Security Act, and the Health Care Quality Improvement
Act of 1986, $1,467,376,000: Provided, That section 751(j)(2) of the PHS Act, 747(a)(2), and the
proportional funding amounts in paragraphs (1) through (4) of section 756(f) of the PHS Act
shall not apply to funds made available under this heading: Provided further, That for any
program operating under section 751 of the PHS Act on or before January 1, 2009, the Secretary
of Health and Human Services (referred to in this title as the "Secretary") may hereafter waive
any of the requirements contained in sections 751(d)(2)(A) and 751(d)(2)(B) of such Act for the
full project period of a grant under such section: Provided further, That section 756(c) of the
PHS Act shall apply to paragraphs (1) through (4) of section 756(a) of such Act: Provided
24
25.
further, That fees collected for the disclosure of information under section 427(b) of the HealthCare Quality Improvement Act of 1986 and sections 1128E(d)(2) and 1921 of the Social Security
Act shall be sufficient to recover the full costs of operating the programs authorized by such
sections and shall remain available until expended for the National Practitioner Data Bank:
Provided further, That funds transferred to this account to carry out section 846 and subpart 3 of
part D of title III of the PHS Act may be used to make prior year adjustments to awards made
under such section and subpart: Provided further, That the institutional requirement in section
756(c) of the PHS Act shall apply to paragraphs (1) through (4) of section 756(a) of such Act:
Provided further, That $125,600,000 shall remain available until expended for the purposes of
providing primary health services, assigning National Health Service Corps ("NHSC")
participants to expand the delivery of substance use disorder treatment services, notwithstanding
the assignment priorities and limitations under sections 333(a)(1)(D), 333(b), and
333A(a)(1)(B)(ii) of the PHS Act, and making payments under the NHSC Loan Repayment
Program under section 338B of such Act: Provided further, That, within the amount made
available in the previous proviso, $15,600,000 shall remain available until expended for the
purposes of making payments under the NHSC Loan Repayment Program under section 338B of
the PHS Act to individuals participating in such program who provide primary health services in
Indian Health Service facilities, Tribally-Operated 638 Health Programs, and Urban Indian
Health Programs (as those terms are defined by the Secretary), notwithstanding the assignment
priorities and limitations under section 333(b) of such Act: Provided further, That for purposes
of the previous two provisos, section 331(a)(3)(D) of the PHS Act shall be applied as if the term
"primary health services" includes clinical substance use disorder treatment services, including
those provided by masters level, licensed substance use disorder treatment counselors: Provided
25
26.
further, That of the funds made available under this heading, $6,000,000 shall be available tomake grants to establish, expand, or maintain optional community-based nurse practitioner
fellowship programs that are accredited or in the accreditation process, with a preference for
those in Federally Qualified Health Centers, for practicing postgraduate nurse practitioners in
primary care or behavioral health: Provided further, That of the funds made available under this
heading, $10,000,000 shall remain available until expended for activities under section 775 of
the PHS Act: Provided further, That the United States may recover liquidated damages in an
amount determined by the formula under section 338E(c)(1) of the PHS Act if an individual
either fails to begin or complete the service obligated by a contract under section 775(b) of the
PHS Act: Provided further, That for purposes of section 775(c)(1) of the PHS Act, the Secretary
may include other mental and behavioral health disciplines as the Secretary deems appropriate:
Provided further, That the Secretary may terminate a contract entered into under section 775 of
the PHS Act in the same manner articulated in section 206 of this title for fiscal year 2025
contracts entered into under section 338B of the PHS Act: Provided further, That of the funds
made available under this heading, $10,000,000 shall be available for grants under section 756
of the PHS Act to public high schools and other entities that the Secretary may deem to be
eligible for recruiting and training students and young adults to provide behavioral health
support.
Of the funds made available under this heading, $50,500,000 shall remain available until
expended for grants to public institutions of higher education to expand or support graduate
education for physicians provided by such institutions, including funding for infrastructure
development, maintenance, equipment, and minor renovations or alterations: Provided, That, in
awarding such grants, the Secretary shall give priority to public institutions of higher education
26
27.
located in States with a projected primary care provider shortage, as determined by theSecretary: Provided further, That grants so awarded are limited to such public institutions of
higher education in States in the top half of States with a projected primary care provider
shortage, as determined by the Secretary: Provided further, That the minimum amount of a grant
so awarded to such an institution shall be not less than $1,000,000 per year: Provided further,
That such a grant may be awarded for a period not to exceed 5 years: Provided further, That
such a grant awarded with respect to a year to such an institution shall be subject to a matching
requirement of non-Federal funds in an amount that is not more than 10 percent of the total
amount of Federal funds provided in the grant to such institution with respect to such year.
MATERNAL AND CHILD HEALTH
For carrying out titles III, XI, XII, and XIX of the PHS Act with respect to maternal and child
health and title V of the Social Security Act, $1,234,944,000: Provided, That notwithstanding
sections 502(a)(1) and 502(b)(1) of the Social Security Act, not more than $228,130,000 shall be
available for carrying out special projects of regional and national significance pursuant to
section 501(a)(2) of such Act and $10,276,000 shall be available for projects described in
subparagraphs (A) through (F) of section 501(a)(3) of such Act.
RYAN WHITE HIV/AIDS PROGRAM
For carrying out title XXVI of the PHS Act with respect to the Ryan White HIV/AIDS program,
$2,581,041,000, of which $2,045,630,000 shall remain available to the Secretary through
September 30, 2027, for parts A and B of title XXVI of the PHS Act, and of which not less than
$900,313,000 shall be for State AIDS Drug Assistance Programs under the authority of section
2616 or 311(c) of such Act; and of which $175,000,000, to remain available until expended,
27
28.
shall be available to the Secretary for carrying out a program of grants and contracts under titleXXVI or section 311(c) of such Act focused on ending the nationwide HIV/AIDS epidemic, with
any grants issued under such section 311(c) administered in conjunction with title XXVI of the
PHS Act, including the limitation on administrative expenses.
HEALTH SYSTEMS
For carrying out titles III and XII of the PHS Act with respect to health care systems, and the
Stem Cell Therapeutic and Research Act of 2005, $135,009,000, of which $122,000 shall be
available until expended for facilities renovations and other facilities-related expenses of the
National Hansen's Disease Program.
RURAL HEALTH
For carrying out titles III and IV of the PHS Act with respect to rural health, section 427(a) of
the Federal Coal Mine Health and Safety Act of 1969, and sections 711 and 1820 of the Social
Security Act, $352,407,000, of which $64,277,000 from general revenues, notwithstanding
section 1820(j) of the Social Security Act, shall be available for carrying out the Medicare rural
hospital flexibility grants program: Provided, That of the funds made available under this
heading for Medicare rural hospital flexibility grants, up to $20,942,000 shall be available for
the Small Rural Hospital Improvement Grant Program for quality improvement and adoption of
health information technology, no less than $5,000,000 shall be available to award grants to
public or non-profit private entities for the Rural Emergency Hospital Technical Assistance
Program, and up to $1,000,000 shall be to carry out section 1820(g)(6) of the Social Security
Act, with funds provided for grants under section 1820(g)(6) available for the purchase and
implementation of telehealth services and other efforts to improve health care coordination for
28
29.
rural veterans between rural providers and the Department of Veterans Affairs: Providedfurther, That notwithstanding section 338J(k) of the PHS Act, $12,500,000 shall be available for
State Offices of Rural Health: Provided further, That $12,500,000 shall remain available
through September 30, 2027, to support the Rural Residency Development Program.
FAMILY PLANNING
For carrying out the program under title X of the PHS Act to provide for voluntary family
planning projects, $390,000,000: Provided, That amounts provided to said projects under such
title shall not be expended for abortions, that all pregnancy counseling shall be nondirective,
and that such amounts shall not be expended for any activity (including the publication or
distribution of literature) that in any way tends to promote public support or opposition to any
legislative proposal or candidate for public office.
HRSA-WIDE ACTIVITIES AND PROGRAM SUPPORT
For carrying out title III of the Public Health Service Act and for cross-cutting activities and
program support for activities funded in other appropriations included in this Act for the Health
Resources and Services Administration, $214,088,000, of which $38,050,000 shall be for
expenses necessary for the Office for the Advancement of Telehealth, including grants, contracts,
and cooperative agreements for the advancement of telehealth activities: Provided, That funds
made available under this heading may be used to supplement program support funding
provided under the headings "Primary Health Care", "Health Workforce", "Maternal and Child
Health", "Ryan White HIV/AIDS Program", "Health Systems", and "Rural Health".
29
30.
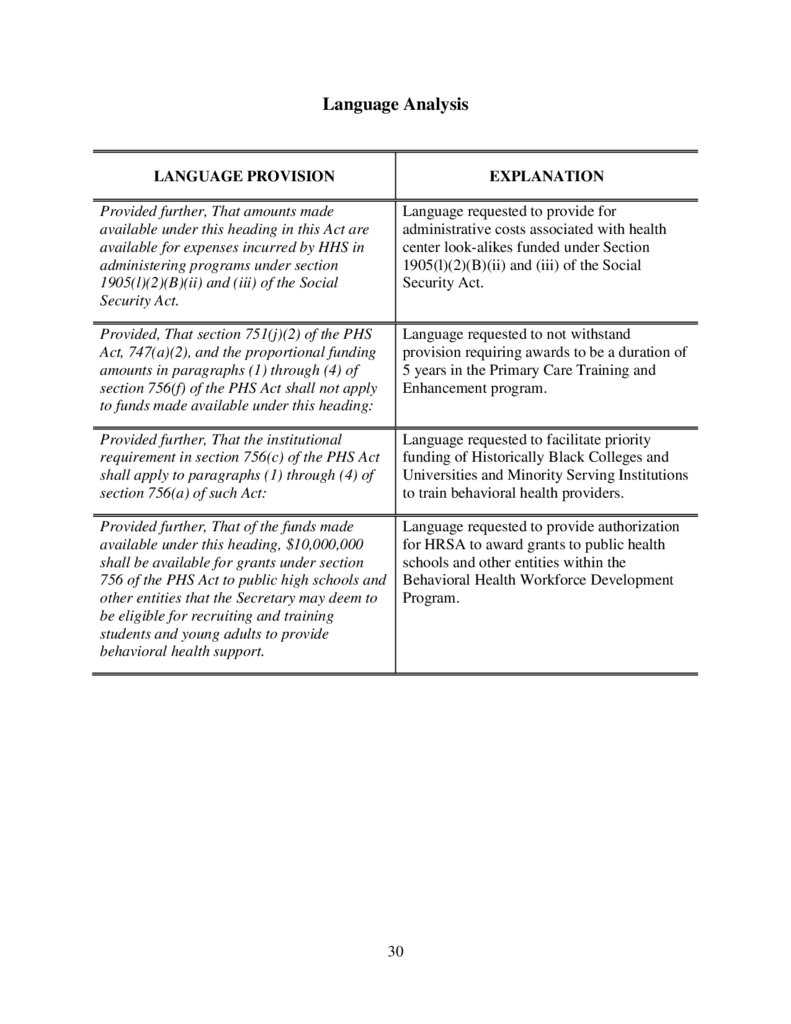
Language AnalysisLANGUAGE PROVISION
EXPLANATION
Provided further, That amounts made
available under this heading in this Act are
available for expenses incurred by HHS in
administering programs under section
1905(l)(2)(B)(ii) and (iii) of the Social
Security Act.
Language requested to provide for
administrative costs associated with health
center look-alikes funded under Section
1905(l)(2)(B)(ii) and (iii) of the Social
Security Act.
Provided, That section 751(j)(2) of the PHS
Act, 747(a)(2), and the proportional funding
amounts in paragraphs (1) through (4) of
section 756(f) of the PHS Act shall not apply
to funds made available under this heading:
Language requested to not withstand
provision requiring awards to be a duration of
5 years in the Primary Care Training and
Enhancement program.
Provided further, That the institutional
requirement in section 756(c) of the PHS Act
shall apply to paragraphs (1) through (4) of
section 756(a) of such Act:
Language requested to facilitate priority
funding of Historically Black Colleges and
Universities and Minority Serving Institutions
to train behavioral health providers.
Provided further, That of the funds made
available under this heading, $10,000,000
shall be available for grants under section
756 of the PHS Act to public high schools and
other entities that the Secretary may deem to
be eligible for recruiting and training
students and young adults to provide
behavioral health support.
Language requested to provide authorization
for HRSA to award grants to public health
schools and other entities within the
Behavioral Health Workforce Development
Program.
30
31.
Amounts Available for Obligation6FY 2024
Continuing
Resolution
FY 2025
President's
Budget7
$ 9,465,283,000
$8,233,637,000
$9,519,283,000
$9,465,283,000
$8,233,637,000
+32,000,000
+32,000,000
+32,000,000
+6,000,000
+6,000,000
+12,000,000
+4,000,000,000
+310,000,000
+5,170,000,000
+790,000,000
+6,340,000,000
+790,000,000
+4,310,000,000
+5,960,000,000
+7,130,000,000
+500,000,000
+550,000,000
+565,800,000
+126,500,000
-5,000,000
-119,875,000
$4,817,625,000
$14,368,908,000
+157,000,000
-5,000,000
-31,692,000
$ 6,636,308,000
$16,133,591,000
+320,000,000
-5,000,000
-34,200,000
$7,988,600,000
$16,254,237,000
FY 2023 Final
General Fund Discretionary Appropriation:
Appropriation
Hurricane Supplemental
Unobligated Balance of Appropriations
Permanently Reduced
Subtotal, adjusted general fund discr. Appro.
Bipartisan Safer Communities FY 2022
Advanced Appropriation
Mandatory Appropriation:
Family to Family Health Information Centers
Primary Health Care Access:
Community Health Center Fund
National Health Service Corps
Subtotal Primary Health Care Access
Maternal, Infant, and Early Childhood Home
Visiting Program
Teaching Health Centers Graduate Medical
Education
Transfer to the Department of Justice
Mandatory Sequestration
Subtotal, adjusted mandatory appropriation
Subtotal, adjusted appropriation
$9,465,283,000
+65,000,000
-11,000,000
Offsetting Collections
Subtotal Spending Authority from offsetting
collections
+18,814,000
+18,814,000
+18,814,000
+18,814,000
+18,814,000
+18,814,000
Unobligated balance, start of year
+842,000,000
+331,000,000
+ 378,000,000
Unobligated balanced end of year
+331,000,000
+378,000,000
+424,000,000
Recoveries from prior year unpaid obligations
+83,000,000
-
-
Recoveries from prior year paid obligations
Unobligated balance, lapsing
+1,000,000
-5,000,000
-
-
$15,639,722,000
$16,861,405,000
$17,075,051,000
Total Obligations
6
Excludes the following amounts for reimbursable activities carried out by this account: FY 2023 -$48,000,000 and
34 FTE; FY 2024- $44,000,000 and 35 FTE; FY 2025 $44,000,000 and 35 FTE.
7
FY 2025 level includes proposed mandatory funding for Health Centers, National Health Service Corps, Teaching
Health Centers Graduate Medical Education and Family to Family Health Information Centers
31
32.
Summary of Changes2024 Continuing Resolution
(Obligations)
$9,465,283,000
($9,465,283,000)
2025 Estimate
(Obligations)
$8,233,637,000
($8,233,637,000)
2024 Mandatory
(Obligations)
$6,641,308,000
($6,641,308,000)
2025 Mandatory
(Obligations)
$8,027,800,000
($8,027,800,000)
Net Change
No.
1
2
3
4
1
2
3
4
5
6
7
8
9
10
11
12
1
3
4
5
$154,846,000
Program
FY 2024 Continuing
Resolution
Mandatory Increases
Health Centers
Teaching Health Centers GME
Family to Family Health Info Centers
Maternal Child Health Home Visiting
Subtotal Mandatory Program Increases
Decreases:
A. Built in:
Pay Costs
FY 2025+/- FY 2024
Budget Authority
FTE
Budget
Authority
+$26,599,000
FTE
Budget Authority
2,490
$465,716,000
$492,315,000
19,313,000
1,374,000
4,398,000
313,000
25,398,000
11,988,000
1,336,000
5,566,000
371,000
19,261,000
27
13
8
69
4
26
2
32
7
35
826
1,049
197,053,000
95,581,000
59,413,000
815,700,000
15,300,000
145,000,000
10,000,000
165,000,000
31,049,000
286,479,000
163,800,000
1,984,375,000
253,553,000
105,581,000
69,413,000
10,000,000
831,714,000
30,300,000
172,000,000
15,500,000
175,000,000
67,049,000
390,000,000
163,800,000
2,283,910,000
+4
+2
+4
+2
+1
+ 18
+ 10
+ 41
+56,500,000
+10,000,000
+10,000,000
+10,000,000
+16,014,000
+15,000,000
+27,000,000
+5,500,000
+10,000,000
+36,000,000
+103,521,000
+299,535,000
344
16
1
51
412
5,170,000,000
157,000,000
5,658,000
518,650,000
5,851,308,000
6,340,000,000
320,000,000
12,000,000
565,800,000
7,237,800,000
+ 60
+1
61
+1,170,000,000
+163,000,000
+$6,342,000
+$47,150,000
+1,386,492,000
2,490
465,716,000
492,315,000
+102
+26,599,000
Increases:
A. Built in:
January 2025 Civilian Pay Raise
January 2025 Military Pay Raise
Civilian Annualization of Jan. 2025
Military Annualization of Jan. 2025
Subtotal, built-in increases
B. Program:
Discretionary Increases
Behavioral Health Workforce Development Programs
Advanced Nursing Education
Nurse Education, Practice and Retention
Health Care Workforce Innovation Program
Maternal and Child Health Block Grant
Innovation for Maternal Health
Healthy Start
Screening and Treatment for Maternal Depression
Ending HIV Epidemic Initiative
Organ Transplantation
Family Planning
Program Management
Subtotal Discretionary Program Increases
FY 2025
President's Budget
32
+102
-7,325,000
-38,000
+ 1,168,000
+ 58,000
-6,137,000
33.
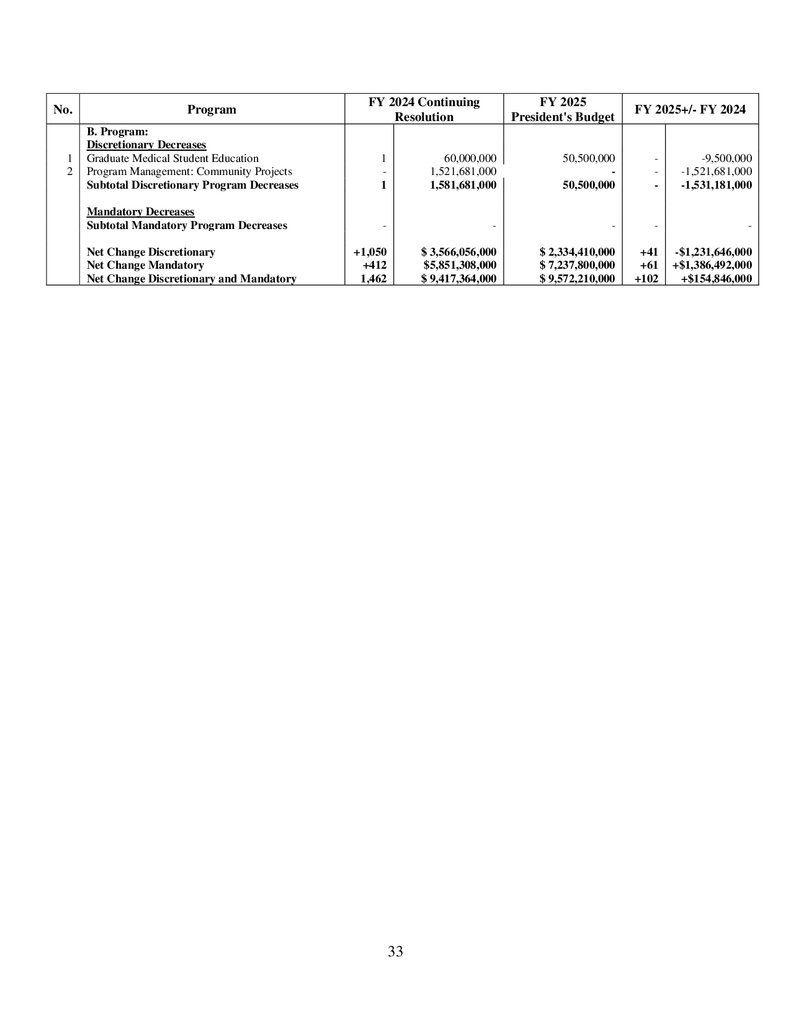
No.1
2
Program
FY 2024 Continuing
Resolution
FY 2025
President's Budget
FY 2025+/- FY 2024
B. Program:
Discretionary Decreases
Graduate Medical Student Education
Program Management: Community Projects
Subtotal Discretionary Program Decreases
1
1
60,000,000
1,521,681,000
1,581,681,000
50,500,000
50,500,000
-
-9,500,000
-1,521,681,000
-1,531,181,000
Mandatory Decreases
Subtotal Mandatory Program Decreases
-
-
-
-
-
+1,050
+412
1,462
$ 3,566,056,000
$5,851,308,000
$ 9,417,364,000
$ 2,334,410,000
$ 7,237,800,000
$ 9,572,210,000
+41
+61
+102
-$1,231,646,000
+$1,386,492,000
+$154,846,000
Net Change Discretionary
Net Change Mandatory
Net Change Discretionary and Mandatory
33
34.
Authorizing Legislation8,4FY 2024
Amount Authorized
FY 2024
Amount
Appropriated
FY 2025 Amount
Authorized
FY 2025
President’s
Budget
Authorized for FY
2024 (and each
subsequent year), an
amount equal to the
previous year’s
funding adjusted by
the product of one
plus the average
percentage increase
in costs incurred per
patient served and
one plus the average
percentage increase
in the total number of
patients served
$1,737,722,000
Expired
$1,737,722,000
Expired
Current Law:
$1,753,425,000
Proposed:
$3,416,575,000
Total:
$5,170,000,000
Expired
$6,340,000,000
PRIMARY HEALTH CARE:
Health Centers (Discretionary):
Public Health Service (PHS) Act,
Section 330, as amended (and
specifically subsection 330(r)(1)),
including by P.L. 111-148, Section
5601; as amended by P.L. 115-123,
Division E, Title IX, Section 50901; as
amended by P.L. 116-136, Division A,
Title III, Section 3211; as amended by
P.L. 116-260, Consolidated
Appropriations Act, 2021, Division BB,
Title III, Section 311
Note: P.L. 117-2, American Rescue Plan
Act, Title II, Subtitle G, Section 2601
Health Centers (Community Health
Center Fund) (Mandatory):
P.L. 111-148, Patient Protection and
Affordable Care Act, Section
10503(b)(1); as amended by P.L 111152, Section 2303; as amended by P.L.
114-10, Section 221; as amended by
P.L. 115-96, Division C, Title I, Section
3101; as amended by P.L. 115-123,
Division E, Title IX, Section 50901; as
amended by P.L. 116-59, Continuing
Appropriations Act, 2020, and Health
Extenders Act of 2019, Division B, Title
I, Section 1101; as amended by P.L.
116-69, Further Continuing
Appropriations Act, 2020, and Further
Health Extenders Act of 2019, Division
B, Title I, Section 1101; as amended by
P.L. 116-94, Further Consolidated
Appropriations Act, 2020, Division N,
Title I, Subtitle D, Sec. 401; as amended
by P.L. 116-136, CARES Act, Division
A, Title III, Section 3831; as amended
by P.L. 116-159, Continuing
Appropriations Act, 2021 and Other
Extensions Act, Division C, Title I,
Section 2101; as amended by P.L. 116215, Further Continuing Appropriations
Act, 2021, and Other Extensions Act,
Division B, Title II, Section 1201; as
8
Where authorizations of appropriations ended in prior fiscal years, authority still exists for particular activities if
the enabling authorities continue to exist and if current appropriations extend to the programmatic activities.
34
35.
FY 2024Amount Authorized
FY 2024
Amount
Appropriated
FY 2025 Amount
Authorized
FY 2025
President’s
Budget
amended by P.L. 116-260, Consolidated
Appropriations Act, 2021, Division BB,
Title III, Sec. 301; as amended by P.L.
118-15, Continuing Appropriations Act,
2024 and Other Extensions, Sec. 2321;
as amended by P.L. 118-22, Further
Continuing Appropriations and Other
Extensions Act, 2024, Section 201.
(see 42 U.S.C. 254b-2)
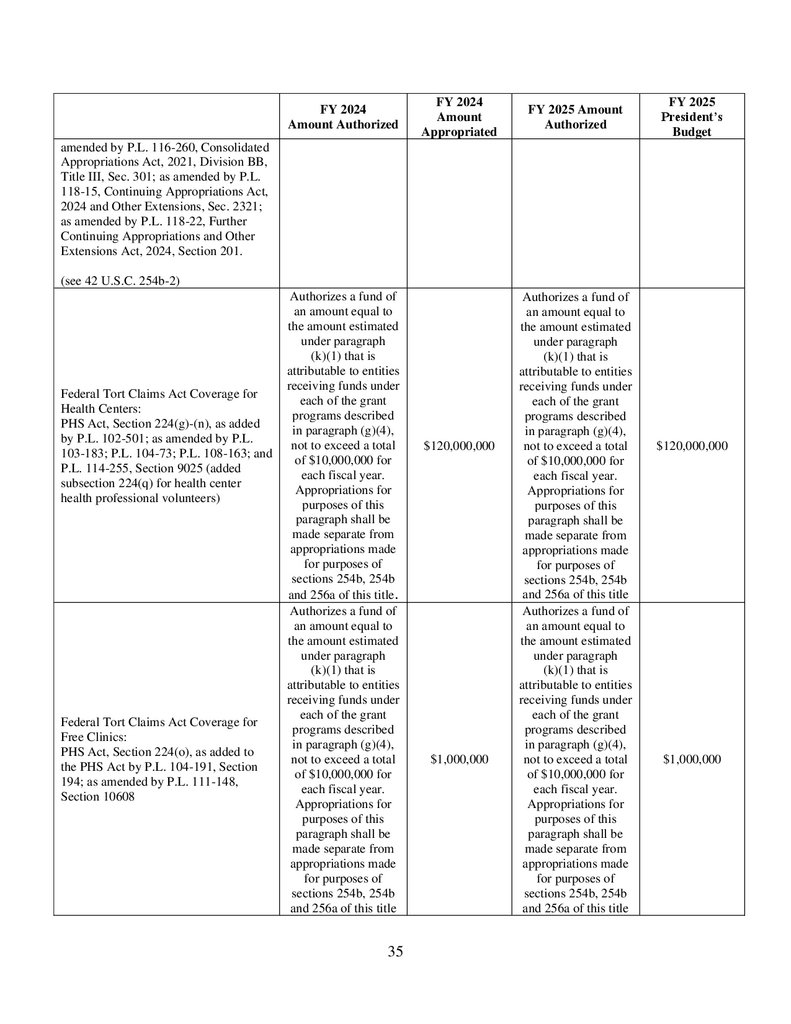
Federal Tort Claims Act Coverage for
Health Centers:
PHS Act, Section 224(g)-(n), as added
by P.L. 102-501; as amended by P.L.
103-183; P.L. 104-73; P.L. 108-163; and
P.L. 114-255, Section 9025 (added
subsection 224(q) for health center
health professional volunteers)
Federal Tort Claims Act Coverage for
Free Clinics:
PHS Act, Section 224(o), as added to
the PHS Act by P.L. 104-191, Section
194; as amended by P.L. 111-148,
Section 10608
Authorizes a fund of
an amount equal to
the amount estimated
under paragraph
(k)(1) that is
attributable to entities
receiving funds under
each of the grant
programs described
in paragraph (g)(4),
not to exceed a total
of $10,000,000 for
each fiscal year.
Appropriations for
purposes of this
paragraph shall be
made separate from
appropriations made
for purposes of
sections 254b, 254b
and 256a of this title.
Authorizes a fund of
an amount equal to
the amount estimated
under paragraph
(k)(1) that is
attributable to entities
receiving funds under
each of the grant
programs described
in paragraph (g)(4),
not to exceed a total
of $10,000,000 for
each fiscal year.
Appropriations for
purposes of this
paragraph shall be
made separate from
appropriations made
for purposes of
sections 254b, 254b
and 256a of this title
35
$120,000,000
$1,000,000
Authorizes a fund of
an amount equal to
the amount estimated
under paragraph
(k)(1) that is
attributable to entities
receiving funds under
each of the grant
programs described
in paragraph (g)(4),
not to exceed a total
of $10,000,000 for
each fiscal year.
Appropriations for
purposes of this
paragraph shall be
made separate from
appropriations made
for purposes of
sections 254b, 254b
and 256a of this title
$120,000,000
$1,000,000
36.
Liability Protections for HealthProfessional Volunteers at Community
Health Centers:
PHS Act, Section 224(q), as added by
P.L. 114-255, Section 9025; as amended
by Continuing Appropriations and
Ukraine Supplemental Appropriations
Act 2023, Title III, section 301
FY 2024
Amount Authorized
FY 2024
Amount
Appropriated
FY 2025 Amount
Authorized
FY 2025
President’s
Budget
Not Specified
---
Not Specified
---
HEALTH WORKFORCE:
National Health Service Corps (NHSC)
(Discretionary)
PHS Act, Sections 331-338, and 338AH as amended by P.L. 110-355, Section
3; as amended by P.L. 111-148, Section
10501(n)(1)- (5)
Authorized for FY
2024 (and each
subsequent year),
based on previous
year’s funding,
subject to adjustment
formula
36
$125,600,000
Authorized for FY
2025 (and each
subsequent year),
based on previous
year’s funding,
subject to adjustment
formula
$125,600,000
37.
NHSC (Fund) (Mandatory):P.L. 111-148, Patient Protection and
Affordable Care Act, Section
10503(b)(2), as amended by P.L. 11410, Section 221 [see 42 USC 254b-2
stand-alone provision—not in PHS Act],
as amended by P.L. 115-96, Section
3101(b)(3)(F); as amended by P.L. 115123, Section 50901, as amended by P.L.
116-59, Division B, Title I, Section
1101, as amended by P.L. 116-69,
Further Continuing Appropriations Act,
2020, and Further Health Extenders Act
of 2019, Division B, Title I, Section
1101, as amended by P.L. 116-94,
Further Consolidated Appropriations
Act, 2020, Division N, Title I, Subtitle
D, Section 401; as amended by P.L.
116-136, CARES Act, Division A, Title
III, Section 3831; as amended by P.L.
116-159, Continuing Appropriations
Act, 2021 and Other Extensions Act,
Division C, Title I, Section 2101; as
amended by P.L. 116-215, Further
Continuing Appropriations Act, 2021,
and Other Extensions Act, Division B,
Title II, Section 1201; as amended by
P.L. 116-260, Consolidated
Appropriations Act, 2021, Division BB,
Title III, Section 301
(see 42 U.S.C. 254b-2); as amended by
P.L. 118-15, Continuing Appropriations
Act 2024 and Other Extensions Act,
section 2321(c); as amended by P.L.
118-22, Further Continuing
Appropriations and Other Extensions
Act, 2024, Section 201.
Mental Health and Substance Use
Disorder Training for Health Care
Professionals, Paraprofessionals, and
Public Safety Officers:
American Rescue Plan Act, Section
2705 (P.L. 117-2)
Grants for Health Care Providers to
Promote Mental Health Among Their
Health Professional Workforce:
American Rescue Plan Act, Section
2705 (P.L. 117-2)
FY 2024
Amount Authorized
FY 2024
Amount
Appropriated
FY 2025 Amount
Authorized
FY 2025
President’s
Budget
Expired
Current Law:
$135,890,000
Proposed:
$654,110,000
Total:
$790,000,000
Expired
$790,000,000
---
---
---
---
---
---
---
---
37
38.
FY 2024Amount Authorized
NHSC Students to Service Loan
Repayment Program:
PHS Act, Sections 338B, as amended by
P.L. 107-251, Section 310; as amended
by P.L. 108-163, Section 2; as amended
by P.L. 111-148, Section 10501
State Loan Repayment Program
(SLRP):
PHS Act, Section 338I(a)-(i), as
amended by P.L. 107-251, Section 315;
as further amended by P.L. 110-355,
Section 3(e)(2)
FY 2024
Amount
Appropriated
Indefinite
FY 2025 Amount
Authorized
FY 2025
President’s
Budget
Indefinite
Note: An amount
based on previous
year’s funding,
subject to adjustment
formula
Expired
Note: The American
Rescue Plan Act
(P.L. 117-2), Section
2602(b) set-aside
$100,000,000 to the
SLRP (to remain
available until
expended) from the
$800,000,000
appropriated to the
National Health
Service Corps
(Section 2602(a))
---
---
Loan Repayments and Fellowships
Regarding Faculty Positions (Faculty
Loan Repayment):
PHS Act, Section 738(a) and 740(b), as
amended by P.L. 111-148, Sections
5402 and 10501(d); as amended by P.L.
116-136, CARES Act, Section 3401
$1,190,000
(through FY 2025)
$2,310,000
$1,190,000
(through FY 2025)
$2,310,000
Centers of Excellence:
PHS Act, Section 736, as amended by
P.L. 111-148, Section 5401); as
amended by P.L. 116-136, CARES Act,
Section 3401
$23,711,000
(through FY 2025)
$28,422,000
$23,711,000
(through FY 2025)
$28,422,000
Scholarships for Disadvantaged
Students:
PHS Act, Section 737, as amended by
P.L. 111-148, Section 5402(b),
authorization of appropriations in
Section 740(a); as amended by P.L. 116136, CARES Act, Section 3401
$51,470,000
(through FY 2025)
$55,014,000
$51,470,000
(through FY 2025)
$55,014,000
Health Careers Opportunity Program:
PHS Act, Section 739, as amended by
P.L. 111-148, Section 5402,
authorization of appropriation in Section
740(c); as amended by P.L. 116-136,
CARES Act, Section 3401
$15,000,000
(through FY 2025)
$16,000,000
$15,000,000
(through FY 2025)
$16,000,000
38
39.
National Center for WorkforceAnalysis:
PHS Act, Section 761(e), as amended by
P.L. 111-148, Section 5103; as amended
by P.L. 116-136, CARES Act, Section
3401
Primary Care Training and
Enhancement:
PHS Act, Section 747, as amended by
P.L. 111-148, Section 5301; as amended
by P.L. 116-136, CARES Act, Section
340; as amended by the Bipartisan
Safter Communities Act (BSCA) P.L.
117-159
Oral Health Training Programs
(Training in General, Pediatric, and
Public Health Dentistry):
PHS Act, Section 748, as added by P.L.
111-148, Section 5303; as amended by
P.L. 116-136, CARES Act, Section
3401
Graduate Medical Education for
Physicians:
as added by P.L. 115-245, Division B,
Title II; as amended by P.L. 116-260,
Consolidated Appropriations Act, 2021,
Division H, Title II
Interdisciplinary, Community-Based
Linkages:
Area Health Education Centers:
PHS Act, Section 751, as amended by
P.L. 111-148, Section 5403; as amended
by P.L. 113-128, Section 512(z)(2); as
amended by P.L. 116-136, CARES Act,
Section 3401
Education and Training Related to
Geriatrics [Geriatric Workforce
Enhancement Program (GWEP) and
Geriatric Academic Career Awards
(GACA)]:
PHS Act, Section 753, as amended by
P.L. 111-148, Section 5305; as amended
by P.L. 116-136, CARES Act, Section
3403
Mental and Behavioral Health
Education and Training Programs
(MBHET):
PHS Act, Section 756, as added by P.L.
111-148, Section 5306; as amended by
P.L. 114-255, Section 9021; as amended
by P.L. 115-271, Section 7073(b); as
FY 2024
Amount Authorized
FY 2024
Amount
Appropriated
FY 2025 Amount
Authorized
FY 2025
President’s
Budget
$5,663,000
(through FY 2025)
$5,663,000
$5,663,000
(through FY 2025)
$5,663,000
$60,000,000
(through FY 2026)
$49,924,000
$60,000,000
(through FY 2026)
$49,924,000
$28,531,000
(through FY 2025)
$42,673,000
$28,531,000
(through FY 2025)
$42,673,000
--
$60,000,000
--
$50,500,000
$41,250,000
(through FY 2025)
$47,000,000
$41,250,000
(through FY 2025)
$47,000,000
$40,737,000 (through
FY 2025)
$47,245,000
$40,737,000 (through
FY 2025)
$47,245,000
MBHET:
$50,000,000 (through
FY 2027)
PHS Act, Section
756, Subsection
(a)(1)-- $15,000,000
39
$197,053,000
MBHET:
$50,000,000 (through
FY 2027)
$253,553,000
40.
FY 2024Amount Authorized
amended by section 1311 of chapter 2 of
subtitle C of title I of division FF of the
Consolidated Appropriations Act, 2023
(Pub. L. 117-328)
Behaviors Health Workforce
Education and Training (BHWET)
Graduate Psychology Education
(GPE)
Opioid Impacted Family Support
Program (OIFSP)
Behavioral Health Workforce
Technical Assistance and
Evaluation (BHWD TAE) Program
(also authorized under PHS Act 755
and 799)
Training Demonstration Programs: PHS
Act, 760; as amended by section 1311 of
chapter 2 of subtitle C of title I of
division FF of the Consolidated
Appropriations Act, 2023 (Pub. L. 117328)
• Addiction Medicine Fellowship
(AMF)
• Integrated Substance Use
Disorder Training Program
(ISTP)
Substance Use Disorder Treatment
Workforce (STAR) Loan Repayment
Program (LRP): PHS Act Section 781;
as amended by P.L. 115-271, Section
7071
FY 2024
Amount
Appropriated
FY 2025 Amount
Authorized
Subsection (a)(2)
$15,000,000;
PHS Act, Section
756, Subsection
(a)(1)-- $15,000,000
Subsection (a)(3):
$10,000,000;
Subsection (a)(2)
$15,000,000;
Subsection (a)(4):
$10,000,000
Subsection (a)(3):
$10,000,000;
Subsection (a)(4):
$10,000,000
$31,700,000 through
FY 2027
$31,700,000 through
FY2027
Expired
Expired
40
FY 2025
President’s
Budget
41.
Training for Health Care Providers:PHS Act, Section 763 as added by P.L.
117-103, Consolidated Appropriations
Act, 2022, Section 132
Public Health /Preventive Medicine:
PHS Act, Sections 765-768, as amended
by P.L. 111-148, Section 10501; as
amended by P.L. 116-136, CARES Act,
Section 3401 (amends PHS Act, Section
766)
FY 2024
Amount Authorized
FY 2024
Amount
Appropriated
FY 2025 Amount
Authorized
FY 2025
President’s
Budget
$5,000,000
(through FY 2027)
---
$5,000,000
(through FY 2027)
---
$17,000,000 (through
FY 2025)
$18,000,000
$17,000,000 (through
FY 2025)
$18,000,000
Note: PHS Act, Section 770 provides
the authorization of appropriations for
subpart 2 of Part E of Title VII, which
includes Sections 765-768
Nursing Workforce Development:
Advanced Education Nursing:
PHS Act, Section 811, as amended by
P.L. 111-148, Title V, Subtitle D,
Section 5308; as amended by P.L. 116136, CARES Act, Section 3404
Note: PHS Act, Section 871(a) provides
an authorization of appropriations of
$137,837,000 for all programs under
Title VIII Parts B, C, and D, which
includes PHS Act, Section 811
Nursing Workforce Diversity
PHS Act, Section 821, as amended by
P.L. 111-148, Section 5404; as amended
by P.L. 116-136, CARES Act, Section
3404
Note: PHS Act, Section 871(a) provides
an authorization of appropriations of
$137,837,000 for all programs under
Title VIII Parts B, C, and D, which
includes PHS Act, Section 821
See PHS Act, Section
871(a), which
authorizes
appropriations of
$137,837,000 for all
programs under Title
VIII Parts B, C, and
D.
See PHS Act, Section
871(a), which
authorizes
appropriations of
$137,837,000 for all
programs under Title
VIII Parts B, C, and
D.
41
$95,581,000
See PHS Act, Section
871(a), which
authorizes
appropriations of
$137,837,000 for all
programs under Title
VIII Parts B, C, and
D. Through FY 2025
$105,581,000
$24,343,000
See PHS Act, Section
871(a), which
authorizes
appropriations of
$137,837,000 for all
programs under Title
VIII Parts B, C, and
D. Through FY 2025
$24,343,000
42.
FY 2024Amount
Appropriated
FY 2025 Amount
Authorized
FY 2025
President’s
Budget
$59,413,000
See PHS Act, Section
871(a), which
authorizes
appropriations of
$137,837,000 for all
programs under Title
VIII Parts B, C, and
D. Through FY 2025
$69,413,000
$28,500,000
See PHS Act, Section
871(a), which
authorizes
appropriations of
$137,837,000 for all
programs under Title
VIII Parts B, C, and
D. Through FY 2025
$28,500,000
See PHS Act, Section
871(b), which
authorized
appropriations of
$117,135,000 for all
programs under Title
VIII Part E
$92,635,000
See PHS Act, Section
871(b), which
authorized
appropriations of
$117,135,000 for all
programs under Title
VIII Part E. Through
FY 2025
$92,635,000
Expired
$385,000,000
Expired
$385,000,000
FY 2024
Amount Authorized
Nurse Education, Practice, Quality and
Retention:
PHS Act, Section 831, as amended by
P.L. 111-148, Sec. 5309; as amended by
P.L. 116-136, the CARES Act, Section
3404
(*Note: PHS Act, Section 831A
previously authorized the program with
section 831, but was struck by P.L. 116136, CARES Act)
Note: PHS Act, Section 871(a) provides
an authorization of appropriations of
$137,837,000 for all programs under
Title VIII Parts B, C, and D, which
includes PHS Act, Section 831
Nurse Faculty Loan Program:
PHS Act, Section 846A, as amended by
P.L. 111-148, Section 5311; as amended
by P.L. 116-136, CARES Act, Section
3404
Note: PHS Act, Section 871(a) provides
an authorization of appropriations of
$137,837,000 for all programs under
Title VIII Parts B, C, and D, which
includes PHS Act, Section 846A
NURSE Corps (formerly Nursing
Education Loan Repayment and
Scholarship Programs):
PHS Act, Section 846, as amended by
P.L. 107-205, Section 103; and for
NURSE Corps Loan Repayment only,
as amended by P.L. 111-148, Section
5310(a); as amended by P.L. 116-136,
CARES Act, Section 3404
Note: PHS Act, Section 871(b) provides
an authorization of appropriations of
$117,135,000 for all programs under
Title VIII Part E, which includes PHS
Act, Section 846
Children’s Hospitals Graduate Medical
Education (GME) Program:
PHS Act, Section 340E, as amended by
P.L. 106-129, Section 4; as amended by
P.L. 106-310, Section 2001; as amended
by P.L. 108-490, Section 1; as amended
by P.L. 109-307, Section 2; as amended
by P.L. 113-98, Sections 2, 3; as
amended by P.L. 115-241, Section 2
See PHS Act, Section
871(a), which
authorizes
appropriations of
$137,837,000 for all
programs under Title
VIII Parts B, C, and
D.
See PHS Act, Section
871(a), which
authorizes
appropriations of
$137,837,000 for all
programs under Title
VIII Parts B, C, and
D.
42
43.
FY 2024Amount
Appropriated
FY 2025 Amount
Authorized
FY 2025
President’s
Budget
Current Law:
$55,452,000
Proposed:
$101,548,000
Total:
$157,000,000
Expired
$320,000,000
Such sums as may
be- necessary
(permanent)
---
Such sums as may
be- necessary
(permanent)
---
Not Specified
$18,814,000
Not Specified
$18,814,000
FY 2024
Amount Authorized
Teaching Health Centers (THC)
Graduate Medical Education (GME)
Program:
PHS Act, Section 340H, as added by
P.L. 111-148, Section.5508; as amended
by P.L. 114-10, Section 221; as
amended by P.L. 115-63, Section
301(a), as amended by P.L. 115-96
Section 3101(c)(2); as amended by P.L.
115-123, Section. 50901 as amended by
P.L. 116-59, Continuing Appropriations
Act, 2020, and Health Extenders Act of
2019, Section 1101, as amended by P.L.
116-69, Further Continuing
Appropriations Act, 2020, and Further
Health Extenders Act of 2019,Section
1101, as amended by P.L. 116-94,
Division N, Title I, Subtitle D, Section
401; as amended by P.L. 116-136,
CARES Act, Section 3831; as amended
by P.L. 116-159, Continuing
Appropriations Act, 2021 and Other
Extensions Act, Section 2101; as
amended by P.L. 116-215, Further
Continuing Appropriations Act, 2021,
and Other Extensions Act, Section 1201;
as amended by P.L. 116-260,
Consolidated Appropriations Act, 2021,
Title III, Subtitle A, Section 301; as
amended by P.L. 118-15, Continuing
Appropriations Act, 2024 and Other
Extensions Act, Section 2321(a); as
amended by P.L. 118-22, Further
Continuing Appropriations and Other
Extensions Act, 2024.
Teaching Health Centers (THC)
Development Grants:
PHS Act, Section 749A, as added by
P.L. 111-148, Section 5508)
National Practitioner Data Bank (User
Fees)
Social Security Act (SSA) sections 1921
and 1128E
Title IV, P.L. 99-660; Section 5, P.L.
100-93, SSA Section 1921; Section
221(a), P.L. 104-191, SSA Section
1128E
(also includes: Health Care Integrity
and Protection Data Bank (HIPDB),
SSA, Section 1128E)
Expired
43
44.
FY 2024Amount Authorized
FY 2024
Amount
Appropriated
FY 2025 Amount
Authorized
FY 2025
President’s
Budget
---
---
---
---
Grants for Innovative Programs:
PHS Act, Section 340G, as amended by
P.L. 115-302, Section 3
Expired
---
Expired
---
Pediatric Loan Repayment:
PHS Act, Section 775, as added by P.L.
111-148, Section. 5203; as amended by
P.L. 116-136, CARES Act, Section
3401
Such sums as may be
necessary (through
FY 2025)
$10,000,000
Such sums as may be
necessary (through
FY 2025)
$10,000,000
Supporting the Mental Health of the
Health Professions Workforce: PHS
Act, Section 764, as amended by P.L.
117-105, Section 4
$35,000,000 (through
FY 2024)
---
Expired
---
Health Professional Shortage Areas:
PHS Act, Section 332, as amended by
P.L. 115-320, Section 2, added a new
Subsection (k) authority for “Maternity
Care Health Professional Target Areas”
Education and awareness initiative
encouraging use of mental health and
substance use disorder services by
health care professionals: as added by
P.L. 117-105, Section 3
$10,000,000 (through
FY 2024)
Expired
42 USC 294t note.
Health Care Workforce Innovation: PHS
Act, Section 741, 807
Expired
---
Expired
$10,000,000
$850,000,000
(permanent)
$815,700,000
$850,000,000
(permanent)
$831,714,000
$9,000,000
(through FY 2027)
$15,300,000
$9,000,000
(through FY 2027)
$30,300,000
$10,000,000 (through
FY 2027)
$10,000,000
$10,000,000 (through
FY 2027)
$10,000,000
$10,000,000 (through
FY 2027)
$7,000,000
$10,000,000 (through
FY 2027)
$7,000,000
MATERNAL AND CHILD
Maternal and Child Health Block Grant:
Social Security Act, Title V, as amended
by P.L. 106-554, Section 921
Innovation for Maternal Health (AIM):
PHS Act, Section 330O as added by
P.L. 117-103, Consolidated
Appropriations Act, 2022, Section 131
Integrated Services for Pregnant and
Postpartum Women: PHS Act, Section
330P as added by P.L. 117-103,
Consolidated Appropriations Act, 2022,
Section 134(a)
Maternal Mental Health Hotline:
PHS Act, Section 399V–7 as added by
P.L. 117-328, Consolidated
Appropriations Act, 2023, section 1112
44
45.
Autism Education, Early Detection andIntervention:
PHS Act, Section 399BB, as added by
P.L. 109-416, Section 3; as amended by
P.L. 112-32, Section 2; as amended by
P.L. 113-157, Section 4; as amended by
P.L. 116-60, Autism Collaboration,
Accountability, Research, Education,
and Support Act of 2019, Section 3
Sickle Cell Service Demonstration
Grants:
P.L. 108-357, American Jobs Creation
Act of 2004, Section 712(c), as amended
by P.L. 115-327, Section 3 (which
transferred Section 712(c) of P. L. 108–
357, and re-designated it as PHS Act,
Section 1106)
Early Hearing Detection and
Intervention:
PHS Act, Section 399M, as added by
P.L. 106-310, Section 702; as amended
by P.L. 111-337, Section 2; as amended
by P.L. 115-71, Section 2; as amended
by P.L. 117-241, Early Hearing
Detection and Intervention Act of 2022,
Section 2
Emergency Medical Services for
Children:
PHS Act, Section 1910, as amended by
P.L. 105-392, Section 415; as amended
by P.L. 111-148, Section 5603(1); as
amended by P.L. 113-180, Section 2; as
amended by P.L. 116-49, Emergency
Medical Services for Children Program
Reauthorization Act of 2019, Section 2
Healthy Start:
PHS Act, Section 330H, as added by
P.L. 106-310, Section 1501; as amended
by P.L. 110-339, Section 2; as amended
by P.L. 116-136, CARES Act, Section
3225
Heritable Disorders:
PHS Act, Sections 1109-1112, 1114,
and 1117, as amended by P.L. 106-310,
Section 2601; as amended by P.L. 110204, Section 2; as amended by P.L. 110237, Section 1; as amended by P.L. 113240, Section 10
FY 2024
Amount Authorized
FY 2024
Amount
Appropriated
FY 2025 Amount
Authorized
FY 2025
President’s
Budget
$50,599,000
(through FY 2024)
$56,344,000
Expired
$56,344,000
Expired
$8,205,000
Expired
$8,205,000
$17,818,000 (through
2027)
$18,818,000
$17,818,000 (through
2027)
$18,818,000
$22,334,000 (through
FY 2024)
$24,334,000
Expired
$24,334,000
$125,500,000
(through FY2025)
$145,000,000
$125,500,000
(through FY2025)
$172,000,000
Expired
$20,883,000
Expired
$20,883,000
45
46.
Pediatric Mental Health Care AccessGrants:
PHS Act, Section 330M, as added by
P.L. 114-255, Section 10002; as
amended by P.L. 117-159, Bipartisan
Safer Communities Act, Section 11005
Screening and Treatment for Maternal
Mental Health and Substance Use
Disorders (formerly Screening and
Treatment for Maternal Depression):
PHS Act, Section 317L-1, as added by
P.L. 114-255, Section 10005; as
amended by P.L. 117-328, Consolidated
Appropriations Act, 2023, section 1111
Poison Control:
PHS Act, Sections 1271-1274, as
amended by P.L. 108-194; as amended
by P.L. 110-377; as amended by P.L.
113-77; as amended by P.L. 116-94,
Further Consolidated Appropriations
Act, 2020, Division N, Title I, Subtitle
D, Section 403
Family to Family Health Information
Centers:
Social Security Act, Section
501(c)(1)(A), as added by P.L. 109-171,
Section 6064; reauthorized by P.L. 111148, Sec. 5507(b), as amended by P.L.
112-240, Section 624; as amended by
P.L. 113-67, Section 1203; as amended
by P.L. 113-93, Section 207; as
amended by P.L. 114-10, Section 216;
as amended by P.L. 115-123, Section
50501; as amended by P.L. 116-39,
Sustaining Excellence in Medicaid Act
of 2019, Section 5
9
FY 2024
Amount Authorized
FY 2024
Amount
Appropriated
FY 2025 Amount
Authorized
FY 2025
President’s
Budget
$31,000,000 (through
FY 2027)
$13,000,000
$31,000,000 (through
FY 2027)
$13,000,000
$24,000,000 (through
FY 2027)
$10,000,000
$24,000,000 (through
FY 2027)
$15,500,000
$26,846,000
Expired
$26,846,000
$5,658,0009
Expired
$12,000,000
Toll-free number:
$700,000
Media campaign:
$800,000
Grant program:
$28,600,000
(through FY 2024)
$6,000,000 (through
FY 2024)
Post-sequestration funding level.
46
47.
FY 2024Amount Authorized
FY 2024
Amount
Appropriated
FY 2025 Amount
Authorized
FY 2025
President’s
Budget
$550,000,000
$518,650,00010
$600,000,000
$565,800,00011
Expired
$680,752,000
Expired
$680,752,000
Expired
$1,364,878,000
Expired
$1,364,878,000
Expired
$900,313,000
Expired
$900,313,000
Early Intervention Services – Part C:
PHS Act, Sections 2651-67, as amended
by P.L. 106-345, as amended by P.L.
109-415, as amended by P.L. 111-87
Expired
$208,970,000
Expired
$208,970,000
Coordinated Services and Access to
Research for Women, Infants, Children
and Youth - Part D:
PHS Act, Section 2671, as amended by
P.L. 106-345, as amended by P.L. 109415, as amended by P.L. 111-87
Expired
$77,935,000
Expired
$77,935,000
Maternal, Infant and Early Childhood
Visiting (MIECHV) Program:
Social Security Act, Section 511, as
added by P.L. 111-148, Section 2951; as
amended by P.L. 113-93, Section 209;
as amended by P.L. 114-10, Sec. 218; as
amended by P.L. 115-123, Sections
50601-50607; as amended by P.L. 116260, Consolidated Appropriations Act,
2021, Section 10; as amended by P.L.
117-2, American Rescue Plan Act, Title
IX, Part 4, Section 9101 (new Social
Security Act, Section 511A added after
Section 511); as amended by the
Continuing Appropriations and Ukraine
Supplemental Appropriations Act, P.L.
117-180); as amended by P.L. 117-328,
Consolidated Appropriations Act, 2023,
section 6101
HIV/AIDS:
Emergency Relief - Part A
PHS Act, Sections 2601-10, as amended
by P.L. 106-345; as amended by P.L.
109-415; as amended by P.L. 111-87
Comprehensive Care - Part B:
PHS Act, Sections 2611-31, as amended
by P.L. 106-345, as amended by P.L.
109-415, as amended by P.L. 111-87
AIDS Drug Assistance Program (NonAdd)
PHS Act, Sections 2611-31 and 2616, as
amended by P.L. 106-345, as amended
by P.L. 109-415, as amended by P.L.
111-87
10
11
Post-sequestration funding level
Post-sequestration funding level
47
48.
AIDS Education and Training Centers Part F: PHS Act, Section 2692(a), asamended by P.L. 106-345, as amended
by P.L. 109-415, as amended by P.L.
111-87
Dental Reimbursement Program - Part
F: PHS Act, Section 2692(b), as
amended by P.L. 106-345, as amended
by P.L.109-415, as amended by
P.L.111-87
Special Projects of National
Significance - Part F: PHS Act, Section
2691, as amended by P.L. 104-146, as
amended by P.L. 109-415, as amended
by P.L. 111-87
Ending HIV Epidemic Initiative:
PHS Act, Section 311and PHS Act,
Title XXVI
HEALTH SYSTEMS:
Organ Transplantation:
PHS Act, Sections 371-378, as amended
by P.L. 108-216,
P.L. 109-129, P.L. 110-144, P.L. 110413, and P.L. 113-51; as amended by
P.L. 118-14, Securing the U.S. Organ
Procurement and Transplantation
Network Act
National Cord Blood Inventory:
PHS Act, Section 379; as amended by
P.L. 109-129, Section 3; as amended by
P.L. 111-264; as amended by P.L. 114104, Section 3; as amended by
TRANSPLANT Act of 2021, Section 3,
P.L. 117-15
C.W. Bill Young Cell Transplantation
Program:
PHS Act, Sections 379-379B, as
amended by P.L. 109-129, Section 3; as
amended by P.L. 111-264; as amended
by P.L. 114-104, Section 2;
TRANSPLANT Act of 2021, Section 2,
P.L. 117-15
FY 2024
Amount Authorized
FY 2024
Amount
Appropriated
FY 2025 Amount
Authorized
FY 2025
President’s
Budget
Expired
$34,886,000
Expired
$34,886,000
Expired
$13,620,000
Expired
$13,620,000
Expired
$25,000,000
Expired
$25,000,000
Expired
$165,000,000
Expired
$175,000,000
Expired
$31,049,000
Expired
$31,049,000
$23,000,000 (through
FY 2026)
$23,000,000 (through
FY 2026)
$52,275,000
$31,009,000 (through
FY 2026)
$52,275,000
$31,009,000 (through
FY 2026)
National Hansen's Disease Program:
PHS Act, Section 320, as amended by
P.L. 105-78, Section 211; as amended
by P.L. 107-220
Not Specified
$13,706,000
Not Specified
$13,706,000
Payment to Hawaii:
PHS Act, Section 320(d), as amended
by P.L. 105-78, Section 211
Not Specified
$1,857,000
Not Specified
$1,857,000
48
49.
National Hansen's Disease - Buildingsand Facilities:
PHS Act, Section 320
FY 2024
Amount Authorized
FY 2024
Amount
Appropriated
FY 2025 Amount
Authorized
FY 2025
President’s
Budget
Not Specified
$122,000
Not Specified
$122,000
Not Specified
$11,076,000
Not Specified
$11,076,000
$79,500,000 (through
FY 2025)
$92,975,000
$79,500,000 (through
FY 2025)
$92,975,000
RURAL HEALTH:
Rural Health Policy Development:
Social Security Act, Section 711, as
amended through P.L. 108-173, Section
432; and PHS Act, Section 301; as
amended through P.L. 114-255, Sections
2012, 2013, 2035, and 2043
Rural Health Outreach Network
Development and Small Health Care
Provider Quality Improvement:
PHS Act, Section 330A, as amended by
P.L. 107-251, Section 201; as amended
by P.L. 110-355, Section 4; as amended
by P.L. 116-136, CARES Act, Section
3213 and Social Security Act, Section
711, as amended through P.L. 108-173
Note that funding is authorized through
PHS Act Section 330A.
State Offices of Rural Health:
PHS Act, Section 338J, as amended by
P.L. 105-392, Section 301, and P.L.
115-408, Section 2; as amended by the
State Offices of Rural Health Program
Reauthorization Act of 2022, P.L. 117356
Rural obstetric network grants, PHS Act
Section 330A-2, as added by P.L. 117103 Section 142
Radiogenic Diseases (Radiation
Exposure Screening and Education
Program):
PHS Act, Section 417Cas amended by
P.L. 106-245, Section 4, as amended by
P.L. 109-482, Sections. 103, 104
Black Lung:
P.L. 91-173, Federal Mine Safety and
Health Act, Section 427(a); as amended
by P.L. 95-239, Black Lung Benefits
Reform Act of 1977, Section 9
$12,500,000 (through
FY 2027)
$12,500,000
$3,000,000 (through
FY 2027)
$12,500,000 (through
FY 2027)
$12,500,000
$3,000,000 (through
FY 2027)
Not Specified
$1,889,000
Not Specified
$1,889,000
$10,000,000
$12,190,000
$10,000,000
$12,190,000
49
50.
FY 2024Amount Authorized
FY 2024
Amount
Appropriated
FY 2025 Amount
Authorized
FY 2025
President’s
Budget
Rural Communities Opioid Response:
SSA, Section 711, as added by P.L. 100203, Section 4401; as amended by P.L.
100-360, Section 411(m)(1); as
amended by P.L. 101-239, Section
6213(g); as amended by P.L. 108-173,
Section 432
Not Specified
$145,000,000
Not Specified
$145,000,000
Rural Residency:
SSA, Section 711(b)(5), as added by
P.L. 108-173, Section 432
Not Specified
$12,500,000
Not Specified
$12,500,000
Rural Health Clinic Behavioral Health:
SSA, Section 711, as amended by
Public Law 108-173.
Not Specified
---
Not Specified
---
The Financial and Community
Sustainability for At-Risk Rural
Hospitals: Social Security Act, Section
711, as amended by 21st Century Cures
Act, Sections 2012 2013 2035, and
2043, Public Law 114-255
Not Specified
---
Not Specified
---
Rural Hospital Stabilization Pilot:
Social Security Act, Section 711, as
amended by 21st Century Cures Act,
Sections 2012 2013 2035, and 2043,
Public Law 114-255
Not Specified
---
Not Specified
---
Indefinite
$163,800,000
Indefinite
$163,800,000
Such sums as may be
necessary
(permanent)
$12,238,000
Such sums as may be
necessary
(permanent)
$12,238,000
HRSA-WIDE ACTIVITIES
Program Management
340B Drug Pricing Program:
PHS Act, Section 340B, as added by
P.L. 102-585, Section 602(a); as
amended by P. L. 103-43, Section
2008(i)(1)(A); as amended by P.L. 111148, Sections. 2501(f)(1), 7101(a) –(d),
7102; as amended by P.L. 111-152,
Section 2302; as amended by P.L. 111309, Section 204(a)(1)
Telehealth:
PHS Act, Section 330I, Section 330N,
as amended by P.L. 107-251, as
amended by P.L. 108-163; as amended
by P.L. 113-55, Section 103; as
amended by P.L. 116-136, CARES Act,
Section 3212; as amended by P.L. 116260 Division BB, Title III Section 313
• Telehealth Network and
Telehealth Resource Centers
Grant programs (PHS Act
Section 330I)
PHS Act Section
330I: $29,000,000
(through FY 2025)
PHS Act Section
330I: $29,000,000
(through FY 2025)
$38,050,000
PHS Act Section
330N: $10,000,000
(through FY 2026)
50
$38,050,000
PHS Act Section
330N: $10,000,000
(through FY 2026)
51.
FY 2024Amount Authorized
FY 2024
Amount
Appropriated
FY 2025 Amount
Authorized
FY 2025
President’s
Budget
Family Planning:
Grants: PHS Act Title X
Expired
$286,479,000
Expired
$390,000,000
Vaccine Injury Compensation Program
(VICP) (funded through the VICP Trust
Fund):
PHS Act, Title XXI, Subtitle 2, Sections
2110-2134, as amended by P.L. 114255, Section 3093(c).
Indefinite
$276,697,000
Indefinite
$286,927,000
Countermeasures Injury Compensation
Program: PHS Act, Section 319F-4, as
added by P.L. 109-148, Division C,
Section 3. as amended by P.L. 113-5,
Section. 402 (to Section 319F-3); as
amended by P.L. 116-127, Families
First Coronavirus Response Act,
Sec.6005 (amends PHS Act, Section.
319F-3); as amended by P.L. 116-136,
CARES Act Section 3103 (amends PHS
Act, Sec. 319F-3)
Not Specified
$7,000,000
Not Specified
$10,000,000
----
---
----
---
Such Sums As May
Be Necessary
through FY 2026
---
Such Sums As May
Be Necessary
through FY 2026
---
Telehealth TechnologyEnabled Learning Program
(PHS Act Section 330N)
OTHER PROGRAMS
UNFUNDED AUTHORIZATIONS:
Health Center Demonstration Project for
Individualized Wellness Plans:
PHS Act, Section 330(s), as added to
PHS Act by P.L. 111-148, Section 4206
Note: P.L. 115–123, Section
50901(b)(14) struck PHS Act,
Subsection (s)
School Based Health Centers - Facilities
Construction:
P.L. 111-148, Section 4101(a); as
amended by P.L. 116-260, Consolidated
Appropriations Act, 2021, Title III,
Subtitle A, Section 317; as amended by
Consolidated Appropriations Act, 2023
Pub. L. 117-328, section 1401
51
52.
School Based Health Centers –Operations:
PHS Act, Section 399Z-1, as added by
P.L. 111-148, Section 4101(b); as
amended by P.L. 116-260, Consolidated
Appropriations Act, 2021, Title III,
Subtitle A, Section 317; as amended by
Consolidated Appropriations Act, 2023
Pub. L. 117-328, section 1401
Health Information Technology
Innovation Initiative:
PHS Act, Section 330(e)(1)(C), (Grants
for Operation of Health Center
Networks and Plans), as amended
Health Information Technology
Planning Grants:
PHS Act, Section 330(c)(1)(B)-(C), as
amended
Electronic Health Record
Implementation Initiative:
PHS Act, Section 330(e)(1)(C), as
amended
Native Hawaiian Health Scholarships:
42 USC 11709, as amended by P.L.
111-148, Section 10221 (incorporating
Section 202(a) of Title II of Senate
Indian Affairs Committee-reported S.
1790—111th Congress)
Health Professions Education in Health
Disparities and Cultural Competency:
PHS Act, Section 741, as amended by
P.L. 111-148, Section 5307
Training Opportunities for Direct Care
Workers
PHS Act, Section 747A, as added by
P.L. 111-148, Section 5302
Comprehensive Geriatric Education:
PHS Act, Section 865, as re-designated
by P.L. 111-148, Section 5310(b)
Continuing Education Support for
Health Professionals Serving in
Underserved Communities:
PHS Act, Section 752, as amended by
P.L. 111-148, Section 5403
Rural Interdisciplinary Training
(Burdick)
PHS Act, Section 754; as amended by
P.L. 116-136, CARES Act, Section
3401
FY 2024
Amount Authorized
FY 2024
Amount
Appropriated
FY 2025 Amount
Authorized
FY 2025
President’s
Budget
Such Sums As May
Be Necessary
through FY 2026
---
Such Sums As May
Be Necessary
through FY 2026
---
---
Such Sums As Are
Necessary (within the
Section 330
authorization)
---
Such Sums As Are
Necessary (within the
Section 330
authorization)
Such Sums As Are
Necessary (within the
Section 330
authorization)
Such Sums As Are
Necessary (within the
Section 330
authorization)
---
---
Such Sums As Are
Necessary (within the
Section 330
authorization)
Such Sums As Are
Necessary (within the
Section 330
authorization)
---
---
Expired
---
Expired
---
Expired
---
Expired
---
Expired
---
Expired
---
Expired
---
Expired
---
Such Sums As May
Be Necessary
---
Such Sums As May
Be Necessary
---
Not Specified
---
Not Specified
---
52
53.
FY 2024Amount
Appropriated
FY 2025 Amount
Authorized
FY 2025
President’s
Budget
---
Expired
---
---
Amounts otherwise
appropriated under
this PHS Act,
Subchapter (VHealth Professions
Education) may be
utilized by the
Secretary to support
its activities of the
Council
---
Expired
---
Expired
---
$1,190,000
---
$1,190,000
---
Such Sums As Are
Necessary (and for
each subsequent
fiscal year)
---
Such Sums As Are
Necessary (and for
each subsequent
fiscal year)
---
Not Specified
---
Not Specified
---
Expired
---
Expired
---
Expired
---
Expired
---
Not Specified
---
Not Specified
---
Not Specified
---
Not Specified
---
FY 2024
Amount Authorized
Grants for Pain Care Education &
Training:
PHS Act, Section 759, as added by
P.L.111-148, Section 4305 and P.L.
115-271, Section 7073
Advisory Council on Graduate Medical
Education:
PHS Act, Section 762, as amended by
P.L. 111-148, Section 5103; as amended
by P.L. 116-136, CARES Act, Section
3401
Health Professions Education in Health
Disparities and Cultural Competency:
PHS Act, Section 807, as amended by
P.L. 111-148, Section 5307
Minority Faculty Fellowship Program:
PHS Act, Section 738 (authorized
appropriation in PHS Act Section
740(b)), as amended by P.L.111-148,
Sections. 5402, 10501; as amended by
P.L. 116-136, CARES Act, Section
3401
State Health Care Workforce
Development Grants and
Implementation Grants:
[stand-alone 42 U.S.C. 294r (not as part
of PHS Act)], as added by P.L. 111-148,
Section 5102
Allied Health and Other Disciplines:
PHS Act, Section 755; as amended by
P.L. 116-136, CARES Act, Section
3401
Nurse Managed Health Clinics:
PHS Act, Section 330A-1, as added by
P.L. 111-148, Section 5208
Patient Navigator:
PHS Act, Section 340A, as added by
P.L. 109-18, Section 2; as amended by
P.L. 111-148, Section 3510
Evaluation of Long-Term Effects of
Living Organ Donation:
PHS Act, Section 371A, as added by
P.L. 108-216, Section 7
Congenital Disabilities:
Such Sums As May
Be Necessary for
each of the fiscal
years 2019 through
2023 (amounts
available until
expended)
Amounts otherwise
appropriated under
this PHS Act,
Subchapter (VHealth Professions
Education) may be
utilized by the
Secretary to support
its activities of the
Council
53
54.
FY 2024Amount Authorized
FY 2024
Amount
Appropriated
FY 2025 Amount
Authorized
FY 2025
President’s
Budget
PHS Act, Section 399T, as added by
P.L. 110-374, Section 3, as renumbered
by P.L. 111-148, Section 4003
Clinical Training in Interprofessional
Practice:
PHS Act, Sections 755, 765, 831
Not Specified
(Section 755)
Not Specified
(Section 755)
Expired
(Sections 765 and
831)
54
---
Expired
(Sections 765 and
831)
---
55.
Budget Authority By ActivityHealth Resources and Services Administration
(dollars in thousands)
1. PRIMARY CARE:
Health Centers:
Health Centers
Health Centers Mandatory
Health Centers Mandatory proposed
Health Center Tort Claims
Subtotal, Health Centers
Free Clinics Medical Malpractice
Subtotal, Bureau of Primary Health Care (BPHC)
2. HEALTH WORKFORCE:
National Health Service Corps (NHSC):
NHSC
NHSC Mandatory
NHSC Mandatory proposed
Subtotal, NHSC
Loan Repayment/Faculty Fellowships
Health Professions Training for Diversity:
Centers of Excellence
Scholarships for Disadvantaged Students
Health Careers Opportunity Program
Subtotal, Health Professions Training for Diversity
Health Care Workforce Assessment
Primary Care Training and Enhancement
Oral Health Training Programs
Medical Student Education
Interdisciplinary, Community-Based Linkages:
Area Health Education Centers
Geriatric Programs
Behavioral Health Workforce Development Programs
Subtotal, Interdisciplinary, Community-Based Linkages
55
FY 2023
FY 2024
FY 2025
Final/1
Continuing
Resolution
President's
Budget
1,737,772
3,905,348
120,000
5,763,120
1,000
5,764,120
1,737,772
1,753,425
3,416,575
120,000
7,027,772
1,000
7,028,772
1,737,772
6,340,000
120,000
8,197,772
1,000
8,198,772
125,600
292,330
417,930
2,310
125,600
135,890
654,110
915,600
2,310
125,600
28,422
55,014
16,000
99,436
5,663
49,924
42,673
60,000
28,422
55,014
16,000
99,436
5,663
49,924
42,673
60,000
28,422
55,014
16,000
99,436
5,663
49,924
42,673
50,500
47,000
47,245
197,053
291,298
47,000
47,245
197,053
291,298
47,000
47,245
253,553
347,798
790,000
915,600
2,310
56.
FY 2023FY 2024
FY 2025
Final/1
Continuing
Resolution
President's
Budget
18,000
18,000
18,000
Public Health Workforce Development:
Public Health/Preventive Medicine
Nursing Workforce Development:
Advanced Nursing Education
Nursing Workforce Diversity
Nurse Education, Practice and Retention
Nurse Faculty Loan Program
NURSE Corps Scholarship and Loan Repayment Program
Subtotal, Nursing Workforce Development
CHGME
Teaching Health Center Graduate Medical Education
(THCGME):
THCGME Mandatory
THCGME Mandatory Proposed
Subtotal, THCGME
National Practitioner Data Bank (User Fees)
Pediatric Subspecialty LRP
Health Care Workforce Innovation Program
Subtotal, Bureau of Health Workforce (BHW)
95,581
24,343
59,413
28,500
92,635
300,472
385,000
95,581
24,343
59,413
28,500
92,635
300,472
385,000
105,581
24,343
69,413
28,500
92,635
320,472
385,000
119,290
119,290
18,814
10,000
1,820,810
55,452
101,548
157,000
18,814
10,000
2,356,190
320,000
320,000
18,814
10,000
10,000
2,596,190
3. MATERNAL & CHILD HEALTH:
Maternal and Child Health Block Grant
Grants to States (non-add)
SPRANS (non-add)
CISS (non-add)
Innovation for Maternal Health
Integrated Services for Pregnant and Postpartum Women
Maternal Mental Health Hotline
Autism and Other Developmental Disorders
Sickle Cell Service Demonstrations
Early Hearing Detection and Intervention
Emergency Medical Services for Children
Healthy Start
Heritable Disorders
Pediatric Mental Health Care Access Grants
Screening and Treatment for Maternal Mental Health and SUD
Poison Control Centers
816,200
593,808
212,116
10,276
15,300
10,000
7,000
56,344
8,205
18,818
24,334
144,500
20,883
13,000
10,000
26,846
815,700
593,308
212,116
10,276
15,300
10,000
7,000
56,344
8,205
18,818
24,334
145,000
20,883
13,000
10,000
26,846
831,714
593,308
228,130
10,276
30,300
10,000
7,000
56,344
8,205
18,818
24,334
172,000
20,883
13,000
15,500
26,846
56
57.
FY 2023FY 2024
FY 2025
Final/1
Continuing
Resolution
President's
Budget
Family-to-Family Health Information Centers (F2F HIC)
F2F HIC Mandatory
F2F HIC Mandatory Proposed
Subtotal, F2F HIC
Maternal, Infant and Early Childhood Home Visiting
Mandatory
Subtotal, Maternal and Child Health Bureau (MCHB)
5,658
5,658
5,658
5,658
12,000
12,000
500,000
1,677,088
518,650
1,695,738
565,800
1,812,744
4. HIV/AIDS:
Emergency Relief - Part A
Comprehensive Care - Part B
AIDS Drug Assistance Program (non-add)
Early Intervention - Part C
Children, Youth, Women & Families - Part D
AIDS Education and Training Centers - Part F
Dental Reimbursement Program Part F
Special Projects of National Significance (SPNS)
Ending HIV Epidemic Initiative
Subtotal, HIV/AIDS Bureau
680,752
1,364,878
900,313
208,970
77,935
34,886
13,620
25,000
165,000
2,571,041
680,752
1,364,878
900,313
208,970
77,935
34,886
13,620
25,000
165,000
2,571,041
680,752
1,364,878
900,313
208,970
77,935
34,886
13,620
25,000
175,000
2,581,041
5. HEALTH SYSTEMS:
Organ Transplantation
Cell Transplantation Program and Cord Blood Stem Cell Bank
Hansen's Disease Center
Payment to Hawaii
National Hansen's Disease Program - Buildings and Facilities
Subtotal, Health Systems Bureau (HSB)
31,549
51,775
13,706
1,857
122
99,009
31,049
52,275
13,706
1,857
122
99,009
67,049
52,275
13,706
1,857
122
135,009
6. RURAL HEALTH:
Rural Health Policy Development
Rural Health Outreach Grants
Rural Hospital Flexibility Grants
State Offices of Rural Health
Radiation Exposure Screening and Education Program
Black Lung
Rural Communities Opioid Response
Rural Residency Planning and Development
11,076
92,975
64,277
12,500
1,889
12,190
145,000
12,500
11,076
92,975
64,277
12,500
1,889
12,190
145,000
12,500
11,076
92,975
64,277
12,500
1,889
12,190
145,000
12,500
57
58.
FY 2023FY 2024
FY 2025
Final/1
Continuing
Resolution
President's
Budget
Subtotal, Federal Office of Rural Health Policy
352,407
352,407
352,407
7. HRSA-WIDE ACTIVITIES AND PROGRAM
SUPPORT:
Program Management:
Program Management
Program Management: Community Projects
Subtotal, Program Management
340B Drug Pricing Program/Office of Pharmacy Affairs
Telehealth
Subtotal, HRSA-Wide Activities
163,800
1,521,681
1,685,481
12,238
38,050
1,735,769
163,800
1,521,681
1,685,481
12,238
38,050
1,735,769
163,800
163,800
12,238
38,050
214,088
286,479
286,479
390,000
8. FAMILY PLANNING
Total, HRSA Discretionary Budget Authority/2
9,465,283
9,465,283
8,233,637
FTE/2
2,579
2,716
2,778
1/ Reflects amounts appropriated and any reprogrammings or reallocations notified to Congress. Does not include
$65 million in supplemental funding provided in the Consolidated Appropriations Act, 2023.
2/Excludes Vaccine Injury Compensation and Countermeasures Injury Compensation.
58
59.
Appropriations History TableBudget
Estimate to
Congress
House
Allowance
Senate
Allowance
Appropriation
6,217,677,000 5,804,254,000
5,987,562,000
6,139,558,000
6,217,677,000
5,804,254,000
5,987,562,000
6,139,558,000
5,733,481,000
5,917,190,000
6,155,869,000
6,213,347,000
5,733,481,000
5,917,190,000
6,155,869,000
-14,100,000
6,199,247,000
5,538,834,000
5,839,777,000
6,217,794,000
6,736,753,000
5,538,834,000
5,815,727,000
6,217,794,000
-15,857,000
6,720,897,000
9,559,591,000
6,540,385,000
6,816,753,000
6,843,503,000
FY 2016
General Fund Appropriation:
Base
Advance
Supplemental
Rescissions
Transfers
Subtotal
FY 2017
General Fund Appropriation:
Base
Advance
Supplemental
Rescissions
Transfers
Subtotal
FY 2018
General Fund Appropriation:
Base
Advance
Supplemental
Rescissions
Transfers
Subtotal
FY 2019
General Fund Appropriation:
Base
Advance
Supplemental
Rescissions
Transfers
Subtotal
60,000,000
9,559,591,000
6,540,385,000
59
6,816,753,000
-20,897,087
6,882,605,973
60.
BudgetEstimate to
Congress
House
Allowance
Senate
Allowance
Appropriation
5,841,352,000
7,326,109,000
6,928,714,000
7,037,259,000
FY 2020
General Fund Appropriation:
Base
Advance
Supplemental
Rescissions
Transfers
Subtotal
975,000,000
5,841,352,000
7,326,109,000
6,928,714,000
8,012,259,000
6,289,085,000
7,195,758,000
7,104,535,000
7,207,234,000
FY 2021
General Fund Appropriation:
Base
Advance
Supplemental
Rescissions
Transfers
Subtotal
9,430,000,000
6,289,085,000
7,195,758,000
-21,671,000
7,104,535,000 16,615,563,000
7,813,294,000
8,740,422,000
8,556,794,000
FY 2022
General Fund Appropriation:
Base
Advance
Supplemental
Rescissions
Transfers
Subtotal
140,000,000
7,813,294,000
8,740,422,000
8,696,794,000
8,485,044,000
9,295,951,000
9,465,283,000
FY 2023
General Fund Appropriation:
Base
Advance
Supplemental
Rescissions
Transfers
Subtotal
65,000,000
8,485,044,000
9,295,951,000
60
9,530,283,000
61.
BudgetEstimate to
Congress
House
Allowance
Senate
Allowance
9,163,699,000
7,237,941,000
8,855,099,000
9,163,699,000
7,237,941,000
8,855,099,000
FY 2024
General Fund Appropriation:
Base
Advance
Supplemental
Rescissions
Transfers
Subtotal
FY 2025
General Fund Appropriation:
Base
Advance
Supplemental
Rescissions
Transfers
Subtotal
8,233,637,000
8,233,637,000
61
Appropriation
62.
Appropriations Not Authorized by Law12HRSA Program
NHSC – PHS Act, Sections 331-338
Authorization of appropriations (“Field”):
Section 338(a)
Nursing Workforce Development
• Comprehensive Geriatric Education – PHS
Act, Section 865
Emergency Relief - Part A –
PHS Act, Sections 2601-10, as amended by
P.L. 106-345; as amended by P.L. 109-415; as
amended by P.L. 111-87
Comprehensive Care - Part B –
PHS Act, Sections 2611-31, as amended by
P.L. 106-345, as amended by P.L. 109-415, as
amended by P.L. 111-87
Early Intervention Services – Part C –
PHS Act, Sections 2651-67, as amended by
P.L. 106-345, as amended by P.L. 109-415, as
amended by P.L. 111-87
Coordinated Services and Access to Research
for Women, Infants, Children and Youth - Part
D–
PHS Act, Section 2671, as amended by P.L.
106-345, as amended by P.L. 109-415, as
amended by P.L. 111-87
Special Projects of National Significance - Part
F–
PHS Act, Section 2691, as amended by P.L.
104-146, as amended by P.L. 109-415, as
amended by P.L. 111-87
AIDS Education and Training Centers - Part F
– PHS Act, Section 2692(a), as amended by
P.L. 106-345, as amended by P.L. 109-415, as
amended by P.L. 111-87
Dental Reimbursement Program - Part F – PHS
Act, Section 2692(b), as amended by P.L. 106345, as amended by P.L.109-415, as amended
by P.L.111-87
Minority AIDS Initiative – Part F – PHS Act
section 2693
Last Fiscal
Year of
Authorization
Last Authorization
Level
Appropriations
in Last Year of
Authorization
Appropriations
in FY 2025
2012
Such Sums As May
Be Necessary
---
---
2014
Such Sums As May
Be Necessary
$4,350,000
---
2013
$789,471,000
$649,373,000
$680,752,000
2013
$1,562,169,000
$1,314,446,000
$1,364,878,000
2013
$285,766,000
$205,544,000
$208,970,000
2013
$87,273,000
$72,395,000
$77,935,000
2013
$25,000,000
$25,000,000
$25,000,000
2013
$42,178,000
$33,275,000
$34,886,000
2013
$15,802,000
$12,991,000
$13,620,000
2013
---
Varies by Part
---
12
Please note that even where authorizations of appropriations ended in prior fiscal years, authority still exists for
particular activities if the enabling authorities continue to exist and if current appropriations extend to the
programmatic activities.
62
63.
HRSA ProgramHeritable Disorders:
PHS Act, Sections 1109-1112, 1114, and 1117,
as amended by P.L. 106-310, Section 2601; as
amended by P.L. 110-204, Section 2; as
amended by P.L. 110-237, Section 1; as
amended by P.L. 113-240, Section 10
Organ Transplantation –
42 U.S.C. 273-274g, PHS Act, Sections 371378, as amended by P.L. 108-216,
P.L. 109-129, P.L. 110-144, P.L. 110-413, and
P.L. 113-51
Rural Hospital Flexibility Grants –
SSA, Section 1820(j), and Social Security act
711, as amended by P.L. 105-33, Section
4201(a) and Section 4002(f), and P.L. 108-173,
Section 405(f), as amended by, P.L. 110-275,
Section 121; as amended by P.L. 111-148,
Section 3129(a)
Rural Access to Emergency Devices:
Public Health Improvement Act P.L. 106-505,
Section 413 (Rural Access to Emergency
Devices)
Telehealth: incentive grants regarding
coordination among states. PHS Act Section
330L as added by P.L. 107-251, as amended by
P.L. 108-163.
• Licensure Portability Grant Program
Family Planning Grants –
PHS Act, Title X
Last Fiscal
Year of
Authorization
Appropriations
in Last Year of
Authorization
Appropriations
in FY 2025
$18,883,000
$20,883,000
2009
Section 377—
$5,000,000
Section 377A— Such
Sums As May Be
Necessary
Section 377B— Such
Sums As May Be
Necessary
$2,767,000
$67,049,000
2012
Such Sums As May
Be Necessary
$41,040,000
$64,277,000
Expired
---
Expired
$12,500,000
2019
Last Authorization
Level
$11,900,000
(Sections 11091112);
$8,000,000
(Section 1113)
Expired
Expired
1985
$158,400,000
Expired
State Loan Repayment Program
(SLRP):
PHS Act, Section 338I(a)-(i), as amended
by P.L. 107-251, Section 315; as further
amended by P.L. 110-355, Section 3(e)(2)
$142,500,000
---
$390,000,000
Expired
Note: The
American
Rescue Plan
Act (P.L. 1172), Section
2602(b) setaside
$100,000,000
to the SLRP
(to remain
available until
expended)
from the
$800,000,000
appropriated to
the National
Health Service
63
---
Note: The
American Rescue
Plan Act (P.L.
117-2), Section
2602(b) set-aside
$100,000,000 to
the SLRP (to
remain available
until expended)
from the
$800,000,000
appropriated to
the National
Health Service
Corps (Section
2602(a))
---
64.
HRSA ProgramLast Fiscal
Year of
Authorization
Corps (Section
2602(a))
Graduate Medical Education for Physicians:
as added by P.L. 115-245, Division B, Title II;
as amended by P.L. 116-260, Consolidated
Appropriations Act, 2021, Division H, Title II
---
64
Last Authorization
Level
Appropriations
in Last Year of
Authorization
Appropriations
in FY 2025
$50,000,000
---
$50,500,000
65.
PRIMARY HEALTHCARE
TAB
65
66.
PRIMARY HEALTH CAREHealth Centers
(dollars in thousands)
FY 2024
Continuing
Resolution
FY 2023
Final
FY 2025
President’s
Budget
FY 2025
+/FY 2023
BA
$1,737,772
$1,737,772
$1,737,772
---
Current Law
Mandatory
Funding
$3,905,348
$1,753,425
---
-$3,905,348
Proposed Law
Mandatory
Funding
---
$3,416,575
$6,340,000
+$6,340,000
FTCA Program
$120,000
$120,000
$120,000
---
Total
$5,763,120
$7,027,772
$8,197,772
+$2,434,652
FTE
576
668
728
+152
Authorizing Legislation (discretionary): Public Health Service Act, Section 330, as amended
by Public Law 116-260, Consolidated Appropriations Act 2021, Division BB, Title III, Section
311
Authorizing Legislation (mandatory): Patient Protection and Affordable Care Act, Section
10503, as amended by Public Law 116-260, Consolidated Appropriations Act 2021, Section
301. [Expired - currently under CR through 03/08/24]
FY 2025 Authorization (discretionary): FY 2024 appropriation level adjusted by the product
of: (i) one plus the average percentage increase in costs incurred per patient served; and
(ii) one plus the average percentage increase in the total number of patients served.
Allocation Method…………………………………Competitive grants/cooperative agreements
Program Description
For nearly 60 years, health centers have delivered affordable, accessible, high-quality, and costeffective primary health care to patients regardless of their ability to pay. During that time, health
centers have become an essential primary care provider for millions of people across the country,
using a coordinated, comprehensive, and patient-centered approach. Today, approximately 1,400
health centers operate nearly 15,000 service delivery sites that provide care to over 30 million
patients across every U.S. State, the District of Columbia, Puerto Rico, the U.S. Virgin Islands,
and the Pacific Basin.
Health centers continue to deliver high quality and value-based care by using key quality
improvement practices, including health information technology. Seventy-eight percent of
66
67.
health centers are currently recognized by national accrediting organizations as Patient CenteredMedical Homes– an advanced model of patient-centered primary care that emphasizes quality
and care coordination through a team‐based approach to care.
Populations served: Health centers serve a wide range of patients. In 2022:
Approximately 29 percent of patients were children (age 17 and younger); approximately
12 percent were 65 or older. Over 59 percent were adult patients (18-64).
Approximately 90 percent of health center patients are individuals or families living at or
below 200 percent of the Federal Poverty Guidelines as compared to approximately 27.6
percent of the U.S. population.
Nearly 81 percent of health center patients were uninsured or covered by Medicaid,
Medicare, or other public insurance programs. Approximately 20% have Marketplace or
other private insurance coverage.
Special Populations: More than one third of health centers received specific funding in
FY 2022 to provide primary care services for certain special populations that are
identified in Health Center Program authorizing statute, including individuals and
families experiencing homelessness, agricultural workers, those living in public housing,
and Native Hawaiians (separate authority).
o
Health Care for the Homeless Program: The Health Care for the Homeless Program
supports coordinated, comprehensive, integrated primary care including substance use
disorder and mental health services for homeless persons in the United States, serving
patients that live in unsheltered locations, in shelters, or in transitional housing. HRSAfunded health centers provided primary care services for over 1.3 million persons in
supportive housing and/or experiencing homelessness.
o
Migrant Health Center Program: The Migrant Health Center Program supports
comprehensive, integrated primary care services for agricultural workers and their
families, with a particular focus on occupational health and safety. HRSA-funded health
centers provided primary care services for nearly 1 million migratory and seasonal
agricultural workers and their families.
o
Public Housing Primary Care Program: The Public Housing Primary Care Program
increases access for residents of public housing to comprehensive, integrated primary
care services by providing services that are responsive to identified needs of residents and
in coordination with public housing authorities. Health centers deliver care at locations
on the premises of public housing developments or immediately accessible to
residents. HRSA-funded health centers provided primary care services for over 6.1
million people living in or near public housing.
o
Native Hawaiian Health Care Program: The Native Hawaiian Health Care Program,
funded within the Health Center Program, improves the health of Native Hawaiians by
making health education, health promotion, and disease prevention services available
through a combination of outreach, referral, and linkage mechanisms. Services provided
include nutrition programs, screening and control of hypertension and diabetes,
67
68.
immunizations, and basic primary care services. Native Hawaiian Health Care Systemsprovided medical and enabling services to over 6,800 people.
Allocation Method: Public and non-profit private entities, including tribal, faith-based, and
community-based organizations, are eligible to apply for funding under the Health Center
Program. New health center grants are awarded based on a competitive process that includes an
assessment of need and merit. In addition, health centers are required to compete for continued
grant funding to serve their existing service areas at the completion of every project period
(generally every 3 years). New Health Center Program grant opportunities are announced
nationally, and applications are reviewed and rated by objective review committees (ORCs),
composed of experts who are qualified by training and experience in particular fields related to
the Program.
Funding decisions are made based on ORC assessments, announced funding preferences and
program priorities. In making funding decisions, HRSA applies statutory awarding factors
including funding priority for applications serving a sparsely populated area; consideration of the
rural and urban distribution of awards (no more than 60 percent and no fewer than 40 percent of
projected patients come from either rural or urban areas); and continued proportionate
distribution of funds to the special populations served under the Health Center Program.
Patient Care: The number of health center patients served in 2022 was 30.5 million; an increase
of nearly 10 million, or 49 percent, above the 21.1 million patients served in 2012. Of the 30.5
million patients served and for those for whom income status is known, approximately 90
percent were at or below 200 percent of the Federal poverty level and nearly 81 percent were
uninsured or covered by Medicaid, Medicare, or other public insurance programs.
Federal Tort Claims Act (FTCA) Program: The Health Center Program administers the FTCA
Program, under which participating health centers, their employees and eligible contractors may
be deemed to be Federal employees qualified for medical malpractice liability protection under
the FTCA. As Federal employees, they are immune from suit for medical malpractice claims
while acting within the scope of their employment. The Federal Government assumes
responsibility for such claims. In addition, the FTCA Program supports risk mitigation activities,
including reviews of risk management plans and sites visits as well as risk management technical
assistance and resources to support health centers. The enactment of the 21st Century Cures Act
in December of 2016 extended liability protections for volunteers at deemed health centers under
the FTCA Program.
Budget Request
The FY 2025 Budget Request for the Health Center Program is $8.2 billion, an increase of $2.4
billion above the FY 2023 Final level. This total consists of $1.9 billion in discretionary
resources and includes $6.3 billion in mandatory funding. The proposed mandatory investments
continue progress on the President’s plan to put the Health Center Program on a pathway to
doubling.
As a result of this expanded investment in FY 2025, approximately 3.9 million additional
patients will be served by health centers, for a total of 37.4 million. Health centers will have
resources to expand medical capacity at existing sites, including the expansion of behavioral
health and oral health, as well as expand maternal health services and enabling/patient support
68
69.
services. In addition, the FY 2025 request will support the creation of a new initiative to supportnew and expanded workforce training at health centers, and the establishment of a new street
medicine and outreach program for individuals experiencing homelessness.
The FY 2025 Health Center Program investments included in the FY 2025 Budget Request will
build on ongoing annual investments and Program enhancements proposed in FY 2024; notably,
statutory changes requiring the provision of mental health and substance use disorder services in
all health centers, and mandatory funding investments in health center expanded hours ($250
million), new access points ($150 million), and behavioral health service expansion ($700
million).
Mandatory Funding
The Budget request supports expanded service grants to all existing HRSA funded health centers.
Through the rapid deployment of expanded service grants, HRSA will quickly expand access to
medical care, behavioral health and oral health care, efficiently and effectively narrowing critical
gaps in access to essential services in areas and for populations that need them most. The FY
2025 request includes $700 million to invest in approximately 1,400 health centers across the
country to expand access to comprehensive services.
The FY 2025 Budget request includes $50 million to expand health center access to high quality,
patient-centered maternal health services, including behavioral health services, in communities
and for populations of greatest need. Through the FY 2025 request, HRSA plans to make 100
health center awards to expand, train and diversify their maternal health workforce, develop new
and strengthen existing community partnerships, strengthen outreach and patient support services
to facilitate access to care and help address health related social needs, and broaden service
delivery modalities and locations, both within and beyond their current service areas.
Health center services such as transportation, translation, outreach, and education are often
necessary to enable patients’ initial and ongoing access to health center services. Likewise,
health centers provide essential services to support enrollment in affordable insurance plans and
to connect patients to community resources to address their other health-related social needs.
These patient support and enabling services address the barriers to health experienced by health
center patients, including food insecurity, housing insecurity, lack of transportation/access to
public transportation, language access, and challenges with navigating health and social service
systems. The FY 2025 Budget request includes an investment of $200 million through
competitive awards to approximately 800 health centers to expand patient support and enabling
services.
Health centers face challenges recruiting and retaining both clinical and non-clinical staff.
Talented, high performing health center staff, dedicated to the organization, are often recruited to
higher paying positions by providers with more resources. For FY 2025, HRSA proposes to
invest $100 million to support 500 health centers to recruit, retain, and “grow their own”
workforce. This new program will create new career pathways and enable employees to advance
their careers while continuing to support the health center in their existing roles. For example,
administrative staff could be trained or supported in training to become medical assistants,
medical assistants to become licensed practical nurses, and registered nurses to become advanced
nurse practitioners.
69
70.
Health centers are currently providing access to high quality primary care services to more than1.3 million individuals experiencing homelessness. However, given the significant need for
additional homeless services, in the FY 2025 Budget request, HRSA proposes to invest $50
million for 150 health center awards to expand access to street medicine services, increasing
street outreach and patient support services. These resources would be targeted to Health Care
for the Homeless grantees and expand their capacity to provide outreach to homeless populations
and enhance their ability to bring high quality care outside of traditional settings via street
medicine.
Discretionary Funding
As part of the Ending the HIV Epidemic (EHE) Initiative, the HRSA Health Center Program
provides HIV testing and prevention services, HIV care and treatment where appropriate, and
assists with responding quickly to HIV cluster detection efforts. The HRSA Health Center
Program’s primary focus in the EHE initiative is on expanding HIV prevention services,
including outreach, care coordination, and access to Pre-Exposure Prophylaxis (PrEP)-related
services to people at high risk for HIV transmission through selected health centers in the
identified jurisdictions. The targeted jurisdictions for Phase I of the EHE Initiative are 48
counties, Washington, D.C., and San Juan, Puerto Rico—where greater than 50% of HIV
diagnoses occurred in 2016 and 2017—and an additional seven states with a substantial number
of HIV diagnoses in rural areas. In FY 2025, the Budget includes $157 million to support the
continued participation of health centers in the EHE initiative targeted jurisdictions. The Health
Center Program will continue to provide prevention and treatment services to people at high risk
for HIV transmission, including Pre-Exposure Prophylaxis (PrEP)-related services, outreach, and
care coordination through grant awards in areas currently served by health centers.
The FY 2025 Budget request includes $30 million to support the continued provision of early
childhood screening and development (ECD) services in existing health centers. Children
experience rapid physical, cognitive, linguistic, and emotional growth and development. Having
access to screening services where they receive primary health care is crucial to identify
developmental or behavioral conditions, language delays, or other needs, such as food insecurity
and housing instability, which affect school readiness and academic success. Health centers use
the funding to strengthen their capacity to provide more children with recommended
developmental screenings and follow-up services, including by developing the health center
workforce necessary to deliver these services and focusing on the patient and caregiver
experience. Health center recipients of ECD funding may increase capacity to provide ECD
services through training of current staff and/or hiring or contracting with additional staff with
ECD expertise.
The Budget request also includes a total of $11 million to support provision of cancer screening
services in health centers under the Alcee L. Hastings Cancer Screening Program. The program
focuses on leveraging outreach specialists and patient navigators to conduct patient outreach in
underserved communities served by health centers to promote early detection of cancer, connect
patients to screening services, and provide direct assistance with accessing high quality cancer
care and treatment as needed.
70
71.
The Budget also supports $120 million for the FTCA Program. The request supports costsassociated with the grant review and award process, operational site visits, information
technology, and other program support costs.
Health centers continue to be a critical element of the health system, largely because they can
provide an accessible and dependable source of high quality, affordable, and cost-effective
primary health care services in underserved communities. Health centers emphasize coordinated
primary and preventive services that promote reductions in health disparities for low‐income,
rural, and underserved communities and populations. Health centers place emphasis on the
coordination and comprehensiveness of care, the ability to manage patients with multiple health
care needs, and the use of key quality improvement practices, including health information
technology. The health center model also addresses geographic, cultural, linguistic, and other
barriers through a team‐based approach to care that includes physicians, nurse practitioners,
physician assistants, nurses, dental providers, midwives, behavioral health care providers, social
workers, and health educators.
Health centers also reduce costs to health systems; the health center model of care has been
shown to reduce the use of costlier providers of care, such as emergency departments (Eds) and
hospitals. In 2016, a study published in the American Journal of Public Health found that
Medicaid fee for service patients seen at a health center saved nearly $2,400 in total health care
spending per year when compared to those seen in a non-health center setting. Additionally, a
study published in BMC Pediatrics in 2024 found that Medicaid fee for service child patients
seen at a health center had a 7 percent lower chance of hospitalization and total expenditures 8
percent lower than non-health center patients.13
The FY 2025 Request supports efforts to improve the value, quality, and program integrity in all
HRSA-funded programs that deliver direct health care. Health centers annually report on a core
set of clinical performance measures that are consistent with Healthy People 2030, and
include: immunizations; prenatal care; cancer screenings; cardiovascular disease/hypertension;
diabetes; weight assessment and counseling for children and adolescents; adult weight screening
and follow up; tobacco use assessment and counseling; depression screening and follow-up;
dental sealants; asthma treatment; coronary artery disease/cholesterol; ischemic vascular
disease/aspirin use; and colorectal cancer screening. In addition to tracking core clinical
indicators, health centers report disaggregated data on health outcome measures (low birth
weight, diabetes, and hypertension) to demonstrate progress towards eliminating health
disparities in health outcomes.
To support quality improvement, the Program will continue to facilitate national and State-level
technical assistance and training programs that promote quality improvements in health center
data and quality reporting, clinical and quality improvement, and implementation of innovative
value-based, quality activities. The Program continues to promote the integration of health
information technology into health centers through the Health Center Controlled Network
Program to assure that key safety-net providers are able to advance their operations through
enhanced technology and tele-health systems.
Volerman et al. “Utilization, quality, and spending for pediatric Medicaid enrollees with primary care in health
centers vs non-health centers” BMC Pediatrics, Jan 2024
13
71
72.
HRSA also utilizes a variety of methods to oversee the Health Center Program and to monitorHealth Center Program grantees to identify potential issues, including non-compliance with
program requirements and areas where technical assistance might be beneficial. HRSA
accomplishes this monitoring through a variety of available resources, including the review of
health center data reports, independent annual financial audits reports, ongoing communication
with grantees, and site visits.
HRSA’s efforts to strengthen evidence-building capacity in the Health Center Program include
recent enhancements and modernization to the Uniform Data System (UDS). In FY 2024, a
subset of health centers will begin reporting de-identified patient level data to further improve
the delivery of care and develop more targeted interventions to improve health outcomes.
The funding request also includes costs associated with the grant review and award process,
follow-up performance reviews, and information technology and other program support costs.
Funding History
Fiscal Year
Amount
Supplemental
Funding
FY 2021
$1,674,203,000
---
FY 2021 Mandatory
$4,000,000,000
$7,600,000,000
FY 2022
$1,627,772,000
---
FY 2022 Mandatory
$3,905,348,00014
---
FY 2023
$1,857,772,000
---
FY 2023 Mandatory
$3,905,348,00015
---
FY 2024 Continuing Resolution
$1,857,772,000
---
FY 2024 Mandatory Continuing Resolution $1,753,425,000
---
FY 2024 Proposed Mandatory
$3,416,575,000
---
FY 2025 Budget Request
$1,857,772,000
---
FY 2025 Budget Request Mandatory
$6,340,000,000
---
Program Accomplishments
In 2022, health centers served 30.5 million patients, an increase of approximately 300,000
patients from Calendar Year (CY) 2021. Health centers provided approximately 127 million
14
15
FY 2022 reflects the post-sequestration amount of current law mandatory funding.
FY 2023 reflects the post-sequestration amount of current law mandatory funding.
72
73.
patient visits (an increase of over 2.7 million visits from CY 2021). In 2022, about 41 percent ofall health centers served rural areas providing care to over 9.5 million patients.
Despite treating a sicker, poorer, and more diverse population than other health care providers,
health centers were able to better control hypertension and diabetes for their patients compared to
the NCQA/HEDIS 2021 Medicaid HMO averages. Health centers also reduce costs to health
systems; the health center model of care has been shown to reduce the use of costlier providers
of care, such as emergency departments and hospitals16.
Patient Care: Health centers focus on integrating care for their patients across the full range of
services – not just medical but services like oral health, vision, and pharmacy as well. Health
centers also deliver crucial services such as case management, transportation, and health
education, which enable target populations to access care. In 2022, health centers provided oral
health services to over 6.0 million patients, an increase of nearly 40 percent since 2012.
Screening for substance use disorders has increased approximately 100 percent since 2016, with
the number of patients receiving screening, brief intervention, referral and treatment (SBIRT)
increasing from 716,677 in 2016 to 1,425,325 in 2022. From 2016–2022, the number of patients
receiving medications for opioid use disorder (MOUD) increased from 39,075 in 2016 to
193,986 in 2022.
In FY 2023 HRSA awarded approximately $350 million in Expanding COVID-19 Vaccination
(ECV) awards to support health centers to increase access to COVID-19 vaccines within their
service areas. This funding was made available from the Paycheck Protection Program and
Health Care Enhancement Act, P.L. 116-139, Division B, Title I. Health centers used these onetime funds, with an emphasis on activities within three months of award, on outreach and
education, community engagement, and coordinated partner events to increase COVID-19
vaccinations among underserved populations, including health center patients and other residents
of their service areas. Additionally in FY 2023, HRSA awarded approximately $81 million in
support of the HHS Bridge Access Program for COVID-19 Vaccines and Treatments. Health
centers use this funding to continue essential COVID-19-related services and mitigate adverse
impacts of COVID-19 on underserved populations as vaccines and therapeutics transition to the
commercial market in the fall of 2023. In FY 2023, health centers administered a total of
1,811,801 COVID-19 vaccine doses, and 44,539 patients received a course of COVID-19 oral
antiviral pills through the HRSA Health Center COVID-19 Oral Antiviral Pills Program.
Improving Quality of Care and Health Outcomes: Health centers continue to provide quality
primary and related health care services, improving the health of the Nation’s underserved
communities and populations. HRSA-funded health centers are evaluated on a set of
performance measures emphasizing health outcomes and the value of care delivered. These
measures provide a balanced, comprehensive look at a health center’s services toward common
conditions affecting underserved communities. Performance measures align with national
standards and are commonly used by Medicare, Medicaid, and health insurance/managed care
Nocon, Robert S. et al. “Health Care Use and Spending for Medicaid Enrollees in Federally Qualified Health
Centers Versus Other Primary Care Settings” American Journal of Public Health, Nov 2016
16
73
74.
organizations. Benchmarking health center outcomes to national rates demonstrates how healthcenter performance compares to the performance of the nation overall.
Appropriate prenatal care management can also have a significant effect on the incidence of low
birth weight (LBW), the risk factor most closely associated with neonatal mortality. Monitoring
birth weight rates is one way to measure quality of care and health outcomes for health center
female patients of childbearing age, approximately 25 percent of the total health center patient
population served in 2022. In 2022, the health center rate was 8.43 percent, and has consistently
been lower than the national rate during the past several years, despite health centers serving a
higher risk prenatal population than represented nationally in terms of socio-economic status,
health status and other factors. CDC low birth weight data for 2022 are not yet available to assess
progress toward the FY 2022 target.
Health center patients, including low-income individuals, racial/ethnic minority groups, and
persons who are uninsured, are more likely to suffer from chronic diseases such as hypertension
and diabetes. Clinical evidence indicates that access to appropriate care can improve the health
status of patients with chronic diseases and thus reduce or eliminate health disparities. The
Health Center Program began reporting data from all grantees on the control of hypertension and
diabetes via its Uniform Data System in 2008. In 2022, 63 percent of adult health center patients
with diagnosed hypertension had blood pressure under adequate control (less than 140/90), and
70 percent of adult health center patients with type 1 or 2 diabetes had their most recent
hemoglobin A1c (HbA1c) under control (less than or equal to 9 percent).
Health centers improve health outcomes by emphasizing the care management of patients with
multiple health care needs and the use of key quality improvement practices, including health
information technology. HRSA’s Health Center Program Patient Centered Medical Home
(PCMH) Initiative supports health centers to achieve national PCMH recognition, an advanced
model of primary care using a team-based approach to improve quality through coordination of
care and patient engagement. In FY 2022, more than three-fourths of HRSA-funded health
centers were recognized as PCMHs. In addition, health centers have advanced quality and
accountability by adopting Health Information Technology (HIT), including the use of certified
Electronic Health Records (EHRs), telehealth and other technologies that advance and enable
quality improvement. Over 98 percent of all health centers reported having a certified EHR in
2022.
External Evaluation: In addition to internal monitoring of health center performance, peer
reviewed literature and major reports continue to document that health centers successfully
increase access to care, promote quality and cost-effective care, and improve patient outcomes,
especially for traditionally underserved populations. Recent findings include:
Health centers that receive supplemental substance use disorder-specific HRSA grants
had increased substance abuse disorder service capacity and utilization.17
17
Pourat N, O'Masta B, Chen X, Lu C, Zhou W, Daniel M, Hoang H, Sripipatana A. Examining trends in substance
use disorder capacity and service delivery by Health Resources and Services Administration-funded health centers:
A time series regression analysis. PLoS One. 2020 Nov 30;15(11):e0242407. doi: 10.1371/journal.pone.0242407.
PMID: 33253263; PMCID: PMC7703936
74
75.
Co-locating mental health staff, particularly psychiatrists, at health centers increases
patients’ likelihood to receive timely, on-site mental health treatment.18
Culturally-sensitive patient-provider communication – i.e., provider was knowledgeable
about patient medical history, provided information in a manner that was easily
understandable, and spent adequate time with the patient –positively influences patient
adherence to treatment for cholesterol management.19
Organizational advances in health information technology have led to improved quality
of care in health centers that augments patient care capacity for disease prevention, health
promotion, and chronic care management.20
Health center organizational characteristics positively associated with higher cancer
screening rates.21
Enabling services were associated with higher probability of getting a routine checkup, a
higher likelihood of having had a flu shot, and a higher probability of patient
satisfaction.22
Total spending on health center Medicaid patients was 24 percent lower for health center
patients than non-health center patients.23
Health centers demonstrate lower total costs for Medicare beneficiaries: 10 percent lower
compared to patients in physician offices and30 percent lower compared to patients in
outpatient clinics.24
Federal Tort Claims Act (FTCA) Program: In accordance with the statute, HRSA implemented
FTCA coverage for volunteers in FY 2018. Nearly 213 volunteers were covered under the
FTCA Program in FY 2022. Overall for the Health Center FTCA Program, in FY 2021, 115
18
Bonilla AG, Pourat N, Chuang E, Ettner S, Zima B, Chen X, Lu C, Hoang H, Hair BY, Bolton J, Sripipatana A.
Mental Health Staffing at HRSA-Funded Health Centers May Improve Access to Care. Psychiatr Serv. 2021 Jun
2:appips202000337. doi: 10.1176/appi.ps.20
19
Hair BY, Sripipatana A. Patient-Provider Communication and Adherence to Cholesterol Management Advice:
Findings from a Cross-Sectional Survey. Popul Health Manag. 2021 Jan 7. doi: 10.1089/pop.2020.0290. Epub ahead
of print. PMID: 33416441.
20
Baillieu R, Hoang H, Sripipatana A, Nair S, Lin SC. Impact of health information technology optimization on
clinical quality performance in health centers: A national cross-sectional study. PLoS One. 2020 Jul
15;15(7):e0236019. doi: 10.1371/journal.pone.0236019. PMID: 32667953; PMCID: PMC7363086.
21
Chuang E, Pourat N, Chen X, et al. Organizational Factors Associated with Disparities in Cervical and Colorectal
Cancer Screening Rates in Community Health Centers. J Health Care Poor Underserved. 2019;30(1):161-181.
doi:10.1353/hpu.2019.0014.
22
Systematic delivery of enabling services in health centers improve access to care and patient satisfaction. Yue D,
Pourat N, Chen X, Lu C, Zhou W, Daniel M, Hoang H, Sripipatana A, Ponce NA. Enabling Services Improve
Access To Care, Preventive Services, And Satisfaction Among Health Center Patients. Health Aff (Millwood). 2019
Sep;38(9):1468-1474. doi: 10.1377/hlthaff.2018.05228. PMID: 31479374.
23
Nocon, Robert S. et al. “Health Care Use and Spending for Medicaid Enrollees in federally Qualified Health
Centers Versus Other Primary Care Settings” American Journal of Public Health, Nov 2016.
24
Dana B. Mukamel, Laura M. White, Robert S. Nocon, Elbert S. Huang, Ravi Sharma, Leiyu Shi and Quyen NgoMetzger; "Comparing the Cost of Caring for Medicare Beneficiaries in Federally Funded Health Centers to Other
Care Settings" Health Services Research, Volume 51, No. 2, April 2016.
75
76.
claims were paid totaling $72.5 million; in FY 2022, 151 claims were paid totaling $158.3million; and in FY 2023, 145 claims were paid totaling 104.8 million.
Outputs and Outcomes Table
Year and Most
Recent Result /
Target for Recent
Result /
(Summary of
FY 2024
Measure
Result)
Target
1010.01 Number of patients FY 2022: 30.5
33.5 million
served by health centers
million
(Output)
Target: 29.8
million
FY 2025
Target
37.4 million
FY 2025
+/FY 2024
+3.9 million
(Target Exceeded)
1010.06 Rate of births less FY 2022: 8.43%
than 2500 grams (low birth
weight) to prenatal Health Target: Below
Center patients compared to national rate
the national low birth
weight rate (Outcome)
Below national Below national Maintain
rate
rate
1010.07 Percentage of adult FY 2022: 63%
health center patients with
diagnosed hypertension
Target: 63%
whose blood pressure is
under adequate control (less (Target Met)
than 140/90) (Outcome)
62%
63%
+1 percentage
point
1010.08 Percentage of adult FY 2022: 70%
68%
health center patients with
type 1 or 2 diabetes with
Target: 67%
most recent hemoglobin
A1c (HbA1c) under control (Target Exceeded)
(less than or equal to 9
percent) (Outcome)
69%
+1 percentage
point
1010.09 Percentage of
FY 2022: 72%
pregnant health center
patients beginning prenatal Target: 73%
care in the first trimester
(Output)
(Target Not Met)
73%
+1 percentage
point
72%
76
77.
Year and MostRecent Result /
Target for Recent
Result /
(Summary of
FY 2024
Result)
Target
FY 2022: 90%
90%
Measure
1010.10 Percentage of
health center patients who
are at or below 200 percent Target: 91%
of poverty (Output)
(Target Not Met)
FY 2025
Target
91%
FY 2025
+/FY 2024
+1 percentage
point
1010.11 Percentage of
FY 2022: 78%
76%
health centers with at least
one site recognized as a
Target: 75%
patient centered medical
home (Output)
(Target Exceeded)
77%
+1 percentage
point
1010.13 Percentage of
FY 2022: 70%
68%
health center patients 12
years of age and older
Target: Not
screened for depression and Defined
had a follow up plan
documented as appropriate (Historical Actual)
(Output)
69%
+1 percentage
point
1010.15 Percentage of
FY 2022: 82%
health center patients seen
within 30 days of first HIV Target: Not
diagnosis (Outcome)
Defined
82%
83%
+1 percentage
point
69%
70%
+1 percentage
point
1010.17 Percentage of
FY 2022: 85%
83%
health center patients 18
years of age and older
Target: Not
screened for tobacco use
Defined
and provided intervention if
appropriate (Output)
(Historical Actual)
84%
+1 percentage
point
(Historical Actual)
1010.16 Percentage of
health center patients 3-16
years of age receiving
weight assessment and
counseling (Output)
FY 2022: 69%
Target: Not
Defined
(Historical Actual)
77
78.
Year and MostRecent Result /
Target for Recent
Result /
FY 2025
(Summary of
FY 2024
FY 2025
+/Result)
Target
Target
FY 2024
FY 2022: 93%
Discontinued Discontinued N/A
Measure
1010.02 Percentage of
grantees that provide the
following services either on- Target: 90%
site or by paid referral: (b)
Preventive Dental Care
(Target Exceeded)
(Output)
1010.03 Percentage of
FY 2022: 98%
Discontinued Discontinued N/A
grantees that provide the
following services either on- Target:
site or by paid referral: (c) 93%
Mental Health/Substance
Abuse (Output)
(Target Exceeded)
1010.04 Number of HIV
tests conducted (Output)
FY 2022: 3.5
million
Discontinued Discontinued N/A
Target: 2.8 million
(Target Exceeded)
1010.05 Number of medical FY 2022: 1,704
patients per medical
physician in health centers Target: 1,775
(Efficiency)
(Target Not Met)
1,704
Discontinued N/A
1010.12 Percentage of
FY 2022: 85%
85%
health center grantees
providing additional dental Target: Not
treatment services either on- Defined
site or by paid referral
(Output)
(Historical Actual)
Discontinued N/A
1010.14 Percentage of
health center grantees that
provide substance use
disorder services (Output)
Discontinued N/A
FY 2022: 55%
90%
Target: Not
Defined
(Historical Actual)
78
79.
Grants Awards TableFY 2023
Final
Number of Awards
Average Award
Range of Awards
FY 2024
CR
1,376
1,468
FY 2025
President’s Budget
1,468
$3.8 million
$4.22 million
$5.0 million
$400,000 – $23 million $400,000 – $25 million $400,000 – $27 million
79
80.
Free Clinics Medical MalpracticeFY 2024
Continuing
Resolution
FY 2023
Final
FY 2025
President’s
Budget
FY 2025
+/FY 2023
BA
$1,000,000
$1,000,000
$1,000,000
---
FTE
---
---
---
---
Authorizing Legislation: Public Health Service Act, Section 224(o), as amended by Patient
Protection and Affordable Care Act, Section 10608, Public Law 111-148.
FY 2025 Authorization………………………………………………………………..Indefinite
Allocation Method…………………………………………………………………………...Other
Program Description
The Free Clinics Medical Malpractice Program encourages health care providers to volunteer
their time at qualified free clinics by providing medical malpractice protection at sponsoring
health clinics, thus expanding the capacity of the health care safety net. In many communities,
free clinics assist in meeting the health care needs of the uninsured and underserved. They
provide a venue for providers to volunteer their services. Most free clinics are small
organizations with annual budgets of less than $250,000.
In FY 2004, Congress provided first-time funding for payments of free clinic provider’s claims
under the Federal Tort Claims Act (FTCA). The appropriation established the Free Clinics
Medical Malpractice Judgment Fund and extended FTCA coverage to medical professional
volunteers in free clinics in order to expand access to health care services for low-income
individuals in medically underserved areas.
Allocation Method: Qualifying free clinics submit applications to the Department of Health and
Human Services to deem providers that they sponsor. Qualifying free clinics (or health care
facilities operated by nonprofit private entities) must be licensed or certified in accordance with
applicable law regarding the provision of health services. To qualify under the Free Clinics
Medical Malpractice Program, the clinic cannot: accept reimbursements from any third-party
payor (including reimbursement under any insurance policy or health plan, or under any Federal
or State health benefits program including Medicare or Medicaid); or impose charges on the
individuals to whom the services are provided; or impose charges according to the ability of the
individual involved to pay the charge.
Budget Request
The FY 2025 Target Level for the Free Clinics Medical Malpractice Program is $1 million,
which is equal to the FY 2023 Final level. In FY 2022, there was one paid claim under the Free
Clinics Medical Malpractice Program. The Program Fund has a current balance of
approximately $4 million. The request will support the Program’s continued achievement of its
performance targets addressing its goal of maintaining access and capacity in the health care
80
81.
safety net. The funding request also includes costs associated with information technology andother program support costs.
Targets for FY 2025 focus on maintaining FY 2024 target levels for the number of patient visits
provided by free clinic health care providers deemed eligible for FTCA malpractice
coverage. The Program will also continue to promote efficiency by restraining growth in the
annual Federal administrative costs necessary to deem each provider, with a target of $75
administrative cost per provider in FY 2025.
The FY 2025 Budget will also support the Program’s continued coordination and collaboration
with related Federal programs to further leverage and promote efforts to increase the capacity of
the health care safety net. Areas of collaboration include coordination with the Health Center
FTCA Program, also administered by HRSA, to share program expertise. In addition, the two
programs control costs by sharing a contract to process future claims, and by providing technical
support and outreach. The Program will coordinate with non-profit free clinic-related umbrella
groups on issues related to program information dissemination and outreach and will continue to
collaborate with the Department of Justice (DOJ) to assist in drafting items including deeming
applications and related policies.
The funding request also includes costs associated with the grant review and award process,
follow-up performance reviews, and information technology and other program support costs.
Funding History
Fiscal Year
Amount
FY 2021
$1,000,000
FY 2022
$1,000,000
FY 2023
$1,000,000
FY 2024 Continuing Resolution
$1,000,000
FY 2025 Budget Request
$1,000,000
Program Accomplishments
Increasing Access: In FY 2022, 11,463 health care providers received Federal malpractice
insurance through the Free Clinics Medical Malpractice Program, exceeding the Program
target. In FY 2022, 248 clinics participated, exceeding the program target. Free clinics realized
an increase in patient visits in FY 2022, with over 1.1 million reported. The increase was due to
the impact of COVID-19 on the demand for services at free clinics in FY 2022, which is
expected to return to pre-COVID-19 levels.
Promoting Efficiency: The Free Clinics Medical Malpractice Program is committed to
improving overall efficiency by controlling the Federal administrative costs necessary to deem
each provider. By restraining these annual administrative costs, the Program is able to provide
81
82.
an increasing number of clinicians with malpractice coverage, thus building the free clinicworkforce capacity nationwide and increasing access to care for the target populations served by
these clinics.
Outputs and Outcomes Table
Year and Most
Recent Result /
Target for Recent
Result /
FY 2024
(Summary of
Measure
Target
Result)
1020.02 Patient visits FY 2022: 1,135,256 500,000
provided by free clinics
sponsoring Federal
Target: 500,000
Tort Claims Act
deemed clinicians.
(Target Exceeded)
(Output)
FY 2025
Target
FY 2025
+/- FY 2024
500,000
Maintain
1020.04 Administrative FY 2022: $42
costs of the program
per Federal Tort
Target: $75
Claims Act covered
provider. (Efficiency)
(Target Exceeded)
$75
Discontinued
Maintain
1020.01 Number of
FY 2022: 11,463
free clinic health care
providers deemed
Target: 11,000
eligible for Free Clinics
Federal Tort Claims
(Target Exceeded)
Act malpractice
coverage (Output)
Discontinued
Discontinued
N/A
1020.03 Number of
FY 2022: 248
free clinics operating
with Free Clinics
Target: 220
Federal Tort Claims
Act deemed clinicians (Target Exceeded)
(Output)
Discontinued
Discontinued
N/A
82
83.
Health WorkforceTAB
83
84.
HEALTH WORKFORCENational Health Service Corps
BA
Mandatory
Funding
NHSC
Mandatory
Proposed
Total
FTE
FY 2023
Final
FY 2024
Continuing
Resolution
FY 2025
President’s
Budget
FY 2025
+/FY 2023
$125,600,000
$125,600,000
$125,600,000
---
$292,330,000
$135,890,000
---
-$292,330,000
---
$654,110,000
$790,000,000
+$790,000,000
$417,930,000
251
$915,600,000
270
$915,600,000
270
+$497,670,000
+19
Authorizing Legislation:
Public Health Service Act, Sections 338 and 338H, as amended by the Health Care Safety Net
Act, Section 3, Public Law 110-355, and the Patient Protection and Affordable Care Act, Section
5207, Public Law 111-148.
Mandatory Funding: Patient Protection and Affordable Care Act, Section 10503(b)(2), Public
Law 111-148, as amended by the Consolidated Appropriations Act, 2021, Division BB, Title III,
Section 301, Public Law 116-260.
FY 2025 Mandatory Funding................................................................................................ Expired
Allocation Method ...............................................................................Other (Competitive Awards)
Program Description
Since its inception in 1972, the National Health Service Corps (NHSC) has increased access to
care in underserved areas by supporting qualified health care providers working in underserved
communities in urban, rural, and tribal areas. Across the nation, NHSC clinicians serve patients
in Health Professional Shortage Areas (HPSAs) – areas that meet criteria for having a greater
need for primary, oral health, or behavioral health care providers. Using scholarships and loan
repayment, the NHSC incentivizes primary care clinicians to serve in the more than 22,000
Primary Care, Dental, and Mental Health HPSAs across the nation.
Section 332(k)(1) of the Public Health Service Act directed HRSA to identify Maternity Care
Target Areas, or geographic areas within HPSAs that have a shortage of maternity care health
professionals, and the agency has identified 6,383 Maternity Care Target Areas. In Fiscal Year
(FY) 2023, HRSA began using Maternity Care Target Area scores, which are generated for each
84
85.
Primary Care HPSA using its service area, to distribute NHSC loan repayment awards tomaternity care health professionals to serve in Maternity Care Target Areas. Maternity care
providers are defined as obstetricians and gynecologists, family practice physicians providing
obstetric care, and certified nurse midwives.
The NHSC operates six programs to place clinicians at NHSC-approved sites in underserved
communities across the nation. These health care delivery sites must meet certain requirements,
including providing care to individuals regardless of their ability to pay using a sliding fee
schedule.
NHSC Scholarship Program: The NHSC Scholarship Program provides financial support
through scholarships that cover tuition, other reasonable education expenses, and a monthly
living stipend, to health professions students committed to providing primary care in underserved
communities with the greatest need. The NHSC Scholarship Program provides a supply of
clinicians who will be available over the next one to eight years, depending on the length of their
education and training programs. Upon completion of training, NHSC scholars become salaried
employees of NHSC-approved sites in underserved communities. NHSC scholars will provide a
one-year service commitment for each year of scholarship support received. There is a two-year
minimum service commitment, and awardees can receive a maximum of four years of
scholarship support.
NHSC Loan Repayment Program: The NHSC Loan Repayment Program offers fully trained
primary care clinicians the opportunity to receive assistance to pay off qualifying educational
loans in exchange for service at an NHSC-approved site in a HPSA. For an initial two years of
service, providers serving in a Primary Care HPSA receive up to $75,000 in loan repayment
assistance. Providers serving in a Mental Health HPSA or in a Dental Health HPSA receive up to
$50,000 in loan repayment assistance. The NHSC Loan Repayment Program also offers
participants in all HPSA types the option of continuing their service for an additional $20,000
for each year until all eligible educational debt has been satisfied. The Program recruits both
clinicians as they complete training and clinicians who are practicing professionals and are
immediately available for service.
The NHSC receives a dedicated appropriation to support awards to fully trained primary care,
oral health, and behavioral health clinicians, including substance use disorder treatment
providers, to deliver health care services in Indian Health Service facilities, tribally operated
“638” health programs, and urban Indian health programs. Federal Indian Health Service clinics,
tribal health clinics, urban Indian health programs, and dually funded tribal health
clinics/community health centers are automatically designated as HPSAs. With this directed
funding, the NHSC has awarded all eligible clinicians serving in these facilities and programs
who have applied to the NHSC loan repayment programs.
NHSC Substance Use Disorder Workforce Loan Repayment Program: The NHSC receives a
dedicated appropriation to expand and improve access to quality substance use disorder
treatment in rural and underserved areas nationwide in a variety of settings, including Opioid
Treatment Programs, Office-Based Opioid Treatment Facilities, and non-opioid outpatient
substance use disorder facilities. The funding supports the recruitment and retention of health
85
86.
professionals needed in underserved areas to provide evidence-based substance use disordertreatment and prevent overdose deaths. In exchange for three years of service at an NHSCapproved substance use disorder treatment facility, providers receive up to $75,000 in loan
repayment assistance to reduce their educational financial debt.
NHSC Rural Community Loan Repayment Program: A portion of the dedicated appropriation
provides funding for the NHSC Rural Community Loan Repayment Program, a program for
providers working to combat the opioid epidemic in the nation’s rural communities. The NHSC
Rural Community Loan Repayment Program has made loan repayment awards in coordination
with the Rural Communities Opioid Response Program initiative funded by the Federal Office of
Rural Health Policy to provide evidence-based substance use treatment, assist in recovery, and
prevent overdose deaths across the nation. Providers receive up to $100,000 in loan repayment
assistance to reduce their educational financial debt in exchange for three years of service at rural
NHSC-approved substance use disorder treatment facilities.
The loan repayment programs described above also offer a one-time award supplement of up to
$5,000 to providers who demonstrate medical Spanish language proficiency and serve at sites
that identify the recruitment need for providers capable of caring for limited English proficiency
patients in HPSAs.
NHSC Students to Service Loan Repayment Program: The NHSC Students to Service Loan
Repayment Program provides loan repayment assistance of up to $120,000 to health professions
students in their last year of school in return for a three-year commitment to provide primary
health care in rural and urban HPSAs of greatest need. To support HRSA’s efforts to distribute
the maternal health workforce to designated Maternity Care Target Areas, the Students to
Service Loan Repayment Program offers a supplemental award of up to $40,000 to NHSCawarded maternity care health professionals providing health services in Maternity Care Target
Areas with high scores.
State Loan Repayment Program: The State Loan Repayment Program is a federal-state
partnership grant program that requires a dollar-for-dollar match from the state for the federal
funds it receives through the grant. The state uses the grant funds to enter into loan repayment
contracts with clinicians who practice in a HPSA in that state. The program serves as a
complement to the NHSC and provides flexibility to states to help meet their unique primary
care workforce needs as states have discretion to focus on one, some, or all the eligible primary
care disciplines within the NHSC and may also include pharmacists and registered nurses. States
receiving funding from this opportunity are encouraged to allow health professionals to practice
to the full extent of their licenses.
In FY 2022, HRSA made 50 new three-year State Loan Repayment Program awards through
additional flexibilities authorized by the American Rescue Plan Act of 2021. These flexibilities
included waiving the matching funds requirement and allowing up to 10 percent of grant funds to
be spent on administrative costs.
Eligible Entities:
86
87.
NHSC Scholarship Program and Students to Service Loan Repayment Program:Participants must be enrolled or accepted for enrollment as a full-time student pursuing a degree
in an NHSC-eligible discipline at an accredited health professions school or program located in a
state, the District of Columbia, or a U.S. territory.
NHSC Loan Repayment Program: Participants must be practicing in an NHSC-eligible
discipline with qualified student loan debt for education that led to their degree.
NHSC Substance Use Disorder Workforce and Rural Community Loan Repayment
Programs: Participants must be working, or have accepted a position to work, at an NHSCapproved substance use disorder treatment facility.
State Loan Repayment Program: The 50 states, the District of Columbia, the Commonwealth
of Puerto Rico, the U.S. Virgin Islands, Guam, American Samoa, the Republic of Palau, the
Marshall Islands, and the Commonwealth of the Northern Mariana Islands.
Budget Request
The FY 2025 Budget Request for the NHSC of $915.6 million is $497.7 million more than the
FY 2023 Final level. The Budget will enable HRSA to increase its anticipated field strength in
in FY 2025 to more than 24,800 by recruiting primary care, behavioral health, and oral health
providers to areas of greatest need. The NHSC will also continue to work to recruit a workforce
that is well prepared to meet patients’ needs, including addressing language access barriers to
quality care. HRSA also will fund a new grant competition for the State Loan Repayment
Program in FY 2025.
To support a qualified health workforce dedicated to serving in areas of the United States with
limited access to care, the FY 2025 Budget Request also includes a new legislative proposal to
expand eligibility for the NHSC Scholarship and Loan Repayment Programs to include lawful
permanent residents of the U.S. Including qualified permanent residents as eligible applicants
will align the NHSC with other health workforce training and service programs and support
continued efforts to recruit and retain a highly qualified health workforce in underserved
communities.
The funding request also includes costs associated with the award process, follow-up
performance reviews, information technology enhancements, and other program support costs.
FY 2024
FY 2025
FY 2026
Total Funding
Mandatory Enacted
$136 million
---
---
$136 million
Proposed Mandatory
Funding
$654 million
$790 million
$790 million
$2.23 billion
87
88.
Funding History25FY
FY 2021 Discretionary
FY 2021 Mandatory
Amount
$119,526,000
Supplemental
Amount
---
$310,000,000
$800,000,000
FY 2022 Discretionary
$121,600,000
---
FY 2022 Mandatory
$292,330,000
---
FY 2023 Discretionary
$125,600,000
---
FY 2023 Mandatory
$292,330,000
---
FY 2024 Discretionary CR
$125,600,000
---
FY 2024 Mandatory Enacted
$135,890,000
---
FY 2024 Mandatory Proposed
$654,110,000
---
FY 2025 Discretionary President’s
Budget
$125,600,000
---
FY 2025 Mandatory President’s
Budget
$790,000,000
---
Program Accomplishments
As of September 30, 2023, there were more than 18,000 primary care, oral health, and behavioral
health practitioners serving in the NHSC across the United States at NHSC-approved sites. There
are more than 21,000 NHSC-approved sites across the country. Eligible sites include facilities
such as Federally Qualified Health Centers and Look-Alikes, American Indian and Alaska
Native health clinics, rural health clinics, school-based clinics, and community mental health
centers. One-in-three NHSC clinicians provide care in rural communities.
The discipline mix of the NHSC field strength reflects the program’s efforts to respond to the
demand for services in underserved communities as well as the program’s commitment to an
interdisciplinary approach to patient care. The NHSC continues to expand the number of
behavioral health clinicians in the program by continuing the Substance Use Disorder Workforce
and Rural Community Loan Repayment Programs.
Retention among NHSC clinician alumni, a measure of participants who continue to provide care
in a HPSA after their service commitment has ended, continues to be high. The two-year
25
FY 2022 and FY 2023 mandatory funding reflects post-sequestration amounts.
88
89.
retention rate among NHSC participants who completed their service obligation in FY 2021 is 86percent. The Health Workforce Clinician Dashboard calculates retention rates for NHSC
providers and uses National Provider Identifier numbers from the Centers for Medicare &
Medicaid Services as a baseline, in conjunction with other data sources, to determine the current
practice locations of providers who previously served in the NHSC.
NHSC Students in Pipeline by Program as of September 30, 2023
Program
Scholarship Program
Students to Service Program
Total
Students
2,813
365
3,178
NHSC Students in Pipeline by Discipline as of September 30, 2023
Discipline
Allopathic/Osteopathic Physicians
Dentists
Nurse Practitioners
Physician Assistants
Certified Nurse Midwives
Total
Students
1,100
905
253
874
46
3,178
NHSC Field Strength by Program as of September 30, 2023
Program
Scholarship Program Clinicians (NHSC Scholars)
Loan Repayment Program Clinicians
State Loan Repayment Program Clinicians
Substance Use Disorder Workforce Loan Repayment Program Clinicians
Rural Community Loan Repayment Program Clinicians
Students to Service Loan Repayment Program Participants
Total
89
Clinicians
806
10,019
2,417
2,552
1,879
662
18,335
90.
NHSC Field Strength by Discipline as of September 30, 2023Discipline
Allopathic/Osteopathic Physicians
Dentists
Dental Hygienists
Nurse Practitioners
Physician Assistants
Nurse Midwives
Mental and Behavioral Health Professionals
Other State Loan Repayment Program Clinicians
Total
Clinicians
2,137
1,419
384
3,622
1,504
246
8,737
286
18,335
Average NHSC New Award by Program as of September 30, 2023
Program
Scholarship Program
Students to Service Loan
Repayment Program
Loan Repayment Programs
Service Requirement for
Initial Contract
2 – 4 years
Average Award Amount for
Initial Contract
$254,252
3 years
$107,451
2 – 3 years
$53,293
Outputs and Outcomes Table
Measure
2010.01: Default rate of
National Health Service
Corps Scholarship and Loan
Repayment Program
participants (Efficiency)
2010.02: Estimated number
of patients served by
National Health Service
Corps clinicians (Outcome)
Year and Most
Recent Result /
Target for Recent
Result/
(Summary of
Result)
FY 2023: 0.93%
FY 2024
Target
≤ 2.0%
FY 2025
Target
≤ 2.0%
FY 2025
Target
+/FY 2024
Target
Maintain
22.0
million
26.0
million
+4.0
million
Target: ≤ 2.0%
(Target Exceeded)
FY 2023: 19.25
million
Target: 15.36
million
(Target Exceeded)
90
91.
Measure2010.03: Field strength
(participants in service) of
the National Health Service
Corps (Outcome)
Year and Most
Recent Result /
Target for Recent
Result/
(Summary of
Result)
FY 2023: 18,335
FY 2024
Target
21,000
FY 2025
Target
24,800
FY 2025
Target
+/FY 2024
Target
+3,800
85%
85%
Maintain
20,970
22,970
+2,000
Target: 14,630
(Target Exceeded)
2010.04: Percentage of
National Health Service
Corps clinicians retained in
service to the underserved
for at least one year beyond
the completion of their
National Health Service
Corps service commitment
(Outcome)
FY 2023: 84%
Target: 82%
(Target Exceeded)
2010.05: Number of National FY 2023: 21,641
Health Service Corps sites
(Output)
Target: 18,500
(Target Exceeded)
Performance Narrative
The FY 2023 field strength reflects the continuation of the American Rescue Plan Act funded
new placements awarded in FY 2021 and FY 2022.
While the program has grown, program default rates have remained consistently low and are
trending lower. Overall, the NHSC maintained a ten-year total default rate in FY 2023 of 0.93
percent or 638 defaults across 68,968 awards.
The increased number of NHSC sites (Output Measure 2010.05) means more communities have
the opportunity to recruit clinicians who train, serve, and become employed in high need, rural,
urban, and tribal areas. Depending on their site type, NHSC-approved sites must provide
documentation verifying compliance with statutorily defined eligibility requirements at the point
of New Site Application, Site Recertification, site visits, and upon request to confirm site
eligibility. During FY 2023, the NHSC opened a New Site Application Cycle in April 2023, and
opened a Site Recertification Application Cycle in August 2023. In addition, the NHSC accepted
streamlined applications from facilities classified as NHSC auto-approved sites (e.g., Federally
91
92.
Qualified Health Centers and Indian Health Service sites) throughout FY 2023. The total numberof NHSC site applications, including NHSC auto-approved sites, submitted during FY 2023 was
3,693.
Loan Repayments/Scholarships Awards Table
FY 2023
Final
Loan Repayments
State Loan Repayments2
Scholarships
Students to Service Loan
Repayment
$253,972,732
--$48,527,283
$16,869,747
92
FY 2024
Continuing
Resolution
$648,024,495
--$52,975,737
$50,000,000
FY 2025
President’s
Budget
$628,978,259
$15,000,000
$55,691,312
$50,000,000
93.
NHSC Award By YearProgram
Scholarships
Scholarship
Continuations
Scholarships
Subtotal
Loan
Repayments
Loan
Repayment
Continuations
Loan
Repayment
Subtotal
State Loan
Repayments
Students to
Service Loan
Repayments
Total
Awards
2016
205
2017
181
2018
222
2019
200
2020
251
2021
1,192
2022
1,199
2023
180
2024
180
2025
180
8
7
7
11
12
7
25
48
14
14
213
188
229
211
263
1,199
1,224
228
194
194
3,079
2,554
3,262
5,044
5,963
6,369
5,229
4,173
9,300
9,242
2,111
2,259
2,384
2,385
2,355
2,277
2,476
2,421
3,129
2,391
5,190
4,813
5,646
7,429
8,318
8,646
7,705
6,594 12,429 11,633
634
535
625
854
712
855
65626
1,047
806
62527
92
175
162
127
148
257
368
157
410
410
6,129
5,711
6,662
8,621
9,441 10,957
9,953
26
8,026 13,839 12,862
In late FY 2022, HRSA utilized $100 million provided in the American Rescue Plan Act to fully fund 3-year
grants under the State Loan Repayment Program spanning FY 2022 through FY 2025. The FY 2022 reduction in
total new awards reflects delays in awarding loan repayment contracts which appear in the higher-than-expected
total in FY 2023.
27
HRSA will also fund a new grant competition for the State Loan Repayment Program with the budget requested in
FY 2025 and expects new grantees to require time to ramp up.
93
94.
NHSC Field Strength By YearProgram
2016
2017
2018
2019
2020
2021
2022
Scholars
437
405
463
506
573
671
701
806
8,593
8,362
8,849
10,221
13,122
16,613
16,853
14,45028
1,378
179
277
369
388
454
568
662
430
420
85
1,233
1,350
1,957
2,146
2,246
2,093
2,417
1,853
1,431
10,179 10,939
13,053
16,229
19,984
20,215
18,335
21,044 24,858
Loan
Repayment
Students to
Service
Loan
Repayment
State Loan
Repayment
Total Field
Strength
10,493
28
2023
2024
2025
712
745
18,049 22,262
In FYs 2023 and 2024, significant funding supported one-year continuation contracts for providers previously
awarded multi-year initial contracts using American Rescue Plan Act funding.
94
95.
Faculty Loan Repayment ProgramFY 2024
Continuing
Resolution
FY 2023
Final
FY 2025
President’s
Budget
FY 2025
+/FY 2023
BA
$2,310,000
$2,310,000
$2,310,000
---
FTE
---
---
---
---
Authorizing Legislation: Public Health Service Act, Sections 738(a) and 740(b), as amended by
the CARES Act, Section 3401, Public Law 116-136.
FY 2025 Authorization ........................................................................................$1,190,000
Allocation Method ........................................... Other (Competitive Awards to Individuals)
Program Description
The Faculty Loan Repayment Program supports health professionals from economically and
environmentally disadvantaged backgrounds serving in faculty positions at accredited health
professions schools. The goal of the Faculty Loan Repayment Program is to decrease the
economic barriers associated with pursuing careers as academic faculty. The Faculty Loan
Repayment Program provides loan repayment to health profession graduates who serve as faculty
at eligible health professions colleges or universities for a minimum of two years. In return, the
federal government agrees to pay up to $20,000 of the outstanding principal and interest on the
individual’s health professions education loans for each year of service. The Faculty Loan
Repayment Program awards a maximum of $40,000 for a two-year service obligation. The
employing institution must also make payments to the faculty member that match the amount paid
by HRSA or request a full or partial waiver of the match requirement.
Eligible Entities: Participants must come from a disadvantaged background, have an eligible
health professions degree or certificate, and be a faculty member at an eligible health professions
school.
Budget Request
The FY 2025 Budget Request for the Faculty Loan Repayment Program of $2.3 million is equal
to the FY 2023 Final level. The FY 2025 funding will be used to continue to support 40 awards.
The funding will allow HRSA to recruit and retain health professions faculty members and
encourage students to pursue faculty roles in their chosen health care field.
The funding request also includes costs associated with the application review and award process,
follow-up performance reviews, and information technology and other program support costs.
95
96.
To further support the Faculty Loan Repayment Program, the FY 2025 Budget Request alsoincludes a legislative proposal to extend the tax-exempt status that is provided to the National
Health Service Corps Program recipients to HRSA’s similar health care workforce loan
repayment programs. If HRSA is not required to pay employer taxes on the award, more funds
would be available for HRSA to make additional or higher awards through these programs.
Funding History
FY
FY 2021
FY 2022
FY 2023
FY 2024 CR
FY 2025 President’s Budget
Amount
$1,186,000
$1,226,000
$2,310,000
$2,310,000
$2,310,000
Faculty Loan Repayment Program Awards Table
FY 2024
Continuing
Resolution
FY 2023
Final
Number of Awards
41
FY 2025
President’s Budget
40
96
40
97.
Health Professions Training for DiversityCenters of Excellence
FY 2024
Continuing
Resolution
FY 2023
Final
FY 2025
President’s
Budget
FY 2025
+/FY 2023
BA
$28,422,000
$28,422,000
$28,422,000
---
FTE
1
1
1
---
Authorizing Legislation: Public Health Service Act, Section 736, as amended by the CARES
Act, Section 3401, Public Law 116-136.
FY 2025 Authorization ......................................................................................$23,711,000
Allocation Method ...................................................................................Competitive Grant
Program Description
The Centers of Excellence Program provides grants to health professions schools and other
public and nonprofit health or educational entities to serve as innovative resource and education
centers for the recruitment, training, and retention of underrepresented minority students and
faculty.
By statute, the Centers of Excellence Program awards funding to recipients who have
demonstrated success in matriculating and graduating underrepresented minorities using a
multifaceted approach that supports students and developing faculty. Grant recipients operate
programs that establish, strengthen, and expand programs to enhance the academic performance
of underrepresented minority students and improve information resources, clinical education,
curricula, and cultural competence as they relate to minority health issues and social
determinants of health. Additionally, the Centers of Excellence Program supports faculty and
student research on health issues relating to the delivery of health care and health disparities that
particularly affect underrepresented minority groups. Through strategic partnerships, grant
recipients increase the applicant pool of underrepresented minority students within health
professions schools, establish and expand programs to enhance academic performance of these
students, and utilize stipends to assist underrepresented minority students and faculty with
financial support.
Eligible Entities: Health professions schools and other public and nonprofit health or
educational entities that operate programs of excellence for underrepresented minority
individuals and meet the general conditions requirements in section 736(c)(1)(B) of the Public
97
98.
Health Service Act, including certain Historically Black Colleges and Universities; HispanicCenters of Excellence; Native American Centers of Excellence; and other Centers of Excellence.
Budget Request
The FY 2025 Budget Request for the Centers of Excellence Program of $28.4 million is equal to
the FY 2023 Final level. In FY 2025, HRSA will support 26 existing grant recipients through
non-competing continuation awards to train approximately 5,000 individuals in the health career
pipeline.
The funding request also includes costs associated with follow-up performance reviews,
information technology, and other program support costs.
Funding History
FY
FY 2021
FY 2022
FY 2023
FY 2024 CR
FY 2025 President’s Budget
Amount
$23,510,000
$24,422,000
$28,422,000
$28,422,000
$28,422,000
Program Accomplishments
In Academic Year (AY) 2022-2023, the Centers of Excellence Program trained 4,512 high
school, undergraduate, and graduate-level students, including medical, dental, and pharmacy
graduate-level students entering or progressing through the health professions pipeline. A total of
2,445 students completed their Centers of Excellence Program, which included high school
enrichment programs, pre-matriculation and post-baccalaureate programs, and summer
programs, among others. Select program outcomes include:
One year after completing a Centers of Excellence program, 56 percent of former
program participants remained enrolled in their health professions training program, were
accepted into a new training program, or were working or pursuing additional training in
a medically underserved community or primary care setting; an additional 10 percent
were pursuing a health career.
343 student-initiated, faculty-led collaborative research projects on health disparities that
disproportionately affect underrepresented minority groups occurred because of the
Centers of Excellence program. Project topics included health disparities (28 percent),
underrepresented minority health issues (22 percent), and community health assessments
(14 percent).
98
99.
Outputs and Outcomes TablesMeasure
2030.01 Number of
individuals in the
health career pipeline
trained by the Centers
of Excellence Program
(Output)
2030.02 Percentage of
program completers
who are also
underrepresented
minorities (Outcome)
Year and Most
Recent Result /
Target for Recent
Result /
(Summary of
Result)
FY 2022: 4,512
FY 2025
Target +/FY 2024
Target
Maintain
FY 2024
Target
5,000
FY 2025
Target
5,000
65%
70%
+5 percentage
points
Discontinued
Discontinued
N/A
Target: Not
Defined
(Historical Actual)
FY 2022: 77%
Target: Not
Defined
(Historical Actual)
FY 2022: 18%
6.I.C.21 Percent of
program participants
who received academic Target: 40%
retention support and
maintained enrollment (Target Not Met)
in a health professions
degree program
(Outcome)
Performance Narrative
Most recent results are for activities in Academic Year (AY) 2022-2023 funded in FY 2022.
Measure 6.I.C.21 was discontinued in the FY 2024 Congressional Budget Justification. The
measure did not appropriately capture the full benefits that program participants received from
academic retention support, since it only focused on students continuing their training and not
those who graduated.
99
100.
Grant Awards TableFY 2023
Final
Number of Awards
FY 2024
Continuing
Resolution
FY 2025
President’s Budget
26
26
Average Award
$1,026,317
$1,026,317
Range of Awards
$503,475 –
$3,000,000
$503,475 –
$3,000,000
100
26
$1,026,317
$503,475 –
$3,000,000
101.
Scholarships for Disadvantaged StudentsFY 2024
Continuing
Resolution
FY 2023
Final
FY 2025
President’s
Budget
FY 2025
+/FY 2023
BA
$55,014,000
$55,014,000
$55,014,000
---
FTE
7
7
7
---
Authorizing Legislation: Public Health Service Act, Sections 737 and 740(a), as amended by the
CARES Act, Section 3401, Public Law 116-136.
FY 2025 Authorization ......................................................................................$51,470,000
Allocation Method ...................................................................................Competitive Grant
Program Description
The Scholarships for Disadvantaged Students Program provides grants to eligible health
professions and nursing schools to award scholarships to students from disadvantaged
backgrounds who are pursuing a degree in a health profession and have financial need. The
program also connects students to retention services and activities that support their progression
through their training program.
By statute, the schools must agree to give preference to students for whom the costs of attending
the schools would constitute a severe financial hardship. In awarding grants, HRSA must give
priority to schools based on the proportion of graduating students going into primary care, the
proportion of underrepresented minority students, and the proportion of graduates working in
medically underserved communities.
The Scholarships for Disadvantaged Students Program exposes students to primary care and
facilitates placements in Medically Underserved Communities to improve distribution, diversity,
and supply of primary care providers; strengthens the health workforce by facilitating the entry
of individuals from disadvantaged backgrounds; and enhance quality and access to health care
for individuals in Medically Underserved Communities. The Scholarships for Disadvantaged
Students Program directs funds to educate midwives to address the national shortage of
maternity care providers. Additionally, in an effort to combat behavioral health workforce
shortages, up to 25 percent of Scholarships for Disadvantaged Students Program funding is
designated for graduate programs in behavioral health.
Eligible Entities: Accredited schools of medicine, osteopathic medicine, dentistry, nursing,
pharmacy, physical therapy, podiatric medicine, optometry, veterinary medicine, public health,
101
102.
chiropractic, allied health, and a school offering a graduate program in behavioral and mentalhealth practice or an entity providing programs for the training of physician assistants.
Budget Request
The FY 2025 Budget Request for the Scholarships for Disadvantaged Students Program of $55
million is equal to the FY 2023 Final level. In FY 2025, HRSA will hold a new competition and
fund up to 85 new and competing continuation Scholarships for Disadvantaged Students
Program awards. HRSA will continue to support grants to educate midwives to address the
national shortage of maternity care providers within available funding. Additionally, to combat
health workforce shortages, HRSA has designated up to 25 percent of funds for graduate
programs in behavioral health and up to 25 percent for programs in allied health.
The funding request also includes costs associated with the grant review and award process,
follow-up performance reviews, and information technology and other program support costs.
Funding History
Fiscal Year
FY 2021
FY 2022
FY 2023
FY 2024 CR
FY 2025 President's Budget
Amount
$51,390,000
$53,014,000
$55,014,000
$55,014,000
$55,014,000
Program Accomplishments
In Academic Year (AY) 2022-2023, the Scholarships for Disadvantaged Students Program
provided scholarships to 2,613 health professions students from disadvantaged backgrounds. A
total of 1,236 students graduated, including 471 nursing students, 299 behavioral health students,
and 239 allied health students. Select program outcomes include helping disadvantaged students
progress through their health professions training, and encouraging students to work in medically
underserved communities and primary care:
3 percent of program graduates earned an associate degree, 24 percent earned a
bachelor’s degree, 53 percent earned a master’s degree, and 19 percent earned a doctorallevel degree.
59 percent of graduates with follow-up data worked or trained in medically underserved
communities one year after graduation, and 30 percent in primary care settings.
102
103.
Outputs and Outcomes TablesMeasure
2040.01 Number of
health professions
students from
disadvantaged
backgrounds who
received financial
support through the
Scholarships for
Disadvantaged Students
Program (Output)
Year and Most
Recent Result
/Target for
Recent Result /
(Summary of
Result)
FY 2022: 2,613
FY 2024
Target
2,600
FY 2025
Target
2,600
FY 2025
Target +/FY 2024
Target
Maintain
Target: 2,390
(Target Exceeded)
Performance Narrative
Most recent results are for activities in Academic Year (AY) 2022-2023 funded in FY 2022.
Grant Awards Table
FY 2023
Final
Number of Awards
FY 2024
Continuing
Resolution
FY 2025
President’s Budget
85
85
85
Average Award
$609,069
$609,069
$650,000
Range of Awards
$230,000 –
$1,000,276
$230,000 –
$1,000,276
$610,000 –
$650,000
103
104.
Health Careers Opportunity ProgramFY 2024
Continuing
Resolution
FY 2023
Final
FY 2025
President’s
Budget
FY 2025
+/FY 2023
BA
$16,000,000
$16,000,000
$16,000,000
---
FTE
2
2
2
---
Authorizing Legislation: Public Health Service Act, Sections 739 and 740(c) as amended by the
CARES Act, Section 3401, Public Law 116-136.
FY 2025 Authorization ......................................................................................$15,000,000
Allocation Method ...................................................................................Competitive Grant
Program Description
The Health Careers Opportunity Program provides individuals from economically and
educationally disadvantaged backgrounds an opportunity to develop the skills needed to
successfully compete for, enter, and graduate from, schools of health professions or allied health
professions. The National Health Careers Opportunity Program Academies, a component of the
program, provide a variety of academic and social supports to individuals from disadvantaged
backgrounds through formal academic and research training, programming, and student
enhancement or support services. Support includes tailored academic counseling and highly
focused mentoring services, student financial assistance in the form of scholarships and stipends,
financial planning resources, and health careers and training information. The goal of the Health
Careers Opportunity Program is to provide a pathway for disadvantaged individuals to enter the
health professions and equip them to deliver high quality, culturally competent care to
underserved individuals.
Health Careers Opportunity Program activities are an integral part of structured programming for
students throughout the academic year. Activities of Health Careers Opportunity Program
grantees include post-baccalaureate, summer, and other programs that provide students with
knowledge, experiences, and opportunities to participate in individualized and tailored academic
coursework and community work in the health professions school areas. Health Careers
Opportunity Program award recipients provide clinical and/or experiential training opportunities
to health and allied health students through community-based training. In addition, the Health
Careers Opportunity Program National Ambassador Program, a longitudinal, integrated
curriculum-based program, aids students from disadvantaged backgrounds while matriculating
through the educational pipeline.
104
105.
Eligible Entities: Accredited health professions schools and other public or private nonprofithealth or educational institutions.
Budget Request
The FY 2025 Budget Request for the Health Careers Opportunity Program of $16 million is
equal to the FY 2023 Final level. The FY 2025 Request will be used to fund 21 existing grantees
expand opportunities for at least 5,000 individuals from disadvantaged backgrounds to enter health
professions.
The funding request also includes costs associated with follow-up performance reviews,
information technology, and other program support costs.
Funding History
FY
FY 2021
FY 2022
FY 2023
FY 2024 CR
FY 2025 President’s Budget
Amount
$14,449,000
$15,450,000
$16,000,000
$16,000,000
$16,000,000
Program Accomplishments
In Academic Year (AY) 2022-2023, the Health Careers Opportunities Program trained 4,805
students pursuing health careers. A total of 3,649 individuals completed their program.
A major component of the Health Careers Opportunities Program is the Ambassadors program, a
longitudinal, curriculum-based program designed to assist students from disadvantaged
backgrounds through the educational pipeline. A total of 2,801 students participated in an
ambassadors program, 1,370 students completed their program, and 558 earned degrees. Select
program outcomes include helping students progress through and advance to the next stage in the
health professions pipeline:
24 percent of high school graduates with follow-up data were accepted into an associate
degree program one year after completing their ambassadors program, and 63 percent
were accepted into a bachelor’s degree program.
35 percent of bachelor’s degree graduates with follow-up data were accepted into a health
professions training program one year after completing their ambassadors program, and
45 percent were pursuing health careers.
105
106.
Outputs and Outcomes TablesMeasure
2050.01 Number of Health
Careers Opportunity
Program trainees from
disadvantaged
backgrounds participating
in academic programming,
clinical training and/or
student support services
(Outcome)
Year and Most
Recent Result
/Target for
Recent Result /
(Summary of
Result)
FY 2022: 4,805
FY 2024
Target
4,500
FY 2025
Target
5,000
FY 2025
Target +/FY 2024
Target
+500
Target: 3,474
(Target
Exceeded)
Performance Narrative
Most recent results are for activities in Academic Year (AY) 2022-2023 funded in FY 2022.
Grant Awards Table
FY 2024
Continuing
Resolution
FY 2023
Final
Number of Awards
FY 2025
President’s Budget
21
21
21
Average Award
$623,579
$623,579
$623,579
Range of Awards
$577,146 – $670,012
$577,146 – $670,012
$577,146 – $670,012
106
107.
The National Center for Health Workforce AnalysisHealth Care Workforce Assessment
BA
FTE
FY 2023
Final
$5,663,000
5
FY 2024
Continuing
Resolution
$5,663,000
7
FY 2025
President’s
Budget
$5,663,000
7
FY 2025
+/FY 2023
--+2
Authorizing Legislation: Public Health Service Act, Section 761, as amended by the CARES
Act, Section 3401, Public Law 116-136.
FY 2025 Authorization ........................................................................................$5,663,000
Allocation Method .................................................................... Competitive Grant/Contract
Program Description
The National Center for Health Workforce Analysis (NCHWA) is the primary Federal entity that
collects, analyzes, and reports on data and information regarding the U.S. health workforce.
NCHWA also evaluates the effectiveness of HRSA’s workforce investment programs.
NCHWA serves as the focal point for HRSA’s efforts to incorporate a data-driven approach to
its work to strengthen the health workforce. To that end, NCHWA conducts the following
activities:
Provides timely data and reports on the current state and trends of the U.S. health
workforce;
Collects health workforce data for the nation;
Develops and leads improvements in data collection capacity by working with other
federal agencies, states, professional associations, and academic and research institutions
to generate and promote guidelines for collection and analysis;
Creates and improves tools for data management, analysis, and modeling to support
health workforce research, policy analysis, and decision making;
Collects annual performance data from HRSA’s workforce programs and policies and
evaluates their effectiveness;
Responds to information and data needs by translating data and findings to inform
policies, programs, and the public.
NCHWA continues to enhance its projection model to allow for even more sophisticated analysis
and projection of health workforce supply and demand, taking into account changing national
demographics, the demand for health care services, and the impact those changes have on the
delivery of health care. These projections identify areas where there are projected shortages of
107
108.
providers. Three alternative scenarios look at how many providers would be needed to furtherhealth equity in terms of insurance status, metro/nonmetro location, and demographics of those
seeking care.
Since the nation’s health care system is constantly changing – and preparing new providers
requires long lead times – it is critical to have high quality, research-based evidence to ensure a
workforce of sufficient size and skills capable of meeting the nation’s health care needs.
Policymakers and other decision makers need information on the health care and health support
workforce that incorporates up-to-date research, data, modeling, and trends.
Budget Request
The FY 2025 Budget Request for the National Center for Health Workforce Analysis of $5.6
million is equal to the FY 2023 Final level. This request will fund continued work on health
occupation projections and their visualization for the public, nine Health Workforce Research
Centers, development and publication of the Area Health Resources Files, and publication and
analyses using data from the 2022 National Sample Survey of Registered Nurses.
In FY 2025, NCHWA will continue to model supply and demand of health professionals across a
range of health occupations, years, and metro and non-metro geographies, making these
assessments of the adequacy of the health workforce available through briefs and online tools.
These data are publicly released in an interactive projection visualization tool. As in prior years,
projections data on more than 100 different health care occupations will continue to be published
at the same time, including the following:
Physicians by specialty
Nurses, including advanced practice registered nurses
Primary care providers
Behavioral health providers
Women’s health providers
Long-term care providers
Oral health providers
Allied health providers
These projections will also include alternative scenarios to show how the projected supply and
demand would change if certain key inputs are altered. For example, one alternative scenario
examines how demand would change for an occupation if everyone used its services at the same
rate as the insured population.
In FY 2025, NCHWA will continue to oversee nine Health Workforce Research Centers that
conduct and disseminate research and data analysis on health workforce issues of national
importance and provide technical assistance to regional and local entities on workforce data
108
109.
collection, analysis, and reporting.29 Together, these nine centers examine a broad range of issuesrelated to various sectors of the health care workforce, including (but not limited to) occupations
in oral health, long term services and supports, allied health, behavioral health, emerging health
workforce issues, public health, and health equity in health workforce education and training.
Research conducted by these centers aims to strengthen the evidence base for effective education
and training program strategies that can enable and empower a health workforce capable of
meeting the needs of the population. Researchers, policymakers, and members of the media,
among others, benefit from the research and analyses by the research centers. Examples of their
research include the following:
Developing a deeper understanding of the current behavioral health workforce and its
readiness related to addressing the current opioid and overdose crisis.
Investigating the impact of the COVID-19 pandemic on sectors of the U.S. health
workforce, such as long-term services and support occupations.
Identifying the public health workforce and assessing its capability to respond to the
current and future needs of all Americans.
Evaluating health workforce education and training programs to understand their impact
on increasing access to primary care; mitigating provider shortages in underserved areas;
delivering integrated primary, behavioral, and oral health care; addressing health
workforce diversity; and strengthening community/provider partnerships.
In FY 2025, NCHWA will continue to maintain the Area Health Resources Files dataset on
behalf of the Department of Health and Human Services. The Area Health Resources Files are
updated annually and contain detailed information on health professions, health facilities, and
population demographics from a variety of sources. In addition, the Area Health Resources Files
dashboard allows members of the public to easily access information about topics such as the
distribution and diversity of the health care workforce both by state and county.
In FY 2025, NCHWA will continue to publish results of the 2022 National Sample Survey of
Registered Nurses, which will also be available in visualized formats in the recently released
NCHWA Nursing Workforce Dashboard. The updated National Sample Survey of Registered
Nurses represents the nation’s largest sample survey of registered nurses and nurse practitioners
and provides a comprehensive look at the state of the registered nurse workforce. Nurses are the
largest single occupation in the health workforce, so it is imperative to have recent data on
important aspects of their experience like their retirement plans, work environment, and
education/training, so that programs can be tailored to best meet their needs. The forthcoming
National Sample Survey of Registered Nurses data will show the effects of the COVID-19
pandemic on the nursing workforce with respect to burnout, how the work environment has
changed, what factors are impacting nurses’ decisions to stay or leave the nursing profession, and
whether their retirement plans have been affected by the pandemic.
29
In FY 2025, one Health Workforce Research Center administered by NCHWA will be funded from the Substance
Abuse and Mental Health Services Administration and one HWRC will be partially funded from the Centers for
Disease Control and Prevention.
109
110.
In FY 2025, NCHWA will publish informational briefs on topics such as the primary careworkforce, the behavioral health workforce, and an overview of the healthcare workforce with a
focus on medicine, nursing, and oral health.
The funding request also includes costs associated with the grant review and award process,
follow-up performance reviews, and information technology and other program support costs.
Funding History
FY
FY 2021
FY 2022
FY 2023
FY 2024 CR
FY 2025 President’s Budget
Amount
$5,646,000
$5,663,000
$5,663,000
$5,663,000
$5,663,000
Program Accomplishments
In FY 2023, NCHWA released updated projections for the years 2021-2036 for more than 100
occupations in a publicly accessible interactive projection visualization tool. In addition to the
release in a customizable tool, NCHWA also issued projections briefs in FY 2024 that
interpreted data on key trends in the workforce in a more accessible format for policymakers and
the general public. These included an updated brief on the Primary Care Workforce.
NCHWA also enhanced the projections methodology to further capture the effects of the
pandemic on supply and demand projections and incorporate the most current sources of data.
These enhancements allow for even more sophisticated analysis and projection of health
workforce supply and demand, taking into account changing national demographics, the demand
for health care services, and the impact those changes have on the delivery of health care,
including the rapid attrition of providers and the extensive provision of behavioral health
services by primary care providers.
In FY 2023, NCHWA updated modules of the Area Health Resources Files dashboard, which is
one of the most comprehensive, publicly available sources of county, state, and national data on
health care demographics. The dashboard allows users to access detailed data on the distribution
and demographics of providers via an intuitive interface down to the county-level.
NCHWA completed data collection for the 2022 National Sample Survey of Registered Nurses
during FY 2023. In FY 2024, NCHWA will publicly release data from the survey in the
NCHWA Nursing Workforce Dashboard as well as in briefs and data files.
Finally, in an effort to better understand and demonstrate the outcomes of HRSA’s workforce
programs, NCHWA develops and publicly releases Program Accomplishment and Outcomes
reports for grant programs overseen by the Bureau of Health Workforce. Between FY 2020 and
FY 2023, NCHWA released 25 retrospective evaluation reports as well as annual program
110
111.
accomplishment reports for graduate medical education programs. These reports highlight theways in which HRSA programs impact access, supply, distribution, and quality of the health
workforce.
Grant Awards Table
FY 2024
Continuing
Resolution
FY 2023 Final
Number of Awards
FY 2025
President’s
Budget
9
9
9
Average Award
$500,000
$500,000
$500,000
Range of Awards
$447,164 – $900,000
$447,164 – $900,000
$447,164 – $900,000
111
112.
Primary Care Training and Enhancement ProgramBA
FY 2023
Final
$49,924,000
FY 2024
Continuing
Resolution
$49,924,000
FY 2025
President’s
Budget
$49,924,000
FTE
6
9
9
FY 2025
+/FY 2023
---
+3
Authorizing Legislation: Public Health Service Act, Section 747, as amended by the CARES
Act, Section 3401, Public Law 116-136, and Public Law 117-159.
FY 2025 Authorization………………………………………………………$48,924,000
Allocation Method………………….Competitive Grant/Cooperative Agreement/Contract
Program Description
The Primary Care Training and Enhancement Program aims to strengthen the primary care
workforce by supporting training for future primary care clinicians and faculty and promoting
primary care practice, particularly in rural and underserved areas. The focus of the program is to
produce primary care providers who are prepared to practice in, teach, and lead transforming
health care systems that work to improve access to care, quality of care, and cost effectiveness.
HRSA is investing in strategies to train primary care providers through the Primary Care
Training and Enhancement Program with the following activities:
• Enhancing accredited residency training programs in family medicine, general internal
medicine, general pediatrics, or combined general internal medicine and general
pediatrics in rural and/or underserved areas;
• Focusing on the training of physician assistants and clinical preceptors to expand access
to primary care services in rural areas and nationally;
• Training primary care physicians in maternal health care clinical services and population
health to improve maternal health outcomes; and
• Promoting health equity by increasing access to care for patients with special needs such
as individuals with intellectual and physical disabilities and individuals with limited
English proficiency.
• Promoting the integration of behavioral health into primary care by training primary care
residents in the prevention, identification, diagnosis, treatment, and referral of services
for mental and behavioral, including substance use disorder.
Eligible Entities: Accredited public or nonprofit private hospitals, schools of allopathic or
osteopathic medicine, academically affiliated physician assistant training programs, or public or
private nonprofit entities determined eligible by the Secretary.
112
113.
Budget RequestThe FY 2025 Budget Request for the Primary Care Training and Enhancement Program of $49.9
million is equal to the FY 2023 Final level. The request will fund new awards to support training
for primary care physician assistants to prevent, identify, diagnose, treat, and refer services for
behavioral health conditions. Medical students will experience clinical rotations in rural and
underserved settings where they can practice incorporating behavioral health into primary care
service delivery. This aligns with the Administration’s goal to integrate behavioral health care
into primary care, and will help increase the number of trained physician assistants who choose
to practice in rural and underserved areas after graduation.
The Budget Request also includes costs associated with the grant review and award process,
follow-up performance reviews, and information technology and other program support costs.
Funding History
FY
FY 2021
FY 2022
FY 2023
FY 2024 CR
FY 2025 President’s Budget
Amount
$48,777,000
$48,924,000
$49,924,000
$49,924,000
$49,924,000
Program Accomplishments
In Academic Year (AY) 2022-2023, the Primary Care Training and Enhancement Program
trained 7,388 health professions students and practicing health care professionals. A total of
2,113 individuals completed a Primary Care Training and Enhancement Program, including
1,052 physician assistant students and 383 physicians in residency or fellowship programs.
Select Primary Care Training and Enhancement Program outcomes include providing medical
care and strengthening the health care system through the following:
2.1 million patient encounters occurred through Primary Care Training and Enhancement
residencies, fellowships, and training programs focused on primary care, rural health,
community prevention, and maternal health.
420 students and practicing professionals with follow-up data were working/training in a
primary care setting one year after completing their Primary Care Training and Enhancement
Program, and 385 were in a medically underserved community and/or rural area.
HRSA conducted a four-year evaluation of the Training Primary Care Champions program, a
single subprogram within the larger Primary Care Training and Enhancement program. The
evaluation found that between AYs 2018 and 2022, 341 fellows participated in Training Primary
Care Champions and 253 completed their fellowship. Fellows developed or enhanced 113
courses, reaching 2,948 professionals and students, and conducted nearly 300 health care
transformation projects at community-based primary care sites. As of January 2023, one to three
113
114.
years after program completion, 81% of Training Primary Care Champions alumni wereemployed in Health Professional Shortage Areas, 36% at a National Health Service Corpsapproved site, and 27% in rural areas.30
Outputs and Outcomes Tables
Measure
2070.01 Number of physicians
completing a residency or
fellowship through a Primary Care
Training and Enhancement
Program (Outcome)
2070.02 Number of physician
assistants graduating from a
Bureau of Health Workforcefunded program (Outcome)
Year and Most
Recent Result
/Target for
Recent Result /
(Summary of
Result)
FY 2022: 383
FY 2024
Target
400
FY 2025
Target
400
FY 2025
Target
+/-FY
2024
Target
Maintain
1000
1000
Maintain
Target: 200
(Target Exceeded)
FY 2022: 1,052
Target: 100
(Target Exceeded)
Primary Care Training and Enhancement Program
Outputs
Year and Most Recent Result
Number of physicians training in a Bureau of Health
Workforce-funded residency or fellowship
AY 2022-2023: 1,146
Number of physician assistant students training in a
Bureau of Health Workforce-funded program
AY 2022-2023: 3,317
Percent of physician and physician assistant trainees
receiving at least a portion of their clinical training in
an underserved area
AY 2022-2023: 48%
Performance Narrative
Most recent results are for activities in Academic Year (AY) 2022-2023 funded in FY 2022.
Health Resources and Services Administration. (2023). Primary Care Training and Enhancement – Training
Primary Care Champions Evaluation. U.S. Department of Health and Human Services.
https://bhw.hrsa.gov/sites/default/files/bureau-health-workforce/funding/pcte-tpcc-evaluation-report-2018-2022.pdf
30
114
115.
Grant Awards TableFY 2024
Continuing
Resolution
FY 2023
Final
Number of Awards
FY 2025 President’s
Budget
107
104
96
Average Award
$373,707
$351,835
$351,835
Range of Awards
$103,670 – $600,000
$103,670 – $600,000
$103,670 – $600,000
115
116.
Oral Health Training ProgramsBA
FTE
FY 2023
Final
$42,673,000
6
FY 2024
Continuing
Resolution
$42,673,000
6
FY 2025
President’s
Budget
$42,673,000
6
FY 2025
+/FY 2023
-----
Authorizing Legislation: Public Health Service Act, Section 748, as amended by Public Law
115-301; the CARES Act, Section 3401, Public Law 116-136; and Public Law 117–328.
FY 2025 Authorization….................................................................................$28,531,000
Allocation Method..................................................................Competitive Grant/Contract
Program Description
The Oral Health Training Programs increase access to high-quality dental health services in rural
and other underserved communities by increasing the number of oral health care providers
working in underserved areas and improving training programs for these providers through the
following activities:
Predoctoral Training in General, Pediatric, and Public Health Dentistry and Dental Hygiene
Program: This program provides grants to fund the planning, development, operation of, and
participation in, approved professional training programs in general, pediatric, or public health
dentistry and dental hygiene for students. It also provides financial assistance to participating
students. This program enhances the ability of the oral health care trainees to care for populations
with special needs, focus on patient centered care, and gain a better understanding of the social
determinants of health.
Postdoctoral Oral Health Training Program in General, Pediatric, and Public Health
Dentistry: This program provides grants to fund the planning, development, operation of, and
participation in, approved professional training programs in general, pediatric, or public health
dentistry for dental residents, practicing dentists, or other approved primary care dental trainees.
Grantees may also provide financial assistance to dental residents or practicing dentists.
Dental Clinician Educator Career Development Program: This program supports the
development of primary care dental faculty within academic institutions. Specifically, it focuses
on improving the competence of full-time, part-time, and community-based faculty to develop
and enhance training focused on improving care for vulnerable and underserved populations.
Primary Care Dental Faculty Development Program: This program funds a National Center
that serves as a resource and training hub to support the development of primary care dental
faculty within academic institutions.
Dental Faculty Loan Repayment Program: This program provides grants to fund the planning,
development, and operation of a program to provide loan repayment to dental faculty engaged in
116
117.
general, pediatric, and public health dentistry and dental hygiene in exchange for service as fulltime faculty members. The program enhances the recruitment and retention of dental and dentalhygiene faculty through loan repayment.
State Oral Health Workforce Improvement Grant Program: This program seeks to enhance
dental workforce planning and development through the support of innovative programs to meet
the individual needs of each funded state. The aim is to encourage and support state innovation
of sustainable and effective programs that will increase the accessibility and quality of oral
health services within Dental Health HPSAs.
Eligible Entities:
Predoctoral Training in General, Pediatric, and Public Health Dentistry and Dental
Hygiene Program; Postdoctoral Oral Health Training Program in General, Pediatric, and
Public Health Dentistry; Dental Clinician Educator Career Development Program;
Primary Care Dental Faculty Development Program: Schools of dentistry and dental
hygiene, public or non-profit private hospitals, and public or non-profit private entities that have
approved residency or advanced education programs.
Dental Faculty Loan Repayment Program: Programs of general, pediatric, or public health
dentistry in public or private nonprofit dental or dental hygiene schools, or approved residency or
advanced education programs in the practice of general, pediatric, or public health dentistry.
State Oral Health Workforce Improvement Grant Program: Eligible applicants include
governor-appointed, state governmental entities. This program requires a 40-percent match by
the state.
Budget Request
The FY 2025 Budget Request for the Oral Health Training Programs of $42.7 million is equal to
the FY 2023 Final level. In FY 2025, HRSA will continue increasing access to high-quality
dental health services in rural and other underserved communities by supporting oral health care
providers working in underserved areas and improving training programs for these providers.
The request funds 84 continuation awards that support dental faculty development, innovative
oral health programs, and enhancement of clinical predoctoral dental and dental hygiene
trainees’ ability to care for populations and individuals with medically complex conditions, as
well as funds 27 new postdoctoral awards in general dentistry, pediatric dentistry, and dental
public health.
The funding request also includes costs associated with the grant review and award process,
follow-up performance reviews, and information technology and other program support costs.
117
118.
Funding HistoryFY
FY 2021
FY 2022
FY 2023
FY 2024 CY
FY 2025 President’s Budget
Amount
$40,673,000
$40,673,000
$42,673,000
$42,673,000
$42,673,000
Program Accomplishments
In Academic Year (AY) 2022-2023, the Oral Health Training Programs supported 5,540 dental
and dental hygiene students and professionals. A total of 1,897 individuals completed their Oral
Health Training Program, including 1,145 dental students, 650 dentists, and 95 dental hygiene
students. Select Oral Health Training Program outcomes include repaying student loans and
expanding access to dental care:
$3.7 million in student loans was repaid – the equivalent of 25 percent of Dental Faculty
Loan Repayment Program participants’ student loan debt.
1.5 million patient encounters occurred in medically underserved communities delivered
by providers training in the Oral Health Training Program.
69 percent of graduates were working in medically underserved communities and 20
percent in primary care settings, such as Federally Qualified Health Centers after
graduating from their Oral Health Training Program.
HRSA conducted a six-year evaluation of the Dental Faculty Loan Repayment Programs and
found that between AYs 2016 and 2022, awardees provided $12,202,108 in loan repayment,
which relieved an average of 43 percent of student loan debt for participants. In exchange for
student loan repayment, 148 dentists and dental hygienists provided 424 years of service as fulltime dental faculty. Without the dental faculty programs, dental faculty vacancies could have
grown by 113 percent during AYs 2016 through 2021; instead, they grew by 78 percent.31,32
31
Health Resources and Services Administration (2023). Dental faculty loan repayment programs evaluation. U.S.
Department of Health and Human Services. https://bhw.hrsa.gov/sites/default/files/bureau-healthworkforce/funding/dental-faculty-lrp-outcomes.pdf
32
American Dental Education Association. (2023, June 12). 2020-21 dental school faculty vacant positions in
United States. https://www.adea.org/Data/Faculty/2020-Vacancies/
118
119.
Outputs and Outcomes TablesMeasure
2080.01 Number
of dental students
trained through
Bureau of Health
Workforce Oral
Health Training
Programs
(Output)
2080.02 Number
of dental
residents trained
through Bureau
of Health
Workforce Oral
Health Training
Programs
(Output)
2080.03 Number
of dental faculty
trained through a
Bureau of Health
Workforce Oral
Health Training
Program (Output)
Year and Most
Recent Result /
Target for Recent
Result /
(Summary of
Result)
FY 2022: 4,339
FY 2024
Target
5,000
FY 2025
Target
5,000
FY 2025
Target
+/-FY 2024
Target
Maintain
650
650
Maintain
170
Discontinued
N/A
Target: 4,000
(Target Exceeded)
FY 2022: 752
Target: 520
(Target Exceeded)
FY 2022: 185
Target: 160
(Target Exceeded)
Year and Most
Recent Result
Oral Health Training and Workforce Program Outputs
Number of dentists completing a Bureau of Health Workforcefunded dental residency or fellowship
AY 2022-2023: 590
Number of dentists graduating from a Bureau of Health Workforcefunded dental school
AY 2022-2023: 1,145
Performance Narrative
Most recent results are for activities in AY 2022-2023 funded in FY 2022.
119
120.
Grant Awards TableFY 2024
Continuing
Resolution
FY 2023
Final
Number of Awards
FY 2025
President’s Budget
111
111
111
Average Award
$368,779
$378,354
$378,354
Range of Awards
$48,600 – $664,042
$81,000 – $664,042
$81,000 – $664,042
120
121.
Medical Student Education ProgramFY 2024
Continuing
Resolution
FY 2023
Final
FY 2025
President’s
Budget
FY 2025
+/FY 2023
BA
$60,000,000
$60,000,000
$50,500,000
-$9,500,000
FTE
1
1
1
---
Authorizing Legislation: As added by Title II of Division B, Public Law 115-245, as amended by
Public Law 117-328.
FY 2025 Authorization ............................................................................................. Expired
Allocation Method ...................................................................................................... Grants
Program Description
The Medical Student Education Program provides grants to public institutions of higher
education in the top quintile of states with a projected primary care provider shortage in 2025 to
support graduate education for medical students preparing to become physicians. The program
was established in FY 2019 and is designed to prepare and encourage medical students who are
training in the most underserved states to choose residencies and careers in primary care that
serve tribal communities, rural communities, and/or medically underserved communities after
they graduate. The Medical Student Education Program supports the development of post
baccalaureate programs, medical school curricula, clinical training site partnerships, and faculty
training programs. The program also requires grant recipients to prepare medical students to
address the social determinants of health, including access barriers to health services, and health
literacy.
Eligible Entities: Eligible entities are limited to public institutions of higher education in the top
quintile of states with projected primary care provider shortages in 2025 (Alabama, Arkansas,
Indiana, Kentucky, Mississippi, Missouri, Oklahoma and Utah).
Budget Request
The FY 2025 Budget Request for the Medical Student Education Program of $50.5 million is
$9.5 million less than the FY 2023 Final level. This request will fully fund the 12 non-competing
continuation awards from the program’s FY 2023 competition and will not result in a reduction
in activities.
In FY 2023, HRSA held a new competition for the 12 eligible public colleges of medicine. Grant
recipients are developing and implementing Postbaccalaureate Premedical Programs that support
the transition from undergraduate to medical school and conducting targeted outreach to increase
121
122.
enrollment of medical students from tribal, rural, and/or medically underserved communities.They also are providing clinical sites for medical students in primary care settings such as a
Teaching Health Center or other community-based setting that has a primary care residency
program and provide scholarships for medical students who intend to practice in primary care in
tribal, rural, and/or medically underserved communities. In addition, funded medical schools
will develop and implement new and/or expanded curricula to meet the needs of vulnerable
populations, including those in tribal, rural, or medically underserved communities.
This funding request will continue these activities that prepare and encourage medical students to
choose residencies and careers in primary care, particularly those serving tribal, rural, and/or
medically underserved communities in the specified states.
The funding request also includes costs associated with follow-up performance reviews,
information technology, and other program support costs.
Funding History
FY
FY 2021
FY 2022
FY 2023
FY 2024 CR
FY 2025 President’s Budget
Amount
$50,000,000
$55,000,000
$60,000,000
$60,000,000
$50,500,000
Program Accomplishments
In Academic Year (AY) 2022-2023, the Medical Student Education Program trained 3,680
medical students and a total of 806 medical students graduated. Select program outcomes include
encouraging medical students to pursue careers in primary care and supporting medical students
who chose residency programs in high-need locations:
99 percent of Medical Student Education Program graduates matched to a residency,
higher than the 93 percent rate for all medical school graduates;33
45 percent of program graduates matched to primary care residencies;34 and
44 percent of program graduates matched to residencies where they trained in Health
Professional Shortage Areas.
33
National Residency Match Program (2023). Results and data: 2023 main residency match.
https://www.nrmp.org/wp-content/uploads/2023/05/2023-Main-Match-Results-and-Data-Book-FINAL.pdf
34
National Residency Match Program (2023). Results and data: 2023 main residency match.
https://www.nrmp.org/wp-content/uploads/2023/05/2023-Main-Match-Results-and-Data-Book-FINAL.pdf
122
123.
Outputs and Outcomes TablesMeasure
2090.01 Number
of medical
students trained
in underserved
states (Output)
Year and Most
Recent Result /
Target for
Recent Result /
(Summary of
Result)
FY 2022: 3,680
FY 2024
Target
3,600
FY 2025
Target
3,600
FY 2025 Target
+/- FY 2024
Target
Maintain
350
350
Maintain
Target: 1,089
(Target
Exceeded)
2090.02 Number FY 2022: 357
of medical
students
Target: 21
matched to
primary care
(Target
residencies
Exceeded)
(Output)
Performance Narrative
Most recent results are for activities in AY 2022-2023 funded in FY 2022.
Grant Awards Table
FY 2023 Final
Number of Awards
FY 2025
President’s Budget
FY 2024
Continuing
Resolution
12
Average Award
$3,327,026
Range of Awards
$1,750,000 –
$4,000,000
123
12
12
$3,983,984
$3,983,984
$3,864,055 –
$4,000,000
$3,864,055 –
$4,000,000
124.
Interdisciplinary, Community-Based LinkagesArea Health Education Centers Program
FY 2024
Continuing
Resolution
FY 2023
Final
FY 2025
President’s
Budget
FY 2025
+/FY 2023
BA
$47,000,000
$47,000,000
$47,000,000
---
FTE
2
2
2
---
Authorizing Legislation: Public Health Service Act, Section 751, as amended by the CARES
Act, Section 3401, Public Law 116-136.
FY 2025 Authorization ......................................................................................$41,250,000
Allocation Method ........................................... Competitive Grant/Cooperative Agreement
Program Description
The Area Health Education Centers Program develops and enhances education and training
networks including communities, academic institutions, and community-based organizations.
These networks work to broaden the distribution of the health workforce, enhance health care
quality, and improve health care delivery to rural and underserved areas and populations. Area
Health Education Centers must establish and maintain community-based training programs with
an emphasis on primary care in rural and underserved areas. Area Health Education Centers
Program grantees invest in interprofessional networks that address the social determinants of
health of surrounding communities and incorporate community-based field placement programs.
The program also provides continuing education, simulation education and training activities,
and information dissemination to practicing health professionals to increase their effectiveness in
providing quality health care.
Eligible Entities: Public or private non-profit accredited schools of allopathic and osteopathic
medicine. Accredited schools of nursing are eligible applicants in states and territories in which
no Area Health Education Centers Program is in operation.
Budget Request
The FY 2025 Budget Request for the Area Health Education Centers Program of $47 million is
equal to the FY 2023 Final level. This request will support non-competing continuation awards
to the 49 current Area Health Education Centers Program grantees who are working to increase
the number of health professions students who pursue careers in primary care and are prepared to
practice in rural and underserved areas and populations.
124
125.
The funding request also includes costs associated with follow-up performance reviews,information technology, and other program support costs.
Funding History
Fiscal Year
FY 2021
FY 2022
FY 2023
FY 2024 CR
FY 2025 President’s Budget
Amount
$43,250,000
$45,000,000
$47,000,000
$47,000,000
$47,000,000
Program Accomplishments
In Academic Year (AY) 2022-2023, the Area Health Education Centers (AHEC) Program
trained 390,552 health care trainees and professionals. A total of 378,853 individuals completed
continuing education courses, AHEC Scholar programs, fellowships, practicums and field
placements, or other curricula activities supported by AHEC.
A major component of AHEC is the Scholars Program, which provides two years of
interdisciplinary training in medically underserved and/or rural community-based settings to
medical residents and health professions students. A total of 8,714 individuals participated in an
AHEC Scholars Program, and 2,728 AHEC Scholars completed their program. AHEC Scholars
completers included 701 medical students, 570 nursing students, and 418 allied health students.
Select AHEC Program outcomes include retaining AHEC Scholars in high-need areas,
supporting the training needs of the Nation’s health professionals, and maintaining infrastructure
for clinical training:
41 percent of AHEC Scholars worked or trained in medically underserved communities
and/or rural areas one year after program completion, and 36 percent in primary care
settings.
1,444 continuing education courses were offered to 142,023 practicing health
professionals, 26 percent of whom worked in medically underserved communities, and
17 percent of whom worked in rural areas.
4,706 clinical training sites were maintained across the United States, where AHECs
provided hands-on training to 29,112 AHEC trainees and 12,304 interprofessional
trainees.
125
126.
Outputs and Outcomes TablesMeasure
2100.01 Number of Area
Health Education Centers
Scholars trained in
medically underserved
communities and/or rural
areas (Output)
2100.02 Percentage of
Area Health Education
Centers participants
practicing in primary care,
medically underserved
communities, and/or rural
areas one year after
program completion
(Outcome)
Year and Most
Recent Result /
Target for
Recent Result /
(Summary of
Result)
FY 2022: 8,714
FY 2024
Target
8,500
FY 2025
Target
8,500
FY 2025
Target +/FY 2024
Target
Maintain
65%
Discontinued
N/A
Target: 5,060
(Target
Exceeded)
FY 2022: 64%
Target: 48%
(Target
Exceeded)
AHEC Program Outputs
Number of medical students who participated in community-based
clinical training
Number of other health professions trainees who participated in
community-based clinical training
Number of trainees who received continuing education on topics
including cultural competence, women’s health, diabetes,
hypertension, obesity, and health disparities
Year and Most Recent
Result
AY 2022-2023: 8,651
AY 2022-2023: 11,784
AY 2022-2023: 142,023
Performance Narrative
Most recent results are for activities in Academic Year (AY) 2022-2023 funded in FY 2022.
Measure 2100.02 has been discontinued because it does not capture the full range of Area Health
Education Center program activities, such as continuing education, and therefore is not
meaningful for the program overall.
126
127.
Grant Awards TableFY 2023
Final
Number of Awards
FY 2024
Continuing
Resolution
FY 2025
President’s Budget
49
49
49
Average Award
$857,244
$857,244
$857,244
Range of Awards
$288,500 –
$2,106,000
$288,500 –
$2,106,000
$288,500 –
$2,106,000
127
128.
Geriatrics ProgramsFY 2024
Continuing
Resolution
FY 2023
Final
FY 2025
President’s
Budget
FY 2025
+/FY 2023
BA
$47,245,000
$47,245,000
$47,245,000
---
FTE
5
6
6
+1
Authorizing Legislation: Public Health Service Act, Section 753, as amended by the CARES
Act, Section 3403, Public Law 116-136, and Public Law 117-328.
FY 2025 Authorization ......................................................................................$40,737,000
Allocation Method .......................................................................... Cooperative Agreement
Program Description
HRSA’s Geriatrics Programs improve health care for older adults by developing a health
workforce to provide value-based care for older adults by integrating geriatrics and primary care
delivery sites/systems; and support the career development of junior faculty in geriatrics at
accredited schools of allopathic medicine, osteopathic medicine, nursing, social work,
psychology, dentistry, pharmacy, or allied health.
HRSA’s Geriatric Workforce Enhancement Program and Geriatrics Academic Career Awards
Program educate and train the healthcare workforce, within the context of the age-friendly health
systems framework, to address dementia-risk reduction, dementia across the disease trajectory
including training on dementia medications as they are approved for use, health disparities and
social determinants of health, and nursing home care.
Geriatric Program Breakout
Program
FY 2023 Final
FY 2024 Continuing
Resolution*
FY 2025 President’s
Budget*
Geriatrics Workforce
Enhancement Program
$45,141,205
$44,911,188
$44,911,188
Geriatrics Academic
Career Awards
Program
$2,103,795
$2,333,812
$2,333,812
* By statute, Geriatrics Academic Career Award amounts will be adjusted in accordance with the
consumer price index.
128
129.
Eligible Entities:Geriatric Workforce Enhancement Program: Accredited schools of health professions
representing various health disciplines, health care facilities, and programs leading to
certification as a certified nursing assistant.
Geriatrics Academic Career Awards Program: Accredited health professions schools of
allopathic medicine, osteopathic medicine, nursing, social work, psychology, dentistry,
pharmacy, or allied health that apply on behalf of individuals where the individuals have a fulltime junior faculty appointment.
Budget Request
The FY 2025 Budget Request for the Geriatrics Programs of $47.2 million is equal to the FY
2023 Final level. The request will fund approximately 43 non-competing continuation awards for
the Geriatric Workforce Enhancement Program and 26 non-competing continuation awards for
the Geriatrics Academic Career Awards Program. The programs provide training focused on
interprofessional and team-based care across the educational continuum (students, faculty,
providers, direct service workers, patients, families, and lay and family caregivers).
The funding request also includes costs associated with follow-up performance reviews, and
information technology and other program support costs.
Funding History
FY
FY 2021
FY 2022
FY 2023
FY 2024 CR
FY 2025 President’s Budget
Amount
$42,859,000
$45,245,000
$47,245,000
$47,245,000
$47,245,000
Program Accomplishments
In Academic Year (AY) 2022-2023, the Geriatrics Workforce Enhancement Program and the
Geriatrics Academic Career Awards Program (the Geriatrics Programs) trained 67,154 health
care professionals, students, patients, and caregivers. A total of 56,716 individuals completed
trainings including 24,892 physicians, 5,217 nursing students, and 4,153 medical students. Select
Geriatrics Program outcomes include providing geriatrics-related education:
25 percent of U.S. geriatrics fellows and 17 percent of U.S. geriatric psychiatry fellows
were reached through the Geriatric Workforce Enhancement Program.
410,000 individuals received continuing education through the Geriatrics Programs,
including 280,242 patients and caregivers, 81,641 practicing health professionals, and
48,760 other professionals (e.g., firefighters and law enforcement).
129
130.
Outputs and Outcomes TablesMeasure
2110.01 Number of
Bureau of Health
Workforce-sponsored
educational courses and
activities offered on
topics related to
Alzheimer’s disease
and related dementias
(Output)
2110.02 Number of
trainees participating in
educational courses and
activities offered on
topics related to
Alzheimer's disease
and related dementias
(Output)
2110.03 Number of
continuing education
trainees in geriatrics
programs (Output)
2110.04 Number of
students who received
geriatric-focused
training in settings
across the care
continuum (Output)
Year and Most
Recent Result /
Target for
Recent Result /
(Summary of
Result)
FY 2022: 529
FY 2024
Target
670
FY 2025
Target
Discontinued
FY 2025
Target
+/-FY 2024
Target
N/A
130,000
Discontinued
N/A
400,000
400,000
Maintain
65,000
65,000
Maintain
Target: 150
(Target
Exceeded)
FY 2022:
113,351
Target: 10,000
(Target
Exceeded)
FY 2022:
410,643
Target: 50,000
(Target
Exceeded)
FY 2022: 67,154
Target: 10,000
(Target
Exceeded)
130
131.
Geriatrics Program OutputsYear and Most Recent Result
Number of continuing education offerings delivered by
grantees
AY 2022-2023: 1,805
Number of faculty members participating in geriatrics
trainings offered by grantees
AY 2022-2023: 13,048
Number of individuals trained in new or enhanced
curricula relating to the treatment of health problems of
elderly individuals
AY 2022-2023: 1,363,889
Performance Narrative
Most recent results are for activities in AY 2022-2023 funded in FY 2022. Measures 2110.01
and 2110.02 have been discontinued since measures 2110.03 and 2110.04 better demonstrate the
broader output of the program.
Geriatric Workforce Enhancement Program Grant Awards Table
FY 2024
Continuing
Resolution
FY 2023 Final
Number of Awards
FY 2025
President’s Budget
48
43
43
Average Award
$866,610
$1,000,000
$1,000,000
Range of Awards
$664,124- $872,011
$990,000 $1,000,000
$990,000 $1,000,000
In FY 2025, the Geriatric Workforce Expansion Program anticipates an increase in each
grantee’s average award amount, resulting in slightly fewer grantees overall.
Geriatrics Academic Career Awards Program Grant Awards Table
FY 2024
Continuing
Resolution*
FY 2023 Final
Number of Awards
Average Award
FY 2025
President’s Budget*
26
26
26
$86,978
$89,762
$89,762
Range of Awards
$86,978
$89,762
$89,762
* By statute, Geriatrics Academic Career Award amounts will be adjusted in accordance with the
consumer price index.
131
132.
Behavioral Health Workforce Development ProgramsFY 2023
Final
FY 2024
Continuing
Resolution
FY 2025
President’s
Budget
FY 2025
+/FY 2023
BA
$197,053,000
$197,053,000
$253,553,000
+$56,500,000
FTE
18
27
31
+13
Authorizing Legislation: Public Health Service Act, Sections 755, 756, 760, and 781, as
amended by Public Law 117-328.
FY 2025 Authorization:
Behavioral Health Workforce Education and Training: $50,000,000
Mental and Behavioral Health Education and Training: Public Health Service Act, Section 756,
Subsection (a)(1): $15,000,000; Subsection (a)(2): $15,000,000; Subsection (a)(3): $10,000,000;
Subsection (a)(4): $10,000,000; Public Health Service Act, Section 781: Expired.
Allocation Methods .......................... Competitive Grant/Cooperative Agreement/Contract/
Other (competitive awards to individuals)
Program Description
HRSA’s Behavioral Health Workforce Development Programs support the training of behavioral
health students and providers and seek to place these providers in rural and underserved
communities across the United States and its territories. The Behavioral Health Workforce
Development Programs expand the number of behavioral health professionals and
paraprofessionals, improve the quality of care by recruiting a diverse behavioral health
workforce and training them to work collaboratively on interprofessional teams, and promote the
integration of behavioral health into primary care settings to increase access to behavioral health
services. In addition, through the Substance Use Disorder Treatment and Recovery Loan
Repayment Program, HRSA funds loan repayment for medical, nursing, behavioral health
clinicians and paraprofessionals in exchange for providing substance use disorder treatment
services in high need areas.
The United States is currently facing a shortage of behavioral health providers and more than
half of the U.S. population lives in a Mental Health Professional Shortage Area. Workforce
shortages projected through 2036 include addiction counselors, marriage and family therapists,
mental health counselors, psychologists, and psychiatrists. Rural counties are more likely than
urban counties to lack behavioral health providers. When they receive care, residents of rural
counties are also more likely to receive behavioral health services from primary care providers.
132
133.
Behavioral Health Workforce Development ProgramsThe Behavioral Health Workforce Development Programs support several activities that increase
the behavioral health workforce and expand access to behavioral health services. Programs
include the Behavioral Health Workforce Education and Training Programs for Professionals
and Paraprofessionals, Opioid-Impacted Family Support Program, the Graduate Psychology
Education Program, the Addiction Medicine Fellowship Program, the Integrated Substance Use
Disorder Training Program, and the Substance Use Disorder Treatment and Recovery Loan
Repayment Program.
HRSA Behavioral Health Workforce Development Program grantees may provide training and
other resources to support the delivery of culturally and linguistically appropriate behavioral
health care and services to meet the need of underserved communities. Many HRSA Behavioral
Health Workforce Development Programs encourage grantees to offer experiential training
within community-based settings that disproportionately serve underserved communities.
Eligible Entities
Program/Activity Entities
Behavioral Health
• Accredited masters and doctoral level behavioral health institutions of
Workforce
higher education or professional training programs
Education and
• Accredited doctoral, internship, and post-doctoral residency programs of
Training for
health service psychology
Professionals,
• State-licensed mental health non-profit and for-profit organizations
Paraprofessionals,
• Health professions schools, community colleges, academic health centers,
and Opioidstate-licensed organizations, or other public or private nonprofit entities
Impacted Family
that provide services and training to health professions
Support Program
Graduate
• American Psychological Association-accredited health service psychology
Psychology
doctoral level schools and programs, internships, and postdoctoral
Education
residency programs
• Psychological Clinical Science Accreditation System-accredited doctoral
level schools of psychology
Addiction
• Accreditation Council for Graduate Medical Education-accredited
Medicine
Addiction Medicine or Addiction Psychiatry fellowship programs
Fellowship
• Consortium (i.e., teaching health center and at least one sponsor Addiction
Medicine or Addiction Psychiatry fellowship program)
Integrated
• Teaching health centers, Federally Qualified Health Centers, Community
Substance Use
Mental Health Centers, Rural Health Clinics, health centers operated by the
Training Program
Indian Health Service, an Indian tribe, a tribal organization, or an urban
Indian organization (as defined in section 4 of the Indian Health Care
Improvement Act); or Entities with a demonstrated record of success in
providing training for nurse practitioners, physician assistants, health
service psychologists, counselors, nurses, and/or social workers
(including individuals completing clinical training requirements for
licensure) including entities that serve pediatric populations
133
134.
Program/ActivityEntities
Substance Use
Disorder
Treatment and
Recovery Loan
Repayment
Program
Fully-licensed clinicians, credentialed in an eligible discipline and working
at Substance Use Disorder Treatment and Recovery Loan Repayment
Program-approved facilities
Registered substance use disorder treatment professionals working at
Substance Use Disorder Treatment and Recovery Loan Repayment
Program-approved facilities
Budget Request
The FY 2025 Budget Request for the Behavioral Health Workforce Development Programs of
$253.6 million is $56.5 million above the FY 2023 Final level. This request will support the
training of approximately 15,500 individuals through training grants. This includes funding to
support the training of 12,000 individuals to become new behavioral health providers through the
Behavioral Health Workforce Education and Training Programs for Professionals and
Paraprofessionals.
HRSA will use $46.5 million of the requested increase to support the Behavioral Health
Workforce Education and Training for Professionals and Paraprofessionals Programs. The goal
of these programs is to increase the supply, distribution, and quality of behavioral health
professionals such as psychologists, psychiatrists, social workers, counselors, marriage and
family therapists, and other mental health and addiction counselors as well as peer support
specialists and other behavioral health-related paraprofessionals. Funding will primarily focus on
the knowledge and understanding of children, adolescents, and young adults at risk for
behavioral health disorders. Additionally, HRSA will use a portion of the requested funding
increase to support activities to increase the access to and quality of family behavioral health
services, including maternal behavioral health services.
HRSA will direct $10 million to support a new Youth Behavioral Health Training Program to
help address behavioral health needs of youth and young adults while also building an early
pathway program for youth peers interested in behavioral health careers. Through this program,
young people will be trained to provide much needed direct behavioral health support to their
peers. In addition, peers will be able to train in behavioral health core competencies that will put
them on a pathway to a behavioral health career. The program will engage youth in peer-to-peer
support.
In FY 2025, HRSA will re-compete the Addiction Medicine Fellowship and the Graduate
Psychology Education programs. Additionally, HRSA will fund continuation awards under the
Integrated Substance Use Disorder Training Program and Opioid-Impacted Family Support
Program and provide approximately 295 new loan repayment awards through the Substance Use
Disorder Treatment and Recovery Loan Repayment Program.
The funding request also includes costs associated with the award process, follow-up
performance reviews, information technology, and other program support costs.
134
135.
Funding HistoryFY
FY 2021
FY 2022
FY 2023
FY 2024 CR
FY 2025 President’s Budget
Amount
$149,207,000
$162,053,000
$197,053,000
$197,053,000
$253,553,000
Program Accomplishments
In Academic Year (AY) 2022-2023, 7,000 behavioral health providers graduated from the
Behavioral Health Workforce Development programs. Individuals who graduated from these
programs include 4,739 professionals, such as social workers, psychologists, school and clinical
counselors, psychiatric nurse practitioners, and marriage and family therapists, as well as 2,261
paraprofessionals, such as community health workers, social services aides, and mental health
workers. Select Behavioral Health Workforce Development program outcomes include:
• 2.9 million hours of patient care occurred in medically underserved areas because of
Behavioral Health Workforce Development Programs.
• 75 percent of Behavioral Health Workforce Development Program graduates were
working in underserved areas immediately after completing their training program.
• 200,000 patient encounters occurred in medically underserved communities through the
Addiction Medicine Fellowship Program and the Integrated Substance Use Disorder
Training Program.
Furthermore, as of September 30, 2023, a total of 707 Substance Use Disorder Treatment and
Recovery Loan Repayment Program providers were currently in the field, providing behavioral
health services at eligible facilities in communities where the mean drug overdose death rate is
significantly higher than the national average in return for HRSA providing loan repayment for
eligible debt. This includes 295 participants who entered into service contracts in FY 2023.
135
136.
Outputs and Outcomes TablesMeasure
2120.01 Number of
graduates from
behavioral health
degree or certificate
programs supported by
Bureau of Health
Workforce Behavioral
Health Workforce
Education and Training
Programs (Outcome)
2120.02 Number of
students in behavioral
health degree or
certificate programs
supported by Bureau of
Health Workforce
Behavioral Health
Workforce Education
and Training Programs
(Output)
2120.03 Number of
graduate-level
psychology students
supported through
Bureau of Health
Workforce behavioral
health workforce
development programs
(Output)
2120.04 Number of
interprofessional
students trained in
psychology field
placement settings
through the Graduate
Psychology Education
Program (Output)
Year and Most
Recent Result /
Target for
Recent Result /
(Summary of
FY 2024
Result)
Target
FY 2022: 4,460 4,000
FY 2025
Target
4,000
FY 2025
Target +/- FY
2024 Target
Maintain
7,300
12,000
+4,700
390
390
Maintain
4,000
Discontinued
N/A
Target: 5,000
(Target Not
Met)
FY 2022: 6,853
Target: 6,000
(Target
Exceeded)
FY 2022: 414
Target: 200
(Target
Exceeded)
FY 2022: 3,989
Target: 1,900
(Target
Exceeded)
137.
Measure2120.05 Number of
new addiction medicine
and addiction
psychiatry fellowship
graduates entering
workforce (Outcome)
2120.06 Number of
substance use disorder
treatment providers
receiving loan
repayment in exchange
for providing
behavioral health
services (Output)
Year and Most
Recent Result /
Target for
Recent Result /
(Summary of
FY 2024
Result)
Target
FY 2022: 134
130
FY 2025
Target
130
FY 2025
Target +/- FY
2024 Target
Maintain
1,095
+295
Target: 63
(Target
Exceeded)
FY 2023: 707
800
Target: 350
(Target
Exceeded)
Performance Narrative
The most recent results are for activities in AY 2022-2023 funded in FY 2022. The Behavioral
Health Workforce Education and Training Program Measure 2120.01 did not take into account
the growth in the percentage of professionals in the program, where training takes longer,
compared to paraprofessionals. The target has been adjusted to reflect this breakdown of
program participants. The target for the Behavioral Health Workforce Education and Training
Program Measure 2120.01 was not increased proportionally because it takes two to three years
for students to graduate. Measure 2120.4 has been discontinued as it is not consistent with the
central focus of the Graduate Psychology Education Program. The primary goal of the Program
is to train graduate-level psychologists whereas this measure focuses on interprofessional
students who are not directly trained through this or any other Behavioral Health Workforce
Development Program.
Grant Awards Table
FY 2023
Final
Number of
Awards
FY 2024
Continuing Resolution
FY 2025
President’s Budget
380
380
483
Average Award
$453,889
$453,889
$500,000
Range of
Awards
$93,166 –
$800,000
$93,166 – $800,000
137
$93,166 – $800,000
138.
Substance Use Disorder Treatment and Recovery Loan Repayment Program AwardsTable
FY 2024
Continuing
Resolution
FY 2023 Final
Number of Awards
FY 2025
President’s Budget
295
295
295
Average Award
$127,244
$127,244
$127,244
Range of Awards
$16,178 – $263,55735
$16,178 – $263,557
$16,178 – $263,557
35
FY 2023 award amounts reflect accommodations made for federal tax burden.
138
139.
Public Health Workforce DevelopmentPublic Health and Preventive Medicine Training Grant Programs
FY 2023
Final
$18,000,000
4
BA
FTE
FY 2024
Continuing
Resolution
$18,000,000
6
FY 2025
President’s
Budget
$18,000,000
6
FY 2025
+/FY 2023
--+2
Authorizing Legislation: Public Health Service Act, Sections 765-768 and 770 as amended by
the CARES Act, Section 3401, Public Law 116-136.
FY 2025 Authorization ......................................................................................$17,000,000
Allocation Method ............................................ Competitive grant/Cooperative Agreement
Program Description
The Preventive Medicine and Public Health Training Grant Programs train the current and future
workforce by developing and delivering new public health training content and coordinating
student placements and collaborative projects. The programs aim to improve the health of
communities by increasing the number and quality of public health and preventive medicine
personnel who can address public health needs and advance preventive medicine practices.
Public Health Workforce Development Breakout
Program
FY 2023 Final
FY 2024 Continuing FY 2025 President’s
Resolution
Budget
Public Health Training
Centers Program
$10,000,000
$10,000,000
$10,000,000
Preventive Medicine
Residency Program
$8,000,000
$8,000,000
$8,000,000
Eligible Entities
Public Health Training Center Program: Accredited schools of public health or public or
nonprofit private entities accredited for the provision of graduate or specialized training in public
health. Faith-based and community-based organizations, tribes, and tribal organizations.
139
140.
Preventive Medicine Residency Program: Accredited schools of public health, allopathic, orosteopathic medicine; accredited public or private non-profit hospitals; state, local, or tribal
health departments or a consortium of two or more of the above entities.
Budget Request
The FY 2025 Budget Request for the Preventive Medicine and Public Health Training Grant
Programs of $18 million is equal to the FY 2023 Final level. Specifically, the Public Health
Training Center Program will continue to fund the current 10 regional awardees and support the
development and implementation of training focused on regional public health needs that align
with agency priorities. Some activities include developing micro learning instructional sessions
on real-time public health issues, aiding in the formulation of state and local workforce
development plans, and expanding regional Public Health Leadership Institutes.
The Preventive Medicine Residency Program will fund 19 continuation awards. These awards
support enhanced experiential activities with a focus on residents having longitudinal clinical
rotations in a Federally Qualified Health Center in rural and/or medically underserved
communities.
The funding request also includes costs associated with the grant review and award process,
follow-up performance reviews, and information technology and other program support costs.
Funding History
FY
FY 2021
FY 2022
FY 2023
FY 2024 CR
FY 2025 President’s Budget
Amount
$17,000,000
$17,000,000
$18,000,000
$18,000,000
$18,000,000
Program Accomplishments
In Academic Year (AY) 2022-2023, the Public Health Workforce Development programs trained
212 public health students who completed a training program by Public Health Training Centers
and 52 physicians who completed a residency supported by the Preventative Medicine Residency
Program. Select Public Health Workforce Development program outcomes include:
43 percent of graduates were working or training in medically underserved
communities one year after graduation; 41 percent in public health/preventive
medicine settings; and 12 percent in state, local, or Tribal health departments.
2,957 continuing education courses were developed and delivered to public health
front-line workers, program managers, and senior managers, including courses on
infectious disease, clinical training, and health equity.
140
141.
Outputs and Outcomes TablesMeasure
2130.01 Number of
individuals trained in
continuing education
courses offered by
Public Health
Training Centers
(Output)
2130.02 Number of
hours of public
health-related
continuing education
offered by Public
Health Training
Centers (Output)
2130.03 Number of
public health students
and preventive
medicine residents
training or working in
medically
underserved
communities after
completing a Bureau
of Health Workforce
public health training
program (Outcome)
Year and Most
Recent Result /
Target for Recent
Result /
(Summary of
FY 2024
Result)
Target
FY 2022: 321,765 320,000
FY 2025
Target
320,000
FY 2025
Target +/- FY
2024 Target
Maintain
5,700
Discontinued
N/A
275
275
Maintain
Target: 160,000
(Target Exceeded)
FY 2022: 6,135
Target: 6,000
(Target Exceeded)
FY 2022: 275
Target: 180
(Target Exceeded)
Preventive Medicine Residency Program Outputs
Year and Most
Recent Result
Number of preventive medicine residents participating in residencies
AY 2022-2023: 118
Number of preventive medicine residents completing training
AY 2022-2023: 52
141
142.
Performance NarrativeMost recent results are for activities in Academic Year (AY) 2022-2023 funded in FY 2022.
Measure 2130.02 is being discontinued since it overlaps with Measure 2130.01. The measure
relating to the number of people trained is a more meaningful.
Grant Awards Table – Public Health Training Centers Program
FY 2023
Final
FY 2025 President’s
Budget
FY 2024
Continuing
Resolution
10
10
10
Average Award
$939,571
$986,861
$987,024
Range of Awards
$805,380 –
$1,140,962
$769,047 –
$1,105,000
Number of Awards
$770,676 –
$1,105,000
Grant Awards Table – Preventive Medicine Residency Program
FY 2023
Final
FY 2025 President’s
Budget
FY 2024
Continuing
Resolution
19
19
19
Average Award
$368,218
$367,065
$367,065
Range of Awards
$160,161 – $400,000
$156,417 – $400,000
$156,417 – $400,000
Number of Awards
142
143.
Nursing Workforce DevelopmentAdvanced Nursing Education Programs
FY 2024
Continuing
Resolution
FY 2023
Final
FY 2025
President’s
Budget
FY 2025
+/FY 2023
BA
$95,581,000
$95,581,000
$105,581,000
+$10,000,000
FTE
11
13
13
+2
Authorizing Legislation: Public Health Service Act, Sections 811 and 871, as amended by Public
Law 116-136.
FY 2025 Authorization ....................................................................................$137,837,000
Allocation Method .......................................................... Formula Grant/Competitive Grant
Program Description
The Advanced Nursing Education Programs increase the number of qualified nurses in the
primary care workforce by funding enhancements of training and practice of advanced nurses
and traineeships for nursing students. By statute, grant applications with projects that
substantially benefit rural or underserved populations or help public health nursing needs in state
or local health departments, receive a funding preference.
Eligible Entities: Schools of nursing, nursing centers, academic health centers, state or local
governments, and other non-profit public or private entities determined appropriate by the
Secretary such as Federally Qualified Health Centers and rural health clinics. Community-based
organizations and Tribes and Tribal organizations may apply for these funds, if otherwise
eligible.
Budget Request
The FY 2025 Budget Request for the Advanced Nursing Education Programs of $105.6 million
is $10 million above the FY 2023 Final level. This funding level will train an estimated 8,200
nurses in FY 2025.
The request supports 10 new awards for the Maternity Care Nursing Workforce Expansion
Program. The program will grow and diversify the maternal and perinatal health nursing
workforce by training an estimated 224 additional certified nurse midwives and preparing them
to serve in rural and underserved communities nationwide. Licensed nurse midwives are
clinically trained health care practitioners who assist in pregnancy and childbirth. Furthermore,
143
144.
U.S. nursing schools report that they turned away qualified applications from baccalaureate andgraduate nursing programs due to insufficient number of faculty, clinical sites, classroom space,
and clinical preceptors, as well as budget constraints. The new awards will help address these
gaps.
The request also supports a total of 201 continuation awards for the Advanced Nursing
Education Programs to increase the number of qualified nurses in the primary care workforce,
including nurse practitioners, nurse midwives, clinical nurse specialists, and Sexual Assault
Nurse Examiners.
The funding request also includes costs associated with the grant review and award process,
follow-up performance reviews, and information technology and other program support costs.
Funding History
FY
FY 2021
FY 2022
FY 2023
FY 2024 CR
FY 2025 President’s Budget
Amount
$80,581,000
$85,581,000
$95,581,000
$95,581,000
$105,581,000
Program Accomplishments
In Academic Year (AY) 2022-2023, the Advanced Nursing Education Programs trained 8,017
advanced practice nurses. A total of 3,474 nurses completed their training program (for example,
a sexual assault nurse examiner certificate program) or graduated from a nursing degree
program, including 1,552 nurse practitioners, 1,322 nurse anesthetists, and 251 forensic nurses,
among others. Select Advanced Nursing Education Program outcomes include:
Over 2 million hours of patient care and nearly 900,000 patient encounters occurred in
medically underserved communities because of the Advanced Nursing Education
Program.
72 percent of Advanced Nursing Education-trained nurses worked in underserved areas
after graduation, including 751 who were hired by a grantee or partner organization.
60 percent of Advanced Nursing Education nurses worked in medically underserved
communities and/or rural areas one year after graduation.
During AYs 2017 through 2022, 6,906 advanced practice registered nurses (APRNs) graduated
from Advanced Nursing Education Workforce (ANEW)-supported degree programs and entered
the workforce, including 4,282 APRNs who completed ANEW clinical traineeships in rural and
medically underserved communities. Graduates who trained in rural areas, primary care settings,
and medically underserved communities were significantly more likely to work in those settings
144
145.
(nearly 5 times, 3.6 times, and 2.5 times, respectively) than graduates who did not train in thosesettings.36
Outputs and Outcomes Table
Measure
Year and Most
Recent Result /
Target for Recent
Result /
(Summary of
Result)
2140.01 Number of
students trained in
Advanced Nursing
Education and
Workforce (ANEW)
degree programs
(Output)
FY 2022: 2,668
2140.03 Number of
graduates from
Advanced Nursing
Education and
Workforce (ANEW)
degree programs
(Outcome)
FY 2022: 1,201
FY 2024
Target
FY 2025
Target
FY 2025
Target
+/- FY 2024
Target
2,600
2,600
Maintain
1,200
1,200
Maintain
Target: 3,700
(Target Not Met)
Target: 1,000
(Target Exceeded)
Performance Narrative
Most recent results are for activities in Academic Year (AY) 2022-2023 funded in FY 2022. The
Advanced Nursing Education Workforce (ANEW) Program, one of the Advanced Nursing
Education programs, did not meet the FY 2022 target of 3,700 students for Measure 2140.01, as
nursing program enrollment has been declining across the country in part because of
infrastructure challenges and ramifications of the COVID-19 pandemic.
Advanced Nursing Education Programs Outputs
Number of new nurse anesthetists produced through the Nurse
Anesthetist Training Program
36
Year and Most
Recent Result
AY 2022-2023: 1,322
Health Resources and Services Administration. (2023). Advanced Nursing Education Workforce program
evaluation. U.S. Department of Health and Human Services. https://bhw.hrsa.gov/sites/default/files/bureau-healthworkforce/funding/anew-5-year-evaluation.pdf
145
146.
Percentage of nurse anesthetists working in medically underservedcommunities and/or rural areas one year after completing the Nurse
Anesthetist Training Program
Number of new sexual assault nurse examiners produced through the
Advanced Nursing Education-Sexual Assault Nurse Examiners
Program
Percentage of sexual assault nurse examiners working in medically
underserved communities and/or rural areas one year after completing
the Advanced Nursing Education-Sexual Assault Nurse Examiners
Program
Number of nurse practitioner residency or fellowship program
completers
Percentage of new nurse practitioners working in medically
underserved communities and/or rural areas after completing a
HRSA-funded nurse practitioner residency or fellowship program
AY 2022-2023: 59%
AY 2022-2023: 632
AY 2022-2023: 48%
AY 2022-2023: 319
AY 2022-2023: 78%
Grant Awards Table
FY 2024
Continuing
Resolution
FY 2023
Final
Number of
Awards
Average Award
Range of
Awards
FY 2025
President’s Budget
201
201
211
$475,527
$475,527
$500,383
$3,785 – $1,000,000
$3,785 – $1,000,000
$3,785 – $1,000,000
146
147.
Nursing Workforce DiversityFY 2024
Continuing
Resolution
FY 2023
Final
FY 2025
President’s
Budget
FY 2025
+/FY 2023
BA
$24,343,000
$24,343,000
$24,343,000
---
FTE
5
5
5
---
Authorizing Legislation: Public Health Service Act, Section 821, as amended by the CARES
Act, Section 3404, Public Law 116-136.
FY 2025 Authorization ....................................................................................$137,837,000
Allocation Method .................................................................... Competitive Grant/Contract
Program Description
The Nursing Workforce Diversity Program increases nursing education opportunities for
individuals from disadvantaged backgrounds, including racial and ethnic minorities who are
underrepresented among registered nurses. The overarching goal of the Nursing Workforce
Diversity Program is to help build a high-quality registered nurse workforce that reflect the
diversity of the communities served. The program provides student stipends, scholarships, preentry preparation and retention activities. It also supports diploma-prepared or associate degreeprepared registered nurses to ascend through the career ladder to become baccalaureate-prepared
registered nurses and practicing registered nurses to become advanced practice nurses.
Eligible Entities: Accredited schools of nursing, nursing centers, academic health centers, state,
or local governments, and other private or public entities, including tribes and tribal
organizations.
Budget Request
The FY 2025 Budget Request for the Nursing Workforce Diversity Program of $24.3 million is
equal to the FY 2023 Final level. In FY 2025, the Nursing Workforce Diversity Program will
conduct a new grant competition and expects to fund 42 new awards to increase nursing
education opportunities for individuals from disadvantaged backgrounds.
The funding request also includes costs associated with the grant review and award process,
follow-up performance reviews, and information technology and other program support costs.
147
148.
Funding HistoryFY
FY 2021
FY 2022
FY 2023
FY 2024 CR
FY 2025 President’s Budget
Amount
$19,843,000
$23,343,000
$24,343,000
$24,343,000
$24,343,000
Program Accomplishments
In Academic Year (AY) 2022-2023, the Nursing Workforce Diversity Program trained 2,033
nursing students enrolled in degree programs or academic support programs. A total of 531
nursing students completed their Nursing Workforce Diversity Program, including 453 registered
nurses and 42 nurse practitioners, among others. Select Nursing Workforce Diversity Program
outcomes include:
• 27 percent of Nursing Workforce Diversity degree program graduates earned an associate
degree, 57 percent earned a bachelor’s degree, 9 percent earned a master’s degree, and 7
percent earned a doctoral-level degree.
• 65 percent of AY 2021-2022 graduates worked or trained in medically underserved
communities one year later.
148
149.
Outputs and Outcomes TableMeasure
2150.01 Percentage of
Nursing Workforce Diversity
participants who are
underrepresented minorities
and/or from disadvantaged
backgrounds
(Outcome)
2150.02 Number of Nursing
Workforce Diversity
participants who participated
in academic support
programs during the
academic year (Outcome)
2150.03 Number of Nursing
Workforce Diversity
participants who are enrolled
in a nursing degree program
(Outcome)
Year and Most
Recent Result /
Target for
Recent Result /
(Summary of
FY 2024
Result)
Target
FY 2022: 100% 100%
FY 2025
Target
FY 2025
+/-FY 2024
Target
Target
Discontinued N/A
Target: 98%
(Target
Exceeded)
FY 2022: 174
3,000
Discontinued N/A
3,000
3,000
Target: 4,500
(Target Not
Met)
FY 2022: 1,859
Maintain
Target: 2,500
(Target Not
Met)
Nursing Workforce Diversity Program Outputs
Number of nursing students graduating from nursing programs
Year and Most Recent
Result
AY 2022-2023: 473
Performance Narrative
Most recent results are for activities in AY 2022-2023 funded in FY 2022. The Nursing
Workforce Diversity Program did not meet the FY 2022 targets for Measure 2150.02 and
Measure 2150.03 due to challenges with data collection which resulted in partial data reporting
The program transitioned from reporting aggregated trainee data to individual-level trainee data,
but some awardees did not collect the detailed data required to complete this individual-level
reporting in time for the AY 2022-2023 reporting deadline. In the coming year, the trainee count
is expected to improve as awardees grow accustomed to the new reporting requirements.
In FY 2025, measures 2150.01 and 2150.02 will be discontinued since they do not reflect the
primary focus of the Nursing Workforce Diversity Program.
149
150.
Grant Awards TableFY 2024
Continuing
Resolution
FY 2023
Final
Number of Awards
FY 2025
President’s Budget
42
42
42
Average Award
$463,961
$465,976
$403,853
Range of Awards
$372,922 – $555,000
$376,951 – $555,000
$252,706 – $555,000
150
151.
Nurse Education, Practice, Quality and Retention ProgramsFY 2024
Continuing
Resolution
FY 2023
Final
FY 2025
President’s
Budget
FY 2025
+/FY 2023
BA
$59,413,000
$59,413,000
$69,413,000
+$10,000,000
FTE
4
8
8
+4
Authorizing Legislation: Public Health Service Act, Section 831, as amended by the CARES
Act, Section 3404, Public Law 116-136.
FY 2025 Authorization ....................................................................................$137,837,000
Allocation Method .................................................................... Competitive Grant/Contract
Program Description
The Nurse Education, Practice, Quality and Retention programs address national nursing needs
and strengthen nursing workforce capacity in three priority areas: education, practice, and
retention. The programs support projects to enhance nursing education, improve the quality of
patient care, increase nurse retention, and strengthen the nursing workforce.
The Nurse Education, Practice, Quality and Retention programs have several statutory purposes
that support developing, distributing, and retaining a diverse, culturally competent nursing
workforce that can adapt to the population’s changing health care needs and provide the highest
quality of care for all. The programs aim to increase the number of nursing students exposed to
meaningful clinical experiences and training in medically underserved and rural communities,
who will then be more likely to choose to work in these settings upon graduation.
Eligible Entities: Accredited schools of nursing, community colleges, health care facilities, and
partnerships of a nursing school and health care facility.
Budget Request
The FY 2025 Budget Request for the Nurse Education, Practice, Quality and Retention programs
of $69.4 million is $10 million above the FY 2023 Final level. The additional funding will allow
HRSA to support dedicated training resources to grow the maternal health nursing workforce.
New awards will increase the number of nurses trained to provide prenatal and perinatal maternal
health care in rural and underserved community settings. Hospitals – particularly community
hospitals and rural hospitals – are facing significant challenges in recruiting and retaining labor
and delivery nurses, and this issue has impacted hospital labor and delivery closures and
increased maternal care deserts. As the Administration works to address the country’s maternal
health needs, as outlined in the White House Blueprint for Addressing the Maternal Health
151
152.
Crisis, it is vital to leverage innovative training approaches to increase the maternal health carenursing workforce. With this funding, HRSA anticipates making 13 new awards that will train
approximately 637 nurses.
In FY 2025, HRSA will also recompete the Nurse Education, Practice, Quality and RetentionRegistered Nurse Training Program, which will increase the number of nursing students trained
in acute care settings in underserved communities.
Additionally, in FY 2025, the Nurse Education, Practice, Quality and Retention programs will
continue to provide education and training opportunities within community-based mobile health
units; create a pathway from academic training to clinical practice; and increase nurse training
using simulation-based technology.
The funding request also includes costs associated with the grant review and award process,
follow-up performance reviews, and information technology and other program support costs.
Funding History
FY
FY 2021
FY 2022
FY 2023
FY 2024 CR
FY 2025 President’s Budget
Amount
$46,757,000
$54,413,000
$59,413,000
$59,413,000
$69,413,000
Program Accomplishments
In Academic Year (AY) 2022-2023, the Nurse Education, Practice, Quality, and Retention
programs trained 10,342 nurses and nursing students. A total of 5,245 nurses and nursing
students completed a training program supported by the Nurse Education, Practice, Quality, and
Retention program during the academic year. Select Nurse Education, Practice, Quality, and
Retention program outcomes include:
2,255 participants completed clinical training experiences in a wide variety of high-need
and community-based settings. The 767 clinical training sites included community-based
organizations, Federally Qualified Health Centers or Look-alikes, Rural Health Clinics or
Critical Access Hospitals, mobile health clinics, and local health departments.
853 courses, workshops, simulations, clinical rotations, and practicums were developed
on topics such as primary care nursing, health equity, evidence-based practice, and
interprofessional care. Nurse Education, Practice, Quality, and Retention programs
trained 42,465 nurses and nursing students through these curricula.
152
153.
Outputs and Outcomes TableYear and Most
Recent Result /
Target for Recent
Result /
(Summary of
FY 2024
Measure
Result)
Target
2160.01 Number of nurses FY 2022: 10,342
10,300
and nursing students
trained to provide care in Target: 2,179
medically underserved
communities through
(Target Exceeded)
Nurse Education, Practice,
Quality and Retention
Programs (Output)
2160.02 Number of Nurse FY 2022: 9,052
6,500
Education, Practice,
Quality and Retention
Target: 4,856
Programs trainees and
professionals contributing (Target Exceeded)
to interprofessional care
teams at clinical training
sites (Output)
FY 2025
Target
11,000
FY 2025
Target
+/-FY 2024
Target
+700
Discontinued
N/A
Performance Narrative
Most recent results are for activities in AY 2022-2023 funded in FY 2022. In FY 2022, the
calculation was modified to include all Nurse Education, Practice, Quality, and Retention
programs instead of a subset. Program results will better align with targets in future years.
In FY 2025, Measure 2160.02 will be discontinued as it only captures a basic component of all
nursing education - being part of interprofessional care teams, whereas Measure 2160.01
highlights the key output of nursing education.
Grant Awards Table
FY 2024
Continuing
Resolution
FY 2023
Enacted Level
Number of Awards
Average Award
Range of Awards
81
$742,500
$259,126 – $1,000,000
153
FY 2025
President’s Budget
94
81
$738,436
$733,494
$264,639 – $1,000,000 $226,959 – $1,000,000
154.
Nurse Faculty Loan ProgramFY 2024
Continuing
Resolution
FY 2023
Final
FY 2025
President’s
Budget
FY 2025
+/FY 2023
BA
$28,500,000
$28,500,000
$28,500,000
---
FTE
4
5
5
+1
Authorizing Legislation: Public Health Service Act, Section 846A, as amended by the CARES
Act, Section 3404, Public Law 116-136.
FY 2025 Authorization ....................................................................................$117,135,000
Allocation Method ......................................................................................... Formula Grant
Program Description
The Nurse Faculty Loan Program seeks to increase the number of qualified nursing faculty
nationwide by providing low interest loans for individuals studying to become nurse faculty and
loan cancelation for those who then proceed to work as faculty. A robust, geographically
dispersed nurse faculty workforce is essential to producing the nursing workforce needed to meet
the nation’s health care needs. Successful applicants establish and operate a student loan
program, including maintaining a fund, providing loans to students enrolled in advanced
education nursing degree programs, and monitoring compliance with program requirements. In
exchange for completing up to four years of post-graduation full-time nurse faculty employment
in an accredited school of nursing, graduates receive cancellation of up to 85 percent of the
original student loan amount (plus interest thereon) as authorized by the program. The Nurse
Faculty Loan Program also encourages advance practice registered nurses to serve as full-time
preceptors within an academic-practice partnership framework in an effort to expand clinical
training opportunities for nursing students.
New Nurse Faculty Loan Program awards are made to eligible new applicants (with no current
award) and continuing applicants (with a current award), who apply for the funding annually. To
receive a new Nurse Faculty Loan Program award, continuing applicants must meet certain
criteria regarding program compliance and loan fund balances. Grantees are expected to continue
conducting training activity and maintaining the loan fund account throughout the duration of the
project. Currently, the Nurse Faculty Loan Program has a total 213 awardees maintaining the
loan fund account. Schools that do not receive a new award may continue making loans from the
student loan fund accounts they have already established.
Eligible Entity: Accredited schools of nursing that offer advanced nursing education degree
program(s) that prepare graduate students for roles as nurse educators.
154
155.
Budget RequestThe FY 2025 Budget Request for the Nurse Faculty Loan Program of $28.5 million is equal to
the FY 2023 Final level. In FY 2025, the Nurse Faculty Loan Program will provide funding to
accredited schools of nursing to establish and operate a student loan fund and provide loans to
students enrolled in advanced education nursing degree programs who are committed to
becoming nurse faculty. The FY 2025 funding will be used to support 80 new awards to new and
continuing Nurse Faculty Loan Program applicants.
The funding request also includes costs associated with the grant review and award process,
follow-up performance reviews, and information technology and other program support costs.
Funding History
FY
FY 2021
FY 2022
FY 2023
FY 2024 CR
FY 2025 President’s Budget
Amount
$28,414,000
$28,500,000
$28,500,000
$28,500,000
$28,500,000
Program Accomplishments
In Academic Year (AY) 2022-2023, the Nurse Faculty Loan Program provided loans to 2,746
advanced practice nursing students in exchange for their commitment to become nurse faculty. A
total of 924 nurses graduated, including 689 Nurse Faculty Loan Program nurses in doctoral
programs and 235 Nurse Faculty Loan Program nurses in master’s degree programs. Select
Nurse Faculty Loan Program outcomes include:
74 percent of AY 2021-2022 graduates were in faculty roles one year later, with the
majority teaching at the bachelors and graduate levels.37
28 percent of Nurse Faculty Loan Program nurses were hired by the grantee
organizations or one of their partners after they graduated.
According to the American Association of Colleges of Nursing, the vacancy rate for full-time
faculty nurse positions was 9 percent in AY 2022-2023. Without the Nurse Faculty Loan
Program’s AY 2021-2022 graduates working as nurse faculty, the vacancy rate would have been
nearly 11 percent.38
37
Due to COVID-19, the requirement to obtain full-time nurse faculty employment within 12 months of graduation
was extended to 24 months for NFLP beneficiaries with graduation dates from AY 2019-2020 to AY 2021-2022.
38
American Association of Colleges of Nursing. (2022). Faculty vacancy surveys: 2022 results.
https://www.aacnnursing.org/news-data/research-data-center/annual-surveys/faculty-vacancy-surveys
155
156.
Outputs and Outcomes TableMeasure
2170.01 Number of
nurses in advanced
nursing degree
programs who
received a loan in
exchange for a
commitment to
become nurse faculty
(Output)
2170.02 Number of
graduates from
advanced nursing
degree programs who
received a loan and
committed to
becoming nurse
faculty (Outcome)
Year and Most
Recent Result /
Target for Recent
Result /
(Summary of
Result)
FY 2022: 2,746
FY 2024
Target
2,700
FY 2025
Target
2,700
FY 2025
Target
+/-FY 2024
Target
Maintain
900
900
Maintain
Target: 1,900
(Target Exceeded)
FY 2022: 924
Target: 400
(Target Exceeded)
Performance Narrative
Most recent results are for activities in Academic Year (AY) 2022-2023 funded in FY 2022.
Grant Awards Table
FY 2024
Continuing Resolution
FY 2025 President’s
Budget
80
80
80
Average
Award
$301,136
$301,136
Range of
Awards
$27,485 – $3,405,375
$27,485 – $3,405,375
FY 2023
Final
Number of
Awards
156
$301,136
$27,485 – $3,405,375
157.
Nurse CorpsFY 2024
Continuing
Resolution
FY 2023
Final
FY 2025
President’s
Budget
FY 2025
+/FY 2023
BA
$92,635,000
$92,635,000
$92,635,000
---
FTE
34
34
34
---
Authorizing Legislation: Section 846 of the Public Health Service Act as amended by the CARES Act,
Section 3404, Public Law 116-136.
FY 2025 Authorization .................................................................................................. $92,635,000
Allocation Method ........................................................ Other (Competitive Awards to Individuals)
Program Description
The Nurse Corps Program addresses the distribution of nurses by supporting professional nurses
and nursing students committed to working in communities with inadequate access to care. In
exchange for scholarship support or loan repayment assistance, Nurse Corps participants fulfill
their service obligation by working in Critical Shortage Facilities located in Health Professional
Shortage Areas and underserved communities throughout the nation, which include rural
communities and other identified geographic areas, populations, or facilities that lack access to
primary care or behavioral health services. In addition, Nurse Corps provides loan repayment
assistance to faculty working in eligible schools of nursing. As of September 30, 2023, more than
three-quarters of the Nurse Corps providers were serving in community-based settings, and 20
percent were serving in rural communities.
Nurse Corps Loan Repayment Program: The Nurse Corps Loan Repayment Program assists in
the recruitment and retention of professional registered nurses, including advanced practice
registered nurses (i.e., nurse practitioners, certified registered nurse anesthetists, certified nurse
midwives, and clinical nurse specialists), who are dedicated to working in Critical Shortage
Facilities or as faculty in eligible schools of nursing. The Nurse Corps Loan Repayment Program
decreases the economic barriers associated with pursuing careers at Critical Shortage Facilities or
in academic nursing by repaying 60 percent of the principal and interest on nursing education
loans in exchange for two years of full-time service at a Critical Shortage Facility or in academic
nursing. For an optional third year of service (via a continuation contract), the Nurse Corps Loan
Repayment Program will award participants an additional 25 percent of their original total
qualifying educational loan balance as of the effective date of their initial two-year contract.
Nurse Corps Scholarship Program: The Nurse Corps Scholarship Program provides
scholarships to individuals who are enrolled or accepted for enrollment in an accredited school of
nursing in exchange for a service commitment of at least two years in a Critical Shortage Facility
after graduation. Nurse Corps Scholarship Program awards reduce the financial barrier to nursing
157
158.
education for all levels of professional nursing students and increase the pipeline of nurses whowill serve in Critical Shortage Facilities.
Eligible Entities:
Nurse Corps Loan Repayment Program: Participants must have a current license to practice
as a registered nurse and be employed full-time at a public or private Critical Shortage Facility (at
least 32 hours per week) or at an accredited public or private school of nursing (full-time as
defined by the employer for at least nine months per service year).
Nurse Corps Scholarship Program: Participants must be enrolled or accepted for enrollment in
an accredited diploma, associate, or collegiate (bachelor’s, master’s, or doctoral) school of
nursing program.
Budget Request
The FY 2025 Budget Request for the Nurse Corps Program of $92.6 million is equal to the FY
2023 Final level. This request will fund an estimated 259 scholarship (new and continuation) and
659 loan repayment (new and continuation) awards. The funds will increase the number of welltrained nurses available to provide services, such as mental/behavioral health and
women’s/maternal health services, in communities experiencing a shortage in nurses.
The funding request also includes costs associated with the application review and award process,
follow-up performance reviews, and information technology as well as other program support
costs.
To further support the Nurse Corps Program, the FY 2025 Budget Request also includes a
legislative proposal to extend the tax-exempt status that is provided to the National Health
Service Corps Program recipients to HRSA’s similar health care workforce loan repayment
programs. If HRSA is not required to pay employer taxes on the award, more funds would be
available for HRSA to make additional or higher awards through these programs.
Funding History
FY
FY 2021
FY 2022
FY 2023
FY 2024 CR
FY 2025 President's Budget
Amount
$88,116,000
$88,635,000
$92,635,000
$92,635,000
$92,635,000
Program Accomplishments
The Nurse Corps performance measures gauge the program’s contribution towards improving the
recruitment and retention of nurses working in Critical Shortage Facilities.
158
159.
In FY 2021, the American Rescue Plan Act provided the Nurse Corps Program with $200 millionin additional funding to support the nation’s COVID-19 emergency response. In FY 2023, the
remaining American Rescue Plan Act funds allowed HRSA to further bolster the nursing
workforce with a total of 505 Nurse Corps Loan Repayment Program continuation awards to
nurses serving in Critical Shortage Facilities and at accredited schools of nursing, and 33
continuation awards to Nurse Corps Scholarship Program recipients. In addition, Nurse Corps
funded 20 Career Pathway scholarship awards to entry-level health professionals obtaining
qualifying degrees to become registered nurses. As of September 30, 2023, the Nurse Corps field
strength comprised 3,628 nurses working in Critical Shortage Facilities located in Health
Professional Shortage Areas and nurse faculty members working in academic institutions. By
using the remaining American Rescue Plan Act funds to make continuation awards in FY 2023,
HRSA was able to make additional new awards.
In an effort to address the opioid epidemic and other substance use disorders across the nation,
the Nurse Corps Program continues supporting the behavioral health nursing workforce. In FY
2023, Nurse Corps awarded 152 nurse practitioners or students specializing in psychiatric-mental
health. HRSA will continue to dedicate a portion of the scholarships and loan repayment awards
to nurse practitioners specializing in psychiatric-mental health with the goal of leveraging HRSA
funding to address the opioid crisis and the nation’s mental health needs.
Outputs and Outcomes Table
Measure
2180.01: Proportion of
Nurse Corps Loan
Repayment Program
participants who extend
their service contracts to
commit to work at a Critical
Shortage Facility for an
additional year. (Outcome)
Year and Most
Recent Result
/Target for
Recent Result /
(Summary of
Result)
FY 2023: 41%
FY 2024
Target
52%
Target: 52%
(Target Not Met)
159
FY 2025
Target
52%
FY 2025
Target
+/-FY 2024
Target
Maintain
160.
Measure2180.02: Proportion of
Nurse Corps Loan
Repayment
Program/Scholarship
Program participants
retained in service at a
Critical Shortage Facility
for at least one year beyond
the completion of their
Nurse Corps Loan
Repayment
Program/Scholarship
Program commitment.
(Outcome)
Year and Most
Recent Result
/Target for
Recent Result /
(Summary of
Result)
FY 2023: 89%
FY 2025
Target
89%
89%
Maintain
85%
85%
Maintain
2%
2%
Maintain
4%
4%
Maintain
Target: 80%
(Target Exceeded)
2180.03: Proportion of
Nurse Corps Scholarship
Program awardees
obtaining their
baccalaureate degree or
advanced practice degree in
nursing. (Outcome)
FY 2023: 78%
2180.05: Default rate of
Nurse Corps Loan
Repayment Program
participants (Efficiency)
FY 2023: 1%
2180.06: Default rate of
Nurse Corps Scholarship
Program participants
(Efficiency)
FY 2024
Target
FY 2025
Target
+/-FY 2024
Target
Target: 85%
(Target Not Met)
Target: 3%
(Target Exceeded)
FY 2023: 4%
Target: 15%
(Target Exceeded)
160
161.
Nurse Corps Loan Repayments/Scholarships Awards TableFY 2024
Continuing
Resolution
FY 2023 Final
FY 2025
President’s Budget
Loan Repayments
$61,756,667
$61,756,667
$61,756,667
Scholarships
$30,878,333
$30,878,333
$30,878,333
Nurse Corps Awards Table39
Fiscal Year
2018
2019
2020
2021
2022
2023
2024
2025
Scholarships
New Awards
215
220
244
529
567
293
232
220
4
6
13
15
25
33
36
39
544
561
465
1,246
2,071
492
17
376
279
292
291
341
208
505
1,190
283
1,042
1,079
1,013
2,131
2,871
1,323
1,475
918
Continuation
Awards
Loan Repayment
New Awards
Continuation
Awards
Total
Nurse Corps Field Strength Table40
Fiscal Year
2018
2019
2020
2021
2022
2023
2024
2025
465
450
415
400
412
512
1,047
884
Loan Repayment
1,129
1,279
1,293
1,907
3,171
2,823
1,531
614
Loan Repayment
Nurse Faculty
271
199
135
214
349
293
168
62
1,865
1,928
1,843
2,521
3,932
3,628
2,746
1,560
Scholarship
Total
39
40
FYs 2021, 2022, and 2023 awards and field strength are include American Rescue Plan Act funding.
Ibid.
161
162.
Children’s Hospitals Graduate Medical Education Payment ProgramFY 2024
Continuing
Resolution
FY 2023
Final
FY 2025
President’s
Budget
FY 2025
+/FY 2023
BA
$385,000,000
$385,000,000
$385,000,000
---
FTE
22
22
22
---
Authorizing Legislation: Public Health Service Act, Section 340E, as amended by the Dr. Benjy
Frances Brooks Children’s Hospital GME Support Reauthorization Act of 2018, Section 2,
Public Law 115-241.
FY 2025 Authorization…………………………………………………………….Expired
Direct GME: $105,000,000; Indirect Medical Education: $220,000,000
Allocation Method ......................................................................... Formula-Based Payment
Program Description
The Children’s Hospitals Graduate Medical Education Payment Program supports graduate
medical education in freestanding children’s teaching hospitals to train physicians across
multiple specialties provide quality care to children. The Children’s Hospitals Graduate Medical
Education Payment Program compensates for the disparity in federal graduate medical education
funding for freestanding children’s teaching hospitals as compared to other types of teaching
hospitals who primarily serve adults and receive federal graduate medical education funding
through the Medicare Program.
The Children’s Hospitals Graduate Medical Education Payment Program supports freestanding
children’s teaching hospitals that educate and train future pediatricians, pediatric subspecialists,
and other non-pediatric residents; provides care for vulnerable and underserved children; and
conducts innovative and valuable pediatric research. It supports the training of residents to care
for the pediatric population and enhances the supply of primary care and pediatric medical and
surgical subspecialties. The program supports more than half of the pediatric residents trained in
the United States.
The Children’s Hospitals Graduate Medical Education Payment Program statute allows for a
Quality Bonus System payment to be distributed to hospitals participating in the program that
meet certain eligibility criteria. Currently, the Quality Bonus System allows for additional
limited payments to be made to Children’s Hospitals Graduate Medical Education payment
recipients on data collected about their graduate medical education programs, which will assist in
measuring and demonstrating long-term programmatic impacts and effectiveness.
An assessment is conducted annually to verify the number of full-time equivalent (FTE) resident
counts reported by eligible awardees and payment amounts are reconciled per the statute.
162
163.
Eligible Entities: Freestanding children’s teaching hospitals.Budget Request
The FY 2025 Budget Request for Children’s Hospitals Graduate Medical Education of $385
million is equal to the FY 2023 Final level. This request will fund 59 awards to current eligible
children’s hospitals. The request will enable HRSA to continue to support approximately 8,300
physician FTEs for direct and indirect medical expenses for graduate medical education and
implement the Quality Bonus System. Direct medical education spending includes expenditures
related to stipends and fringe benefits for residents, salaries and fringe benefits for supervising
faculty, a hospital’s specific geographic variations in costs, and inflation. Indirect medical
education spending includes expenditures associated with the productivity of the hospital staff as
they assist in training residents, processing of additional diagnostic tests that residents may order
during their clinical experience, the number of available beds, and the number of residents the
hospital trains.
The FY 2025 Budget Request will support the FTE resident verification through an annual FTE
assessment contract to ensure funded FTE counts are reported correctly and are not funded by
other federal programs to avoid an overlap in payments. The funding will also support costs
associated with the award process, program performance reviews, and information technology
and other program support costs.
Funding History
FY
FY 2021
FY 2022
FY 2023
FY 2024 CR
FY 2025 President’s Budget
Amount
$349,297,000
$375,000,000
$385,000,000
$385,000,000
$385,000,000
Program Accomplishments
In Academic Year (AY) 2022–2023, the Children's Hospital Graduate Medical Education
Payment Program funded 59 children’s hospitals. These hospitals trained 8,390 resident FTEs:
41 percent of resident FTEs were in general pediatrics, 32 percent in pediatric subspecialties, and
27 percent in non-pediatric subspecialties. Children's Hospital Graduate Medical Educationfunded hospitals served as sponsoring institutions for 44 residency programs and 267 fellowship
programs, and served as major participating rotation sites for 680 other residency and fellowship
programs.
Through the 8,390 FTE slots, the Children's Hospital Graduate Medical Education Payment
Program funded 15,860 individual residents and fellows:41 6,146 pediatrics residents, including
682 in combined programs (e.g., family medicine/pediatrics); 3,163 pediatric medical
subspecialty residents, including 235 child and adolescent psychiatry fellows; 375 pediatric
41
Awardees may use one FTE slot to fund multiple residents at less than full time, so there are more residents
trained than FTE slots.
163
164.
surgical subspecialty residents; 510 adult and pediatric dentistry residents; and 5,666 adultmedical and surgical specialty residents. A total of 4,706 residents and fellows completed their
Children's Hospital Graduate Medical Education training. Select Children's Hospital Graduate
Medical Education Payment Program outcomes include:
55 percent of all pediatrics residents trained in the United States were supported by a
Children's Hospital Graduate Medical Education-funded residency program, as were 53
percent of all pediatric medical and surgical specialists and subspecialists.42
Patient care was provided through more than 1.7 million patient encounters in primary care
settings and 5.5 million patient contact hours in medically underserved communities
because of the Children's Hospital Graduate Medical Education Payment Program.
59 percent of Children's Hospital Graduate Medical Education graduates chose to remain
and practice in the state where they completed their residency training, 4 percent higher than
the national average of 55 percent.43
Outputs and Outcomes Table
Measure
2190.01 Number of fulltime equivalent medical
and dental residents
training in eligible
children’s teaching
hospitals (Output)
2190.02 Percentage of
hospitals with full-time
equivalent residents
counts and caps (Output)
2190.03 Percentage of
payments made on time.
(Efficiency)
Year and Most
Recent Result /
Target for Recent
Result /
(Summary of
FY 2024
Result)
Target
FY 2022: 8,390
8,000
FY 2025
Target
8,300
FY 2025
Target
+/- FY 2024
Target
+300
90%
Discontinued
N/A
100%
Discontinued
N/A
Target: 7,700
(Target Exceeded)
FY 2022: 90%
Target: 90%
(Target Met)
FY 2022: 100%
Target: 100%
(Target Met)
42
Accreditation Council for Graduate Medical Education. (2023). Data resource book for academic year 2022-2023.
https://www.acgme.org/globalassets/pfassets/publicationsbooks/2022-2023_acgme_databook_document.pdf
43
Association of American Medical Colleges. (2022). Report on residents.
https://www.aamc.org/datareports/students-residents/interactive-data/report-residents/2022/table-c6-physicianretention-state-residency-training-state
164
165.
Performance NarrativeMost recent results are for activities in Academic Year (AY) 2022-2023 funded in FY 2022.
Targets for performance measures 2190.02 and 2190.03 were discontinued due to repeated
success and no additional room for improvement. Measure 2190.01 and the number for residents
trained under the Children’s Hospital Graduate Medical Education Payment Program remains the
primary metric to assess program performance.
Grant Awards Table
FY 2024
Continuing
Resolution
FY 2023 Final
Number of Awards
FY 2025
President’s Budget
59
59
59
Average Award
$6,164,842
$6,136,549
$6,136,549
Range of Awards
$32,898 – $26,712,922
165
$31,883 – $27,691,669 $31,883 – $27,691,669
166.
Teaching Health Center Graduate Medical Education ProgramFY 2024
Continuing
Resolution
FY 2023
Final
FY 2025
President’s
Budget
FY 2025
+/FY 2023
Mandatory
$119,290,000
$55,452,000
---
-$119,290,000
Mandatory
Proposed
---
$101,548,000
$320,000,000
+$320,000,000
$119,290,000
$157,000,000
$320,000,000
+$200,710,000
10
16
16
+6
TOTAL
FTE
Authorizing Legislation: Public Health Service Act, Section 340H, as amended by the
Consolidated Appropriations Act, 2021, Title III, Subtitle A, Section 301, Public Law 116-260.
FY 2025 Authorization ......................................................................................... ....Expired
Allocation Method ......................................................................... Formula-Based Payment
Program Description
The Teaching Health Center Graduate Medical Education (THCGME) Program increases the
number of primary care physician and dental residents trained in community-based settings
where most people receive their health care. Unlike most federal funding for graduate medical
education, which goes directly to hospitals, THCGME payments are made to community-based
ambulatory care sites that provide primary care training.
Program funds support the educational costs incurred by new and expanded residency programs.
Along with supporting the salaries and benefits of residents and faculty, THCGME funds are
also used to foster innovation and support curriculum enhancements aimed at improving the
quality of patient care, such as the Patient-Centered Medical Home model, Electronic Health
Record utilization, population health, telemedicine, and health care leadership. These activities
ensure residents receive high quality training and are well-prepared to practice in communitybased outpatient care settings after graduation.
There are many benefits to training physicians and dental residents in community-based settings.
In a national census of third-year family medicine residents, those who trained in teaching health
centers were more likely to plan to work in safety net clinics than residents who did not train in
166
167.
these centers.44 Teaching health centers have been shown to attract residents from rural and/ordisadvantaged backgrounds.45
Eligible Entities: Community-based ambulatory patient care centers identified in statute.
Budget Request
The FY 2025 Budget Request for the THCGME Program of $320 million is $200.7 million
above the FY 2023 Final level. This request will fund up to 1,842 resident full-time equivalent
(FTE) slots in Academic Year 2025-2026 (July 1, 2025 – June 30, 2026) to coincide with
national residency training dates. At the start of FY 2024, the number of resident FTEs supported
through this program was 1,100. At this funding level, the program would expect to support to
grow to up to 1,842 FTEs by the end of FY 2025 with additional resident FTEs at current
THCGME-supported residency programs and new resident FTEs at newly awarded teaching
health center programs.
The Budget also proposes to extend mandatory funding through FY 2026 for a total investment
of $841 million over three years. This request would provide resources to support a total of 2,094
resident FTEs in existing, expanded, and new THCGME residency programs at the current perresident payment level by FY 2026. Continued mandatory THCGME base funding will provide
teaching health centers with the confidence to launch full recruitment efforts to fill and expand
their available resident slots. The Budget also proposes to remove the cap on total THCGME
payments to enable funds to be recouped and obligated through statutorily required annual
reconciliation process.
The funding request also includes costs associated with the grant review and award process,
follow-up performance reviews, and information technology and other program costs.
Enacted
Proposed Mandatory
Funding
FTEs
FY 2024
$55.5 million
FY 2025
FY 2026
$101.5 million
$320 million
$364 million
$785.5 million
1,469
1,842
2,094
---
---
44
Total Funding
--$55.5 million
Bazemore A, Wingrove P, Petterson S, Peterson L, Raffoul M, Phillips RL Jr. Graduates of Teaching Health
Centers Are More Likely to Enter Practice in the Primary Care Safety Net. Am Fam Physician. 2015;92(10):868.
45
Talib, Z, Jewers, MM, Strasser, JH, Popiel, DK, Goldberg, DG, Chen, C, Kepley, H, Mullan, Regenstein, M.
Primary Care Residents in Teaching Health Centers: Their Intentions to Practice in Underserved Settings After
Residency Training. Academic Medicine. 2018; 93(1): 98-103
167
168.
Funding History46FY
Amount
FY 2021
$126,500,000
FY 2022
$119,290,000
FY 2023
$119,290,000
FY 2024 CR
$157,000,000
FY 2025 President’s Budget
$320,000,000
* FY 2022 and FY 2023 reflect post-sequestration amounts.
Program Accomplishments
In Academic Year (AY) 2022–2023, the Teaching Health Center Graduate Medical Education
Program funded 72 teaching health centers. These teaching health centers supported 969 resident
FTE slots, which provided funding to 1,096 individual full and part-time medical and dental
residents,47 including 670 family medicine residents, 238 internal medicine residents, 92
psychiatry residents, 51 pediatrics residents, 35 other physician residents and fellows, and 10
general dentistry residents. A total of 341 physicians and dentists completed their Teaching
Health Center Graduate Medical Education residencies. Select Teaching Health Center Graduate
Medical Education Program outcomes include:
934,297 patients received care from Teaching Health Center Graduate Medical Education
residents during more than 1.4 million patient encounters. This included nearly 1.1 million
patient contact hours and 822,926 patient encounters in medically underserved
communities—an average of 751 patient encounters in medically underserved communities
per resident.
60 percent of Teaching Health Center Graduate Medical Education-supported residents
worked in primary care settings at completion of their residency program, 52 percent in
medically underserved and/or rural communities
46
FY 2022 and FY 2023 reflect post-sequestration amounts.
Awardees may use one FTE slot to fund multiple residents at less than full time, so there are more residents
trained than FTE slots.
47
168
169.
Outputs and Outcomes TableMeasure
2200.01 Number of
primary care medical and
dental resident positions
supported by Teaching
Health Centers (Outcome)
2200.02 Percentage of
Teaching Health Centers
Graduate Medical
Education-supported
medical and dental
residents training in rural
and/or medically
underserved communities
(Outcome)
Year and Most
Recent Result /
Target for
Recent Result /
(Summary of
Result)
FY 2022: 969
FY 2024
Target
1,105
FY 2025
Target
FY 2025
+/-FY 2024
Target
Target
1,842 +737
Target: 740
(Target
Exceeded)
FY 2022: 94%
85%
88% +3%
Target: 80%
(Target
Exceeded)
THCGME Program Outputs
Year and Most Recent Result
Number of primary care residents funded by THCGME
residencies
AY 2022-2023: 1,096
Number of primary care residents completing training
AY 2022-2023: 341
Performance Narrative
Most recent results are for activities in Academic Year (AY) 2022-2023 funded in FY 2022. The
FY 2025 target for Measure 2200.02 is based upon the FY 2022 result and the proposed increase
in funding.
169
170.
Grants Awards TableFY 2024 Continuing
Resolution
FY 2025 President’s
Budget
81
100
138
Average Award
$2,172,840
$2,350,400
$2,135,652
Range of Awards
$160,000 – $10,252,864
FY 2023 Final
Number of Awards
170
$160,000 – $10,252,864 $160,000 – $10,252,864
171.
National Practitioner Data BankBA
FTE
FY 2023
Final
$18,814,000
33
FY 2024
Continuing
Resolution
$18,814,000
34
FY 2025
President’s
Budget
$18,814,000
34
FY 2025
+/FY 2023
--+1
Authorizing Legislation: Title IV of the Health Care Quality Improvement Act of 1986, Public
Law 99-660, as amended by the Patient Protection and Affordable Care Act, Section 6403,
Public Law 111-148.
FY 2025 Authorization ...................................................................................................... Indefinite
Allocation Method ............................................................................................... User Fee Program
Program Description
The National Practitioner Data Bank is a workforce tool that improves health care quality,
promotes patient safety, and deters fraud and abuse in the health care system by providing
information about past adverse actions of practitioners, providers, and suppliers to authorized
health care entities and agencies. With more than 1.7 million reports since its inception in 1990,
the National Practitioner Data Bank helps reduce health care fraud and abuse by collecting and
disclosing information to authorized entities on health care-related civil judgments and criminal
convictions, adverse licensure and certification actions, exclusions from health care programs,
and other adjudicated actions taken against health care providers, suppliers, and practitioners.
Authorized health care entities use this information to make informed hiring, credentialing, and
privileging decisions to ultimately determine whether, or under what conditions, it is appropriate
for health care practitioners, providers, and suppliers to provide health care services.
Budget Request
The FY 2025 Budget Request for the National Practitioner Data Bank of $18.8 million in user
fees is equal to the FY 2023 Final level.
As mandated by the Health Care Quality Improvement Act, the National Practitioner Data Bank
does not receive appropriated funds and is financed exclusively by the collection of user fees.
Annual appropriations act language requires that user fee collections cover the full cost of
National Practitioner Data Bank operations; therefore, there is no request for appropriations for
operating the National Practitioner Data Bank. User fees are established based on forecasts of
query volume to result in adequate, but not excessive, revenues to cover all program costs to
allow the National Practitioner Data Bank to meet annual and long-term program performance
goals.
171
172.
Funding HistoryThe table below shows the user fees (revenue) collected or expected to be collected:
FY
FY 2021
FY 2022
FY 2023
FY 2024 CR
FY 2025 President’s Budget
Amount
$18,814,000
$18,814,000
$18,814,000
$18,814,000
$18,814,000
Program Accomplishments
Prior to the National Practitioner Data Bank’s inception, health care providers who lost their
licenses or had serious unprofessional conduct could move from state to state with impunity,
making it difficult for employers and licensing boards to learn about these providers' prior acts.
The National Practitioner Data Bank provides employers and other authorized health care entities
reliable information on health care practitioners, providers, and suppliers.
In FY 2023, the National Practitioner Data Bank responded to more than 12.2 million
queries, a 7 percent increase over FY 2022, from authorized health care entities,
practitioners, providers, and suppliers.
The National Practitioner Data Bank has enabled digitally certified self-query responses,
providing a paperless process with faster response times and assurances that the
responses are unaltered. Fifty-eight percent of self-queriers in FY 2023 opted for
paperless responses.
The National Practitioner Data Bank continues to enhance web content, allowing for
more user transactions to be processed in the system without increasing calls to the
Customer Service Center. Transaction-to-case ratios have increased by 46 percent, from
172 transactions per case in FY 2019 to 251 transactions per case in FY 2023.
In FY 2022 and FY 2023, the National Practitioner Data Bank conducted several
efforts to engage and educate stakeholders, including the following:
o Hosting 6 webinars for more than 11,000 attendees to provide an overview
of National Practitioner Data Bank reporting and querying requirements and
best practices.
o Developing and deploying 3 micro-training videos offering technical
assistance on National Practitioner Data Bank reporting and querying.
These videos have been viewed more than 10,000 times.
Additionally, the National Practitioner Data Bank launched a phased deployment of
multifactor authentication to enhance the security of the system and users.
172
173.
Outputs and Outcomes TableMeasure
2210.01: Number of
practitioners enrolled
by health care entities
in the National
Practitioner Data
Bank’s Continuous
Query subscription
service
2210.02: Number of
disclosures of
National Practitioner
Data Bank reports to
health care
organizations
Year and Most
Recent Result /
Target for Recent
Result /
(Summary of Result)
FY 2023: 6,389,567
FY 2024
Target
6,600,000
FY 2025
Target
6,800,000
FY 2025
Target
+/- FY 2024
Target
+200,000
2,130,000
2,230,000
+100,000
Target: 6,000,000
(Target Exceeded)
FY 2023: 2,202,959
Target: 2,130,000
(Target Exceeded)
Performance Narrative
The National Practitioner Data Bank has seen a rate of steady and significant continuous query48
growth that will begin to slow in the coming years, although overall growth will continue. By
encouraging the use of continuous query as an alternative to one-time query, queriers receive
report notifications an average of 10 months sooner, increasing the likelihood that health care
entities are informed when making important hiring, licensing, and credentialing decisions.
The measure of disclosures is important in measuring the effectiveness of the National
Practitioner Data Bank program, as it reflects that the Data Banks is being used to put critical
information about health care practitioners, providers, and suppliers into the hands of those
making important hiring, licensing, and credentialing decisions regarding the nation’s health care
workforce.
48
There are two types of query services available through the National Practitioner Data Bank website: continuous
query and one-time query. Continuous query on enrolled practitioners meets legal and accreditation requirements for
querying the National Practitioner Data Bank and allows organizations to receive a query response and all new or
updated report notifications during the year-long enrollment for each practitioner. Continuous query is only for
querying on practitioners, not health care organizations.
173
174.
Pediatric Specialty Loan Repayment ProgramBA
FTE
FY 2023
Final
$10,000,000
---
FY 2024
Continuing
Resolution
$10,000,000
---
FY 2025
President’s
Budget
$10,000,000
---
FY 2025
+/FY 2023
-----
Authorizing Legislation: Public Health Service Act, Section 775(e) as amended by the CARES
Act, Section 3401, Public Law 116-136.
FY 2025 Authorization (discretionary): Authorized for FY 2025 (and each subsequent year),
based on previous year’s funding, subject to adjustment formula.
Allocation Method ............................................. Other (Competitive Award to Individuals)
Program Description
In FY 2023, HRSA launched the Pediatric Specialty Loan Repayment Program to support the
pediatric health care workforce. The Consolidated Appropriations Act, 2023, provided $10
million for this program. This funding has enabled HRSA to expand the range of providers
eligible for loan repayment awards to include child and adolescent behavioral health providers,
including substance use disorder prevention and treatment service providers, as well as pediatric
subspecialists and/or physicians participating in an accredited pediatric medical subspecialty,
pediatric surgical specialty, or a child and adolescent mental health subspecialty that involves
work in a Health Professional Shortage Area (HPSA), in a Medically Underserved Area (MUA),
or serving a Medically Underserved Population (MUP).
The Pediatric Specialty Loan Repayment Program provides up to $100,000 to eligible health
professionals in exchange for a three-year, full-time service commitment. The program will
continue to expand the eligible pool of pediatric subspecialties and add to the list of eligible
facilities serving populations located in either a HPSA, MUA, or MUP.
Eligible Entities: Clinicians who provide patient care as pediatric medical subspecialists;
pediatric surgical specialists; providers of child and adolescent mental and behavioral health
services, including substance use disorder prevention and treatment. Participants must be
engaged in an accredited eligible residency or fellowship, or full-time employment, in or for a
Pediatric Specialty Loan Repayment Program-approved site serving a HPSA, MUA, or MUP.
Budget Request
The FY 2025 Budget Request for the Pediatric Specialty Loan Repayment Program of $10
million is equal to the FY 2023 Final level. The request will support approximately 100 new
awards to bolster the pediatric health care workforce by providing loan repayment to pediatric
medical specialists, pediatric surgical specialists, and child and adolescent mental and behavioral
health care providers. In FY 2025, the Pediatric Specialty Loan Repayment Program will
174
175.
continue to support an expanded eligible pool of pediatric subspecialties and broader list ofeligible facilities to serve populations located in a HPSA, MUA or an MUP, complementing
other HRSA loan repayment programs, including the those administered through the National
Health Service Corps.
The funding request also includes costs associated with the award process, follow-up
performance reviews, information technology, and other program support costs.
To further support the Pediatric Specialty Loan Repayment Program, the FY 2025 Budget
Request also includes a legislative proposal to extend the tax-exempt status that is provided to
the National Health Service Corps Program recipients to HRSA’s similar health care workforce
loan repayment programs. If HRSA is not required to pay employer taxes on the award, more
funds would be available for HRSA to make additional or higher awards through these programs.
Funding History
FY
FY 2021
FY 2022
FY 2023
FY 2024 CR
FY 2025 President’s Budget
Amount
--$5,000,000
$10,000,000
$10,000,000
$10,000,000
Program Accomplishments
HRSA launched the program to support the pediatric health care workforce, and with dedicated
appropriations in FY 2022 and FY 2023, funded 121 new awards in the program’s inaugural
application and award cycle in FY 2023.
Three-quarters of the new awardees who make up the Pediatric Specialty Loan Repayment
Program’s field strength as of September 30, 2023, are specialists not eligible for other loan
repayment programs such as those offered by the National Health Service Corps. These awardees
include pediatric medical, surgery, and mental and behavioral health specialists, including
specialists in substance abuse prevention and treatment.
In FY 2024, HRSA will fund approximately 100 new Pediatric Specialty Loan Repayment
Program awards.
175
176.
Awards TableFY 2024
Continuing
Resolution
FY 2023
Final
Number of Awards
FY 2025
President’s Budget
121
100
100
Average Award
$98,934
$100,000
$100,000
Range of Awards
$6,550 - $107,650
$7,000 - $110,00049
$7,000-$110,00050
49
Range of award estimates made prior to the availability of actual fiscal year award data are based on FY 2023
data.
50
Range of award estimates made prior to the availability of actual fiscal year award data are based on FY 2023
data.
176
177.
Health Care Workforce Innovation ProgramFY 2024
Continuing
Resolution
FY 2023
Final
BA
FTE
-----
-----
FY 2025
President’s
Budget
$10,00,000
2
FY 2025
+/FY 2023
+$10,000,000
+2
Authorizing Legislation: Public Health Service Act, Section 741 and Section 807, as amended by
Public Law 116-136.
Allocation Method……………………………………………………Competitive Grant
Program Description
The Health Care Workforce Innovation Program will jumpstart new, leading-edge education and
training models to expand the supply of health care professionals in underserved and rural areas
where they are urgently needed. This new effort will seed innovative strategies to grow a more
modern, robust, and responsive health care workforce at a time of significant concern about
workforce shortages across physicians, nursing, behavioral health, and other essential disciplines.
This competitive grant program will fund new approaches to combat systemic barriers to
educational opportunities while advancing innovative solutions to increase matriculation in and
graduation from health professions training programs, as well as the number of individuals who
choose to provide clinical care upon graduation. Training should better align with the type of
health care that Americans hope to receive – high quality, comprehensive, convenient, and
compassionate. Examples of innovative models and approaches may include the following:
Developing new health professions admission models to better reflect and meet
community health needs;
Revamping health professions pre-admission readiness programs to better serve
students from rural, underserved, or disadvantaged backgrounds;
Building training and employment models that better integrate clinical practitioners
into faculty development programs;
Building a training-to-practice model for behavioral health professionals; and
Expanding career pathways by creating career ladders for paraprofessionals.
Innovative, community-driven approaches to health professions education are needed today more
than ever. The National Center for Health Workforce Analysis has identified current projected
shortages through 2036 in a wide range of health care occupations. In addition, the Surgeon
General has identified health worker burnout as a major concern that will require multi-faceted
solutions, including how workers are prepared and trained to practice. Many training curricula
and models for training health professionals, particularly in medicine, remain unchanged from
decades ago; they do not fully leverage the technology available today.
177
178.
Budget RequestThe FY 2025 Budget Request for the Health Care Workforce Innovation Program of $10 million
is $10 million above the FY 2023 Final level. This request will support awards to organizations
that will use innovative approaches to recruit and grow the health care workforce and deliver a
more modern, robust, and diverse workforce pipeline. The funding request also includes costs
associated with the grant review and award process, follow-up performance reviews, and
information technology and other program support costs.
Funding History
FY
FY 2021
FY 2022
FY 2023
FY 2024 CR
FY 2025 President’s
Budget
Amount
--------$10,000,000
Grant Awards Table
FY 2023
Final
FY 2024
Continuing
Resolution
FY 2025
President’s Budget
Number of Awards
---
---
5
Average Award
---
---
$2,000,000
Range of Awards
---
---
$1,800,00-$2,200,000
178
179.
Health Workforce Cross-Cutting Performance MeasuresDuring Academic Year (AY) 2022-2023, the Bureau of Health Workforce (BHW) tracked six
cross-cutting measures for over 40 health professions programs. The cross-cutting measures
highlight training and employment in underserved areas, and clinical training through
interprofessional care teams and in community-based settings.
Training and Employment in Underserved Areas
51 percent of students and health care professionals trained in underserved communities.
63 percent of BHW graduates and alumni were employed in underserved areas at program
completion.
43 percent of graduates and alumni who completed their BHW program in AY 2021-2022
were employed in underserved areas one year later.
Clinical Training through Interprofessional Care Teams and in Community-Based Settings
83 percent of clinical training sites provided interprofessional training.
26 percent of clinical training sites were in community-based settings (e.g., Federally
Qualified Health Centers, Rural Health Clinics). Health care delivery sites in communitybased settings are vital sources of primary care in medically underserved areas.
Outputs and Outcomes Table
Measure
2000.02 Percentage of
trainees in Bureau of Health
Workforce-supported health
professions training
programs who receive
training in medically
underserved communities.
(Outcome)
Year and Most
Recent Result /
Target for Recent
Result /
(Summary of Result)
FY 2022: 51%
Target: 55%
(Target Not Met)
179
FY 2024
Target
52%
FY 2025
Target
51%
FY 2025
Target +/FY 2024
Target
-1 percentage
point
180.
Measure2000.03 Percentage of
individuals supported by the
Bureau of Health Workforce
who completed a primary
care training program and
are currently employed in
underserved areas.
(Outcome)
2000.04 Percentage of
clinical training sites that
provide interprofessional
training to individuals
enrolled in a primary care
training program.
(Outcome)
2000.05 Percentage of
clinical training sites
utilized in health workforce
training programs that are
located in community-based
settings. (Outcome)
2000.06 Percentage of
graduates and alumni of
Bureau of Health Workforce
programs employed in
underserved areas at
graduation. (Outcome)
Year and Most
Recent Result /
Target for Recent
Result /
(Summary of Result)
FY 2022: 43%
FY 2025
Target +/FY 2024
Target
Maintain
FY 2024
Target
40%
FY 2025
Target
40%
68%
70%
+2
percentage
points
25%
25%
Maintain
59%
60%
+1
percentage
point
Target: 40%
(Target Exceeded)
FY 2022: 83%
Target: 55%
(Target Exceeded)
FY 2022: 26%
Target: Not Defined
(Historical Actual)
FY 2022: 63%
Target: Not Defined
(Historical Actual)
Performance Narrative
Most recent results are for activities in Academic Year (AY) 2022-2023 funded in FY 2022.
Measure 2000.02 did not meet its FY 2022 target even though many individual programs do
exceed the target. This measure is also impacted by grant programs that are in their startup or
closeout years and ramping up or winding down activities. HRSA is increasing its emphasis in
this area and expects the measure to recover after previous declines due to the COVID-19
pandemic. Measure 2000.03 is based on service location data for students who graduated from or
completed their program in Academic Year 2021-2022 and reported follow-up employment data
one year later in Academic Year 2022-2023. Because measures in this section are based on
performance of 40+ grant programs, targets were based upon a review of the past two to three
years' worth of data.
180
181.
MATERNAL ANDCHILD HEALTH
TAB
181
182.
MATERNAL AND CHILD HEALTHMaternal and Child Health Block Grant
FY 2023 Final
BA
FTE
$816,200,000
69
FY 2024
Continuing
Resolution
FY 2025
President’s
Budget
$815,700,000
69
$831,714,000
73
FY 2025 +/- FY
2023
+$15,514,000
+4
Authorizing Legislation: Social Security Act, Title V, as amended by Public Law 106-554,
Section 921
FY 2025 Authorization ............................................................................................... $850,000,000
Allocation Methods:
• Direct federal/intramural
• Contract
• Formula grant/co-operative agreement
• Competitive grant/co-operative agreement
Program Description
The Maternal and Child Health (MCH) Block Grant program, authorized under Title V of the
Social Security Act, seeks to improve the health of mothers, children, and their families. The
activities authorized as part of the MCH Block Grant program include the State MCH Block
Grant program, Special Projects of Regional and National Significance (SPRANS), and
Community Integrated Service Systems (CISS) grants.
The MCH Block Grant program funding, combined with state investments, improves access to
quality health care services for mothers, children, and their families in all 50 states, the District
of Columbia, and other jurisdictions. The MCH Block Grant program enables each state to:
• Assure access to quality maternal and child health care services for mothers and children,
especially those with low incomes or limited availability of care;
• Reduce infant mortality;
• Provide access to prenatal, delivery, and postnatal care to women, especially pregnant
women who are low income and at-risk for adverse maternal health outcomes;
• Increase regular screenings and follow-up diagnostic and treatment services for children
who are low income;
• Provide access to preventive and primary care services for children who are low income
and rehabilitative services for children with special health needs;
• Implement family-centered, coordinated health and social services and supports for
children with special health care needs; and
182
183.
Set up toll-free hotlines and assistance for parents with infants and children, including
those eligible for Medicaid, for accessing information on health care services and
providers.
State MCH Block Grant Program
The Title V State MCH Block Grant Program, a partnership between the federal government and
states, awards formula grants to 59 states and jurisdictions to address the health needs of
mothers, infants, and children, as well as children with special health care needs in their state or
jurisdiction. Over 60 million pregnant women, infants, and children, including children with
special health care needs, benefitted from a service supported by the State MCH Block Grant
program in FY 2022. Nationwide, the 59 State MCH Block Grant programs reached
approximately 93 percent of pregnant women and 63 percent of children. Infants are included
within the percent of children reached, and when looked at separately, 99 percent of infants were
reached. The MCH Block Grant Program gives states flexibility in meeting their unique health
needs, while HRSA assures accountability and impact through performance measurement and
technical assistance. Additionally, HRSA continues to implement efforts to reduce administrative
burden, and improve accountability.
HRSA distributes funding based on a statutory funding formula tied to a state’s level of child
poverty compared to the overall level of child poverty in the United States. Federal funds,
combined with required state matching investments, support activities that address an individual
state’s MCH needs. The program reports progress annually, and HRSA provides technical
assistance on request to assist states in improving performance. A comprehensive needs
assessment is required by law every five years to determine each state’s highest MCH priorities.
States use State MCH Block Grant funding to support infant screening and other preventive
services, address gaps in coverage and services for both insured and uninsured mothers and
children, and to support quality improvement initiatives, workforce training, outreach, and
disease prevention and health promotion.
HRSA also provides technical assistance to states in addressing their MCH priority needs, as
well as performance and programmatic requirements of the MCH Block Grant program. HRSA
makes state-reported financial, program, performance, and health indicator data available to the
public through the Title V Information System.51
Special Projects of Regional and National Significance (SPRANS)
SPRANS grants address national or regional needs, priorities, or emerging issues, and
demonstrate methods for improving care and outcomes for mothers and children.
As in prior years, in FY 2023, Congress directed a portion of funds to address priority issues,
such as maternal mortality and morbidity, early childhood development, and regional pediatric
pandemic preparedness efforts. Additionally, the FY 2023 appropriation set aside funds to
address four specific priorities: oral health, epilepsy, sickle cell disease, and fetal alcohol
syndrome. The remainder supports additional activities authorized by statute. SPRANS awards
51
Title V Information System (TVIS). https://mchb.tvisdata.hrsa.gov/
183
184.
drive innovation, help improve systems of care for MCH populations, and enable efforts toaddress emerging issues.
Critical and Emerging Issues in Maternal and Child Health
• Maternal Mortality – SPRANS funding is integral to promoting maternal health and
reducing maternal mortality and morbidity. In FY 2023, HRSA continued support for the
State Maternal Health Innovation (State MHI) Program, which supports state-specific
actions and innovations that address disparities in maternal health and improve maternal
health outcomes. For example, Montana is addressing maternal health disparities by
providing mobile medical simulation training to reduce medical errors, improve patient
outcomes and increase medical team performance. The program has trained over 150
providers at 18 participating critical access hospitals in Eastern Montana, helping to
prepare providers for rare labor events in rural and frontier parts of the state.
• Children’s Mental Health – SPRANS funding supports the mental health of children and
youth in communities across the country through the Children’s Safety Network (CSN).
CSN works with states and jurisdictions to strengthen their capacity to use data to
identify and implement effective strategies to reduce fatal and serious injuries among
children and youth, including suicide. The CSN is launching a new Child Safety Learning
Collaborative for state and jurisdiction Title V agencies that will begin in fall of 2023.
• Supporting the Maternal and Child Health (MCH) Workforce – SPRANS funding
plays a vital role in enhancing and expanding the MCH workforce in communities across
the country. The National MCH Workforce Development Center, for example, partners
with states and jurisdictions tackle complex challenges through training, collaborative
learning, coaching, and consultation. The Center has helped address challenges such as
helping states develop connected and coordinated care for children and youth with special
health care needs (CYSHCN) and creating models of multi-stakeholder collaboration to
support perinatal women with SUD.
Community Integrated Service Systems (CISS)
CISS grants help states and communities build a comprehensive, integrated system of care to
improve access and outcomes for all children, including children with special health care needs.
For example, CISS funding supports the Early Childhood Comprehensive Systems (ECCS)
program, which helps states improve access to and quality of preventive health and support
services for people who are pregnant or have young children. Through ECCS, 20 states are
engaging more family representatives as leaders in designing better health systems, connecting
services across health, social services, and other sectors, and planning specific improvements to
state, local and/or program policies and practices that ensure children from all backgrounds are
thriving at age three and school-ready by age five.
Budget Request
The FY 2025 Budget Request for the MCH Block Grant program of $831.7 million is $15.5
million above the FY 2023 Final level. The request includes $593.3 million for formula awards
to states to promote and improve the health and well-being of the nation’s mothers, children
184
185.
(including CYSHCN), and their families. Additionally, the request includes $228.1 million inSPRANS to continue to address critical and emerging issues in maternal and child health.
Within SPRANS, the FY 2025 Budget Request includes an additional $16.0 million, for a total
of $81.0 million, to support HRSA’s efforts to improve maternal health with a specific focus on
areas with high rates of adverse maternal health outcomes or with disparities in maternal health
outcomes:
Doula Workforce: $5.0 million to support a doula workforce initiative to provide grants
for up to 7 community-based organizations (CBOs) to develop and/or expand programs
to recruit doula candidates (health workers who provide support before, during and after
childbirth), support their training/certification, and then employ them as doulas to support
improved birth outcomes in the community. HRSA will also provide technical support
and expertise in furthering community-based doula services and maternal and child
health to advance the training and development of a doula workforce.
• State Maternal Health Innovation Awards: An additional $6.0 million, for a total of $61.0
million, to continue to expand the program. This program provides funding for awardees
to launch new maternal health service delivery activities, including data-driven
innovations and direct clinical care.
• Addressing Emerging Issues and Social Determinants of Maternal Health: $5.0 million to
provide support for community-based organizations to conduct innovative pilot projects
to reduce maternal mortality and adverse maternal health outcomes, particularly in areas
with significant disparities in maternal health outcomes.
• Funding for Minority-Serving Institutions: $10 million to continue funding a multiinstitutional research network to support minority-serving institutions to study health
disparities in maternal health outcomes and identify community-based solutions to
address those disparities, including a component to create and disseminate curricula to
train health professionals on the impact of climate change on maternal health.
The funding request also includes costs associated with the grant review and award process,
follow-up performance reviews, collection and reporting of performance and outcome measure
data to include the National Survey on Children's Health, and information technology and other
program support costs.
Table 1. MCH Block Grant Activities ($ in thousands)
MCH Activities
FY 2024
Continuing
Resolution
FY 2023
Final
FY 2025
President’s Budget
State MCH Block Grant
Awards
$593,808
$593,308
$593,308
SPRANS
$212,116
$212,116
$228,130
CISS
$10,276
$10,276
$10,276
Total
$816,200
$815,700
$831,714
185
186.
Table 2. MCH Block Grant SPRANS Set-Aside Grants ($ in thousands)MCH SPRANS Set-Aside
Programs
SPRANS – Other
FY 2024
Continuing
Resolution
FY 2023
Final
FY 2025
President’s Budget
$195,224
$195,224
$211,238
SPRANS - Oral Health
$5,250
$5,250
$5,250
SPRANS – Epilepsy
$3,642
$3,642
$3,642
SPRANS - Sickle Cell
$7,000
$7,000
$7,000
SPRANS - Fetal Alcohol
Syndrome Demo
$1,0003
$1,000
$1,000
Total SPRANS
$212,116
$212,116
$228,130
Funding History
FY
FY 2021
FY 2022
FY 2023
FY 2024 CR
FY 2025 President’s Budget
Amount
$698,545,000
$733,003,00052
$816,200,00053
$815,700,000
$831,714,000
Program Accomplishments
As a longstanding source of funding for MCH populations, the State MCH Block Grant supports
a wide range of services for millions of women and children, including low-income children and
children with special health care needs. Program achievements include:
• Access to health services for mothers has improved with the support of the State MCH
Block Grant program. Seventy-seven percent of women received early prenatal care in
the first trimester of pregnancy in 2022. Recognizing the importance of improving
women’s health before pregnancy, 47 states and jurisdictions are now working to
improve access to preventive and primary care for all women of childbearing age.
• The infant mortality rate is a widely used indicator of the nation’s health. The State MCH
Block Grant program has played a lead role in the 25 percent decline in U.S. infant
mortality from 7.2 infant deaths per 1,000 live births in 1997 to 5.4 infant deaths per
1,000 live births in 2021.
52
Retroactively adjusted to reflect shift in funding from SPRANS for Innovation for Maternal Health, Integrated
Services for Pregnant and Postpartum Women, and the Maternal Mental Health Hotline to their own budget lines
due to newly passed stand-alone authorities.
53
Reflects a shift in funding from SPRANS for the Maternal Mental Health Hotline to its own budget line due to a
stand-alone authority for the Hotline.
186
187.
States are also working to reduce maternal mortality, which has risen over the past two
decades. All states use MCH Block Grant funds for women and maternal health activities
such as promoting well-woman visits, increasing access to prenatal care, supporting
Maternal Mortality Review Committees (MMRCs), and enhancing systems of care for
maternal mental health.
States are addressing behavioral and mental health needs of the MCH population. For
example, Connecticut’s Title V program supported a 1 Word 1 Voice 1 Life campaign to
educate Connecticut residents on how to recognize the warning signs of suicide, how to
find the words to have a direct conversation with someone in crisis, and where to find
professional help and resources. In addition, Kansas’s Title V program added behavioral
health screening tools to their data collection system to increase the availability of
evidence-based screenings to local MCH agencies in the state, and provides supporting
resources to assist local providers with conducting these screenings.
State Title V programs work with partners and Title V funding is a key resource to
support newborn screening throughout the nation to ensure every newborn receives a
screening as well as the appropriate follow-up services, care, and intervention. Title V
assures that referrals to providers take place for those infants that were screened that are
confirmed positive for a metabolic or genetic condition. In 2022, 98% of all infants
received at least one newborn screening.
Select National Outcome and National Performance Measures in effect from 1997 to 2022
illustrate the program’s successes:
National Outcome or Performance
Measures
Infant mortality rate per 1,000 live births
Neonatal mortality rate per 1,000 live births
Postneonatal mortality rate per 1,000 live
births
Perinatal mortality rate per 1,000 live births
plus fetal deaths
Child mortality rate, ages 1 through 9 per
100,000 children
Percent of children who have completed the
combined 7-vaccine (includes Measles,
Mumps, Rubella, Polio, Diphtheria, Tetanus,
Pertussis, Haemophilus Influenza, and
Hepatitis B) series by age 24 months54
Percent Change
(1997 – 2022
unless otherwise
noted)
25% decrease
27% decrease
24% decrease
Data Source
National Vital Statistics
System (NVSS)
NVSS
NVSS
25% decrease
(1997-2021)
32% decrease
NVSS
5% increase
(2011-2018)
National Immunization
Survey (NIS)
54
NVSS
Childhood vaccination measure definition has been updated to align with CDC reporting of vaccination rates by
birth year cohort.
187
188.
National Outcome or PerformanceMeasures
Percentage of children without health
insurance
Percent of infants breastfed exclusively
through 6 months of age
Percent of infants born to pregnant women
receiving prenatal care beginning in the first
trimester
Percent Change
(1997 – 2022
unless otherwise
noted)
70% decrease
Data Source
National Health Interview
Survey (NHIS)
NIS
84% increase
(2007-2020)
8% increase
(2007-2022)
NVSS
Outputs and Outcomes Table
Measure
3010.01: The
percentage of children
served by the Maternal
and Child Health Block
Grant (Outcome)
3010.02: The
percentage of pregnant
women served by the
Maternal and Child
Health Block Grant
(Outcome)
3010.03: Decrease the
ratio of the Black infant
mortality rate to the
White infant mortality
rate (Output)
3010.04: Reduce the
infant mortality rate
(Outcome)
Year and
FY 2024
Most Recent
Target
Result /Target
for Recent
Result
(Summary of
Result)
FY 2022: 63% 63%
Target: 63%
(Target Met)
FY 2025
Target
FY 2025
+/FY 2024
64%
+1 percentage
point
FY 2022: 93% 93%
Target: 93%
(Target Met)
93%
Maintain
FY 2021: 2.4
to 1
Target: 2 to 1
(Target Not
Met)
FY 2021: 5.4
per 1,000
Target: 5.5 per
1,000
(Target Met)
2 to 1
2 to 1
Maintain
5.3 per 1,000
5.3 per 1,000
Maintain
188
189.
Measure3010.05: Reduce the
incidence of low birth
weight births
(Outcome)
3010.06: Increase
percentage of pregnant
women who received
prenatal care in the first
trimester (Outcome)
3110.10: Percentage of
women who attended a
postpartum checkup up
to 12 weeks after
giving birth
Year and
FY 2024
Most Recent
Target
Result /Target
for Recent
Result
(Summary of
Result)
FY 2022: 8.6% 8%
Target: 8%
(Target Not
Met)
FY 2022
80%
77.0%
Target: 80%
(Target Not
Met)
FY 2021:
91.9%
90.8%
Target: N/A
(Historical
Actual)
FY 2025
Target
FY 2025
+/FY 2024
8%
Maintain
Discontinued
N/A
92.6%
+0.7
percentage
point
Performance Narrative
• For measure 3010.01, the term “children” includes all infants and children 0-21 years of
age as well as CYSHCN. When looked at separately, 99 percent of infants and 50 percent
of CYSHCN 0 to 21 years of age were reached in FY 2022.
• For measure 3010.03, numerator data for infant deaths by race was taken from the
Centers for Disease Control and Prevention, National Center for Health Statistics’ CDC
WONDER Online Database for Underlying Cause of Death by Single-Race Categories
from 2018-2021 (https://wonder.cdc.gov/controller/saved/D158/D319F451).
• For measure 3010.03, denominator data for live births by race was taken from the Centers
for Disease Control and Prevention, National Center for Health Statistics’ CDC
WONDER Online Database for Natality public-use data 2007-2021
(https://wonder.cdc.gov/controller/saved/D66/D268F641).
• For measure 3010.05, MCHB is proposing to maintain the previous target for FY 2025
because the target has not been met. This is in line with the established target setting
method for this measure.
• MCHB is proposing a new measure for FY 2025 that aligns with the new Universal
National Performance Measure and is also an important addition to MCHB's portfolio as
a postpartum measure. Currently, the Pregnancy Risk Assessment Monitoring System
(PRAMS) captures postpartum check-ups within 4 to 6 weeks after giving birth. This will
be reported until the new data become available that will report on the new timeframe of
“up to 12 weeks.” This measure will replace measure 3010.06, which will be
discontinued.
189
190.
Grant Awards Table – Maternal and Child Health Block GrantFY 2024
Continuing
Resolution
FY 2023
Final
Number of Awards
Average Award
Range of Awards
FY 2025
President’s Budget
59
59
59
$9,775,818
$9,735,241
$9,735,241
$155,729-$41,906,430 $155,083-$41,141,757 $155,083-$40,729,660
Grant Awards Table – SPRANS
FY 2024
Continuing
Resolution
FY 2023
Final
Number of Awards
FY 2025
President’s Budget
316
320
341
Average Award
$605,267
$587,433
$596,252
Range of Awards
$27,562-$11,150,000
$32,236-$11,150,000
$32,236-$11,150,000
FY 2024
Continuing Resolution
FY 2025
President’s Budget
26
26
26
Average Award
$295,862
$296,353
$296,018
Range of Awards
$249,208-$700,000
$252,959-$700,000
$252,959-$700,000
Grant Awards Table – CISS
FY 2023
Final
Number of Awards
190
191.
DEPARTMENT OF HEALTH AND HUMAN SERVICESHealth Resources and Services Administration
FY 2025 Discretionary State/Formula Grants
CFDA NUMBER/PROGRAM NAME: 93.994/Maternal and Child Health Block Grant
STATE/TERRITORY
FY 2024
Continuing
Resolution
FY 2023 Final
FY 2025
President's
Budget
FY 2025 +/FY 2023
Alabama
Alaska
Arizona
Arkansas
California
12,060,270
1,169,840
8,057,500
7,376,761
41,906,430
12,021,521
1,154,059
7,883,984
7,395,081
41,141,757
12,072,723
1,159,172
7,706,771
7,387,031
40,729,660
12,453
-10,668
-350,729
10,270
-1,176,770
Colorado
Connecticut
Delaware
District of Columbia
Florida
7,620,800
4,969,761
2,126,787
7,014,114
21,691,453
7,627,798
4,982,499
2,123,786
7,009,375
21,476,976
7,629,029
4,978,819
2,095,757
6,987,899
21,442,031
8,229
9,058
-31,030
-26,215
-249,422
Georgia
Hawaii
Idaho
Illinois
Indiana
18,105,904
2,249,007
3,407,322
22,117,528
12,805,884
18,117,885
2,278,624
3,390,950
22,018,756
12,714,886
17,962,643
2,301,020
3,411,022
22,095,714
12,698,230
-143,261
52,013
3,700
-21,814
-107,654
Iowa
Kansas
Kentucky
Louisiana
Maine
6,750,301
5,008,331
11,722,692
13,320,243
3,356,471
6,775,678
4,979,710
11,745,133
13,292,035
3,379,052
6,775,166
4,987,014
11,768,942
13,320,304
3,366,599
24,865
-21,317
46,250
61
10,128
Maryland
Massachusetts
Michigan
Minnesota
Mississippi
12,243,942
11,480,471
19,735,627
9,477,092
9,738,802
12,377,616
11,455,660
19,632,540
9,456,394
9,765,962
12,464,214
11,482,218
19,670,661
9,479,033
9,782,461
220,272
1,747
-64,966
1,941
43,659
191
192.
FY 2023 Final12,834,718
2,366,470
4,122,683
2,435,643
2,020,741
FY 2024
Continuing
Resolution
12,742,556
2,370,296
4,108,001
2,470,858
2,013,420
FY 2025
President's
Budget
12,760,503
2,365,326
4,151,601
2,483,667
1,983,605
FY 2025 +/FY 2023
-74,215
-1,144
28,918
48,024
-37,136
New Jersey
New Mexico
New York
North Carolina
North Dakota
12,222,582
4,445,279
39,915,601
18,607,695
1,786,380
12,311,101
4,389,676
39,814,720
18,402,403
1,790,702
12,390,564
4,366,536
40,127,451
18,327,873
1,821,233
167,982
-78,743
211,850
-279,822
34,853
Ohio
Oklahoma
Oregon
Pennsylvania
Rhode Island
23,434,428
7,732,382
6,412,551
24,940,352
1,706,187
23,363,076
7,749,511
6,323,242
25,015,256
1,697,898
23,384,036
7,767,796
6,289,073
25,051,148
1,660,797
-50,392
35,414
-123,478
110,796
-45,390
South Carolina
South Dakota
Tennessee
Texas
Utah
12,125,016
2,279,765
12,664,123
38,954,671
6,313,258
12,067,472
2,273,223
12,546,579
38,866,502
6,242,538
12,031,675
2,281,244
12,419,841
39,000,985
6,241,912
-93,341
1,479
-244,282
46,314
-71,346
Vermont
Virginia
Washington
West Virginia
Wisconsin
Wyoming
1,674,448
13,061,969
9,291,061
6,367,323
11,240,191
1,257,930
1,661,083
13,041,712
9,190,025
6,299,105
11,213,448
1,257,992
1,664,181
13,079,474
9,202,741
6,333,568
11,213,592
1,265,557
555,726,780
553,420,112
553,420,112
-10,267
17,505
-88,320
-33,755
-26,599
7,627
-2,306,668
519,096
801,715
242,243
516,941
798,388
241,238
516,941
798,388
241,238
-2,155
-3,327
-1,005
STATE/TERRITORY
Missouri
Montana
Nebraska
Nevada
New Hampshire
Subtotal
American Samoa
Guam
Marshall Islands
192
193.
STATE/TERRITORYFY 2023 Final
Micronesia
Northern Mariana Islands
Palau
Puerto Rico
Virgin Islands
Subtotal
TOTAL RESOURCES
547,935
490,258
155,729
16,714,888
1,574,592
21,046,456
576,773,236
FY 2024
Continuing
Resolution
545,661
488,223
155,083
16,645,510
1,568,056
20,959,100
574,379,212
193
FY 2025
President's
Budget
545,661
488,223
155,083
16,645,510
1,568,056
20,959,100
574,379,212
FY 2025 +/FY 2023
-2,274
-2,035
-646
-69,378
-6,536
-87,356
-2,394,024
194.
Innovation for Maternal HealthFY 2024
Continuing
Resolution
FY 2023
Final
FY 2025
President’s
Budget
FY 2025
+/FY 2023
BA
$15,300,000
$15,300,000
$30,300,000
+$15,000,000
FTE
4
4
6
+2
Authorizing Legislation: Section 330O of the Public Health Service Act, as added by Public
Law 117-103
FY 2025 Authorization ....................................................................................................$9,000,000
Allocation Methods:
• Contract
• Competitive grant/co-operative agreement
Program Description
The Alliance for Innovation on Maternal Health (AIM) program supports the identification,
development, and dissemination of best practices to improve maternal health care quality and
outcomes, improve maternal and infant health, and eliminate preventable maternal mortality and
severe maternal morbidity. The program promotes safety and quality of care during pregnancy,
delivery, and in the postpartum period. It works to reduce disparities in health outcomes through
the development and implementation of patient safety bundles, which are collections of best
practices for birthing facilities to use on topics related to causes of maternal mortality and
morbidity. The bundle elements are actionable steps that are implemented through rapid quality
improvement cycles; they can be adapted to a variety of birth settings.
As of December 2023, AIM offers eight patient safety bundles. AIM state enrollees can choose
which bundle(s) to implement, according to their needs and priorities. These bundles address the
following topics:
• Obstetric Hemorrhage
• Severe Hypertension in Pregnancy
• Safe Reduction of Primary Cesarean Birth
• Cardiac Conditions in Obstetric Care
• Care for Pregnant and Postpartum People with Substance Use Disorder
• Postpartum Discharge Transition
• Sepsis in Obstetrical Care
• Perinatal Mental Health Conditions
The program supports AIM Capacity grants for states to increase the number of participating
birthing facilities and the overall number of patient safety bundles implemented and sustained. In
194
195.
addition, these grants build data capacity for participating entities to track quality improvementcycles for bundle implementation and support improvement of data collection.
Through the AIM Technical Assistance Center award, HRSA continues to support technical
assistance for implementation of the AIM program’s patient safety bundles within birthing
facilities in states, the District of Columbia, territories, and tribal entities, and dissemination of
these bundles to a broader array of providers, health care settings, and organizations within
communities across the United States. As of August 2023, 49 states and the District of Columbia
are enrolled in AIM, with participation from 1,996 birthing facilities.
Budget Request
The FY 2025 Budget Request for the Alliance for Innovation on Maternal Health (AIM) program
of $30.3 million is $15.0 million higher than the FY 2023 Final level.
This request continues support for existing AIM Capacity grants and Technical Assistance
Center activities. The request also includes $15.0 million to strengthen the obstetric safety-net by
helping health care settings such as hospital emergency departments effectively recognize and
respond to obstetric emergencies. This proposal is a cost-effective, evidence-informed, and
collaborative strategy for directly addressing the worsening maternal health crisis in the United
States. Many pregnant women do not reside near a hospital with obstetric services. A 2022 report
from the March of Dimes on maternity care in the U.S. noted that more than 2.2 million women
of childbearing age live in “maternity care deserts”, defined as counties with no hospitals or birth
centers offering obstetric care and no obstetric providers. When a pregnant or postpartum woman
experiences an emergency and needs to be seen right away, she is often seen at the closest
hospital available. A growing number of hospitals do not provide obstetric services, including
many rural hospitals, so preparing emergency departments to recognize, triage and stabilize
women in labor or with pregnancy-related emergencies will help to improve the quality of
maternity care in these settings, making pregnancy and birthing safer for both mom and baby.
This is a critical step toward addressing the current maternal health crisis and improving
maternal health outcomes nationwide. With the proposed funding, the AIM program will be able
to provide an estimated 75 awards to support clinical care teams in more health care settings that
do not offer obstetric care.
Funding will support:
Training (Obstetric Emergency Readiness drills and simulation training, ultrasound
training, and life support training for maternal/infant populations);
Equipment for non-obstetric facilities (ultrasounds, maternal/fetal medicine monitoring
equipment);
Targeted support, best practices, and resources for non-obstetric, lower resourced, and
rural facilities to help with recognition and response to obstetric emergencies in nonobstetrical care settings, and in facilities with limited access to specialty care providers;
and
195
196.
Activities to build relationships with specialists for telemedicine consults, develop
transport protocols, and EMS training and protocols for transfer.
The funding request additionally includes costs associated with the grant review and award
process, follow-up performance reviews, information technology, and other program support
costs.
Funding History
FY
FY 2021
FY 2022
FY 2023
FY 2024 CR
FY 2025 President’s Budget
Amount
$9,000,000
$11,775,000
$15,300,000
$15,300,000
$30,300,000
Program Accomplishments
Sample accomplishments from states showing improvements from implementation of the AIM
safety bundles include:
Louisiana: The Louisiana Perinatal Quality Collaborative (LaPQC) began implementing
AIM’s Obstetric Hemorrhage patient safety bundle in August of 2018, eventually
recruiting 43 of the state’s 49 birthing facilities. A regular standardized assessment of
patient blood loss is a key strategy for improving outcomes of patients with maternal
hemorrhage. Between August 2018 and January 2022, the percentage of facilities with
standard processes to measure patients’ blood loss from birth through the recovery period
increased from 28.6 percent to 93.4 percent. During the same time, the percentage of
facilities who established a standardized process to complete a hemorrhage risk
assessment at the time of admission for birth increased from 85.2 percent to 100 percent.
The LaPQC continues to work with participating AIM facilities to refine readiness and
response structures through the provision of support focused on drills, staff education and
competencies, and debriefs.
West Virginia: In 2020, the West Virginia Perinatal Partnership recruited all 21 birthing
facilities in the state to implement AIM’s Severe Hypertension in Pregnancy patient
safety bundle. This was in response to West Virginia’s 2017 rate of severe maternal
morbidity (SMM) among people with preeclampsia, excluding blood transfusions alone
of 7.6 percent. To support implementation, the West Virginia Perinatal Partnership
provided patient education materials to birthing facilities and implemented a home blood
pressure monitoring program to encourage early recognition of severe hypertension
during pregnancy and postpartum. Between Q4 2020 and Q1 2022, the percentage of
facilities that had established unit policies and procedures to respond to hypertensive
emergencies increased from 23.8 percent to 71.4. Additionally, the statewide rate of
SMM among people with preeclampsia was reduced by 28.9 percent. The West Virginia
196
197.
Perinatal Partnership continues to support facilities in the state by providing education to
rural Emergency Departments and facilitating opportunities for collaborative learning.
Florida: In 2020, the Florida Perinatal Quality Collaborative (FPQC) expanded the
number of birthing facilities implementing AIM’s Safe Reduction of Primary Cesarean
Birth patient safety bundle from 46 to 76 of the state’s 113 birthing facilities,
representing 80 percent of births in the state. From Q1 of 2017 – before bundle
implementation began - to Q3 of 2020, Florida’s statewide nulliparous, term, singleton,
vertex (NTSV) cesarean birth rate was reduced by 6 percent. Participating facilities will
continue to track and benchmark their NTSV cesarean birth rates with support from
FPQC.
Outputs and Outcomes Table
Measure
3020.01: Number of
participating
birthing facilities
implementing
Alliance for
Innovation on
Maternal Health
(AIM) patient safety
bundles (Output)
Year and Most
Recent Result
/Target for Recent
Result
(Summary of Result)
FY 2023: 1,996
Target: N/A
Historical Actual
FY 2024
Target
FY 2025
Target
FY 2025
+/FY 2024
N/A
2,028
N/A
Grant Awards Table
FY 2023 Final
Number of Awards
FY 2024
Continuing
Resolution
FY 2025 President’s
Budget
33
33
108
Average Award
$406,887
$406,887
$245,587
Range of Awards
$199,978$3,000,000
$199,978$3,000,000
$175,000$3,000,000
197
198.
Integrated Services for Pregnant and Postpartum WomenFY 2024
Continuing
Resolution
FY 2023
Final
FY 2025
President’s
Budget
FY 2025
+/FY 2023
BA
$10,000,000
$10,000,000
$10,000,000
---
FTE
---
---
---
---
Authorizing Legislation: Section 330P of the Public Health Service Act, as added by Public Law
117-103
FY 2025 Authorization ..................................................................................................$10,000,000
Allocation Methods:
• Competitive grant/co-operative agreement
Program Description
The Integrated Services for Pregnant and Postpartum Women program funds projects to foster
demonstration and development of models of care that coordinate appropriate services and
supports across care providers to ensure consideration of the whole person and their needs to
improve maternal health outcomes.
Core program components include:
• Coordinating prenatal and perinatal health care services among health care providers,
social services organizations/providers, state Medicaid programs, and state and local
health departments to improve maternal health outcomes;
• Developing and enhancing maternal health data infrastructure at the maternal health care
practice and population levels; and
• Assessing the viability of models that support integrated health services for pregnant and
postpartum women to ensure they bring about measurable improvements in maternal
health, especially those that can be replicated in the future.
Over three million births occur in the United States each year.55 Despite advances in medical
care and investments in improving access to care, rates of maternal mortality and severe maternal
morbidity (SMM) have not improved.56 Over 800 women die each year in the United States from
maternal causes57 and more than 25,000 women experience unexpected outcomes of labor or
delivery that have serious short- or long-term effects on their health and well-being (i.e.,
55
https://www.cdc.gov/nchs/data/nvsr/nvsr72/nvsr72-01.pdf
56 https://www.cdc.gov/reproductivehealth/maternalinfanthealth/severematernalmorbidity.html
57 https://www.cdc.gov/nchs/data/hestat/maternal-mortality/2020/E-stat-Maternal-Mortality-Rates-2022.pdf
198
199.
maternal morbidity).58 Maternal health disparities vary significantly by race, ethnicity,geography, and select indicators of socio-economic status.59,60
In FY 2023, HRSA funded five awards that aim to reduce adverse maternal health outcomes,
pregnancy-related deaths, and maternal health disparities by taking a whole-person approach to
care.
This program helps address the high rates of adverse maternal health outcomes by supporting
and testing innovative strategies for engaging and caring for patients, identifying the most
effective approaches to address their needs and circumstances, and accelerating progress toward
improving maternal health outcomes. This work is modeled on one such strategy, the Pregnancy
Medical Home (PMH) model, which organizes and coordinates the often-fragmented network of
social, behavioral, and health care services. PMH promotes evidence-based care management to
improve outcomes for people with Medicaid benefits. While early evaluations of PMH models
show some positive impact on birth outcomes,61 more evidence is needed to demonstrate and
determine its impact on maternal health, including the reduction of health disparities.
HRSA seeks to build the evidence for integrated models of care, such as PMH and other models,
through this program. The Integrated Services statute requires evaluation of the programs being
funded.
The program funds projects that foster use and demonstration of existing models like PMH that
integrate care and services, or develop, implement, and test new models in collaboration with
stakeholders, including:
• State, Tribal, and local agencies responsible for Medicaid, public health, social services,
mental health, and substance use disorder treatment and services;
• Health care providers that serve pregnant and postpartum women; and
• Community-based health organizations and health workers, including providers of home
visiting services and individuals representing communities with disproportionately high
rates of maternal mortality and severe maternal morbidity.
This program advances the goals of the White House Blueprint for Addressing the Maternal
Health Crisis.62
Budget Request
The FY 2025 Budget Request for the Integrated Services for Pregnant and Postpartum Women
program of $10.0 million is equal to the FY 2023 Final level. This request will continue projects
to foster the development and demonstration of innovative models that integrate care and
58https://mchb.tvisdata.hrsa.gov/Admin/FileUpload/DownloadContent?fileName=FadResourceDocument.pdf&isForDownload=F
alse
59 https://www.cdc.gov/reproductivehealth/maternal-mortality/pregnancy-mortality-surveillance-system.htm
60https://mchb.tvisdata.hrsa.gov/Admin/FileUpload/DownloadContent?fileName=FadResourceDocument.pdf&isForDownload=F
alse
61 https://www.commonwealthfund.org/publications/issue-briefs/2021/mar/community-models-improve-maternal-outcomesequity
62 https://www.whitehouse.gov/wp-content/uploads/2022/06/Maternal-Health-Blueprint.pdf
199
200.
services, such as the Pregnancy Medical Home (PMH) model, to reduce adverse maternal healthoutcomes, pregnancy-related deaths, and maternal health disparities. At this funding level,
HRSA anticipates continuing support for the 5 awards.
The funding request also includes costs associated with the cooperative agreement review and
award process, follow-up performance reviews, evaluation and technical assistance activities,
information technology, and other program support costs.
Funding History
FY
FY 2021
FY 2022
FY 2023
FY 2024 CR
FY 2025 President’s Budget
Amount
----$10,000,000
$10,000,000
$10,000,000
Program Accomplishments
The program was initially competed in FY 2023 and will complete its first full year of
implementation in FY 2024. Awardees are expected to launch projects within the first year of
funding and establish integrated health services model of care.
Grant Awards Table
FY 2024 Continuing
Resolution
FY 2025 President’s
Budget
5
5
5
Average Award
$1,778,192
$1,794,692
$1,787,229
Range of Awards
$1,715,550$1,800,000
$1,715,550$1,800,000
$1,715,550-$1,800,00
FY 2023 Final
Number of Awards
200
201.
Maternal Mental Health HotlineFY 2024
Continuing
Resolution
FY 2023
Final
FY 2025
President’s
Budget
FY 2025
+/FY 2023
BA
$7,000,000
$7,000,000
$7,000,000
---
FTE
---
---
---
---
Authorizing Legislation: Section 399V-7 of the Public Health Service Act, as added by Public
Law 117-328
FY 2025 Authorization ..................................................................................................$10,000,000
Allocation Method:
• Contract
• Grant
Program Description
The National Maternal Mental Health Hotline program supports a national hotline (1-833-TLCMAMA) that provides 24/7 free, confidential emotional support, resources, and referrals to
pregnant and postpartum women facing mental health challenges and their loved ones. The
hotline was first launched on Mother’s Day 2022. Professional counselors – including licensed
mental health clinicians and health care providers such as nurses or doctors, certified doulas or
childbirth educators, and certified peer support specialists – staff the hotline. They provide
support in English and Spanish via telephone and text, so people can get the help they need,
when they need it. Interpreter services are available in 60 additional languages, and a relay
service is available for people who are deaf or hard-of-hearing.
With the increase of $3 million in FY 2023 appropriations, HRSA increased resources to support
the operations and staffing of the hotline (e.g., technology, staff, training, and data management)
as capacity of the hotline increases. HRSA also used a portion of funds to promote widespread
national awareness and use of the hotline through public service announcements, a paid social
media campaign, presentations, conference exhibitions for maternal and child health care
providers, and offering free printed promotional materials.
Budget Request
The FY 2025 Budget Request for the Maternal Mental Health Hotline program of $7.0 million is
equal to the FY 2023 Final level. In FY 2025, HRSA will continue outreach to key target
audiences, including pregnant women, new parents and their family members, including those
specified in statute (i.e., underserved populations, individuals with disabilities, and family and
household members of pregnant or postpartum women at risk of experiencing maternal mental
health and substance use disorders) and their support networks.
201
202.
Requested funding will also support continued operation of the hotline and maintain staffingcapacity. The funding request also includes costs associated with the grant review and award
process, follow-up performance reviews, information technology, and other program support
costs.
Funding History
FY
FY 2021
FY 2022
FY 2023
FY 2024 CR
FY 2025 President’s Budget
Amount
$3,000,000
$4,000,000
$7,000,000
$7,000,000
$7,000,000
Program Accomplishments
HRSA launched the hotline in a phased manner during its first year of implementation, which
included partner outreach to more than 100 relevant provider associations, national
organizations, community groups, and federal partners to promote the hotline to their
constituents. HRSA developed a social media campaign, presentations, conference exhibitions,
and downloadable and printed promotional materials in English and Spanish to support hotline
promotion.
During its first 18 months of operation,63 the hotline’s professional counselors had nearly 23,500
conversations, of which about 70 percent were by phone and 30 percent were by text. The
average speed of answer for phone was less than 30 seconds and text was less than 20 seconds.
The top reasons individuals contacted the hotline included: feeling overwhelmed, anxiety,
depression, issues related to pregnancy, and relationship conflict. Most individuals contacting the
hotline were seeking help for themselves (76 percent), while 5 percent of individuals were
calling on behalf of someone else, like a family member or friend.
The hotline has received contacts from every state in the country.
63
May 2022-October 2023
202
203.
Autism and Other Developmental DisabilitiesFY 2024
Continuing
Resolution
FY 2023
Final
FY 2025
President’s
Budget
FY 2025
+/FY 2023
BA
$56,344,000
$56,344,000
$56,344,000
---
FTE
9
9
9
---
Authorizing Legislation: Section 399BB of the Public Health Service Act, as amended by Public
Law 116-60
FY 2025 Authorization ......................................................................................................... Expired
Allocation Methods:
• Direct federal/intramural
• Contract
• Competitive grant/co-operative agreement
• Other
Program Description
The Autism and Other Developmental Disabilities portfolio improves care and outcomes for
children, adolescents, and young adults with autism and other developmental disabilities. The
portfolio does this primarily by:
• Training health care professionals to screen, refer, and provide services for children with
autism and other developmental disabilities;
• Supporting autism research networks and programs; and
• Ensuring state health agencies implement best practices.
Through these efforts, the portfolio aims to increase access to early screening, diagnosis, and
treatment for children and youth with autism and other developmental disabilities and public
awareness of issues affecting the children and their families. In addition, the portfolio engages
individuals with autism and other developmental disabilities and their families in program design
and implementation, as well as efforts to address discrimination due to disability status.
Training Programs
The Autism and Other Developmental Disabilities portfolio includes training programs:
Leadership Education in Neurodevelopmental and Other Related Disabilities (LEND) and
Developmental-Behavioral Pediatrics (DBP).
• LEND supports interdisciplinary training for health care and other students and
professionals that addresses the needs of children and youth with autism and other
developmental disabilities. LEND also provides academic, clinical, leadership, and
community-oriented training opportunities.
• DBP prepares fellows in developmental-behavioral pediatrics for leadership roles as
teachers, researchers, and clinicians. It provides pediatric practitioners, residents, and
203
204.
medical students with the clinical expertise necessary to support children and youth withautism and other developmental disabilities.
Both LEND and DBP focus on training professionals to provide culturally and linguistically
relevant care and recruiting diverse students and professionals into their programs. Programs
include individuals with autism and other developmental disabilities and family members as
trainees and faculty. These participants enhance trainee understanding of lived experiences while
also increasing the leadership skills of self-advocates and family members.
Research Program
Research investments respond to questions raised in the HHS Interagency Autism Coordinating
Committee (IACC) Strategic Plan and focus on improving early identification of children with
autism and other developmental disabilities and advancing the effectiveness of interventions and
services for children with autism and other developmental disabilities. Examples of current
research projects include developing reliable screening tools to allow for earlier diagnosis,
implementing interventions to improve the health of individuals with autism and other
developmental disabilities across the life course, and addressing barriers to access to care.
Demonstration Program
In FY 2024, the Autism and Other Developmental Disabilities portfolio will implement a new
demonstration program to improve outcomes, including quality of life and well-being, for youth
with autism and/or epilepsy and their families/caregivers as the youth transition from child to
adult serving systems. This demonstration is called the National Transition Center for Autism
and Epilepsy (Transition Center).
Budget Request
The FY 2025 Budget Request for the Autism and Other Developmental Disabilities program of
$56.3 million is equal to FY 2023 Final level. This request continues support for the Autism and
Other Developmental Disabilities training, research, and the Transition Center programs. The
requested funding allows the Autism and Other Developmental Disabilities portfolio to continue
to serve approximately 137,000 children and supports the LEND, DBP, research, and Transition
Center programs to address unmet needs and disparities in evaluation, diagnosis, and treatment
of children and youth with autism and other developmental disabilities.
HRSA is requesting a 5-year extension of the authorization for the Autism and Other
Developmental Disabilities programs, which sunsets at the end of FY 2024. Extending the
authority will allow the Autism and Other Developmental Disabilities Program to continue to
address the screening, diagnostic, and intervention needs of increasing numbers of individuals
with autism and other developmental disabilities through its training and research activities.
Reauthorization is vital to improve health outcomes and reduce associated disparities of
individuals with autism and other developmental disabilities.
The funding request also includes costs associated with the grant review and award process,
follow-up performance reviews, information technology, and other program support costs.
204
205.
Funding HistoryFY
FY 2021
FY 2022
FY 2023
FY 2024 CR
FY 2025 President’s Budget
Amount
$53,184,000
$54,344,000
$56,344,000
$56,344,000
$56,344,000
Program Accomplishments
Recent Training Accomplishments
Data from FY 2021 showed that the LEND and DBP programs collectively provided:
• Diagnostic services to confirm or rule out autism and other developmental disabilities to
over 137,000 children;
• Training to over 22,000 trainees in pediatrics, developmental-behavioral pediatrics, other
health professions, and people with lived experience; and
• Over 3,900 continuing education events on early screening, diagnosis, and services that
reached over 260,000 pediatricians and other health professionals.
Recent Research Accomplishments
In FY 2022 the Autism Research Networks and Autism Single Investigator Innovation Programs:
• Completed 104 studies on physical and behavioral health issues related to autism and
other developmental disabilities, screening and diagnostic measures, early intervention,
and transition to adulthood;
• Enrolled 10,191 participants in primary research studies through 63 research sites across
the country and included 1,311,007 participants in secondary data analyses; and
• Developed 66 peer-reviewed publications in leading scholarly journals.
Research findings contributed to the evidence that supports clinical and public health
recommendations. For example, the HRSA-supported Developmental-Behavioral Pediatrics
Research Network (DBPNet) launched the Safe Access for Everyone (SAFE) initiative that
established a standard of practice in healthcare for supporting youth with neurodevelopmental
disabilities, including autistic children. DBPNet is working with partners to broadly disseminate
the SAFE consensus statement to promote the adoption of the recommendations.
205
206.
Outputs and Outcomes TableMeasure
3020.02: Percentage of
Leadership Education
Neurodevelopmental and
Other Related Disabilities
(LEND) Training
Program long-term
trainees who at 5 years
post-training have
worked in an
interdisciplinary manner
to serve the MCH
population (Outcome)
3020.04: Percentage of
DevelopmentalBehavioral Pediatrics
(DBP) Training Program
long-term trainees
working with
underserved populations,
5 years post-training
(Outcome)
3020.05: Percentage of
DevelopmentalBehavioral Pediatrics
(DBP) Training Program
long-term trainees who at
5 years post-training have
worked in an
interdisciplinary manner
to serve the MCH
population (Outcome)
Year and Most Recent Result
/Target for Recent Result
(Summary of Result)
FY 2024
Target
FY 2025
Target
FY 2025
+/FY 2024
FY 2021 Result: 94%
Target: Not Defined
(Historical Actual)
92%
94%
+2
percentage
points
FY 2021 Result: 92%
Target: Not Defined
(Historical Actual)
90%
92%
+2
percentage
points
FY 2021 Result: 92%
Target: Not Defined
(Historical Actual)
92%
92%
Maintain
206
207.
MeasureYear and Most Recent Result
/Target for Recent Result
(Summary of Result)
3020.06: Percentage of
FY 2021 Result: 84%
Leadership Education in
Target: Not Defined
Neurodevelopmental and (Historical Actual)
Other Related Disabilities
(LEND) Training
Program long-term
trainees working with
underserved populations
5 years post-training
(Outcome)
FY 2024
Target
84%
FY 2025
Target
84%
FY 2025
+/FY 2024
Maintain
Performance Narrative
For all measures, FY 2021 targets are “N/A” as the program was zeroed out in the FY
2021 Congressional Justification and did not set FY 2021 targets.
FY 2025 targets have been set based on the most recent results. For measures 3020.02
and 3020.04, most recent results are slightly above FY 2024 targets. Thus, the FY 2025
targets for these two measures are slightly above FY 2024 targets. For measures 3020.05
and 3020.06, most recent results are equal to FY 2024 targets and FY 2025 targets have
been maintained. The DBP program also recompeted in 2023, which includes a new
cohort of grantees.
Grant Awards Table
FY 2023 Final
FY 2024 Continuing
Resolution
FY 2025 President’s
Budget
LEND
$37,335,135
$36,981,093
$36,981,093
DBP
$3,529,032
$3,480,488
$3,480,488
Research
$7,534,496
$7,604,091
$7,604,091
State Systems
$1,800,000
$1,800,000
$1,800,000
Resource Centers
$1,043,000
$975,000
$975,000
91
90
93
$563,095
$564,896
$546,674
Number of Awards
Average Award
207
208.
Sickle Cell Disease Treatment Demonstration ProgramFY 2024
Continuing
Resolution
FY 2023
Final
FY 2025
President’s
Budget
FY 2025
+/FY 2023
BA
$8,205,000
$8,205,000
$8,205,000
---
FTE
3
3
3
---
Authorizing Legislation: Section 1106 of the Public Health Service Act, as amended by Public
Law 115-327
FY 2025 Authorization ......................................................................................................... Expired
Allocation Methods:
• Competitive grant/co-operative agreement
• Contract
Program Description
The Sickle Cell Disease Treatment Demonstration Program (SCDTDP) helps individuals with
sickle cell disease (SCD) access quality, coordinated, comprehensive care by building
comprehensive sickle cell disease care teams that extend specialty care from centrally based
SCD experts in hospitals, clinics, or university health centers to the communities where people
live. This program:
• Increases the number of individuals living with sickle cell disease that are served by
comprehensive sickle cell care teams;
• Increases the number of clinicians or health professionals knowledgeable on evidencebased treatment of SCD and improving quality of care; and
• Improves care coordination with other providers.
Sickle Cell Disease is a genetic condition where abnormal red blood cells can block blood flow
to organs and tissues, causing anemia, periodic pain episodes, tissue and organ damage, and
increased risk of infections and early death. SCD affects over 100,000 individuals in the United
States, and disproportionately affects Black (1 of every 365 births) and Hispanic Americans (1 of
every 16,300 births).64 While advances in science and medicine mean individuals with SCD have
an increased life expectancy, not everyone who needs therapy and treatment has been able to
benefit equally. Individuals with SCD have unequal access to comprehensive, quality health care
and treatment because the distribution of specialized providers across the United States and the
jurisdictions is uneven; some primary care providers have less comfort treating and caring for
individuals with SCD; primary care providers lack training; and social factors, such as income
levels and stigma also play a substantial role. The program uses a regional model to address
these barriers and help prevent and treat SCD complications.
64
https://www.cdc.gov/ncbddd/sicklecell/data.html
208
209.
The program currently supports five regional SCDTDPs that work collectively to improve healthequity by increasing access to evidence-based care in the communities in which SCD patients
live and leveraging telehealth support to link individuals in communities with specialty services
within the region. The program also supports partnerships between clinicians and community
organizations to improve patients’ quality of care with SCD, and educates providers, families,
and patients to improve knowledge and capacities, particularly as patients transition to adult
health care settings.
The Hemoglobinopathies National Coordinating Center (HNCC) provides technical assistance to
the SCDTDP by leading quality improvement activities and supporting topic-specific
workgroups to address priorities and emerging needs identified by grantees. The HNCC collects
information from the SCDTDP that provides clinicians, nurses, allied health professionals,
community-based organizations and public health agencies with best practices and strategies to
improve sickle cell disease care. The HNCC also collects SCDTDP activity data that informs a
report to Congress, which is planned for delivery in FY 2026.
Budget Request
The FY 2025 Budget Request for the Sickle Cell Disease Treatment Demonstration program of
$8.2 million is equal to the FY 2023 Final level. This request will continue support for the
regional SCD infrastructure so that individuals with SCD can lead full and productive lives
regardless of where they live. HRSA will continue to partner with states to develop and support
knowledgeable SCD care teams to improve and increase access to appropriate care; implement
telehealth technologies for health care delivery, education, and health information services;
increase access to evidence-based care and the latest treatment options; and increase
collaboration and care coordination within each region.
The funding request also includes costs associated with the grant review and award process,
follow-up performance reviews, and information technology and other program support costs.
Funding History
FY
FY 2021
FY 2022
FY 2023
FY 2024 CR
FY 2025 President’s Budget
Amount
$7,183,000
$7,010,000
$8,205,000
$8,205,000
$8,205,000
209
210.
Program AccomplishmentsAccording to data from August 1, 2021 through July 31, 2022, the program successfully reached
individuals with SCD, health care providers, and the community. The following
accomplishments were reported:
• Served over 22,000 individuals in 51 sites, representing about a quarter of the SCD
population in the United States.
• Partnered with more than 184 community organizations to link individuals and families
to knowledgeable providers within the community and provide resources on treatment
options and social services. This strategy ultimately improves access and quality of care
for individuals with SCD.
• 1,805 providers participated in 247 SCD-based Project ECHO sessions or tele-mentoring
calls. Project ECHO serves as an effective model for SCD information sharing, which
helps expand number of providers with improved SCD knowledge and care tools and
resources.
Outputs and Outcomes Table
Year and Most
Recent Result /
Target for Recent
Result
(Summary of
Result)
FY 2022: 22,121
Target: Not Defined
(Historical Actual)
Measure
3030.01: Number of sickle
cell patients served by Sickle
Cell Disease Treatment
Demonstration Program
network providers in the past
year
(Output)
3030.02: Percentage of
FY 2022: 80%
individuals with sickle cell
Target: Not Defined
disease receiving disease
(Historical Actual)
modifying therapies within a
Sickle Cell Disease Treatment
Demonstration Program
(Outcome)
FY 2025
+/-
FY 2024
Target
22,000
FY 2025
Target
24,000
FY 2024
+2,000
80%
80%
Maintain
Performance Narrative
Measure 3030.01: The Sickle Cell Disease Treatment Demonstration Program’s data
source has changed from a provider survey tool to grantee reported data. The number of
patients served decreased from FY 2021 to FY 2022 due to the change in data collection
methodology, which reflects a more accurate number of SCD patients served by the
program.
210
211.
For measure 3030.02, the percentage of individuals with SCD receiving disease
modifying therapies (DMTs) increased significantly due to an increase of different DMTs
that were approved by the FDA in 2019. Grantees report this data through an OMBapproved instrument.
Grant Awards Table
FY 2024 Continuing
Resolution
FY 2025 President’s
Budget
5
5
5
Average Award
$1,190,000
$1,150,000
$1,150,000
Range of Awards
$1,090,000-$1,340,000
$1,050,000-$1,300,000
$1,050,000-$1,300,000
FY 2023 Final
Number of Awards
211
212.
Early Hearing Detection and InterventionFY 2024
Continuing
Resolution
FY 2023
Final
FY 2025
President’s
Budget
FY 2025
+/FY 2023
BA
$18,818,000
$18,818,000
$18,818,000
---
FTE
5
5
5
---
Authorizing Legislation .......... Public Health Service Act, Title III, Section 399M, as amended by
Public Law 117-241
FY 2025 Authorization ..................................................................................................$17,818,000
Allocation Methods:
• Competitive grant/cooperative agreement
Program Description
The Early Hearing Detection and Intervention (EHDI) program helps states, territories, families,
and providers ensure that newborns, infants, and young children up to three years of age who are
deaf or hard of hearing get the care they need when they need it. Early involvement can help
these children meet age-appropriate language, social, and developmental milestones. This
program:
• Recruits, educates, and trains staff and health care providers on current evidence-based
practices and national EHDI system goals;
• Improves access to early intervention services and language acquisition; and
• Improves family engagement, education, partnership, and leadership to strengthen family
support.
The program funds 59 competitive grants to states and jurisdictions and three national centers to
enhance the state/territory EHDI systems of care to improve language acquisition for deaf and
hard of hearing (DHH) children up to age 3. All three national centers provide technical
assistance in a specific focus area to improve the EHDI system: implementation and change,
family leadership, and provider education. The program also empowers families to serve as
leaders through activities that train families to increase their engagement and support in EHDI
systems of care.
Funding also supports supplemental awards to 12 Leadership Education in Neurodevelopmental
and Related Disabilities (LEND) training programs supported by the Autism and Other
Developmental Disabilities program to train future leaders in pediatric audiology.
Budget Request
The FY 2025 Budget Request of $18.8 million for the Early Hearing Detection and Intervention
(EHDI) program is equal to the FY 2023 Final level. The request will continue to support 59
212
213.
competitive grants to states and jurisdictions, technical assistance, and supplemental awards to12 Leadership Education in Neurodevelopmental and Related Disabilities training programs to
train future leaders in pediatric audiology.
The funding request also includes costs associated with the grant review and award process,
follow-up performance reviews, information technology, and other program support costs.
Funding History
FY
FY 2021
FY 2022
FY 2023
FY 2024 CR
FY 2025 President’s Budget
Amount
$17,765,000
$17,818,000
$18,818,000
$18,818,000
$18,818,000
Program Accomplishments
Before 1993, fewer than 1 in 10 newborns in the United States were screened for hearing loss;
however, today nearly all newborns are screened. Since the start of the EHDI program, states and
territories have realized significant success in identifying and obtaining services for newborns
and infants with hearing loss. The EHDI program continues to work with states to meet the
Healthy People 2030 objectives of screening no later than one month of age, conducting
audiologic evaluations no later than three months of age, and enrolling in early intervention
services no later than six months of age (1-3-6 objectives). In 2020, 97.2 percent of infants were
screened before one month of age, 60.6 percent were diagnosed before three months of age, and
72.4 percent were enrolled in early intervention before six months of age.65 Despite the progress,
a lack of comprehensive data reporting requirements for service providers in states and
variability across states in timely access to such providers, among other factors, continue to be
challenging.
Overall system improvements have led to more infants being screened and identified as deaf or
hard of hearing, and fewer infants being lost to follow-up (when an infant does not receive the
recommended follow‐up services) or lost to documentation (when an infant has received
services, but results have not been reported to the EHDI program). In addition, the EHDI
program encourages awardees to develop an integrated EHDI health information system that
allows communication and protected data sharing among health care providers. This ensures that
newborns, infants, and young children up to three years of age receive pertinent screenings and
follow-up services.
Additionally, awardees were required to develop plans by the end of FY 2021 to ensure their
activities are inclusive of, and address the needs of, the populations that they serve. States
65
2020 CDC EHDI Hearing Screening & Follow-up Survey (HSFS) data.
https://www.cdc.gov/ncbddd/hearingloss/ehdi-data2020.html
213
214.
identified priority areas to increase access to services, supports, and education in rural areas fornon-English speaking families and increased opportunities for family engagement and leadership
for diverse families. Since the program’s inception, states and jurisdictions have had significant
success in identifying newborns and infants who are deaf or hard of hearing.
Outputs and Outcomes Table
Measure
3040.01: Percentage of
infants screened for
hearing loss prior to one
month of age (Output)
3040.02: Percentage of
infants suspected of having
a hearing loss with a
confirmed diagnosis by
three months of age
(Output)
3040.03: Increase the
percentage of infants with
hearing loss enrolled in
early intervention before
six months of age (Output)
Year and Most Recent
Result /Target for
Recent Result
FY 2024
(Summary of Result)
Target
FY 2020: 97.2%
98%
Target: 98%
(Target Not Met)
FY 2025
Target
98%
FY 2025
+/- FY
2024
Maintain
FY 2020: 60.6%
Target: 77%
(Target Not Met)
79%
79%
Maintain
FY 2020: 72.4%
Target: 72%
(Target Exceeded)
73%
73%
Maintain
Performance Narrative
Infants who do not pass the initial hearing screening will be referred to a pediatric
audiologist for further evaluation and testing to confirm hearing levels. “Confirmed”
diagnosis refers to a documented diagnosis, which is consistent with terminology used in
newborn hearing screening programs.
For measure 3040.02, the percent decrease in FY 2020 is due to several factors associated
with the pandemic, including staffing shortages, facility closures, limited hours for
outpatient procedures, families sick or quarantining, and parental hesitancy to return for
follow-up services. HRSA maintained targets for FY 2024 and FY 2025 based on FY
2020 results. It is anticipated that numbers will rebound to pre-COVID 19 pandemic
levels in future years. For comparison, the FY 2019 result for this measure was 79.1%.
214
215.
Grant Awards Table66FY 2024 Continuing
Resolution
FY 2025
President’s Budget
59
59
59
Average Award
$236,521
$235,000
$235,000
Range of Awards
$77,873 $310,000
$77,873-$310,000
$77,873-$310,000
FY 2023 Final
Number of Awards
66
Please note that the Grant Awards Table captures the 59 awards made to states and jurisdictions. It does not
capture additional program efforts, such as the supplemental awards to 12 Leadership Education in
Neurodevelopmental and Related Disabilities training programs to train future leaders in pediatric audiology.
215
216.
Emergency Medical Services for ChildrenFY 2024
Continuing
Resolution
FY 2023
Final
FY 2025
President’s
Budget
FY 2025
+/FY 2023
BA
$24,334,000
$24,334,000
$24,334,000
---
FTE
8
8
8
---
Authorizing Legislation: Section 1910 of the Public Health Service Act, as amended by Public
Law 116-49
FY 2025 Authorization ......................................................................................................... Expired
Allocation Method
• Competitive grant/co-operative agreement
• Contract
Program Description
The Emergency Medical Services for Children (EMSC) Program works to save the lives of
children by expanding access to, and improving the quality of, pediatric emergency medical care.
This program helps emergency medical services (EMS) agencies and emergency departments
(EDs) be optimally prepared to provide life-saving emergency medical care for children.
The EMSC Program is the only federal grant program specifically focused on ensuring that
seriously ill or injured children have access to high-quality pediatric emergency care, no matter
where they live in the United States. Though children have unique emergency care needs,
especially during serious or life-threatening emergencies, the majority of the nation's children are
treated in community and rural EDs closest to where they live, rather than in specialized
pediatric medical care centers.
When EMS agencies and EDs have optimal pediatric readiness—the right training, equipment,
staffing, and procedures to best take care of children—the children whom they care for are more
likely to survive and thrive. The EMSC Program investments that support pediatric emergency
care across the United States include:
• The EMSC State Partnership program supports states to increase uptake and adoption
of evidence-based system improvements and Pediatric Readiness guidelines. This work
includes the establishment and maintenance of Pediatric Readiness Recognition
Programs.67
67
A Pediatric Readiness Recognition Program is a standardized statewide, territorial, or regional program, based
upon State-defined criteria and/or adoption of national current published pediatric emergency care consensus
guidelines that address administration and coordination of pediatric care; the qualifications of emergency staff; a
formal pediatric quality improvement or monitoring program; patient safety; policies, procedures, and protocols; and
the availability of pediatric equipment, supplies, and medications.
216
217.
The National Pediatric Readiness Project is a collaborative national initiative that
assesses Pediatric Readiness in our nation’s more than 5,000 EDs and more than 16,000
EMS agencies and develops resources to expand Pediatric Readiness.
The EMSC Innovation and Improvement Center supports quality improvement
initiatives in states, hospital systems, and EMS agencies, to increase implementation of
evidence-based clinical guidelines and drive expansion of Pediatric Readiness.
Data and research investments, including the Pediatric Emergency Care Applied
Research Network (PECARN) and the EMSC Data Center, support research that
improves pediatric emergency clinical care and gather data to track performance
improvement efforts.
Budget Request
The FY 2025 Budget Request for the EMSC program of $24.3 million is equal to the FY 2023
Final level. This request will continue support to states to address critical gaps in emergency care
for children by ensuring that EMS agencies and EDs have optimal Pediatric Readiness and are
able to provide high-quality emergency care for children.
Currently, only 26 percent (as of FY 2022) of EMS agencies require emergency personnel to
demonstrate the effective use of pediatric equipment, and only 37 percent (as of FY 2022) have a
dedicated pediatric emergency care coordinator.68 This funding request will continue to support
the EMSC State Partnership Program to help states and jurisdictions increase Pediatric Readiness
among EMS agencies and EDs through quality improvement efforts and policy initiatives.
The funding request also includes costs associated with the grant review and award process,
follow-up performance reviews, and information technology and other program support costs.
Funding History
FY
FY 2021
FY 2022
FY 2023
FY 2024 CR
FY 2025 President’s Budget
Amount
$22,267,000
$22,276,000
$24,334,000
$24,334,000
$24,334,000
Program Accomplishments
The EMSC Program has:
• Expanded Pediatric Emergency Care Education Program in Native American
Communities: In 2023, in partnership with the Indian Health Service, HRSA expanded a
simulation-based pediatric education program across 13 tribal EDs. These simulations
68
Data reported in EMSC State Partnership Program performance reports (FY22).
217
218.
trained ED staff in critical pediatric emergency care skills to improve emergency care for
American Indian/Alaska Native children.
Expanded Pediatric Workforce Oversight in EMS Agencies: The proportion of EMS
agencies with a pediatric emergency care coordinator increased from 30 percent in 2019
to 37 percent in 2022.69
Advanced EMSC Care for Children in Rural and Tribal Areas: EMSC State Partners
are providing trainings focused on the needs of children in rural and tribal areas;
increasing diverse representation on EMSC advisory councils; and increasing
relationship-building with the families of children with special health care needs.
Assessed the Pediatric Readiness of EDs across the Nation: In 2021, through the
National Pediatric Readiness Project, the EMSC program and national partners assessed
the Pediatric Readiness of more than 5,000 EDs nationwide. The project assesses the
capability of an ED to provide high-quality care for children and provides resources to
address gaps. In 2023, the EMSC program demonstrated that Pediatric Readiness saves
lives.70,9 EMSC-funded analyses show that high ED Pediatric Readiness is independently
associated with long-term survival among injured children.71 An additional analysis
found that children who were cared for in a trauma center ED with higher Pediatric
Readiness were less likely to die than children cared for in a trauma center ED with lower
Pediatric Readiness.72
Supported the Expansion of Evidence Based Guidelines: In 2022, to improve the
emergency care of children in pain, HRSA jointly funded the development of EvidenceBased Guidelines for Prehospital Pain Management.73,74 These recommendations help
EMS agencies learn how to safely treat pain in children as they are transported to an
ED.75
69
Data reported by the EMSC Data Center (FY22)
Ames SG, Davis BS, Marin JR, Fink EL, Olson LM, Gausche-Hill M, Kahn JM. Emergency Department Pediatric
Readiness and Mortality in Critically Ill Children. Pediatrics. 2019 Sep;144(3):e20190568. doi: 10.1542/peds.20190568. Erratum in: Pediatrics. 2020 May;145(5): PMID: 31444254; PMCID: PMC6856787.
71
Newgard CD, Lin A, Goldhaber-Fiebert JD, et al. Pediatric Readiness Study Group. Association of Emergency
Department Pediatric Readiness with Mortality to 1 Year Among Injured Children Treated at Trauma Centers.
JAMA Surg. 2022 Apr 1;157.
72
Remick K, Smith M, Newgard CD, et al. Impact of individual components of emergency department pediatric
readiness on pediatric mortality in US trauma centers. J Trauma Acute Care Surg. 2023 Mar 1;94(3):417-424.
73
Lindbeck G, Shah MI, Braithwaite S, et al. Evidence-based guidelines for prehospital pain management:
Recommendations. Prehospital Emergency Care. 2021 Dec 23:1-10.
74
Powell JR, Browne LR, Guild K, et al. Evidence-based guidelines for prehospital pain management: Literature
and methods. Prehospital Emergency Care. 2021 Dec 23:1-8.
75
Harris MI, Adelgais KM, Linakis SW, et al. Impact of prehospital pain management on emergency department
management of injured children. Prehospital Emergency Care. 2023;27(1):19, doi: 10.1080/10903127.2021.2000683
70
218
219.
Outputs and Outcomes TableMeasure
3050.01: Percentage of
responding Emergency
Medical Services
agencies nationwide that
have a pediatric
emergency care
coordinator (Outcome)
3050.02: Percentage of
states and jurisdictions
that have an established
Pediatric Readiness
Recognition program for
hospital emergency
departments capable of
managing and
stabilizing pediatric
emergencies (Outcome)
3050.03: Number of
children enrolled in
Pediatric Emergency
Care Applied Research
Network (PECARN)
studies (Outcome)
3050.04: Percentage of
states and jurisdictions
that have an established
Pediatric Readiness
Recognition program for
911 responding
Emergency Medical
Services (EMS)agencies
(Developmental)
Year and Most
Recent Result
/Target for
Recent Result
(Summary of
Result)
FY 2022: 37%
Target: 38%
(Target Not Met)
FY 2024
Target
40%
FY 2025
Target
Discontinued
FY 2025
+/FY 2024
Discontinued
35%
35%
Maintain
FY 2023: 171,538 168,000
Target: 144,000
(Target exceeded)
176,000
+8,000
FY 2022: 7%
Target: Not
Defined
(Baseline)
14%
+6
percentage
points
FY 2022: 33%
Target: Not
Defined
(Baseline)
8%
219
220.
Measure14.4: Percentage of
responding hospitals
nationwide that have
written interfacility
transfer guidelines that
cover pediatric patients
and that include specific
components of transfer
(Outcome)
Year and Most
Recent Result
/Target for
Recent Result
(Summary of
Result)
FY 2021: 62%
Target: Not
Defined
(Historical
Actual)
FY 2024
Target
Discontinued
FY 2025
Target
Discontinued
FY 2025
+/FY 2024
N/A
Performance Narrative
The EMS agencies noted in the narrative are synonymous to the EMS agencies noted in
the 3050.01 measure. The FY 2022 results were likely a result of staffing shortages and a
focus on adult emergency care during the pandemic.
The EMSC Program is dedicating more resources and emphasizing the development of
the Pediatric Readiness Recognition Programs for EMS agencies. Measure 3050.01 will
be replaced by the new measure 3050.04, which looks at the percent of states and
jurisdictions that have an established Pediatric Readiness Recognition program for 911
responding EMS agencies.
Data for Measure 3050.01 comes from the annual EMSC survey. The annual EMSC
survey is no longer collecting this data as it is being replaced by the National Prehospital
Pediatric Readiness Project (NPRP) Assessment of overall EMS agencies readiness.
Therefore, HRSA will have no data to report on the FY 2023 and FY 2024 targets.
Grant Awards Table
FY 2024 Continuing
Resolution
FY 2025 President’s
Budget
71
66
66
Average Award
$298,574
$317,680
$317,680
Range of Awards
$130,000-$3,200,000
$130,000-$3,200,000
$130,000-$3,200,000
FY 2023 Final
Number of Awards
220
221.
Healthy StartFY 2023
Final
FY 2024
Continuing
Resolution
FY 2025
President’s
Budget
FY 2025
+/FY 2023
BA
$144,500,000
$145,000,000
$172,000,000
+$27,500,000
FTE
26
26
27
+1
Authorizing Legislation: Section 330H of the Public Health Service Act, as amended by Public
Law 116-36, Section 3225
FY 2025 Authorization ................................................................................................$125,500,000
Allocation Method:
• Competitive grant/co-operative agreement
Program Description
The purpose of the Healthy Start Program is to improve infant and maternal health outcomes
before, during, and after pregnancy. The program also aims to reduce persistent racial and ethnic
disparities in infant deaths and adverse perinatal (immediately before and after birth) health
outcomes. To accomplish this, the program funds local entities in communities with infant
mortality rates that are at least 1½ times the U.S. national average and/or with high indicators of
poor perinatal outcomes, particularly among non-Hispanic Black and other disproportionately
affected populations including American Indians/Alaskan Natives.
In 202176, the U.S. infant mortality rate dropped to a record low of 5.44 infant deaths per 1,000
live births. However, the non-Hispanic Black infant mortality rate (10.55 infant deaths/1,000 live
births) continues to be more than double that for non-Hispanic Whites (4.36 infant deaths/1,000
live births).77 In 2021, the five leading causes of infant mortality in the United States were
preterm birth and low birthweight, birth defects, sudden infant death syndrome, accidents
(unintentional injuries) and maternal pregnancy complications.78
Healthy Start projects improve perinatal health outcomes for enrolled participants and the
communities they serve by customizing interventions to address the main causes of infant
mortality and improving social determinants of health for the entire project area. Healthy Start
projects serve populations with the highest rates of infant mortality and women who are at an
increased risk of adverse maternal health outcomes. Each enrolled family receives a
standardized, comprehensive assessment that facilitates discussion about individual and
household characteristics, physical and behavioral health, health care access and use, health and
76
NCHS Data Brief No. 456, December 2022; Mortality in the United States, 2021 (cdc.gov). Accessed at
https://www.cdc.gov/nchs/data/databriefs/db456.pdf on Jan 19, 2023.
77
NVSS Vol. 72 No. 11, September 2023: https://www.cdc.gov/nchs/data/nvsr/nvsr72/nvsr72-11.pdf
78
NCHS Data Brief No. 456, December 2022; Mortality in the United States, 2021 (cdc.gov). Accessed at
https://www.cdc.gov/nchs/data/databriefs/db456.pdf on Jan 19, 2023.
221
222.
parenting behaviors, the need for referrals to additional services, and more. The program alsoactively recruits fathers and partners for education, activities, services, and events. Prior program
evaluations show positive outcomes related to Healthy Start program goals.79 These include
earlier and more frequent prenatal care visits, greater engagement in infant safe sleep practices,
and lower rates of low birthweight deliveries.
In FY 2023, Healthy Start funded 101 grants to higher-risk communities in 35 States, the District
of Columbia, and Puerto Rico. In FY 2023, Healthy Start also supported the Enhanced Healthy
Start Initiative to fund grantees in 10 new communities with the highest racial/ethnic disparities
in infant mortality rates and poor perinatal health outcomes.
In FY 2024, the program is funding a cohort of 113 Healthy Start grantees across the country. As
part of Healthy Start’s ongoing effort to implement innovative and evidence-based interventions
that more effectively address the key drivers of infant and maternal mortality, the new FY 2024FY 2029 cohort of grantees will be required to offer their HS participants -and all pregnant
women in their project areas- group prenatal health & parenting education sessions. Group-based
health education sessions provide women with social support (including peer support from other
pregnant women in their community) and interactive education on critical prenatal health,
parenting, and child safety topics. Researchers believe the effectiveness of group prenatal
education in improving perinatal outcomes is due to this social support. This support helps
address key drivers of preterm and low birthweight births, such as chronic stress, feelings of
isolation, and lack of support; and provides clients with additional time for health education and
skills building. The group health education sessions will provide participants with high-quality
health information, and pregnant women who participate will receive more extensive prenatal
health education. Healthy Start grantees will continue to support clinical service providers at
each Healthy Start site, who provide direct access to well-woman care and maternity care
services. This builds on the program’s previous commitments to dedicate $15 million to hire
such providers.
Healthy Start staff, such as community health workers, case managers, and health educators,
provide the services below for Healthy Start participants in individualized and/or group settings
as well as provide referrals and help link Healthy Start participants to those services when
needed.
• Health promotion and education: Health and parenting education on topics such as
prenatal health and wellness, nutrition, childbirth education, breastfeeding,
immunizations, reducing the risk of sudden infant death syndrome, and supporting mental
health.
• Health care services: Clinical care including prenatal, postpartum, well-baby/child, and
well-woman care, and behavioral health services (e.g., treatment for depression and
substance use, and support for people experiencing interpersonal violence).
• Services that increase access to health care and improve health outcomes:
o Insurance enrollment, screening and referrals for treatment and care for maternal
depression, smoking cessation, and assistance with enrollment in programs such
as the Special Supplemental Nutrition Program for Women, Infants, and Children
79
Abt Associates (2020). Evaluation of the Implementation and Outcomes of the Maternal & Child Health Bureau's
Federal Healthy Start Program.
222
223.
oo
program (WIC), Supplemental Nutrition Assistance Program (SNAP), and
housing support.
Social support, peer support, reducing social isolation, and providing social
support for fathers/partners, and childcare.
Transportation, language interpretation, job training, and adolescent pregnancy
prevention.
Healthy Start grantees collaborate with neighborhood residents, community leaders, Healthy
Start participants, medical and social service providers, faith-based leaders, and business
representatives in local communities to build upon the communities’ existing care and support
resources. Grantees also collaborate with other federal and/or state-funded programs that support
the communities’ maternal and child health populations. Some collaborations include:
• Title V State Maternal and Child Health Block Grant
• Special Supplemental Nutrition Program for Women, Infants, and Children (WIC)
• Early Head Start
• Medicaid
• Children’s Health Insurance Program (CHIP)
• Maternal, Infant, and Early Childhood Home Visiting Program
• Local community health centers that provide maternity care services
These collaborations strengthen the services provided to Healthy Start families, reduce risk
factors, such as food insecurity during pregnancy, and promote healthy behaviors that can lead to
improved outcomes for women and their families.
HRSA also supports technical assistance, training, and education for grantees to strengthen staff
skills to implement evidence-based practices in maternal and child health; facilitate grantee-tograntee sharing of expertise and lessons learned from the field; and facilitate resource sharing for
effective program delivery.
Budget Request
The FY 2025 Budget Request for the Healthy Start program of $172.0 million is $27.5 million
above the FY 2023 Final level. Recognizing that improving birth outcomes begins with
improving women’s health before, during, and after pregnancy, FY 2025 funding will continue
to support 113 Healthy Start awards, including the 10 Enhanced Healthy Start grantees. This
funding will improve access to quality health care and support services for women and children
throughout the prenatal, postpartum, and inter-conception periods. Funding will also continue to
support grantees to hire clinical service providers at Healthy Start sites to provide direct access to
well-woman care and maternity care services. This will reduce barriers to care and better address
health disparities among high-risk and underserved women.
The Budget also includes $27.0 million for the Healthy Start program to support workforce
needs and development, including building on lessons learned from the “Benefits Bundle” Peer
Navigator pilot. The pilot supports the training and staffing of Peer Navigators (recent Healthy
Start alumni) who work with current Healthy Start families to improve access to community
resources that address social determinants of health (food insecurity, unstable housing, lack of
223
224.
transportation), and increase social and community supports among pregnant Healthy Startparticipants. With this additional funding Healthy Start grantees will increase their workforce
capacity to provide services and supports to Healthy Start families to help ensure positive short
and long-term health outcomes for mothers and their newborns.
The funding request also includes costs associated with the Healthy Start Monitoring and
Evaluation Data (HSMED) system, the grant review and award process, follow-up performance
reviews, information technology, and other program support costs.
Funding History
FY
FY 2021
FY 2022
FY 2023
FY 2024 CR
FY 2025 President’s Budget
Amount
$128,000,000
$131,340,000
$144,500,000
$145,000,000
$172,000,000
Program Accomplishments
In FY 2019, Healthy Start funded a new initiative to reduce maternal mortality by hiring clinical
service providers (e.g., nurse practitioners, certified nurse midwives, physician assistants,
behavioral health providers, and other maternal-child advanced practice health professionals) to
provide clinical support, such as well-woman care and maternity care services, within program
sites nationwide. From FY 2019 through FY 2024, HRSA used/will use $15 million per year to
support these activities within existing Healthy Start awards. By the end of 2022, 218 clinicians
were providing care at 92 grant sites through this funding. Between November 2019 and October
2022, these clinicians provided 51,364 in-person visits and nearly 20,000 telehealth visits,
including well-woman care, prenatal care, postpartum care, and behavioral health counseling.
In FY 2021, HRSA funded supplemental grants to help train, certify, and pay for doulas in
Healthy Start service areas to provide continuous physical, emotional, and informational support
to a mother before, during, and shortly after childbirth. This funding increased the pool of
available doulas in communities with high rates of infant deaths and racial and ethnic differences
in the health outcomes of infants and pregnant women. In FY 2021, the first round of
supplemental awards supported 25 Healthy Start projects in 19 states. In FY 2022, HRSA
announced a second funding round for current Healthy Start sites to further grow, diversify, and
sustain the community-based doula workforce. An additional 19 sites received awards,
increasing the total number of Healthy Start doula programs from 25 to 44 nationwide.
The Healthy Start Program served approximately 79,500 women and children in FY 2022, in
addition to over 5,450 men (age 25+ years). During the same period, Healthy Start projects
screened 99 percent of women participants for depression, with 84 percent of those who screened
positive receiving referral for services (of the remainder, some were already receiving services or
224
225.
declined a referral). In addition, nearly 98 percent of Healthy Start women participants werescreened for intimate partner violence.
Healthy Start parenting education services have had positive outcomes on parenting practices:
nearly 85 percent of Healthy Start infants were placed to sleep in a safe manner (on their back,
alone, and on a firm surface with no loose bedding or soft objects). In comparison,
approximately 80 percent of infants nationally were placed to sleep on their backs per CDC’s
Pregnancy Risk Assessment Monitoring System’s sample (2020).
As noted in the table below, Healthy Start single-year IMRs have decreased with each successive
year as grantees continue to serve their participants. In recent years, Healthy Start community
grantees report that infant mortality rates among Healthy Start participants have decreased faster
than the national rate during the same time period.
• These results may be due in part to the effectiveness of Healthy Start programs in
ensuring that their participants have access to, and use, health care services. For example,
93 percent of program participants had insurance in 2022 (likely a high proportion due to
Healthy Start’s efforts to link participants to Medicaid) and over 87 percent women
participants and 95 percent of child participants had a usual source of care.
• Furthermore, 86 percent of women participants had a well-woman healthcare visit in the
previous year, and 94 percent of children had a well-child visit in the past year following
the recommended schedule of the American Academy of Pediatrics.
Table 1.0 Single Year Infant Mortality Rates in the U.S. and among Healthy Start
Participants
Year
2019
2020
2021
2022
U.S. Single Year Infant
Mortality Rates
(per 1,000 live births)
5.58
5.42
5.44
TBD
Healthy Start Single Year
Infant Mortality Rates
(per 1,000 live births)80
8.05
7.04
6.67
6.24
Healthy Start is committed to data-driven and evidence-based decision-making. In FY 2021,
HRSA invested in a four-year contract to conduct a national evaluation of the Healthy Start
program to determine the effectiveness of the program. The evaluation concludes in FY 2025,
and results will be used to inform decision-making and develop recommendations to improve
implementation of the Healthy Start program.
80
The higher rates for Healthy Start participants likely reflects the high-risk populations that are targeted by the
program.
225
226.
Outputs and Outcomes TableMeasure
3060.01: Increase the
percentage of pregnant
women enrolled in
Healthy Start who have a
prenatal care visit in the
first trimester (Outcome)
3060.02: Decrease the
percentage of singleton
births weighing less than
2,500 grams (low
birthweight) born to
women enrolled in
Healthy Start (Outcome)
3060.03: The number of
persons case managed in
the Healthy Start Program
(Outcome)
Year and Most
Recent Result /Target
for Recent Result
(Summary of Result)
FY 2022: 85%
Target: 80%
(Target Exceeded)
FY 2024
Target
FY 2025
Target
84%
84%
FY 2025
+/FY 2024
Maintain
FY 2022: 12.4%
Target: 9.6%
(Target Not Met)
9.6%
9.6%
Maintain
FY 2022: 84,947
Target: 80,000
(Target Exceeded)
82,000
Discontinued
N/A
Performance Narrative
• Key program accomplishments highlighted above reflect FY 2022 outcomes among
Healthy Start grantees initially funded in FY 2019. In FY 2022, the program exceeded
two of the three performance measure targets: timely prenatal care utilization and number
of participants served. The program did not meet the target for low birthweight infants,
possibly reflecting the national increase in preterm birth rate, as well as the program’s
focus on reaching the highest risk populations in communities with elevated rates of
infant mortality and adverse perinatal outcomes.
• Fiscal year targets reflect calendar year data. Awards are made annually in April, thus the
bulk of the data coincide with two fiscal years. Data do not reflect Enhanced Healthy
Start Initiative awards as those began in FY 2023.
• The FY 2024 target for measure 3060.01 is maintained for FY 2025. The Healthy Start
program uses a five-year grant cycle, with several new awards expected in FY 2024 that
could go to new communities. New communities will need time to hire and train staff
before service provisions become available. With the potential for supporting new
communities, the target is maintained rather than increased.
• Measure 3060.03 has been discontinued as the new FY 2024 Healthy Start competition
provides greater flexibility in use of grant funds to include group-based education
services and community action network activities rather than just case managed visits. To
align with the programmatic update, this measure is being discontinued.
226
227.
Grant Awards TableFY 2024 Continuing
Resolution
FY 2025 President’s
Budget
111
113
113
Average Award
$1,103,692
$1,084,158
$1,309,538
Range of Awards
$664,356-$1,159,121
$664,356-$1,159,121
$889,736-$1,369,501
FY 2023 Final
Number of Awards
227
228.
Heritable Disorders in Newborns and ChildrenFY 2023
Final
FY 2024
Continuing
Resolution
FY 2025
President’s
Budget
FY 2025
+/FY 2023
BA
$20,883,000
$20,883,000$
$20,883,000
---
FTE
6
6
6
---
Authorizing Legislation: Section 1109-1112 and 1114 of the Public Health Service Act, as
amended by Public Law 113-240, Section 10
FY 2025 Authorization………………………………………………………………Expired
Allocation Methods:
• Contract
• Competitive grant/co-operative agreement
Program Description
The Heritable Disorders in Newborns and Children portfolio works to reduce the morbidity and
mortality in newborns and children caused by genetic disorders passed from parent to child. The
portfolio supports state newborn screening systems (NBS) and local public health agencies so
that birthing facilities and providers screening newborns can quickly identify, diagnose, and treat
newborns with serious health conditions. Early diagnosis and intervention can prevent serious
problems such as brain damage, organ damage, and even death.
Newborn screening saves or improves the lives of nearly 13,000 babies in the United States each
year. In the United States, all babies are eligible for newborn screening. To guide state NBS
programs, the Secretary of Health and Human Services (HHS) recommends a list of health
conditions for screening called the Recommended Uniform Screening Panel (RUSP). The
Advisory Committee on Heritable Disorders in Newborns and Children (ACHDNC) also
supports this panel. Nationwide, approximately four million newborns each year undergo
newborn screening for at least 31 of the 36 core conditions on the RUSP.
The Heritable Disorders portfolio includes funding for state newborn screening programs to
directly improve processes and ensure that infants and their families receive timely information
and services. The portfolio design is based on a prior evaluation of the program as well as
feedback from stakeholders and the ACHDNC.
The following programs comprise the Heritable Disorders portfolio:
• The Cooperative Newborn Screening System Priorities Program (NBS Co-Propel)
initiated in FY 2024, and the State Newborn Screening Priorities Program (NBS
Propel), which began in FY 2023. These programs support more than 28 state NBS
programs to address state-specific challenges, and enhance, improve, and expand state
NBS systems through two focus areas:
228
229.
o Focus area 1 is early diagnosis and treatment of NBS-identified infants.
Activities include improving timely collection and reporting of NBS specimens
and implementing screening for newly added RUSP conditions.
o Focus area 2 is optimizing health outcomes for newborns diagnosed with a
genetic disorder and increasing family engagement. Focus area 2 also supports
activities to strengthen communication with families of infants diagnosed with
Severe Combined Immune Deficiency (SCID) and other NBS disorders, to
ensure infants have access to specialty care and treatment, particularly in
underserved populations, and that families are actively engaged at all levels of the
newborn screening system.
The National Center for Newborn Screening System Excellence (NBS Excel),
awarded in FY 2023, supports a national organization to strengthen state public health
agencies and NBS system partners to provide screening, counseling, or health care
services to newborns and children with, or at risk for, heritable disorders. NBS Excel
provides leadership, technical assistance, and quality improvement expertise; collects
data to identify barriers to achieving equitable access to NBS services for all infants and
families; enhances state performance in NBS; and provides training, education, and other
resources to families and/or individuals with heritable disorders to promote engagement
and partnership at all levels of the newborn screening system.
The Newborn Screening Information Center (NBSIC) is a clearinghouse of NBS
information and serves as a central hub of clear and up-to-date educational resources,
research, and data on NBS, as well as family support information. These resources
increase awareness, knowledge, and understanding of NBS and genetic conditions.
The ACHDNC provides national NBS guidance and standards by making systematic evidenceinformed and peer-reviewed recommendations regarding conditions for inclusion on the RUSP.
It also advises the Secretary on reducing mortality or morbidity from heritable disorders and
considers ways to ensure state and jurisdiction capacity to screen for RUSP conditions.
Budget Request
The FY 2025 Budget Request for the Heritable Disorders in Newborns and Children program of
$20.9 million is equal to the FY 2023 Final level. This request will continue support of the
projects and associated awards in the Heritable Disorders in Newborns and Children portfolio.
This includes continued support of state and local public health agencies, public health
professionals, and primary and specialty care providers in their ability to provide screening,
counseling, and health care services to reduce morbidity and mortality caused by heritable
disorders in newborns and children. The request will continue to fund efforts to increase
awareness, knowledge and understanding of NBS and enhance, improve, or expand access to
screening, counseling, and health care services for newborns and children having or at risk for
genetic disorders.
The funding request also includes costs associated with the grant review and award process,
follow-up performance reviews, and information technology and other program support costs.
229
230.
Funding HistoryFY
FY 2021
FY 2022
FY 2023
FY 2024 CR
FY 2025 President’s Budget
Amount
$18,826,000
$19,558,000
$20,883,000
$20,883,000
$20,883,000
Program Accomplishments
In FY 2023, multiple states implemented screening for the latest conditions added to the RUSP, a
key program goal. Adding a new condition to a newborn screening state lab is a complicated
process. Technical assistance and resources were provided to all 53 state and territory newborn
screening programs as they implemented new conditions including Guanidinoacetate
Methyltransferase Deficiency (GAMT) and Mucopolysaccharidosis Type II (MPS II).
Approximately 78 percent of state newborn screening programs have implemented or are in the
process of implementing screening for Spinal Muscular Atrophy (SMA), x-linked
Adrenoleukodystrophy (x-ALD); and Mucopolysaccharidosis Type I (MPS I).
The program has also supported many quality improvement activities to improve timely newborn
screening. To effectively reduce disability, morbidity, and mortality, the NBS process must occur
within the short window between birth and the onset of symptoms. These benchmarks were set
by the ACHDNC as a critical measure of the success of state NBS programs. In FY 2022, 91
percent of states reported collecting 95 percent or more of specimens within 48 hours of birth
and 26 state NBS programs participated in quality improvement activities, which included
support to implement new conditions and timeliness in reporting NBS results.
In addition, the program funded dozens of toolkits, webinars, model practices, videos,
publications, educational tools, reports, data visualizations, and presentations to increase public
education and awareness of NBS. These are available for state NBS programs and the public.
Outputs and Outcomes Table
Year and Most Recent
Result /Target for
Recent Result /
Measure
(Summary of Result)
3070.01: Percentage FY 2022: 91%
of states that reported Target: Not Defined
collecting 95% or
(Historical Actual)
more of specimens
within 48 hours of
birth
(Output)
230
FY 2024
Target
80%
FY 2025
Target
82%
FY 2025
+/FY 2024
+2 percentage
point
231.
Measure3070.02: Percentage
of states that
reported 95% or
more of all newborn
screening results
(normal and out-ofrange) within seven
days of birth
(Output)
Year and Most Recent
Result /Target for
Recent Result /
(Summary of Result)
FY 2022: 22%
Target: Not Defined
(Historical Actual)
FY 2024
Target
25%
FY 2025
Target
28%
FY 2025
+/FY 2024
+3 percentage
point
Performance Narrative
• During COVID-19, data submission and completeness was inconsistent due to strain on
state capacity. Voluntary reporting to national databases was greatly reduced. Starting in
FY23, funding was provided to state newborn screening programs directly. Along with
this programmatic change, the 28 grantees are required to submit data annually, which
will allow for consistent reporting. Considering this new reporting requirement and new
funding cycle, the FY 2025 targets for measures 3070.01 and 3070.02 have increased
modestly.
Grant Awards Table
FY 2024 Continuing
Resolution
FY 2025 President’s
Budget
36
36
39
Average Award
$ 459,149
$ 459,149
$394,698
Range of Awards
$126,554-$2,650,000
$126,554-$2,650,000
$122,401-$2,300,000
FY 2023 Final
Number of Awards
231
232.
Pediatric Mental Health Care AccessFY 2024
Continuing
Resolution
FY 2023
Final
FY 2025
President’s
Budget
FY 2025
+/FY 2023
BA
$13,000,000
$13,000,000
$13,000,000
---
FTE
7
8
8
---
Authorizing Legislation: Public Health Service Act, Section 330M, as amended by Public Law
117-159, Section 11005
FY 2025 Authorization.……………………………………………………………..$31,000,000
Allocation Method
• Competitive grant/co-operative agreement
Program Description
The Pediatric Mental Health Care Access (PMHCA) program promotes behavioral health
integration in pediatric primary care by developing new, or expanding existing, statewide, or
regional pediatric mental health care access programs. PMHCA programs provide:
• Tele-consultation and training to support pediatric primary care providers to diagnose,
treat, and refer children with behavioral health conditions; and
• Resources and referrals to providers, families, and community members
PMHCA addresses the shortages of psychiatrists, developmental-behavioral pediatricians,
psychologists, and other behavioral health clinicians who furnish care to children and
adolescents with behavioral concerns. Pediatric primary care providers are often the first
responders in behavioral disorder identification and service provision. However, they may not
have adequate knowledge, training, or resources to screen, diagnose, and treat behavioral
disorders. Telehealth strategies, like the ones the PMHCA program supports, connect primary
care providers with specialty mental and behavioral health care providers. Participating providers
also gain knowledge and increase their capacity/capability over time to address some behavioral
concerns on their own, which over time will decrease the need for consultation. This approach
increases access to behavioral health services.
The need for PMHCA programs is great. There have been significant increases in the number of
children diagnosed with mental health conditions between 2016 and 2020. The number of
children ages 3-17 years old diagnosed with anxiety grew by 29 percent and those with
depression grew by 27 percent.81 In addition, only 58 percent of children with mental or
81
Lebrun-Harris, L. A., Ghandour, R. M., Kogan, M. D., & Warren, M. D. (2022). Five-Year Trends in US
Children's Health and Well-being, 2016-2020. JAMA Pediatrics, 176(7), e220056.
https://doi.org/10.1001/jamapediatrics.2022.0056
232
233.
behavioral conditions receive mental health treatment or counseling,82 and research highlightssignificant geographic and racial and ethnic disparities in receipt of behavioral health care.83
Black/African American children residing in urban areas and Hispanic/Latino children residing
in both rural and urban areas are less likely to receive mental health care than White children.3
White children in rural areas are significantly less likely to receive mental health services than
their counterparts in urban areas.3
Budget Request
The FY 2025 Budget Request for the PMHCA program of $13.0 million is equal to the FY 2023
Final level. The request will continue to support at least 25 statewide or regional pediatric mental
health care telehealth access programs funded through the FY 2023 competition. These programs
will continue to provide tele-consultation, training, technical assistance, and care coordination
support for pediatric primary care providers to diagnose, treat, and refer children with behavioral
health conditions.
In total, HRSA will support a total of 65 awards in FY 2025. The remaining 40 awards are
supported by funds obligated from the American Rescue Plan Act of 2021 and the $20 million in
funding appropriated in the Bipartisan Safer Communities Act in FY 2022.
The funding request also includes costs associated with the grant review and award process,
follow-up performance reviews, and information technology and other program support costs.
Funding History
FY
FY 2021
FY 2022
FY 2023
FY 2024 CR
FY 2025 President’s Budget
Amount
$9,970,000
$11,000,000
$13,000,000
$13,000,000
$13,000,000
Program Accomplishments
PMHCA program award recipients addressed behavioral health issues among children and
adolescents, including anxiety, depression, and suicidal ideation and attempts. Award recipients
also supported resilience strategies among families and clinicians. Across 45 states, Tribes, and
territories in FY 2022 the program achieved the following:
Over 16,400 primary care providers enrolled in a statewide or regional PMHCA program;
Child and Adolescent Health Measurement Initiative. 2021 National Survey of Children’s Health (NSCH) data
query. Data Resource Center for Child and Adolescent Health supported by the U.S. Department of Health and
Human Services, Health Resources and Services Administration (HRSA), Maternal and Child Health Bureau
(MCHB). Retrieved [07/11/23] from [www.childhealthdata.org].
83
Hodgkinson,S., Godoy,L., Beers,L.S., Lewin, A.(2017) Improving Mental Health Access for Low-Income
Children and Families in the Primary Care Setting. Pediatrics, 139 (1): e20151175. 10.1542/peds.2015-1175
82
233
234.
Over 8,700 providers used consultation and care coordination support services and over
10,500 providers were trained; and
Pediatric primary care providers who contacted the pediatric mental health team served
approximately 27,000 children and adolescents.
Approximately 21 awardees of the Program’s 45 recipients funded in FY 2022 were funded
through annual appropriations. Additional recipients were funded from the American Rescue
Plan Act.
Outputs and Outcomes Table
(*Results and targets in the table below reflect annual discretionary funding. This does not
include results/targets from PMHCA programs supported through supplemental appropriations.)
Measure
Year and Most Recent
Result /Target for
Recent Result
(Summary of Result)
FY 2024
Target
FY 2025
Target
FY 2025
+/-
3080.01: Number of providers FY 2022: 4,220
using the Pediatric Mental
Target: 4,750
Health Care Access Program
(Target Not Met)
consultation (teleconsultation
and in-person) and care
coordination services for
treatment and referral of
children with behavioral
health conditions (Output)
5,000
5,500
FY 2024
+500
3080.04: Number of providers
trained through the Pediatric
Mental Health Care Access
Program to better screen,
diagnose, treat, or refer
children with behavioral
health conditions (Output)
FY 2022: 7,078
Target: Not Defined
(Baseline)
8,000
8,250
+250
3080.05: Number of children
and adolescents for whom a
provider contacted the
Pediatric Mental Health Care
Access Program for
consultation or referral
(Output)
FY 2022: 12,088
Target: Not Defined
(Baseline)
11,500
13,000
+1,500
3080.02: Percentage of
providers using the
teleconsultation line (Output)
FY 2022: 34.1%
Target: 45%
(Target Not Met)
Discontinued
Discontinued N/A
234
235.
Performance Narrative• For measure 3080.01, the FY 2022 results were impacted by COVID-19.
• The FY 2022 results for discontinued measure 3080.02 were impacted by a number of
factors. COVID-19 may have impacted the number of patients seen by providers and thus
the percentage of providers using the teleconsultation line. Existing participating
providers gain knowledge and increase their capacity/capability over time to address
some behavioral concerns on their own; hence, a decrease in the need to contact teams for
consultation. Additionally, existing programs that already have many enrolled providers
tend to have a smaller percentage of providers utilizing the consult line.
• Data presented reflect 21 awardees funded by annual appropriations. Data from the
additional 24 awardees funded through the American Rescue Plan Act (ARP)
appropriations are not included in the outputs and outcomes table, but are included in the
narrative.
Grant Awards Table84
FY 2024 Continuing
Resolution
FY 2025 President’s
Budget
21
25
25
$445,000
$444,867
$444,867
$445,000
$441,673-$445,000
$441,673-$445,000
FY 2023 Final
Number of Awards
Average Award
Range of Awards
84
Does not include ARP and BSCA awards.
235
236.
Screening and Treatment for Maternal Mental Health and Substance UseDisorders
FY 2024
Continuing
Resolution
FY 2023
Final
FY 2025
President’s
Budget
FY 2025
+/FY 2023
BA
$10,000,000
$10,000,000
$15,500,000
+$5,500,000
FTE
2
2
2
-
Authorizing Legislation: Section 317L-1 of the Public Health Service Act, amended by Public
Law 117-328, section 1111
FY 2025 Authorization……………………………………………………$24,000,000
Allocation Method
• Competitive co-operative agreement
Program Description
The Screening and Treatment for Maternal Mental Health and Substance Use Disorders program
helps expand health care providers’ capacity to screen, assess, treat, and refer pregnant and
postpartum women for maternal mental health and substance use disorders. This is accomplished
by supporting statewide, tribal, or regional85 networks that provide:
• real-time psychiatric consultation;
• care coordination support services; and
• culturally and linguistically appropriate training to maternity care providers and clinical
practices.
Through this work, the program aims to improve the mental health and well-being of women
who are pregnant, postpartum or have given birth within the preceding 12 months and reduce
maternal health inequities.
Maternal mental health conditions, such as depression, anxiety, and substance use disorder, are
common complications during pregnancy and the postpartum period. Across the country, there is
a significant shortage of psychiatrists and mental health providers. Thus, it is important to train
front-line providers to identify and treat behavioral health conditions as part of routine primary
care so that pregnant and postpartum women affected by these conditions receive timely,
appropriate care.
85
Regional MMHSUD teams are defined as MMHSUD care teams within regions of a state, jurisdiction, or Tribal
area.
236
237.
In FY 2023, the program was recompeted and expanded to support 12 awardees. The FY 2023competition included program modifications to reflect changes outlined in the recent
reauthorization. The program:
• Requires grant recipients to provide a 10 percent match to support program activities.
• Expands eligible entities to include Indian Tribes and Tribal Organizations, in addition to
States.
• Gives priority, as appropriate, to entities that: 1) focus on enhancing screening,
prevention, and treatment; 2) partner with community-based organizations that address
maternal mental health and substance use disorders; 3) are in, or provide services to,
areas with disproportionately high rates of maternal mental health or substance use
disorders, or other related disparities; and 4) operate in a health professional shortage
area.
The program’s long-term goals are to:
• Increase routine mental and behavioral health screening for pregnant and postpartum
women;
• Increase routine detection, assessment, treatment, and referral of maternal mental health
conditions using evidence-based practices; and
• Increase access to treatment and recovery support services for pregnant and postpartum
women that are affordable, culturally and linguistically appropriate, community-based,
and provided via telehealth and traditional in-person services.
Budget Request
The FY 2025 Budget Request for the Screening and Treatment for Maternal Mental Health and
Substance Use Disorders program of $15.5 million is $5.5 million above FY 2023 Final level.
This request increases access to behavioral health care for perinatal women by expanding the
Screening and Treatment for Maternal Mental Health and Substance Use Disorders program. It
will support approximately six new awards, bringing the total number of awards to
approximately 18. This investment increases the availability of consultation (teleconsultation or
in-person) and care coordination support, and training to expand front-line health care provider
capacity to screen, assess, treat, and refer women who are pregnant, postpartum, or have given
birth within the past 12 months for maternal mental health and substance use disorders. This
funding will help address ongoing and growing maternal mental health needs.
Funding will also support a joint effort for the ongoing exchange of effective practices,
resources, and peer-to-peer learning and mentorship to Screening and Treatment for Maternal
Mental Health and Substance Use Disorder programs and the national network of Pediatric
Mental Health Care Access program, as well as evaluation support for state behavioral health
telehealth programs.
The funding request also includes costs associated with the grant review and award process,
follow-up performance reviews, and information technology and other program support costs.
237
238.
Funding HistoryFY
FY 2021
FY 2022
FY 2023
FY 2024 CR
FY 2025 President’s Budget
Amount
$5,000,000
$6,500,000
$10,000,000
$10,000,000
$15,500,000
Program Accomplishments
Training
Awardees trained 1,875 providers in FY 2022, an increase from 782 providers trained in FY
2021. Trainings covered a variety of evidence-based practices such as: Screening, Brief
Intervention, and Referral to Treatment (SBIRT); Medication Assisted Treatment; how to use
standardized validated screening tools for perinatal depression and anxiety; ways to integrate
behavioral health in primary care settings; and training on perinatal mood and anxiety disorders.
Providers trained include obstetricians/gynecologists, psychiatrists, licensed clinical social
workers, licensed professional counselors, nurses/nurse practitioners, certified nurse midwives,
physician assistants, care coordinators/patient navigators, family medicine physicians, and other
health professionals.
Consultation86
Providers sought/received expert consultation for 1,860 pregnant and postpartum women in FY
2022. This was an increase from 1,405 pregnant and postpartum women in FY 2021.
Screening
Practices with providers who participated in the MMHSUD program:
• Screened 46,005 pregnant and post-partum women for depression in FY 2022, a 22
percent increase over FY 2021.
• Screened 35,845 pregnant and post-partum women for anxiety in FY 2022, a 15 percent
increase over FY 2021.
• Screened 27,657 pregnant and post-partum women for substance use in FY 2022, a 29
percent increase over FY 2021.
“Consultation” refers to psychiatric consultation and/or care coordination support provided either via telehealth or
in-person by the program.
86
238
239.
Outputs and Outcomes TableMeasure
3090.01: Number of pregnant
or postpartum women about
whom a provider contacted the
Maternal Mental Health and
Substance Use Disorders
Program for consultation or
referral
(Output)
3090.03: Number of providers
using the Maternal Mental
Health and Substance Use
Disorders Program for
consultation (teleconsultation
or in-person) and care
coordination support services
for treatment and referral of
pregnant and postpartum
women with behavioral health
conditions (Output)
3090.04: Number of providers
trained through the Maternal
Mental Health and Substance
Use Disorders Program to
better screen, diagnose, treat,
and refer pregnant and
postpartum women with
behavioral health conditions
(Output)
Year and Most
Recent Result
/Target for Recent
Result
(Summary of
Result)
FY 2022: 1,860
Target: Not
Defined
(Historical Actual)
FY 2025
Target
6,750
FY 2025
+/FY 2024
+4,250
FY 2022: 824
1,500
Target: Not Defined
(Historical Actual)
2,700
+1,200
FY 2022: 1,875
3,000
Target: Not Defined
(Historical Actual)
5,400
+2,400
FY 2024
Target
2,500
Performance Narrative
Measure 3090.03 represents the unduplicated count of providers who contacted the
program for consultation & care coordination support.
239
240.
Grant Awards TableFY 2024
Continuing
Resolution
FY 2023 Final
Number of Awards
FY 2025 President’s
Budget
12
12
18
Average Award
$744,076
$737,051
$763,889
Range of Awards
$687,000 - $750,000
$687,000 - $750,000
$763,889
240
241.
Poison Control ProgramFY 2024
Continuing
Resolution
FY 2023
Final
FY 2025
President’s
Budget
FY 2025
+/FY 2023
BA
$26,846,000
$26,846,000
$26,846,000
---
FTE
3
3
3
---
Authorizing Legislation: Sections 1271-1274 of the Public Health Service Act, as amended by
P.L. 116-94
FY 2025 Authorization .........................................................................................................Expired
Allocation Method:
• Contracts
• Competitive grants/co-operative agreements
Program Description
The Poison Control Program (PCP) ensures that individuals can call a national toll-free Poison
Help line (1-800-222-1222) to connect to a local poison control center (PCC) in a poisoning
emergency. The PCP:
• Supports the national toll-free number to ensure access to poison control services;
• Implements a national media campaign to educate and support outreach to the public and
health care providers; and
• Supports PCCs to help prevent poisonings and toxic exposures, provide
recommendations for managing poisonings and toxic exposures, and comply with
accreditation requirements.
The program ensures that individuals can call from anywhere in the United States and the U.S.
territories and connect to the PCC that serves their respective area. The program maintains the
toll-free Poison Help line, provides interpretation services in over 161 languages, and offers
services for the hearing impaired.
Through the PCCs, individuals have access to health care providers and other specially trained
toxicology experts twenty-four hours a day, seven days a week who provide assessments, triage,
and treatment recommendations at no cost to callers across the United States, American Samoa,
the District of Columbia, the Federated States of Micronesia, Guam, Puerto Rico, and the U.S.
Virgin Islands. PCCs are consulted for a range of exposures including, for example, when a child
swallows a household product; when an adolescent intentionally ingests an over-the-counter
medication; when a worker is exposed to harmful substances; or when a senior takes an
additional dose of a prescribed medication. Emergency 911 operators refer poison-related calls to
PCCs, and emergency and in-patient health care professionals regularly consult PCCs for expert
consultation in managing poisonings. PCCs also conduct follow-up calls to monitor case
progress and document medical outcomes.
241
242.
PCCs are important partners in public health emergencies, response, and preparedness. Byensuring free, around-the-clock, equitable access to every individual in the nation, PCCs can
provide critical real-time surveillance data to identify public health emergencies. Access to
around-the-clock professional guidance from PCCs decreases unnecessary visits to emergency
departments and underscores the PCCs’ role as easily accessible and trusted sources of public
health information to prevent and manage poisonings and related health concerns. For example,
PCCs provide education about the safe use of generators during loss of electrical power to reduce
risk of carbon monoxide posioning and death; and when new poisons such as the synthetic
opioid fentanyl enter a community, PCCs help community providers address life threatening
poisonings and provide education to the public. In February 2023, during the train derailment in
Palestine, Ohio, local PCCs provided guidance regarding health risks to the public resulting from
the release of hazardous chemicals and collected near-real-time surveillance data.
Additionally, the PCP supports a national Poison Help media campaign, which provides
education and outreach to the public and health care providers about poison and toxic exposure
prevention, shares the availability of poison control resources in local communities, and
advertises the national toll-free Poison Help line. Key activities include:
• Partnering with health departments to increase awareness of emerging poisoning threats,
and education departments and other state agencies to educate the public on poisoning
prevention;
• Promoting safe prescription medication use and storage; and
• Collaborating to develop media campaigns focused on preventing poisonings.
PCCs also participate in National Prescription Drug Take-Back events to provide a safe,
convenient, and responsible means of prescription drug disposal.
Budget Request
The FY 2025 Budget Request for the Poison Control program of $26.8 million is equal to the FY
2023 Final level. This request will provide 52 grants to the 55 PCCs in the United States. These
grants provide a small base of support to each PCC, contributing on average 13 percent to each
PCC’s overall budget that is needed to maintain infrastructure and core triage and treatment
services.
The FY 2025 request will also continue to support interpretation services for non-English
speaking callers and maintenance of the national toll-free Poison Help line. The nationwide
media campaign will continue to educate the public and health care providers about poisoning
and toxic exposure prevention, the availability of the national toll-free number, and local PCC
services.
The funding request also includes costs associated with the grant review and award process,
follow-up performance reviews, information technology, and other program support costs.
242
243.
Funding HistoryFY
FY 2021
FY 2022
FY 2023
FY 2024 CR
FY 2025 President’s Budget
Amount
$24,846,000
$25,846,000
$26,846,000
$26,846,000
$26,846,000
Program Accomplishments
In 2021, PCCs managed 2.85 million encounters.87 In 2021, drug information requests increased
146 percent compared with 2020. Calls from health care facilities increased 7 percent compared
to 2020, accounting for 24 percent of all human exposure cases in 2021. Sixty-nine percent of
calls originated from residences and were managed by the PCC without requiring emergency
medical attention.
In FYs 2021 and 2022, the Poison Help campaign distributed paid public service
announcements (PSAs) through traditional platforms, including broadcast television networks,
national and regional cable networks, and radio stations. The campaign also distributed the
PSAs on several social media platforms.
Outputs and Outcomes
Measure
5030.02: Number of
calls received each
fiscal year via the
national, toll-free,
Poison Help line
(Output)
Year and Most Recent
Result/
Target for Recent
Result
(Summary of Result)
FY 2022: 2,981,276
Target: Not Defined
(Baseline)
87
FY 2024
Target
FY 2025
Target
2,900,000
2,900,000
FY 2025
+/FY 2024
Maintain
Gummin DD, Mowry JB, Beuhler MC, Spyker DA, Rivers LJ, Feldman R, Brown K, Nathaniel PTP, Bronstein
AC, & Weber JA. (2022). 2021 Annual Report of the National Poison Data System (NPDS) from America’s Poison
Centers: 39th Annual Report. Clinical Toxicology, 60;12:1381-1643.
243
244.
Year and Most RecentResult/
Target for Recent
Result
(Summary of Result)
FY 2025
+/FY 2024
FY 2024
Target
FY 2025
Target
2,150,000
2,130,000
25.III.D.6: Percent of FY 2021: 24%
human exposure calls Target: 24%
made to Poison
(Target Met)
Control Centers that
came from health care
facilities (Output)
Discontinued
Discontinued N/A
5030.01: Percentage
FY 2021: 82%
of inbound volume on Target: 78%
the toll-free number. (Target Exceeded)
(Output)
Discontinued
Discontinued N/A
Measure
5030.03: Number of
human cases of
poison exposure
managed by the
Nation’s Poison
Control Centers
(Output)
FY 2022: 2,064,875
Target: Not Defined
(Baseline)
-20,000
Performance Narrative
For measure 5030.02, the data source for this measure is Verizon Enterprise Information
Solutions (EIS).
For measure 5030.03, the source for this data is the National Poison Data System
(NDPS).
For measure 5030.03, the FY 2025 target is lower than the FY 2024 in alignment with an
overall downward trend over the last ten years. Human exposure cases have decreased
9.24 percent since 2012. The FY 2025 target is consistent with this trend.
244
245.
Grants Awards TableFY 2024
Continuing
Resolution
FY 2023
Final
Number of
Awards88
FY 2025
President’s Budget
52
52
52
Average Awards
$450,523
$450,523
$450,523
Range of Award
$91,632-$2,782,395
$91,632-$2,782,395
$91,632-$2,782,395
FY 2024
Continuing
Resolution
FY 2025
President’s Budget
Contracts Awards Table
FY 2023
Final
Number of
Contracts
2
2
2
Average Contract
$568,358
$584,214
$597,874
Range of Contracts
$565,375-$571,341
$581,796-$586,632
$593,373-$602,375
88
There are 55 Poison Control Centers across the U.S. Fifty-two awards were made in FY 2023 and are anticipated
in FY 2024 under the Poison Control Stabilization and Enhancement Program, representing all of the poison centers.
For grant purposes, HRSA counts the California Poison Control System as a single entity, while it encompasses four
California poison centers.
245
246.
Family-To-Family Health Information CentersFY 2023 Final
FY 2024
Continuing
Resolution
$5,658,000
$5,658,000
---
-$5,658,000
---
---
$12,000,000
+$12,000,000
$5,658,000
1
$5,658,000
1
$12,000,000
2
+$6,342,000
+1
Current Law
Mandatory89
Proposed
Mandatory
Total
FTE
FY 2025
President’s
Budget
FY 2025
+/FY 2023
Authorizing Legislation: Section 501(c)(1)(A) of the Social Security Act, Title V, as amended by
Public Law 116-39, Section 5
FY 2025 Authorization…………………………………………………………Expired
Allocation Method:
• Competitive grant/co-operative agreement
Program Description
The Family-to-Family Health Information Centers (F2F HICs) program offers families of
children and youth with special health care needs (CYSHCN) peer support and information on
accessing care and coverage for their children’s complex needs. Staffed by family members of
CYSHCN with first-hand experience navigating health care and other needed services and
supports for their children, F2F HICs also advise health care professionals on developing more
effective partnerships with families. The program aims to empower families of CYSHCN to be
active partners in health care decision making.
F2F HIC supports include:
• Guidance on building productive relationships between families and health professionals
• Training and guidance for health professionals on caring for CYSHCN
• Promoting F2F HIC services and resources to families, health professionals, schools, etc.
• Engaging families of CYSHCN and health professionals as staff and leaders for these
programs
When it was initially authorized by the Deficit Reduction Act of 2005, the program funded one
F2F HIC in each of the 50 states and the District of Columbia. Since then, HRSA expanded F2F
HICs to all jurisdictions and to Indian tribes. The Sustaining Excellence in Medicaid Act of 2019
(P.L. 116-39) reauthorized the program through 2024.
89
Amount reflects post-sequestration
246
247.
Research supports the effectiveness of the F2F HIC strategy.90 Evidence shows CYSHCNexperience improved health outcomes and cost-savings when families are empowered to make
informed choices about their care and partner with health professionals.91 Outcomes include:
• Improved transition from pediatric to adult health care systems;
• Fewer unmet health needs;
• Better community-based systems;
• Fewer problems with specialty referrals;
• Lowered out-of-pocket costs;
• Improved physical and behavioral health; and
• Increased access to preventive health care in a medical home.
Budget Request
The FY 2025 Budget Request proposes reauthorization and $12 million per year in mandatory
resources for the Family-to-Family Health Information Centers (F2F HIC) program, which is an
additional $6 million per year above the current authorized level. The request will extend and
expand the program for FY 2025 – FY 2029 at $12 million per year for a total of $60 million
over five years. Funding will continue to support patient-centered information, education,
technical assistance, and peer support to families of CYSHCN. Moreover, HHS/HRSA requests
a technical change to provide specific statutory authority to create a technical assistance center
and authorize funding for the center to coordinate and provide intensive technical assistance to
grantees of the F2F HIC program. The technical assistance center would help F2F HICs,
including the newly established territorial and tribal HICs, receive the support necessary to fulfill
their statutory requirements and collect data to evaluate the reach of the program.
Table 1. Proposed Funding (FY 2025 – FY 2029)92
Fiscal Year
FY 2025
FY 2026
FY 2027
FY 2028
FY 2029
Amount
$12,000,000
$12,000,000
$12,000,000
$12,000,000
$12,000,000
Increased funds will allow F2F HIC awardees to serve more families of CYSHCN and expand
their capacity to partner and engage families, providers, and other community and state
stakeholders. F2F HICs will expand activities to support a system of care so that CYSHCN can
play, go to school, and become healthy adults, which aligns with the CYSHCN Blueprint For
Change.93 At this funding level, the F2F HIC program will:
90
Marbell, P. (2017). Engaging families in improving the health care system for children with special health care
needs. Lucile Packard Foundation for Children’s Health
91
Smalley et al. (2014). Family perceptions of shared decision-making with health care providers: Results of the
National Survey of CYSHCN, 2009-2010. Doi 10.1007/s10995-013-1365-z
92
Data in Table 1 represent the total proposed funds per fiscal year for the F2F HIC Program with the increase in
funds to expand the capacity of F2F HIC grantees to reach more communities and families.
93
https://publications.aap.org/pediatrics/issue/149/Supplement%207?autologincheck=redirected
247
248.
Increase the number and availability of family leader staff and peer mentors providing
services to families of CYSHCN in making informed choices about health care.
Increase the amount of individualized, intensive support for families.
Expand the number of awards to tribal organizations from three to eight.
Increase technical assistance through a coordinating center to help F2F HICs nationwide,
including new jurisdictional and tribal F2F HICs, to effectively carry out award activities
and report on their progress.
Current funding provides services to 197,003 families and 92,131 health professionals across 59
family-staffed centers nationwide. With increased funds, HRSA estimates serving approximately
350,000 families of CYSHCN per year. HRSA also estimates that approximately 185,000 health
professionals per year could receive training and resources in the care of CYSHCN. Increased
funds will also support up to 5 additional tribal awards and almost double the award for each F2F
HIC.
The F2F HICs will continue to support targeted outreach and leadership development to specific
underrepresented populations, such as populations living in rural or urban areas, those with
limited English proficiency, and those that reflect other demographic factors. F2F HICs also
continue to develop partnerships with organizations serving underrepresented families.
The F2F HICs will continue to address the long-term impact of COVID-19 by providing
education, guidance, and support to families of CYSHCN on the Medicaid redetermination
process.
The funding request also includes costs associated with the grant review and award process,
follow-up performance reviews, information technology, and other program support costs.
Funding History
FY
FY 2021
FY 2022
FY 2023
FY 2024 CR
FY 2025 President’s Budget
Amount94
$5,658,000
$5,658,000
$5,658,000
$5,658,000
$12,000,000
Program Accomplishments
F2F HICs provided services to 197,003 families according to FY 2022 grantee data reported to
HRSA. FY 2023 survey data reveal that ninety-two percent of families reported that the
information they received from an F2F HIC met their needs and ninety-six percent reported they
would recommend F2F HIC services to another family. Ninety percent of families reported that
94
FY 2021-FY 2024 funding amounts reflect the post-sequestration amount.
248
249.
the information or services received from F2F HICs helped prepare them to work with those whoserve their children.
Additionally, F2F HICs trained and provided information, resources, and referrals to 92,131
health professionals who serve CYSHCN and their families within community and state public
health agencies, managed care and insurance organizations, medical practices, children’s
hospitals, universities, Federally Qualified Health Centers, and more according to FY 2022
grantee data reported to HRSA. FY 2023 survey data show ninety-two percent of professionals
served by an F2F HIC reported they were satisfied with the information and ninety-eight percent
would recommend F2F HIC services to families or other professionals. Ninety-three percent of
professionals reported the information or services received from F2F HICs helped prepare them
to work better with families and/or others who serve CYSHCN.
An objective of the F2F HIC program is to increase the number of individuals from
underrepresented communities trained to partner with families at all levels of decision making.
For example, HRSA funded three tribal organizations since FY 2019. These tribal F2F HICs
have been able to increase their family reach more than eightfold with a reach of 70 families in
FY 2019 (baseline) to 599 families in FY 2022.
Outputs and Outcomes Table
Measure
3100.01: Number of
families with children with
special health care needs
who have been provided
information, education,
and/or training from
Family-to-Family Health
Information Centers
(Outcome)
Year and Most
Recent Result
/Target for
Recent Result /
(Summary of
Result)
FY 2022: 197,003
Target: 200,000
(Target Not Met)
249
FY 2024
Target
210,000
FY 2025
Target
350,000
FY 2025
+/FY 2024
+140,000
250.
Measure3100.02: Number of
professionals who serve
children with special health
care needs who have been
provided information,
education, and/or training
from Family-to-Family
Health Information Centers
(Output)
3100.03: Percentage of
families with children with
special health care needs
served who report that the
information or services
received from Family-toFamily Health Information
Centers helped prepare them
to work with those who
serve their children
(Outcome and
Developmental)
3100.04: Percentage of
professionals served who
reported the information or
services received from the
Family-to-Family Health
Information Centers helped
prepare them to work better
with families of children
with special health care
needs and/or others who
serve children with special
health care needs (Outcome
and Developmental)
Year and Most
Recent Result
/Target for
Recent Result /
(Summary of
Result)
FY 2024
Target
100,000
FY 2025
Target
185,000
FY 2025
+/FY 2024
+85,000
FY 2023: 90%
Target: 90%
(Target Met)
Discontinued
Discontinued
N/A
FY 2023: 93%
Target: 97%
(Target Not Met)
Discontinued
Discontinued
N/A
FY 2022: 92,131
Target: 100,000
(Target Not Met)
250
251.
Performance Narrative• For measures 3100.01 and 3100.02, results were impacted by COVID-19. Additionally,
due to sequestration, F2F HICs received reduced funding in FY 2022 and FY 2023,
impacting the services that they could provide. Starting in FY 2022, HRSA has provided
new guidance to F2Fs to better standardize data collection and reduce potential
duplication in counts.
• The data for measures 3100.03 and 3100.04 are collected from awardee surveys.
• For measure 3100.04, results may have been slightly lower due to the ongoing impacts of
COVID-19. Additionally, reduced funding to F2F HICs due to sequestration and a new
cohort of grantees impacted results.
Grant Awards Table95
FY 2023 Final
Number of Awards
95
FY 2024
Continuing
Resolution
FY 2025 President’s
Budget
59
59
64
Average Award
$83,737
$83,737
$160,000
Range of Awards
$74,469-$89,140
$74,469-$89,140
$160,000
Does not include carryover funding. FY 2023 and FY 2024 reflect post-sequestration funding.
251
252.
Maternal, Infant, and Early Childhood Home Visiting ProgramFY 2023
Final
FY 2024
Continuing
Resolution
FY 2025
President’s
Budget
FY 2025
+/FY 2023
BA96
$500,000,000
$518,650,000
$565,800,000
+$65,800,000
FTE
51
51
51
---
Authorizing Legislation: Section 511 of the Social Security Act, Title V, as amended by Public
Law 117-328, Section 6101
FY 2025 Authorization ................................................................................................$600,000,000
Allocation Methods:
• Direct federal/intramural
• Contract
• Formula grant/co-operative agreement
• Competitive grant/co-operative agreement
Program Description
The Maternal, Infant, and Early Childhood Home Visiting (MIECHV) Program supports
pregnant women and parents with young children who live in communities that face greater risk
and barriers to achieving positive maternal and child health outcomes. The MIECHV Program
builds upon decades of scientific research showing that home visits by a nurse, social worker,
early childhood educator, or other trained professional during pregnancy, and in the first years of
life have the potential to improve the lives of children and families by:
• Helping to prevent child abuse and neglect;
• Encouraging positive parenting;
• Improving maternal and child health; and
• Promoting child development and school readiness.
The MIECHV Program is administered by the Health Resources and Services Administration
(HRSA) in partnership with the Administration for Children and Families. State and jurisdiction
grantees conduct statewide needs assessments to identify eligible at-risk communities, determine
priority populations, and choose one or more of the 23 approved evidence-based home visiting
models or identify promising approaches that will best meet the specific needs of their states and
communities. As part of all MIECHV programs, trained home visiting professionals meet
regularly with expectant parents or families with young children in their homes to build strong,
positive relationships. Home visitors work with families to provide services tailored to their
needs, such as:
• Advising on topics such as breastfeeding, safe sleep, injury prevention, and nutrition.
96
FY 2024 and FY 2025 reflect the post-sequestration funding amount.
252
253.
Screening and providing referrals to address caregiver depression, substance abuse, and
family violence.
Screening children for developmental delays and facilitating early diagnosis and
intervention for autism and other developmental disabilities.
Teaching parenting skills and modeling effective parenting techniques.
Creating a language-rich environment that stimulates early language development.
Consistent with the statute, HRSA distributes MIECHV funds through base and matching grants
to states, jurisdictions, and nonprofit organizations and ACF distributes MIECHV funds through
competitive cooperative agreements to Indian tribes, tribal organizations, and urban Indian
organizations. Statute sets aside funds for other purposes, such as technical assistance, workforce
supports, including the Jackie Walorski Center for Evidence-Based Case Management, and
research, evaluation, and federal administration.
• Base Grants: In FY 2023, HRSA awarded $435 million in MIECHV base grants to 56
states, jurisdictions, and nonprofit organizations. Grants are generally administered by the
lead state agency for home visiting designated by the Governor, or they can be
competitively awarded to a nonprofit organization in those states or jurisdictions that
opted not to participate in the grant program. By law, state and jurisdictional grantees
must spend the majority of their MIECHV funds to implement evidence-based home
visiting models, with up to 25 percent of funding available to implement promising
approaches that undergo rigorous evaluation.
• Tribal Awards: Six percent of total MIECHV funding is reserved for grants to Indian
tribes, tribal organizations, and urban Indian organizations. In FY 2023, funding
supported 41 awards to tribal entities through the Tribal MIECHV Program. The
program:
o Develops and strengthens tribal capacity to support and promote the health and
well-being of American Indian and Alaska Native families through home visiting
programs;
o Expands the evidence base around home visiting in tribal communities; and
o Supports and strengthens cooperation and linkages between programs that serve
Native children and their families.
Budget Request
The Maternal, Infant, and Early Childhood Home Visiting (MIECHV) Program is funded at
$565.8 million in FY 2025, with sequestration, and funding will increase incrementally up to
$800 million in FY 2027. Funding will continue to support the state, jurisdictional, and tribal
administration of locally-run, voluntary, evidence-based home visiting services that have been
proven to help prevent child abuse and neglect, encourage positive parenting, and promote child
development and school readiness. In FY 2025, This level of funding will provide:
• Awards to 54 state and territory grantees and two non-profit organizations.
• Awards to approximately 45 tribal entities.
• Technical assistance for state, jurisdictional, and tribal MIECHV grantees.
• Support for the home visiting workforce, workforce retention, and case management,
including workforce-related technical assistance and the establishment and operation of
the Jackie Walorski Center for Evidence-Based Case Management.
253
254.
Support for research, evaluation, and federal administration.
Table 1. Mandatory Funding (FY 2023 – FY 2027)97
MIECHV Program
FY 2023
FY 202498
FY 202599
FY 2026
FY 2027
Five-Year
Total
Mandatory Funding
$500,000,000
$550,000,000
$600,000,000
$650,000,000
$800,000,000
$3,100,000,000
The increase in funds will expand the capacity of MIECHV grantees to reach more communities
and families. Currently, MIECHV-funded programs serve over 70,000 families, reaching
approximately 14 percent of the more than 488,000 families who are likely currently eligible and
in need of MIECHV services.100 Over 5 years, funding increases will allow MIECHV-funded
programs to provide comprehensive, coordinated home visiting services to additional
communities and families through targeted evidence-based home visiting.
The increased appropriations may be used by states and jurisdictions to expand services to
additional communities and families. Funds will also support the recruitment and retention of the
home visiting workforce, including increasing home visitor supports, and training and hiring a
diverse workforce. Additionally, in FY 2025, up to 6 new awards will be made to tribal entities
to expand services to additional tribal communities.
Funds will continue to support a portfolio of research and evaluation on home visiting, technical
assistance to ensure families have access to quality evidence-based and promising home visiting
service delivery models, and workforce supports to ensure a well-trained and stable workforce.
The funding request also includes costs associated with the grant review and award process,
follow-up performance reviews, and information technology and other program support costs.
Funding History
FY
FY 2021
FY 2022
FY 2023
FY 2024
FY 2025
Amount101
$377,200,000
$377,200,000
$500,000,000
$518,650,000
$565,800,000
FY 2024 – FY 2027 subject to sequestration
Appropriation as provided through the Consolidated Appropriations Act, 2023 (Public Law 117-328, Section
6101). However, FY24 post-sequestration amount is $518.7 million..
99
Appropriation as provided through the Consolidated Appropriations Act, 2023 (Public Law 117-328, Section
6101). However, FY25 post-sequestration amount is $565.8 million.
97
98
100
101
HRSA internal analysis using 2022 Current Population Survey data.
Reflects post-sequestration amounts in FY 2021, FY 2022, FY 2024, and FY 2025.
254
255.
Program AccomplishmentsMIECHV state and jurisdictional grantees provided over 9.7 million visits from FY 2012 through
FY 2023. In FY 2023, states reported serving more than 139,000 parents and children in over
1,000 counties across all 50 states, the District of Columbia, and 5 territories. This is more than a
300 percent increase in the number of participants served since FY 2012 (see Table 1 below).
Tribal grantees provided over 180,800 home visits from FY 2012 to FY 2023 and served more
than 3,400 parents and children in FY 2023.
Table 1: Number of State/Jurisdictional Participants and Home Visits (FY 2012 – FY
2023)102
Fiscal Year
2012
2013
2014
2015
2016
2017103,104
2018105
2019
2020106
2021107
2022108
2023109
Number of Participants
34,180
75,970
115,545
145,561
160,374
156,297
150,291
154,496
140,606
140,674
137,802
139,695
Number of Home Visits
174,257
489,363
746,303
894,347
979,521
942,676
930,595
1,015,217
928,130
921,706
841,694
919,456
The MIECHV Program helps families living in at-risk communities. In FY 2023:
102
Data in Table 1 represent the number of participants and home visits provided by state and jurisdictional grantees
(does not include tribal data).
103
Reflects changes HRSA made to reporting definitions beginning in FY 2017 clarifying that only participants
whose services were directly supported with federal funds should be included in MIECHV reports.
104
Does not include data from Puerto Rico and the U.S. Virgin Islands due to reporting delays caused by Hurricanes
Maria and Irma.
105
Does not include data from the Commonwealth of the Northern Mariana Islands due to reporting delays caused
by Super Typhoon Yutu.
106
FY 2020 results were impacted by funding cuts due to sequestration, the impacts of COVID-19 on enrollment
and service delivery, and a reporting error in one state.
107
FY 2021 results were impacted by funding cuts due to sequestration and the impacts of COVID-19 on enrollment
and service delivery.
108
FY 2022 results were impacted by funding cuts due to sequestration, the impacts of COVID-19 on enrollment
and service delivery, and significant issues with workforce recruitment and retention across the early childhood care
and education field.
109
FY 2023 results were impacted by funding cuts due to sequestration and significant issues with workforce
recruitment and retention across the early childhood care and education field.
255
256.
67 percent of participating families had household incomes at or below 100 percent of the
federal poverty guidelines110 ($30,000 for a family of four), and 40 percent were at or
below 50 percent of those guidelines.
22 percent of adult program participants had less than a high school education, and 39
percent had only a high school degree or equivalent.
8 percent of households included pregnant teens; 18 percent of households reported a
history of child abuse and maltreatment; and 14 percent of households reported substance
abuse.
In FY 2020, all state and jurisdictional grantees showed performance improvement in at least
four of the six MIECHV benchmark areas outlined in statute:111
• Improving maternal and newborn health.
• Preventing child injuries, maltreatment, and emergency department visits.
• Improving school readiness and achievement.
• Reducing crime or domestic violence.
• Improving family economic self-sufficiency.
• Improving service coordination and referrals for other community resources and
supports.
Outputs and Outcomes Table
Measure
3110.04: Percentage of
children enrolled in the
Maternal, Infant, and
Early Childhood Home
Visiting (MIECHV)
Program who received
daily early language and
literacy support from a
family member
(Outcome)
Year and Most
Recent Result
/Target for
Recent Result
(Summary of
Result)
FY 2023: 80.2%
Target: 71.5%
(Target Exceeded)
110
FY 2024
Target
72.3%
FY 2025
Target
75.9%
FY 2025
+/FY 2024
+3.6
percentage
points
The HHS Poverty Guidelines are updated annually in February and published in the Federal Register. See
https://aspe.hhs.gov/poverty-guidelines
111
Section 511 of the Social Security Act [42 U.S.C. 711] includes statutory requirements for demonstration of
improvements. https://www.ssa.gov/OP_Home/ssact/title05/0511.htm.
256
257.
Measure3110.05: Percentage of
parents enrolled in the
Maternal, Infant, and
Early Childhood Home
Visiting (MIECHV)
Program who were
screened for depression
after enrollment or after
giving birth (Outcome)
3110.06: Number of
home visits to families
receiving services under
the State/Jurisdiction
Maternal, Infant, and
Early Childhood Home
Visiting (MIECHV)
Program (Output)
3110:07: Number of
home visits to families
receiving services under
the Tribal Maternal,
Infant, and Early
Childhood Home
Visiting Program.
(Output)
3110.08: Number of
participants served by
the State/Jurisdiction
Maternal, Infant, and
Early Childhood Home
Visiting (MIECHV)
Program
(Outcome)
Year and Most
Recent Result
/Target for
Recent Result
(Summary of
Result)
FY 2023: 80.3%
Target: 78.7%
(Target Exceeded)
FY 2025
+/FY 2024
+0.7
percentage
points
FY 2024
Target
78.8%
FY 2025
Target
79.5%
FY 2023: 919,456
Target: 1,051,345
(Target Not Met)
1,201,701
1,310,957
+109,256
FY 2023: 19,532
Target: 19,271
(Target Exceeded)
22,036
36,000
+13,964
FY 2023: 139,695
Target: 164,470
(Target Not Met)
167,096
189,498
+22,402
257
258.
Measure3110.09: Number of
participants served by
the Tribal Maternal,
Infant, and Early
Childhood Home
Visiting (MIECHV)
Program
(Outcome)
3110.02: Number and
percent of grantees that
meet benchmark area
data requirements for
demonstrating
improvement
(Outcome)
Year and Most
Recent Result
/Target for
Recent Result
(Summary of
Result)
FY 2023: 3,432
Target: 3,871
(Target Not Met)
FY 2024
Target
4,427
FY 2025
Target
6,500
FY 2025
+/FY 2024
+2,073
State/ Jurisdiction Discontinue
FY 2020: 56
(100%)
Target: 47 (84%)
(Target Exceeded)
Discontinue
N/A
Tribal
FY 2020: 14
(74%)
Target: 22 (88%)
(Target Not Met)
Performance Narrative
A home visit is the service provided by qualified professionals, delivered over time
within the home to build relationships with the enrolled caregiver and the index child to
achieve improved child and family outcomes. The number of “home visits” in measures
3110.06 and 3110.07 demonstrate the level of effort and service utilization for all
enrollees and index children participating in the MIECHV Program.
The data source for measure 3110.01 through 3110.06, and 3110.08, is the Home Visiting
Information System (HVIS). Results reflect the most recent data available for state,
jurisdictional, and Tribal grants.
The results for 3110.02 reflect the most recent data available as the information is
updated every 3 years.
The results for 3110.04 and 3110.05 reflect the most recent data available, including state
and jurisdictional grants only, and reflect a two-year average from FY 2022 and FY 2023.
The targets were not met for 3110.06 and 3110.08 due to factors such as: significant
issues with workforce recruitment and retention across the early childhood care and
education field.
The target was not met for 3110.09 due to factors such as challenges with family and
staff recruitment and retention.
258
259.
Grant Awards Tables112,113FY 2023 Final
Number of Awards
Average Award
Range of Awards
FY 2025 President’s
Budget
FY 2024
98
103
109
$4,762,194
$4,674,393
$4,813,761
$275,000-27,244,590
$250,000$27,892,590
$250,000$29,842,147
112
The table does not include carryover funding.
Award projections are based on a funding formula codified in statute (Social Security Act, Title V, as amended
by Public Law 117-328, Section 6101).
113
259
260.
RYAN WHITEHIV/AIDS
TAB
260
261.
RYAN WHITE HIV/AIDSProgram Description
The Ryan White HIV/AIDS Program (RWHAP) funds and coordinates with states,
cities/counties, and local clinics/community-based organizations to deliver efficient and effective
HIV care, treatment, and support to low-income people with HIV. Over 58 percent of RWHAP
clients (patients) live at or below 100 percent of the federal poverty level and over three-quarters
of clients are from racial and ethnic minority groups.114 The RWHAP statute requires that the
program is the “payor of last resort,” meaning RWHAP funds can only be used for allowable
services not covered by other federal115 or state programs, or private insurance. Since 1990, the
RWHAP has developed a comprehensive system of safety net providers who deliver high-quality
direct health care and support services to over half a million people with HIV – more than half of
all people with diagnosed HIV in the United States.116 This is one of the many reasons why the
Health Resources and Services Administration (HRSA) is leading key components of the Ending
the HIV Epidemic in the U.S. (EHE) initiative.
Working within the parameters of the RWHAP statute, funding priorities are guided by
stakeholders at federal, state, and local levels, resulting in uniquely structured programs that
address their jurisdictions’ critical gaps and needs. HRSA also works in partnership with
RWHAP recipients at state and local levels to use innovative, evidence informed approaches for
community engagement, needs assessment, planning processes, policy development, service
delivery, clinical quality improvement, and workforce development activities that are needed to
support a robust system of HIV care, treatment, and support services.
The RWHAP has five statutorily defined Parts that provide grants to states, cities/counties, and
community-based organizations. The grants fund medical and support services, medication,
technical assistance, clinical training, and the development of innovative models of care to meet
the needs of priority populations and their communities affected by HIV. Together, these Parts
provide the public health infrastructure to ensure low-income people with HIV have access to a
wide range of services aimed at early diagnosis of HIV, linkage to care, retention in care,
medically appropriate treatment, and sustained viral suppression. These successive steps that
people with HIV experience from diagnosis to reaching and maintaining viral suppression is
referred to as the HIV care continuum.
The HIV care continuum is crucial to ensure optimal health outcomes for people with HIV. It
also helps policymakers and service providers better pinpoint where gaps in services might exist,
develop strategies to better support people with HIV to achieve the treatment goal of viral
suppression, and prevent further transmission of the virus. It also furthers the public health goal
of ending the HIV epidemic in the United States.117 An overwhelming body of clinical evidence
114
HRSA. Ryan White HIV/AIDS Program Annual Client-Level Data Report 2022. http://hab.hrsa.gov/data/datareports. Published December 2023. Accessed December 2023.
115
The Indian Health Service is statutorily exempted from the payor of last resort provision.
116
CDC. HIV Surveillance Report, 2021; vol. 34. http://www.cdc.gov/hiv/library/reports/hiv-surveillance.html.
Published May 2023. Accessed December 2023.
117
The goal of HIV treatment is to decrease viral load in people with HIV, ideally to an undetectable level, known
as viral suppression. When viral suppression is achieved and maintained, the risk of transmitting HIV is reduced.
261
262.
has firmly established that a person with HIV who is in treatment and has an undetectable viralload cannot sexually transmit HIV (referred to as Undetectable Equals Untransmittable, or
U=U).118,119
Not only do improved viral suppression rates reduce the transmission of HIV, but they also result
in significant cost-savings to the health care system. In the RWHAP, 89.6 percent of patients
receiving RWHAP medical care are virally suppressed, far exceeding the 68.8 percent rate of
viral suppression for the general population of people with diagnosed HIV ̶ an outcome measure
that demonstrates the success of the program and results in major public health benefits.120 These
results align with a study published in Clinical Infectious Diseases, which found that clients
receiving care and support at RWHAP-funded facilities are associated with improved outcomes
(such as viral suppression), compared to those not served by the RWHAP. 121 Furthermore,
RWHAP patients are more likely to reach viral suppression regardless of other health care
coverage (e.g., uninsured, Medicaid, Medicare, or private insurance).
Today, with advances in antiretroviral therapy, people with HIV are living longer and healthier
lives. However, even with these positive outcomes, ending the HIV epidemic domestically
continues to be a challenge. The Centers for Disease Control and Prevention (CDC) estimates
that over 1 million people in the United States have HIV, and 1 in 8 are unaware of their HIV
status.122 In addition, over 36,000 new HIV diagnoses occur every year.123
Ending the HIV Epidemic in the U.S.
In February 2019, the Ending the HIV Epidemic in the U.S (EHE) initiative was launched to
further expand federal efforts to reduce HIV infections. The multi-year EHE initiative currently
focuses on 48 counties, Washington, D.C., and San Juan (Puerto Rico), which account for more
than half of new HIV diagnoses, and seven states that have a substantial rural HIV burden. The
initiative will continue to bring the additional expertise, technology, and resources needed to end
the HIV epidemic in the United States. EHE recipients made significant progress to implement
their EHE initiative activities, despite challenges posed by the COVID-19 pandemic. These
activities included developing service delivery infrastructure, engaging with community
members and new partners, and delivering services to clients. The RWHAP’s comprehensive
system of HIV care and support services and effective system for medication delivery creates a
very efficient and effective service delivery mechanism for this initiative.
118
NIAID. Preventing Sexual Transmission of HIV with Anti-HIV Drugs. National Library of Medicine (US). 2000[cited 2016 Mar 29]. Available from: ClinicalTrials.gov. NLM Identifier: NCT00074581.
119
Rodger AJ et al for the PARTNER study group. Sexual activity without condoms and risk of HIV transmission in
serodifferent couples when the HIV-positive partner is using suppressive antiretroviral therapy. JAMA,
2016;316(2):1-11. DOI: 10.1001/jama.2016.5148. (12 July 2016). Full free access.
120
CDC. Monitoring selected national HIV prevention and care objectives by using HIV surveillance data—United
States and 6 dependent areas, 2021. https://www.cdc.gov/hiv/library/reports/hiv-surveillance/vol-28-no4/index.html. Accessed February 2024.
121
Bradley H, Viall AH, Wortley PM, Dempsey A, Hauck H, Skarbinski J. Ryan White HIV/AIDS Program
Assistance and HIV Treatment Outcomes. Clin Infect Dis. (2016) 62 (1): 90-98.
122
CDC. Estimated HIV incidence and prevalence in the United States 2017–2021. HIV Surveillance Supplemental
Report 2023;28(3). Accessed December 2023.
123
CDC. HIV Surveillance Report, 2021; vol. 34. http://www.cdc.gov/hiv/library/reports/hiv-surveillance.html.
Published May 2023. Accessed December 2023.
262
263.
Mpox Public Health EmergencyOn August 4, 2022, the mpox outbreak was declared a public health emergency in the United
States. Gay, bisexual, men who have sex with men (MSM), and transgender individuals were
particularly affected by this outbreak. Due to the disproportionate impact of the mpox public
health emergency on the populations to which the RWHAP provides HIV care and treatment,
HRSA was allotted mpox vaccines for rapid distribution to RWHAP recipients. HRSA also
provided RWHAP recipients responding to the outbreak with testing, treatment, and vaccine
administration guidance. This includes access to treatment for sexually transmitted infections
(STIs) through the RWHAP AIDS Drug Assistance Program (ADAP).
Additional Collaborative Efforts
In FY 2025, the RWHAP will continue to ensure effective use of resources and a coordinated
and focused public health response to HIV. The RWHAP will also continue to coordinate and
collaborate with other federal, state, and local entities as well as external HIV organizations to
further leverage and promote efforts to address the unmet care and treatment needs of people
with HIV who are uninsured and underserved. These efforts help to align priorities, policies, and
activities in sustaining a multi-faceted and comprehensive federal response to the HIV epidemic.
Department of Health and Human Services (HHS) partners include the Office of the Assistant
Secretary for Health (OASH), CDC, Substance Abuse and Mental Health Services
Administration (SAMHSA), Centers for Medicare and Medicaid Services (CMS),
Administration for Community Living (ACL), Indian Health Service (IHS), National Institutes
of Health (NIH), Agency for Healthcare Research and Quality (AHRQ), as well as HRSA’s
Bureau of Primary Health Care, Federal Office of Rural Health Policy (FORHP), Office for the
Advancement of Telehealth (OAT), and Office of Intergovernmental and External Affairs
(IEA). Other federal agency partners include the Department of Housing and Urban
Development (HUD), Department of Veterans Affairs (VA), and Department of Justice (DOJ).
The RWHAP has developed a coordinated implementation response that outlines the specific
actions that HRSA will take to achieve the goals and objectives that are outlined in the National
HIV/AIDS Strategy and accelerate efforts toward ending the HIV epidemic.124 The Strategy
builds on the targets for the EHE initiative by 2030 and reflects the Administration’s
commitment to re-energize and strengthen a whole-of-society response to the epidemic while
supporting people with HIV and reducing HIV-associated morbidity and mortality.
The RWHAP will also coordinate with federal partners, grant recipients, and other partners to
address the syndemics (epidemics that closely interact with each other) of HIV, viral hepatitis,
STIs, and substance use disorders through the following HHS efforts:
124
Sexually Transmitted Infections (STI) National Strategic Plan for the United States:
2021-2025: The STI plan will develop, enhance, and expand STI prevention and care
programs through 2025, with the aim of reversing the dramatic rise in STIs in the United
States.
The White House. 2021. National HIV/AIDS Strategy for the United States 2022-2025. Washington, DC.
263
264.
125Viral Hepatitis National Strategic Plan for the United States:2021-2025: The Viral
Hepatitis plan is intended to serve as a comprehensive, data-driven roadmap for federal
and other stakeholders to reverse the rates of viral hepatitis, prevent new infections,
improve care and treatment, and ultimately eliminate viral hepatitis as a public health
threat in the United States.
HHS Roadmap for Behavioral Health Integration: In alignment with HHS’s strategy to
advance behavioral health care in the most underserved and rural communities, HRSA
will continue to work collaboratively with other federal partners to address opioid use
disorder screening, treatment, and support for people with HIV.
HHS Office of Infectious Disease Policy Syndemic Steering Committee: This committee
will identify cross-agency policy and programmatic opportunities and collaborative
approaches to address challenges, including gaps at the federal and jurisdictional levels;
develop cross-departmental/agency policies, programs, or initiatives that capitalize on
opportunities and address challenges; and apply a syndemic approach and focus on
reducing disparities. CDC and HRSA are collaborating to help encourage the delivery of
status neutral services to provide comprehensive care for all people, regardless of HIV
status at the jurisdictional level to address disparities, address social determinants of
health, and reduce HIV stigma efficiently and effectively.
CDC/HRSA Advisory Committee on HIV, Viral Hepatitis and STD Prevention and
Treatment (CHAC): HRSA will continue to partner with CDC to convene the CHAC,
which advises the Secretary of HHS on objectives, strategies, policies, and priorities for
HIV, viral hepatitis, and STI prevention and treatment efforts for the nation. The CHAC
is governed by the provisions of the Federal Advisory Committee Act, as amended, 5
U.S.C. App 2.
The National Syphilis and Congenital Syphilis Syndemic (NSCSS) Federal Task Force:
The NSCSS Federal Task Force was established in 2023 in response to the recent
significant rise in Syphilis cases. The group’s mission is to leverage broad federal
resources to reduce rates, promote health equity, and share resources with impacted
communities. The CHAC informs this effort through regular consultations with national
and local experts within state and local health departments and with national groups who
are focused on reducing STIs and improving health outcomes for pregnant people and
babies.
Federal Strategic Plan to Prevent and End Homelessness125: HRSA, HUD, and CDC are
working together to enhance access to HUD-assisted housing for people with HIV and
impacted communities, with particular emphasis on the priority populations identified in
the National HIV/AIDS Strategy. HRSA and HUD will continue to work closely together
to cross-train staff and recipients, inform RWHAP technical assistance, and advance
RWHAP Special Projects of National Significance (SPNS) housing-related initiatives.
Opening Doors: Federal Strategic Plan to Prevent and End Homelessness
264
265.
Leveraging Collaboration between the RWHAP and Aging Agencies: Enhancing Support
Services for Older Adults with HIV: Aging with HIV is an important topic for the
RWHAP; approximately half of people served by the program are 50 years and older.
HRSA and ACL have continued to collaborate and share information to improve the
assessment of psychosocial needs and delivery of health care for older adults with HIV so
that they may age with dignity and independence and have access to a broad array of
services. Health and other concerns change as people with HIV grow older, requiring
different approaches and services from health care and social services providers. In FY
2022, HRSA launched the Emerging Strategies to Improve Health Outcomes for People
Aging with HIV initiative, which was funded through the RWHAP SPNS to conduct the
following activities:
o Implement emerging strategies that comprehensively screen and manage
comorbidities, geriatric conditions, behavioral health, and psychosocial needs of
people 50 years and older with HIV.
o Assess the uptake and integration of emerging strategies.
o Research and assess implementation processes, including assessing specific
implementation strategies.
o Research and assess broader contextual factors affecting implementation.
o Evaluate the impact of the emerging strategies.
o Document and disseminate the emerging strategies.
265
266.
RWHAP Part A - Emergency Relief GrantsFY 2023
Final
FY 2024
Continuing
Resolution
FY 2025
President’s
Budget
BA
$680,752,000
$680,752,000
$680,752,000
---
MAI (non-add)
$54,105,000
$54,105,000
$54,105,000
---
61
61
61
---
FTE
FY 2025
+/FY 2023
Authorizing Legislation: Public Health Service Act, Section 2601, as amended by Ryan White
HIV/AIDS Treatment Extension Act of 2009, Public Law 111-87.
FY 2025 Authorization……………………………………………….……………..…….Expired
Allocation Method:
• Formula Grants
• Competitive Grants/Cooperative Agreements
• Contracts
Program Description
RWHAP Part A provides grants to cities with a population of at least 50,000, which are areas
severely affected by the HIV epidemic. These jurisdictions are funded as either an Eligible
Metropolitan Area (EMA) or a Transitional Grant Area (TGA), depending on the severity of the
epidemic in their jurisdiction. EMAs are jurisdictions with 2,000 or more AIDS cases over the
last five years as reported to CDC, while TGAs are jurisdictions with at least 1,000 but fewer
than 2,000 AIDS cases over the last five years as reported to CDC. Nearly 70 percent of all
people with diagnosed HIV reside in a RWHAP Part A EMA or TGA. 126,127
The RWHAP requires EMAs and TGAs to utilize local needs assessments and planning
processes to develop coordinated systems of HIV care to improve health outcomes for lowincome people with HIV, thereby reducing transmission of HIV. These grants assist eligible
areas in developing and enhancing access to a comprehensive continuum of high quality,
community-based care for low-income people with HIV, and more broadly support the HHS
goals to protect and strengthen equitable access to high quality and affordable healthcare.
126
CDC. HIV Surveillance Report, 2021; vol. 34. http://www.cdc.gov/hiv/library/reports/hiv-surveillance.html.
Published May 2023. Accessed December 2023.
127
CDC. HIV and stage 3 (AIDS) classifications data through December 2021 provided for the Ryan White
HIV/AIDS Program, for fiscal year 2023. HIV Surveillance Supplemental Report 2023;28 (No. 6):
http://www.cdc.gov/hiv/library/reports/hiv-surveillance.html. Published September 2023. Accessed December 2023.
266
267.
RWHAP Part A funding prioritizes primary medical care, access to antiretroviral treatment, andother core medical and supportive services to engage and retain people with HIV in care. These
grants fund systems of care to provide services for people with HIV in 24 EMAs and 28 TGAs.
Two-thirds of the funds available for EMAs and TGAs are awarded according to a formula,
based on the number of people diagnosed with HIV in the EMAs and TGAs. The remaining
funds are awarded as discretionary supplemental grants based on the demonstration of additional
need by the eligible EMAs and TGAs, and as Minority AIDS Initiative (MAI) grants. The MAI
funds are a statutory set-aside to evaluate and address the disproportionate impact of HIV on, and
the disparities in access, treatment, care, and outcomes for, racial and ethnic minorities. MAI
funds are also awarded based on a formula utilizing the number of minorities with diagnosed
HIV and AIDS in a jurisdiction and support HIV care, treatment, and support services.
Ending the HIV Epidemic in the U.S. - RWHAP Part A Jurisdictions
Thirty-nine of the RWHAP Part A jurisdictions received a cooperative agreement to implement
EHE initiative activities related to strategy two (Treat) and strategy four (Respond) in FY 2023.
This initiative is now in its fourth year and jurisdictions utilize their existing infrastructure to
implement effective and innovative strategies, interventions, approaches, and services to reduce
new HIV infections in the United States.
Budget Request
The FY 2025 Budget Request for the RWHAP Part A of $680.7 million is equal to the FY 2023
Final level. This requested funding level will support the provision of core medical and support
services for people with HIV in the 24 EMAs and 28 TGAs.
RWHAP Part A jurisdictions are experienced in developing data-driven, community-based needs
assessments and responsive procurement of a variety of direct medical and supportive services,
working across service providers to develop and maintain a system of services, and serving
diverse populations. Approximately 65 percent of all RWHAP clients are served by one of the 52
cities funded under the RWHAP Part A. Nearly 70 percent of all people with diagnosed HIV
reside within these metropolitan areas. The RWHAP serves populations that have multiple
structural barriers to care (e.g., people with HIV at or below 100 percent of the federal poverty
level and/or those who are homeless).
Part A funding contributes to achieving the FY 2025 targets for performance goals that relate to
cross-cutting activities, such as the total clients served and percentage of clients (total, minority,
and female clients) who reached viral suppression.
The funding request also includes costs associated with the grant review and award process,
follow-up performance reviews, information technology, and other program support costs.
267
268.
Funding History128Fiscal Year
FY 2021
FY 2022
FY 2023
FY 2024 CR
FY 2025 President’s Budget
Amount
$655,706,000
$670,458,000
$680,752,000
$680,752,000
$680,752,000
Program Accomplishments129
The RWHAP Part A has contributed to the tremendous progress the RWHAP has made toward
ending the HIV epidemic in the United States. From 2010 to 2022, HIV viral suppression among
RWHAP patients has increased from 69.5 percent to 89.6 percent, and racial and ethnic, agebased, and regional disparities have decreased. However, even with these positive outcomes,
fully addressing the HIV epidemic domestically continues to be a challenge. The CDC estimates
that more than 1 million people in the United States have HIV, and 1 in 8 are unaware of their
HIV status. In addition, over 36,000 new HIV diagnoses occur every year.
An overwhelming body of clinical evidence has firmly established that a person with HIV who is
in treatment and has an undetectable viral load cannot sexually transmit HIV (referred to as
Undetectable Equals Untransmittable, or U=U). Not only do improved viral suppression rates
reduce the transmission of HIV, but they also result in significant cost-savings to the health care
system.130 In the RWHAP, 89.6 percent of patients receiving RWHAP medical care are virally
suppressed, far exceeding the 68.8 percent rate of viral suppression for the general population of
people with diagnosed HIV ̶ an outcome measure that demonstrates the success of the program
and results in major public health benefits.
These results align with a study published in Clinical Infectious Diseases, which found that
clients receiving care and support at RWHAP-funded facilities are associated with improved
outcomes (such as viral suppression), compared to those not served by the RWHAP.
Furthermore, RWHAP patients are more likely to reach viral suppression regardless of other
health care coverage (e.g., uninsured, Medicaid, Medicare, or private insurance).
Outputs and Outcomes Table
RWHAP Part A, Part B, Part C, and Part D (includes Ending the HIV Epidemic initiative)
contribute to over-arching performance measures. The Outputs and Outcomes Table containing
these measures is located at the end of this document.
128
EHE funding is not included in this table.
See Program Description at the beginning of the RWHAP section for citations to the data contained in this
section.
130
Schackman BR, Fleishman JA, Su AE, et al. The lifetime medical cost savings from preventing HIV in the United
States. Med Care. 2015;53(4):293-301. doi:10.1097/MLR.0000000000000308.
129
268
269.
Grant Awards TableFY 2024
Continuing
Resolution
FY 2023 Final
Number of Awards
FY 2025
President’s Budget
52
52
52
Average Award
$12,588,838
$12,588,838
$12,588,838
Range of Awards
$2,862,396 –
$93,371,588
$2,862,396 –
$93,371,588
$2,832,860 –
$93,371,588
RWHAP Part A – FY 2023 Formula, Supplemental & MAI Grants131
Table 1. Eligible Metropolitan Areas
EMAs
Formula
Atlanta, GA
Baltimore, MD
Boston, MA
Chicago, IL
Dallas, TX
Detroit, MI
Ft. Lauderdale, FL
Houston, TX
Los Angeles, CA
Miami, FL
Nassau-Suffolk, NY
New Haven, CT
New Orleans, LA
New York, NY
Newark, NJ
Orlando, FL
Philadelphia, PA
Phoenix, AZ
$18,917,541
$9,379,886
$9,631,166
$17,129,329
$12,602,639
$6,143,551
$9,998,943
$16,344,668
$28,454,673
$16,452,284
$3,299,547
$3,218,051
$4,777,447
$53,670,400
$7,243,226
$6,979,409
$13,491,782
$6,712,457
131
Supplemental
$9,650,306
$5,531,358
$4,583,523
$8,381,464
$6,359,551
$3,168,750
$5,031,135
$7,997,483
$14,530,209
$8,484,983
$1,969,743
$1,908,393
$2,851,515
$31,694,250
$4,247,289
$3,575,228
$7,793,626
$3,377,484
MAI
Total
$2,759,413
$1,438,923
$1,013,919
$2,332,182
$1,602,278
$823,090
$1,264,151
$2,382,116
$3,675,690
$2,621,581
$424,261
$419,527
$624,186
$8,006,938
$1,153,514
$874,974
$1,886,480
$657,971
$31,327,260
$16,350,167
$15,228,608
$27,842,975
$20,564,468
$10,135,391
$16,294,229
$26,724,267
$46,660,572
$27,558,848
$5,693,551
$5,545,971
$8,253,148
$93,371,588
$12,644,029
$11,429,611
$23,171,888
$10,747,912
Awards to EMAs and TGAs include prior year unobligated balances.
269
270.
EMAsSan Diego, CA
San Francisco, CA
San Juan, PR
Tampa-St. Petersburg,
FL
Washington, DC-MDVA-WV
West Palm Beach, FL
Subtotal EMAs
Formula
Supplemental
MAI
Total
$7,492,416
$9,169,877
$6,161,313
$6,710,890
$3,807,283
$5,265,620
$3,635,272
$3,363,454
$773,155
$750,880
$1,092,442
$704,750
$12,072,854
$15,186,377
$10,889,027
$10,779,094
$19,181,358
$10,656,379
$2,814,452
$32,652,189
$4,392,430
$297,555,283
$2,556,251
$160,420,549
$612,398
$40,709,271
$7,561,079
$498,685,103
Table 2. Transitional Grant Areas
TGAs
Austin, TX
Baton Rouge, LA
Bergen-Passaic, NJ
Charlotte-Gastonia, NC-SC
Cleveland, OH
Columbus, OH
Denver, CO
Formula
$3,374,977
$2,756,565
$2,312,410
$4,074,008
$2,956,360
$3,070,528
$4,864,674
Supplemental
$1,774,600
$1,479,597
$1,362,359
$2,041,517
$1,580,592
$1,580,916
$2,538,660
MAI
$388,620
$436,141
$331,445
$598,754
$380,266
$304,900
$394,838
Total
$5,538,197
$4,672,303
$4,006,214
$6,714,279
$4,917,218
$4,956,344
$7,798,172
Fort Worth, TX
Hartford, CT
Indianapolis, IN
Jacksonville, FL
Jersey City, NJ
Kansas City, MO
Las Vegas, NV
Memphis, TN
Middlesex-Somerset-Hunterdon, NJ
Minneapolis-St. Paul, MN
$3,258,806
$1,776,119
$2,955,859
$3,744,522
$2,833,178
$2,783,105
$4,399,488
$4,171,652
$1,667,459
$3,800,605
$1,727,639
$1,035,049
$1,559,347
$1,944,568
$1,653,516
$1,471,830
$2,318,780
$2,132,934
$958,628
$2,003,135
$423,611
$236,959
$326,526
$509,837
$437,348
$282,810
$507,424
$685,073
$236,309
$389,269
$5,410,056
$3,048,127
$4,841,732
$6,198,927
$4,924,042
$4,537,745
$7,225,692
$6,989,659
$2,862,396
$6,193,009
Nashville, TN
Norfolk, VA
Oakland, CA
$2,876,743
$3,640,870
$4,470,093
$1,477,402
$1,851,687
$2,350,423
$312,047
$527,472
$578,706
$4,666,192
$6,020,029
$7,399,222
Orange County, CA
Portland, OR
$4,110,562
$2,638,892
$2,217,049
$1,350,675
$476,702
$152,032
$6,804,313
$4,141,599
270
271.
TGAsRiverside-San Bernardino, CA
Sacramento, CA
Saint Louis, MO
San Antonio, TX
San Jose, CA
Seattle, WA
Subtotal TGAs
TOTAL EMAs/TGAs
Formula
$5,475,579
$2,278,861
$3,956,335
$3,704,463
$2,057,034
$4,574,246
$94,583,993
$392,139,276
271
Supplemental
MAI
$2,795,170
$625,578
$1,192,324
$221,922
$2,040,418
$477,351
$1,970,324
$564,877
$1,088,520
$257,564
$2,405,932
$382,494
$49,903,591 $11,446,87
$210,324,140 $52,156,145
6
Total
$8,896,327
$3,693,107
$6,474,104
$6,239,664
$3,403,118
$7,362,672
$155,934,459
$654,619,562
272.
RWHAP Part B - HIV Care Grants to StatesFY 2023
Final
FY 2024
Continuing
Resolution
FY 2025
President’s
Budget
$1,364,878,000
$1,364,878,000
$1,364,878,000
---
MAI (non-add)
$10,145,000
$10,145,000
$10,145,000
---
ADAP (non-add)
$900,313,000
$900,313,000
$900,313,000
---
70
70
70
---
BA
FTE
FY 2025
+/FY 2023
Authorizing Legislation: Public Health Service Act, Section 2601, as amended by Public Law
116-136
FY 2025 Authorization……………………………………………………………………Expired
Allocation Method:
• Formula Grants
• Competitive Grants/Cooperative Agreements
• Contracts
Program Description
RWHAP Part B is the largest RWHAP Part and provides grants to all 50 states, the District of
Columbia, Puerto Rico, the U.S. Virgin Islands, Guam, and five Associated Pacific Jurisdictions
to provide services for people with HIV. RWHAP Part B grants directly support the HHS goal to
protect and strengthen equitable access to high quality and affordable healthcare, including
efforts to reduce costs and ensure access to medications. These grants support outpatient
ambulatory medical care, HIV-related prescription medications, case management, oral health
care, health insurance premium and cost-sharing assistance, mental health and substance abuse
services, and other core and support services.
RWHAP Part B funds are distributed through base and supplemental grants, ADAP base and
ADAP supplemental grants, Emerging Communities (EC) grants, and MAI grants. The base
awards are distributed by a formula based on a state or territory’s prevalent HIV cases weighted
for cases outside of the jurisdictions that receive RWHAP Part A funding. The ECs are
metropolitan areas that do not qualify as RWHAP Part A EMAs or TGAs but have 500-999
cumulative reported AIDS cases over the last five years. States apply on behalf of the ECs for
funding through the RWHAP Part B base grant application. RWHAP Part B supplemental grants
are available through a competitive process to eligible states with demonstrated need.
272
273.
A portion of the RWHAP Part B appropriation supports ADAPs, state or jurisdiction operatedprograms which support the provision of HIV medications and related services, including health
care coverage premiums and cost-sharing assistance. These funds are distributed by a formula
based on prevalent HIV cases. In addition, ADAP supplemental funds are a five percent set aside
for states with severe need. ADAPs provide FDA-approved prescription medications for people
with HIV who cannot afford HIV medications and are instrumental in efforts to end the HIV
epidemic across the nation. An overwhelming body of clinical evidence has firmly established
that a person with HIV who is in treatment and has an undetectable viral load cannot sexually
transmit HIV (referred to as Undetectable Equals Untransmittable, or U=U). ADAP provides the
access to medications and health care coverage necessary for people with HIV to achieve optimal
health outcomes and viral suppression. Individual ADAPs operate in all 50 states, the District of
Columbia, Puerto Rico, the U.S. Virgin Islands, Guam, American Samoa, the Commonwealth of
the Northern Mariana Islands, the Federated States of Micronesia, the Republic of Palau, and the
Republic of the Marshall Islands. MAI funds are a statutory set-aside to evaluate and address the
disproportionate impact of HIV on, and the disparities in access, treatment, care, and outcomes
for, racial and ethnic minorities. The RWHAP Part B MAI funding is statutorily required to
specifically support education and outreach services to increase the number of eligible racial and
ethnic minorities who have access to the RWHAP ADAP.
Ending the HIV Epidemic in the U.S. - States
Seven RWHAP Part B recipients with a substantial rural burden of new HIV diagnoses and the
state of Ohio (on behalf of Hamilton County, which is currently not part of an EMA/TGA),
received a cooperative agreement to implement EHE initiative activities related to strategy two
(Treat) and strategy four (Respond) in FY 2023. Jurisdictions will continue to utilize their
existing infrastructure to implement effective and innovative strategies, interventions,
approaches, and services to reduce new HIV infections in the United States.
AIDS Drug Assistance Program
The RWHAP Part B has been successful in helping to ensure that people with HIV have access
to the care and treatment services they need to live longer, healthier lives. According to the
RWHAP ADAP Report, which is comprised of data reported by recipients annually to evaluate
the national impact of ADAP through client-level data on individuals being served, services
being delivered, and costs associated with these services, ADAPs continue to provide robust
formularies of antiretroviral medications to treat HIV infection, prevent and treat opportunistic
infections, manage side effects, and treat co-morbidities.
Across the RWHAP, grant recipients are encouraged to maximize resources and leverage
efficiencies. Increased demand for RWHAP ADAP services has led States to implement costcontainment strategies for their ADAPs, such as coordinating benefits with Medicare Part D and
improving drug-purchasing models, which result in effective funds management, enabling
ADAPs to serve more people. In 2021, ADAPs participating in cost-savings strategies on
medications saved $2.6 billion. Over the last 5 years, ADAPs participating in medication costsavings strategies saved $10.9 billion.132
132
HRSA. Ryan White HIV/AIDS Program AIDS Drug Assistance Program (ADAP) Annual Client-Level Data
Report 2021.
273
274.
With no individuals on the ADAP waiting lists since 2015, HRSA distributed $75 million inEmergency Relief Funding (ERF) in FY 2023. ADAP ERF awards are intended for states and
territories that demonstrate the need for additional resources to prevent, reduce, or eliminate
ADAP waiting lists, including through cost-containment measures (for example, the provision of
health care coverage assistance). These funds are required to be used for ADAP services,
including the purchase of medications, health care coverage premium assistance, and medication
copay assistance. HRSA continues to closely monitor the impact of ending the COVID-19 Public
Health Emergency and the Medicaid continuous enrollment requirement on the ADAPs.
Budget Request
The FY 2025 Budget Request for the RWHAP Part B of $1.3 billion is equal to the FY 2023
Final level. This request includes $900.3 million for RWHAP ADAPs to provide access to life
saving HIV related medications and funding to provide direct health care services for people
with HIV in all 50 States, the District of Columbia, Puerto Rico, the Virgin Islands, Guam, and
five Associated Pacific Jurisdictions.
RWHAP Part B grant recipients will continue to work directly with uninsured people with HIV
to ensure access to health care coverage and will continue to support HIV medications not on
health plan formularies and the cost sharing required by health coverage plans. ADAP resources
will also support the continued:
Increase in RWHAP clients as more people with HIV are diagnosed, linked to care, and
retained in care.
Increase in people who require assistance with health care coverage premiums and costsharing.
Need for medication and/or health care coverage assistance for clients who remain
uninsured.
RWHAP Part B funding will also contribute to achieving the FY 2025 targets for performance
goals that relate to cross-cutting activities, such as the total number of clients served, and the
percentage of clients (total, minority, and female clients) who reached viral suppression.
The funding request also includes costs associated with the grant review and award process,
follow-up performance reviews, information technology, and other program support costs.
Five Year Funding History133
Fiscal Year
Amount
FY 2021
FY 2022
FY 2023
$1,314,622,000
$1,344,240,000
$1,364,878,000
FY 2024 CR
FY 2025 President’s Budget
$1,364,878,000
$1,364,878,000
133
EHE funding is not included in this table.
274
275.
Program Accomplishments134The RWHAP Part B has contributed to the tremendous progress the RWHAP has made toward
ending the HIV epidemic in the United States. From 2010 to 2022, HIV viral suppression among
RWHAP patients has increased from 69.5 percent to 89.6 percent, and racial and ethnic, agebased, and regional disparities have decreased. However, even with these positive outcomes,
fully addressing the HIV epidemic domestically continues to be a challenge as the CDC
estimates that more than 1 million people in the United States have HIV, and 1 in 8 are unaware
of their HIV. In addition, over 36,000 HIV diagnoses occur every year.
An overwhelming body of clinical evidence has firmly established that a person with HIV who is
in treatment and has an undetectable viral load cannot sexually transmit HIV (referred to as
Undetectable Equals Untransmittable, or U=U). Not only do improved viral suppression rates
reduce the transmission of HIV, but they also result in significant cost-savings to the health care
system.135 In the RWHAP, 89.6 percent of patients receiving RWHAP medical care are virally
suppressed, far exceeding the 68.8 percent rate of viral suppression for the general population of
people with diagnosed HIV ̶ an outcome measure that demonstrates the success of the program
and results in major public health benefits.
These results align with a study published in Clinical Infectious Diseases, which found that
clients receiving care and support at RWHAP-funded facilities are associated with improved
outcomes (such as viral suppression), compared to those not served by the RWHAP.
Furthermore, RWHAP patients are more likely to reach viral suppression regardless of other
health care coverage (e.g., uninsured, Medicaid, Medicare, or private insurance).
AIDS Drug Assistance Program
According to the RWHAP ADAP data, the number of people with HIV receiving ADAP services
has grown 38 percent over the last ten years from 208,809 clients in 2010, to 289,290 clients in
2021, exceeding the FY 2021 target by 4,290. In FY 2021, the RWHAP ADAP provided
medication and health care coverage assistance for nearly 27 percent of people diagnosed with
HIV in the United States. Of all the ADAP clients served nationwide, 71 percent had incomes at
or below 200 percent of the federal poverty level, and 69 percent were racial and ethnic
minorities.136,137
The RWHAP ADAP plays a crucial role in ensuring access to HIV medications for pregnant
women. Mother-to-child transmission in the United States has decreased dramatically since its
peak in 1992 due to 1) an increased focus on HIV testing for all pregnant women; and 2) the use
of antiretroviral therapy, which significantly reduces the risk of HIV transmission from the
mother to the baby. In 2021, 99 percent of HIV-positive pregnant women served by the RWHAP
134
See Program Description at the beginning of the RWHAP section for citations to the data contained in this
section.
135
Schackman BR, Fleishman JA, Su AE, et al. The lifetime medical cost savings from preventing HIV in the United
States. Med Care. 2015;53(4):293-301. doi:10.1097/MLR.0000000000000308.
136
HRSA. Ryan White HIV/AIDS Program AIDS Drug Assistance Program (ADAP) Annual Client-Level Data
Report 2021.
137
CDC. HIV Surveillance Report, 2021; vol. 34. http://www.cdc.gov/hiv/library/reports/hiv-surveillance.html.
Published May 2022. Accessed January 2023.
275
276.
(Part A, Part B, Part C, and Part D) were prescribed antiretroviral therapy to prevent maternal-tochild transmission of HIV, exceeding the FY 2021 performance target by 3 percentage points.Outputs and Outcomes Table
RWHAP Part A, Part B, Part C, and Part D (includes Ending the HIV Epidemic initiative)
contribute to over-arching performance measures. The Outputs and Outcomes Table containing
these measures is located at the end of this document.
Grant Awards Table
FY 2024 Continuing
Resolution
FY 2025 President’s
Budget
59
59
59
Average Award
$22,789,636
$22,789,636
$22,789,636
Range of Awards
$50,000 –
$151,644,223
$50,000 –
$151,644,223
$50,000 –
$151,644,223
FY 2023 Final
Number of Awards
276
277.
RWHAP Part B State TableRWHAP Part B –
FY 2023 State
Table138Part B
Grantee
Alabama
Alaska
Arizona
Arkansas
California
Colorado
Connecticut
Delaware
District of Columbia
Florida
Georgia
Hawaii
Idaho
Illinois
Indiana
Iowa
Kansas
Kentucky
Louisiana
Maine
Maryland
Massachusetts
Michigan
Minnesota
Mississippi
Missouri
Montana
Nebraska
Nevada
New Hampshire
New Jersey
New Mexico
New York
North Carolina
North Dakota
Ohio
Oklahoma
Oregon
Pennsylvania
Puerto Rico
138
FY 2023 Final
Base Award
FY 2023
Final ADAP
Award
FY 2023 Final
ADAP Suppl.
Award
FY 2023
Final EC
Award
FY 2023
Final
MAI
Award
$8,926,434
$500,000
$4,742,079
$3,775,712
$36,673,157
$3,698,691
$2,711,389
$2,041,922
$3,496,762
$32,787,839
$16,490,981
$1,580,723
$624,231
$9,982,753
$4,081,186
$1,641,472
$1,274,662
$4,787,420
$7,158,844
$813,917
$8,120,375
$5,445,874
$5,524,801
$2,316,841
$6,265,840
$3,829,578
$500,000
$1,384,217
$2,567,829
$500,000
$10,258,732
$2,172,719
$32,973,705
$12,638,316
$500,000
$7,966,703
$4,142,733
$1,927,418
$11,159,823
$5,639,228
$10,428,175
$555,445
$12,158,962
$4,523,221
$101,663,845
$9,331,768
$7,723,367
$2,385,445
$10,758,401
$84,978,040
$39,181,695
$1,846,656
$729,248
$27,835,261
$8,652,489
$1,917,626
$2,599,078
$5,592,833
$16,643,802
$950,847
$23,852,278
$14,850,011
$12,999,734
$6,340,910
$7,555,358
$9,890,110
$371,504
$1,617,091
$7,115,057
$914,638
$27,242,883
$2,538,247
$90,854,027
$23,149,824
$332,398
$17,065,274
$4,839,687
$4,728,164
$25,785,111
$13,197,435
$0
$0
$0
$0
$0
$0
$0
$0
$0
$0
$9,015,850
$0
$0
$6,404,994
$1,990,969
$0
$0
$0
$0
$0
$0
$0
$0
$0
$0
$0
$0
$0
$0
$0
$3,857,327
$0
$0
$0
$0
$0
$0
$0
$0
$3,036,777
$319,576
$0
$0
$0
$191,494
$0
$0
$178,249
$0
$465,637
$180,099
$0
$0
$0
$0
$0
$0
$300,411
$0
$0
$0
$0
$0
$0
$266,597
$0
$0
$0
$0
$0
$0
$0
$538,595
$309,735
$0
$358,052
$247,654
$0
$272,072
$0
$157,830
$0
$139,279
$53,985
$1,344,554
$82,972
$0
$36,015
$186,609
$1,295,527
$658,624
$0
$0
$422,438
$0
$0
$0
$50,992
$261,437
$0
$426,607
$184,495
$181,651
$0
$127,383
$0
$0
$0
$0
$0
$456,785
$0
$1,518,908
$365,520
$0
$0
$0
$0
$377,148
$270,846
Awards include prior year unobligated balances.
277
Total FY23
Part B
Award
$19,832,015
$1,055,445
$17,040,320
$8,352,918
$139,873,050
$13,113,431
$10,434,756
$4,641,631
$14,441,772
$119,527,043
$65,527,249
$3,427,379
$1,353,479
$44,645,446
$14,724,644
$3,559,098
$3,873,740
$10,731,656
$24,064,083
$1,764,764
$32,399,260
$20,480,380
$18,706,186
$8,657,751
$14,215,178
$13,719,688
$871,504
$3,001,308
$9,682,886
$1,414,638
$41,815,727
$4,710,966
$125,885,235
$36,463,395
$832,398
$25,390,029
$9,230,074
$6,655,582
$37,594,154
$22,144,286
278.
RWHAP Part B –FY 2023 State
Table138Part B
Grantee
FY 2023 Final
Base Award
FY 2023
Final ADAP
Award
FY 2023 Final
ADAP Suppl.
Award
FY 2023
Final EC
Award
FY 2023
Final
MAI
Award
Total FY23
Part B
Award
Rhode Island
South Carolina
South Dakota
Tennessee
Texas
Utah
Vermont
Virginia
Washington
West Virginia
Wisconsin
Wyoming
Guam
Virgin Islands
American Samoa
Marshall Islands
Mariana Island
Republic of Palau
F. States Micronesia
$1,575,764
$11,036,680
$500,000
$5,674,461
$27,842,643
$2,012,167
$500,000
$7,691,488
$4,034,717
$1,199,076
$3,954,983
$500,000
$200,000
$500,000
$50,000
$50,000
$50,000
$50,000
$50,000
$1,840,863
$13,140,949
$478,682
$13,769,536
$71,245,437
$2,350,684
$370,055
$17,852,456
$9,885,765
$1,504,119
$4,644,159
$248,393
$81,832
$445,370
$0
$724
$10,863
$6,518
$0
$0
$0
$0
$0
$16,393,832
$540,901
$0
$0
$0
$0
$0
$0
$0
$0
$0
$0
$0
$0
$0
$183,355
$554,799
$0
$0
$0
$0
$0
$372,036
$0
$0
$261,639
$0
$0
$0
$0
$0
$0
$0
$0
$21,379
$209,879
$0
$188,232
$1,117,419
$0
$0
$265,784
$90,193
$0
$56,173
$0
$0
$8,412
$0
$0
$0
$0
$0
$3,621,361
$24,942,307
$978,682
$19,632,229
$116,599,331
$4,903,752
$870,055
$26,181,764
$14,010,675
$2,703,195
$8,916,954
$748,393
$281,832
$953,782
$50,000
$50,724
$60,863
$56,518
$50,000
TOTALS
$341,096,885
$783,572,350
$41,240,650
$5,000,000
$10,557,076
$1,181,466,961
278
279.
RWHAP Part C - Early Intervention ServicesFY 2023
Final
FY 2024
Continuing
Resolution
FY 2025
President’s
Budget
BA
$208,970,000
$208,970,000
$208,970,000
---
MAI (non-add)
$71,012,000
$71,012,000
$71,012,000
---
56
56
56
---
FTE
FY 2025
+/FY 2023
Authorizing Legislation: Public Health Service Act, Section 2651-2667, as amended by Ryan
White HIV/AIDS Treatment Extension Act of 2009, Public Law 111-87.
FY 2025 Authorization………………………………………………..……..……….…...Expired
Allocation Method:
• Competitive Grants/Cooperative Agreements
• Contracts
Program Description
RWHAP Part C provides grants directly to community-based organizations, health centers,
health departments, and university or hospital-based clinics in 49 states, the District of Columbia,
Puerto Rico, and the U.S. Virgin Islands. RWHAP Part C supports comprehensive primary
health care and support services in an outpatient setting for low-income, uninsured, and
underserved people with HIV. RWHAP Part C is also authorized to fund capacity development
grants that strengthen organizational development and infrastructure, resulting in a more
effective delivery of HIV care and services.
MAI funds are a statutory set-aside funding to evaluate and address the disproportionate impact
of HIV on, racial and ethnic minorities. RWHAP Part C MAI funding supports HIV care,
treatment, and support services to racial and ethnic minorities.
Budget Request
The FY 2025 Budget Request for the RWHAP Part C of $208.9 million is equal to the FY 2023
Final level. These requested levels will support comprehensive medical, treatment and support
services necessary to achieve improved health outcomes, such as improved viral suppression
rates, essential to ending the HIV epidemic.
RWHAP Part C supports direct health care services for low-income people with HIV who are
uninsured or underserved. These services are considered essential to improving health outcomes
and are a crucial part of the care network that links and retains people with HIV into health care.
279
280.
Such critical health care services include intensive case management and care coordinationservices, linking and retaining people with HIV into care, and getting them on antiretroviral
medications as early as possible.
RWHAP Part C funding will contribute to achieving the FY 2025 targets for performance goals
that relate to cross-cutting activities, such as the total number of clients served, and the
percentage of clients (total, minority, and female clients) who achieved viral suppression.
The funding request also includes costs associated with the grant review and award process,
follow-up performance reviews, information technology, and other program support costs.
Five Year Funding History
Fiscal Year
Amount
FY 2021
$201,079,000
FY 2022
$205,054,000
FY 2023
$208,970,000
FY 2024 CR
$208,970,000
FY 2025 President’s Budget
$208,970,000
Program Accomplishments139
The RWHAP has a history of creating effective patient-centered services that support strong
provider and patient relationships. Providers funded through RWHAP Part C have the clinical
expertise and cultural competency to provide quality care and treatment to low-income, diverse
people with HIV.
The RWHAP Part C has contributed to the tremendous progress the RWHAP has made toward
ending the HIV epidemic in the United States. From 2010 to 2022, HIV viral suppression among
RWHAP patients has increased from 69.5 percent to 89.6 percent, and racial and ethnic, agebased, and regional disparities have decreased. However, even with these positive outcomes,
fully addressing the HIV epidemic domestically continues to be a challenge. The CDC estimates
that over 1 million people in the United States have HIV, and 1 in 8 are unaware of their HIV
status. In addition, over 36,000 new HIV diagnoses occur every year.
An overwhelming body of clinical evidence has firmly established that a person with HIV who is
in treatment and has an undetectable viral load cannot sexually transmit HIV (referred to as
Undetectable Equals Untransmittable, or U=U). Not only do improved viral suppression rates
reduce the transmission of HIV, but they also result in significant cost-savings to the health care
system.140 In the RWHAP, 89.6 percent of patients receiving RWHAP medical care are virally
139
See Program Description at the beginning of the RWHAP section for citations to the data contained in this
section.
140
Schackman BR, Fleishman JA, Su AE, et al. The lifetime medical cost savings from preventing HIV in the United
States. Med Care. 2015;53(4):293-301. doi:10.1097/MLR.0000000000000308.
280
281.
suppressed, far exceeding the 68.8 percent rate of viral suppression for the general population ofpeople with diagnosed HIV ̶ an outcome measure that demonstrates the success of the program
and results in major public health benefits.
These results align with a study published in Clinical Infectious Diseases, which found that
clients receiving care and support at RWHAP-funded facilities are associated with improved
outcomes (such as viral suppression), compared to those not served by the RWHAP.
Furthermore, RWHAP patients are more likely to reach viral suppression regardless of other
health care coverage (e.g., uninsured, Medicaid, Medicare, or private insurance).
Outputs and Outcomes Table
RWHAP Part A, Part B, Part C, and Part D (includes Ending the HIV Epidemic initiative)
contribute to over-arching performance measures. The Outputs and Outcomes Table containing
these measures is located at the end of this document.
Grant Awards Table
FY 2023 Final
Number of Awards
FY 2024
Continuing
Resolution
FY 2025
President’s Budget
357
357
358
Average Award
$506,388
$506,388
$506,388
Range of Awards
$94,486 –
$1,169,012
$94,486 –
$1,169,012
$94,486 –
$1,169,012
281
282.
RWHAP Part D - Women, Infants, Children and YouthFY 2024
Continuing
Resolution
FY 2023
Final
FY 2025
President’s
Budget
FY 2025
+/FY 2023
BA
$77,935,000
$77,935,000
$77,935,000
---
MAI (non-add)
$23,671,000
$23,671,000
$23,671,000
---
11
11
11
---
FTE
Authorizing Legislation: Public Health Service Act, Section 2671, as amended by Ryan White
HIV/AIDS Treatment Extension Act of 2009, Public Law 111-87.
FY 2025 Authorization………………………………………………….…………………Expired
Allocation Method:
• Competitive Grants/Cooperative Agreements
• Contracts
Program Description
HRSA’s RWHAP Part D provides grants directly to public or private community-based
organizations, hospitals, and State and local governments. Currently, there are 112 RWHAP Part
D grant recipients located in 39 states and Puerto Rico. The RWHAP Part D focuses on
providing access to coordinated, comprehensive, culturally, and linguistically competent, familycentered HIV primary medical care and support services. RWHAP Part D services focus on lowincome, uninsured, and underserved women, infants, children, and youth (WICY) with HIV and
their affected family members.141 RWHAP Part D also funds essential support services, such as
case management and transportation that help clients’ access medical care and stay in care. MAI
funds are a statutory set-aside to evaluate and address the disproportionate impact of HIV on, and
the disparities in access, treatment, care, and outcomes for, racial and ethnic minorities. RWHAP
Part D MAI funding supports HIV care, treatment, and support services to racial and ethnic
minorities.
Budget Request
The FY 2025 Budget Request for the RWHAP Part D of $77.9 million is equal to the FY 2023
Final level. These requested funding levels will support the comprehensive array of medical and
141
Support services are available for family members who do not have HIV. Some examples are family-centered
case management, childcare services during medical appointment attendance, and psychosocial support services that
focus on equipping affected family members, and caregivers, to manage the stress associated with HIV.
282
283.
support services necessary to achieve improved health outcomes, such as improved viralsuppression rates, essential to ending the HIV epidemic.
RWHAP Part D supports health care services for low-income people with HIV who are
uninsured or underserved, particularly women, infants, children, and youth. Such critical health
care services include intensive case management and care coordination services, linking and
retaining people with HIV into care, and getting them on antiretroviral medications as early as
possible.
RWHAP Part D funding will contribute to achieving the FY 2025 targets for performance goals
that relate to cross-cutting activities, such as the total number of clients served and the
percentage of clients (total, minority, and female clients) who achieved viral suppression.
The funding request also includes costs associated with the grant review and award process,
follow-up performance reviews, information technology, and other program support costs.
Five Year Funding History
Fiscal Year
FY 2021
FY 2022
FY 2023
FY 2024 CR
FY 2025 President’s Budget
Amount
$72,888,000
$77,252,000
$77,935,000
$77,935,000
$77,935,000
Program Accomplishments142
The RWHAP Part D serves women, infant, children, and youth – populations that tend to have
poor health outcomes due to poverty, lack of access to health care, and other factors. RWHAP
Part D providers have the clinical expertise and cultural competency to provide quality care and
treatment to low-income, diverse women, infant, children, and youth with HIV.
The RWHAP Part D has contributed to the tremendous progress the RWHAP has made toward
ending the HIV epidemic in the United States: from 2010 to 2022, HIV viral suppression among
RWHAP patients has increased from 69.5 percent to 89.6 percent, and racial and ethnic, agebased, gender-based, and regional disparities have decreased. However, even with these positive
outcomes, fully addressing the HIV epidemic domestically continues to be a challenge. the CDC
estimates that over 1 million people in the United States have HIV, and 1 in 8 are unaware of
their HIV status. In addition, over 36,000 new HIV diagnoses occur every year.
142
See Program Description at the beginning of the RWHAP section for citations to the data contained in this
section.
283
284.
Not only do improved viral suppression rates reduce the transmission of HIV, but they also resultin significant cost-savings to the health care system.143 In the RWHAP, 89.6 percent of patients
receiving RWHAP medical care are virally suppressed, far exceeding the 68.8 percent rate of
viral suppression for the general population of people with diagnosed HIV ̶ an outcome measure
that demonstrates the success of the program and results in major public health benefits.
Outputs and Outcomes Table
RWHAP Part A, Part B, Part C, and Part D (includes Ending the HIV Epidemic initiative)
contribute to over-arching performance measures. The Outputs and Outcomes Table containing
these measures is located at the end of this document.
Grant Awards Table
FY 2024 Continuing
Resolution
FY 2025 President’s
Budget
112
112
112
Average Award
$611,308
$611,308
$611,308
Range of Awards
$119,319 –
$2,000,640
$119,319 –
$2,000,640
$119,319 –
$2,000,640
FY 2023 Final
Number of
Awards
143
Schackman BR, Fleishman JA, Su AE, et al. The lifetime medical cost savings from preventing HIV in the
United States. Med Care. 2015;53(4):293-301. doi:10.1097/MLR.0000000000000308.
284
285.
RWHAP Part F - AIDS Education and Training Center ProgramFY 2024
Continuing
Resolution
FY 2023
Final
FY 2025
President’s
Budget
FY 2025
+/FY 2023
BA
$34,886,000
$34,886,000
$34,886,000
---
MAI (non-add)
$10,144,000
$10,144,000
$10,144,000
---
5
5
5
---
FTE
Authorizing Legislation: Public Health Service Act, Section 2692(b), as amended by Ryan
White HIV/AIDS Treatment Extension Act of 2009, Public Law 111-87.
FY 2025 Authorization…………………………………… …………………………...….Expired
Allocation Method:
• Competitive Grants/Cooperative Agreements
• Contracts
Program Description
RWHAP Part F AIDS Education and Training Center (AETC) Program supports a network of
leading HIV experts who provide locally based, tailored education, clinical consultation, and
technical assistance to health personnel, faculty, and health care organizations to integrate stateof-the-science comprehensive care for people with or affected by HIV. The AETC network
includes two national centers, the National Clinician Consultation Center (NCCC) and the
National Coordination Resource Center (NCRC), the online National HIV Curriculum (NHC),
eight regional centers comprised of more than 130 regional partners (local sites), and two
Integration of the NHC into Health Professions Training programs. Together, this network serves
all states, DC, Puerto Rico, the U.S. Virgin Islands, and the Associated Pacific Jurisdictions.
The RWHAP AETC Program leverages multidisciplinary education and training programs for
health care providers in the prevention and treatment of HIV, bolstering the health workforce to
ensure high quality care and positive patient outcomes for underserved populations. The AETCs
offer a combination of educational and consultative services consistent with established
treatment guidelines that reflect current research. Bi-directional learning platforms, tailored
trainings, sharing best practices, and on-demand expert guidance are made possible by the
extensive network of local, regional, and national partners across the country who stand ready to
meet the unique training needs of the HIV healthcare workforce.
285
286.
Ending the HIV Epidemic in the U.S. – AETC ProgramIn FY 2023, eleven RWHAP AETC Program recipients received funding through the EHE
initiative to expand workforce capacity by offering training and technical assistance to health
personnel, faculty, and other health organizations. The AETCs are a strategic and important
resource in ending the HIV epidemic, dedicated to training healthcare team members, and
building the capacity of organizations to provide HIV care and prevention across the US.
Budget Request
The FY 2025 Budget Request for the RWHAP Part F-AETC of $34.8 million is equal to the FY
2023 Final level. The requested funding levels will assure access to high-quality HIV care by
supporting targeted, multidisciplinary education and training programs for new and experienced
health care providers treating people with HIV. The RWHAP AETC Program will continue to
deliver expert advice to providers across the country on HIV treatment, pre-exposure prophylaxis
to reduce HIV transmission, substance use disorders, viral hepatitis co-infection, post-exposure
prophylaxis, and the treatment of pregnant women with HIV and their newborns to prevent
mother-to-child transmission.
To ensure alignment with HRSA’s strategic goals and HHS priorities, the FY 2025 Budget
Request will support the RWHAP AETC Program’s mission to:
Expand the number of health care team members providing HIV care and prevention
services, including providers with different backgrounds or experiences.
Expand the ability of health care team members to provide effective HIV care and
prevention services.
Improve health equity by integrating HIV care and prevention in primary care and other
health care settings that provide services to underserved populations.
Enhance the capacity of the AETC Program to train health care team members to serve
people at risk for or with HIV.
The RWHAP AETC Program has identified multiple strategies for achieving these goals. One
such strategy is the National HIV Curriculum - an interactive online platform that provides upto-date training and information to support core competency knowledge of HIV prevention,
screening, diagnosis, and ongoing treatment.
People with HIV who are in care and virally suppressed cannot transmit HIV and live longer and
healthier lives. This is a direct result of improvements in HIV care and treatment services.
However, the number of experienced HIV care professionals is projected to decrease, as many of
those who have worked in the epidemic since its inception reach retirement age. Training an
expanded cadre of culturally competent, high-quality providers is vital to increasing access to
quality HIV care and treatment, improving health outcomes for people with HIV and decreasing
new HIV infections.
HRSA will continue to prioritize training and technical assistance that result in health system
strengthening and transformation, with a particular focus on training health care providers on
286
287.
delivering high quality HIV care and treatment services in primary care settings that havetypically not provided services to people with HIV.
The funding request also includes costs associated with the grant review and award process,
follow-up performance reviews, information technology, and other program support costs.
Five Year Funding History144
Fiscal Year
Amount
FY 2021
$33,510,000
FY 2022
$34,358,000
FY 2023
$34,886,000
FY 2024 CR
$34,886,000
FY 2025 Presidents Budget
$34,886,000
Program Accomplishments
The RWHAP AETC Program supports HHS in achieving its public health goals by providing
training to health care team members working in federally qualified community and migrant
health centers, and RWHAP sites that provide care to underserved populations (e.g., rural
communities, racial and ethnic minority populations, people experiencing homelessness, and
incarcerated persons). Health personnel are trained to offer innovative and culturally and
linguistically appropriate healthcare services to people at-risk or who have HIV.
Regional AETCs train nearly 60,000 people each year. Sixty-eight percent of those trained,
report at least one quarter of their clients are racial/ethnic minorities and 53 percent of trainees
are racial/ethnic minorities themselves.145 In FY 2021, the RWHAP exceeded its target for the
percentage of racial and ethnic minority health professionals trained through the AETC Program
by seven percent. These activities directly support the HHS goal to protect and strengthen
equitable access to high quality and affordable healthcare. It also reflects HRSA’s mission to
improve health outcomes and achieve health equity through access to quality services, a skilled
health workforce, and innovative, high-value programs.
Data show that AETC training materials and modalities effectively enhance participants'
knowledge, indicating both the content and delivery methods promote successful learning.
Enhancing the capability of the HIV health care workforce is key to achieving the National
HIV/AIDS Strategy’s (NHAS) goal of increasing access to care and optimizing health outcomes
for people living with HIV. From July 2021 through June 2022, 87 percent of participants who
engaged with AETC national resources and/or training reported an increase in knowledge about
HIV and the provision of care for people with HIV.146
144
EHE funding is not included in this table.
Health Resources and Services Administration. Ryan White HIV/AIDS Program (RWHAP) AIDS Education and
Training Center (AETC) Program Annual Data Report 2021. https://ryanwhite.h r s a .gov/data/reports. May 2023.
146
Includes AETC NCRC and NCCC participants. These data also include the increase of knowledge about HCV
and/or substance use.
145
287
288.
The RWHAP AETC Program has also contributed to the tremendous progress made towardending the HIV epidemic in the United States by providing training and technical assistance to
health personnel, faculty, and healthcare organizations in EHE priority jurisdictions and areas of
the country with high HIV prevalence. Each of the eight AETC regions provides training in at
least one EHE participating jurisdiction. Forty-five percent of the AETC’s NHC website visitors
reside in EHE priority jurisdictions.
Outputs and Outcomes Table
Measure
4051.01 Percentage of
health professionals
trained through the
RWHAP AETC who
are racial and ethnic
minorities. (Output)
Year and Most
Recent Result /
Target for Recent
Result /
(Summary of
Result)
FY 2024
Target
50%
FY 2022: 53%
FY 2025
Target
Discontinued
FY 2025
+/FY 2024
N/A
Target: 46%
(Target Exceeded)
Grant Awards Table
FY 2024
Continuing
Resolution
FY 2023 Final
Number of Awards
FY 2025
President’s Budget
13
13
13
Average Award
$2,434,198
$2,434,198
$2,434,198
Range of Awards
$613,000–
$4,255,000
$613,000–
$4,255,000
$613,000–
$4,255,000
288
289.
RWHAP Part F - Dental ProgramsFY 2024
Continuing
Resolution
FY 2023
Final
FY 2025
President’s
Budget
FY 2025
+/FY 2023
BA
$13,620,000
$13,620,000
$13,620,000
---
FTE
---
---
---
---
Authorizing Legislation: Public Health Service Act, Section 2692(b), as amended by Ryan
White HIV/AIDS Treatment Extension Act of 2009, Public Law 111-87.
FY 2025 Authorization………………………………………………………….…….…..Expired
Allocation Method:
• Competitive Grants
• Formula Grants
• Contracts
Program Description
RWHAP Part F funding supports two dental programs: 1) HIV/AIDS Dental Reimbursement
Program (DRP); and 2) Community-Based Dental Partnership Program (CBDPP). These
programs fund oral health services, as well as education and training of oral health providers, to
expand provider capacity. Eligible applicants for both the DRP and the CBDPP are institutions
that have dental or dental hygiene education programs accredited by the Commission on Dental
Accreditation. These include dental schools, hospitals with postdoctoral dental residency
programs, and community colleges with dental hygiene programs.
The RWHAP DRP ensures access to oral health care for low-income people with HIV by
reimbursing dental education programs for the non-reimbursed costs they incur providing such
care. The care provided through the program includes a full range of diagnostic, preventive, and
treatment services, including oral surgery, as well as oral health education and health promotion.
The RWHAP CBDPP delivers HIV dental care while simultaneously training dental
professionals to expand community capacity to deliver oral health care for people with HIV. To
achieve its goal, the CBDPP supports collaborations between dental education programs and
community-based partners to deliver oral health services in community settings while supporting
students and residents enrolled in accredited dental educations programs.
Together, these programs increase the capacity for educational institutions to train students in
HIV-related dental care and expand the workforce.
289
290.
Budget RequestThe FY 2025 Budget Request for the RWHAP Part F-Dental of $13.6 million is equal to the FY
2023 Final level. This requested level will support oral health care for people with HIV and the
reimbursement of applicant institutions through the RWHAP Dental Reimbursement Program
and funding of the RWHAP Community-Based Dental Partnership Program.
The FY 2025 funding request will continue to support access to oral health care for people with
HIV and increase the capacity of the workforce by providing education and clinical for training
21,000 providers through both dental programs (includes both didactic and clinical trainings).
The request also includes costs associated with the grant review and award process, follow-up
performance reviews, information technology, and other program support costs.
Five Year Funding History
Fiscal Year
FY 2021
FY 2022
FY 2023
FY 2024 CR
FY 2025 President’s Budget
Amount
$13,083,000
$13,414,000
$13,620,000
$13,620,000
$13,620,000
Program Accomplishments
In FY 2022, the RWHAP DRP awards provided 36 percent of the total non-reimbursed costs
requested by 46 participating institutions in support of oral health care. These institutions
reported providing care to 19,863 people with HIV in FY 2022, a 37 percent increase over the
prior year.
In FY 2022, the RWHAP CBDPP funded 12 partnership grants to support collaboration and
coordination between the dental education programs and the community-based partners in the
delivery of oral health services.
In FY 2022, over 28,000 providers were trained in RWHAP dental programs.
290
291.
Outputs and Outcomes TableMeasure
4052.01: Number of
persons for whom a
portion/percentage of
their unreimbursed oral
health costs were
reimbursed. (Output)
4052.02: Number of
providers trained
through the RWHAP
Part F Dental
Reimbursement and
Community-Based
Partnership Programs
(Output)
Year and Most
Recent Result /
Target for Recent
Result /
(Summary of
Result)
FY 2022: 19,863
FY 2025
+/FY 2024
FY 2024
Target
FY 2025
Target
Discontinued
Discontinued
N/A
21,000
21,000
Maintain
Target: 26,000
(Target Not Met)
FY 2022: 28,598
Target: Not Defined
(Historical Actual)
Grant Awards Table
FY 2024
Continuing
Resolution
FY 2023 Final
Number of Awards
FY 2025 President’s
Budget
58
58
58
Average Award
$221,587
$221,587
$221,587
Range of Awards
$1,089 – $1,628,806
$1,089 – $1,628,806
$1,089 – $1,628,806
291
292.
RWHAP Part F - Special Projects of National SignificanceFY 2024
Continuing
Resolution
FY 2023
Final
FY 2025
President’s
Budget
FY 2025
+/FY 2023
BA
$25,000,000
$25,000,000
$25,000,000
---
FTE
2
2
2
---
Authorizing Legislation: Public Health Service Act, Section 2691, as amended by Ryan White
HIV/AIDS Treatment Extension Act of 2009, Public Law 111-87.
FY 2025 Authorization………………………………………………………….…….…..Expired
Allocation Method:
• Competitive Grants/Cooperative Agreements
• Contracts
Program Description
RWHAP Part F Special Projects of National Significance (SPNS) supports the development of
innovative models of HIV care and treatment to respond to emerging needs of RWHAP clients.
Through demonstration and implementation projects, SPNS evaluate the design, utilization, cost,
and health-related outcomes of treatment and related strategies while systemically promoting the
dissemination and replication of successful interventions through tools kits and other modalities
that allow for rapid dissemination and uptake. This unique program advances knowledge and
skills in the delivery of health care and support services to underserved populations.
As health care systems work under increasingly dynamic conditions, evidence-based, evidenceinformed, and emerging strategies are essential to ensure that research investments maximize
healthcare value and improve public health. SPNS-funded projects use implementation science to
document and capture how well interventions and strategies improve the quality and
effectiveness of health services, maximize resources, and improve health outcomes for people
with HIV.
Budget Request
The FY 2025 Budget Request for the RWHAP Part F SPNS of $25 million is equal to the FY
2023 Final level. The requested funding will support the continued development of innovative
intervention strategies of HIV care and treatment for populations that have traditionally had
lower rates of continuous care and viral suppression.
Implementation science is the scientific study of methods to promote or improve the systematic
uptake of intervention strategies with demonstrated effectiveness into practice, program, and
policy. Implementation science has emerged as an essential field for HIV treatment and
292
293.
prevention, promising to maximize the impact of effective intervention strategies to preventtransmission of the virus and to link and retain people with HIV in care.
Through demonstration and implementation projects supported by the FY 2025 Budget Request,
SPNS will continue to use implementation science to improve the quality and effectiveness of
health services, maximize resources, and improve health outcomes for people with HIV. The
SPNS program which supports the translation/adaptation of implementation science insights to
real-world implementation and evaluation projects will continue to guide the overall RWHAP to
maximize the impact of the RWHAP to achieve optimal outcomes for people with HIV along the
HIV care continuum.147
The funding request also includes costs associated with the grant review and award process,
follow-up performance reviews, and information technology and other program support costs.
Five Year Funding History
Fiscal Year
FY 2021
FY 2022
FY 2023
FY 2024 CR
FY 2025 President’s Budget
Amount
$25,000,000
$25,000,000
$25,000,000
$25,000,000
$25,000,000
Program Accomplishments
While research is defining best practices for addressing steps along the HIV care continuum, the
implementation and dissemination of such interventions lags behind. By using implementation
science, the RWHAP is helping to bridge the divide between research and practice by bringing
programs that work into communities. Below are examples of the outcomes of recently
completed and ongoing SPNS initiative.
Using Evidence-Informed Interventions to Improve Health Outcomes among People Living
with HIV (E2i) to help to reduce HIV-related health disparities and improve health outcomes
among people with HIV. The intervention focus areas included: transgender women, Black men
who have sex with men (MSM), behavioral health integration into HIV primary care, and
identifying and addressing trauma.
147
Psihopaidas D, Cohen SM, West T, Avery L, Dempsey A, Brown K, Heath C, Cajina A, Phillips H, Young S,
Stubbs-Smith A, Cheever LW. Implementation science and the Health Resources and Services Administration's
Ryan White HIV/AIDS Program's work towards ending the HIV epidemic in the United States. PLoS Med. 2020
Nov 6;17(11):e1003128. doi: 10.1371/journal.pmed.1003128. PMID: 33156852; PMCID: PMC7647058.
293
294.
Accomplishments:• Selected, piloted, and evaluated 11 evidence-informed interventions with demonstrated
effectiveness to improve HIV-related health outcomes in 25 RWHAP-funded care
settings.
• Developed 11 highly accessible and interactive multimedia toolkits to support rapid
uptake of the interventions to adapt and implement effective evidence-informed
interventions in RWHAP care settings and other HIV service delivery organizations. The
E2i Toolkits consisted of step-by-step implementation guides, interactive training
modules, narrated site videos, dissemination materials, and best practices for adapting
and implementing the interventions.
• The E2i implementation sites enrolled nearly 1,800 clients with over 95% of clients
having at least one exposure to their intervention. Some outcomes from a few of these
interventions include:
o
Among the clients enrolled in the Screening, Brief Intervention, and Referral to
Treatment intervention, the percentage with a prescription of ART and who
achieved viral suppression increased from 76 percent to 91 percent over a 12month period.148
o Among the clients enrolled in integrated buprenorphine treatment intervention,
the percentage who were engaged and retained in HIV care increased significantly
(by over 50%).149
Coordination, Dissemination and Replication of Innovative HIV Care Strategies initiative
supports the development and dissemination of implementation tools and resources to address
needs and gaps in the delivery of HIV care and treatment. The project also provides technical
assistance to support uptake and integration of the interventions.
Accomplishments:
• Developed 15 sets of implementation manuals and tools to guide the replication of
evidence-based, evidence-informed, and emerging strategies from SPNS-funded
interventions
• Conducted 15 webinars to provide technical assistance
• As of December 2023, over 15k website users have accessed project materials developed
through this initiative
Current SPNS initiatives include:
• Supporting replication of housing interventions in the RWHAP
• Supporting emerging strategies to improve health outcomes for people aging with HIV
• Telehealth strategies to maximize HIV care
148
Screening, Brief Intervention, and Referral to Treatment: E2i Implementation Guide. Rockville, MD: U.S.
Department of Health and Human Services, Health Resources and Services Administration, HIV/AIDS Bureau;
2021.
149
Goldhammer H. Buprenorphine Treatment for Opioid Use Disorders in HIV Primary Care: An Implementation
Toolkit. Rockville, MD: U.S. Department of Health and Human Services, Health Resources and Services
Administration, HIV/AIDS Bureau, 2018.
294
295.
Increasing update of long-acting injectable antiretroviral (ARV) among people with HIV
Using innovative intervention strategies to improve health outcomes among people with
HIV
Building capacity to implement rapid antiretroviral therapy (ART) start for improve care
engagement
Improving collecting and reporting viral suppression data to the Medicaid adult core set
Improving care and treatment coordination focusing on Black women with HIV
Grant Awards Table
FY 2023 Final
Number of Awards
FY 2024
Continuing
Resolution
FY 2025 President’s
Budget
20
19
20
Average Award
$1,118,325
$1,124,716
$1,118,325
Range of Awards
$218,093 –
$4,824,438
$218,093 –
$4,824,438
$218,093 –
$4,824,438
295
296.
RWHAP – Ending the HIV Epidemic Initiative (EHE)FY 2023
Final
FY 2024
Continuing
Resolution
FY 2025
President’s
Budget
FY 2025
+/FY 2023
BA
$165,000,000
$165,000,000
$175,000,000
+$10,000,000
FTE
32
32
32
---
Authorizing Legislation: Public Health Service Act, Section 311(c) and Title XXVI, as amended
by Consolidated Appropriations Act 2022, Public Law 117-103.
FY 2025 Authorization……………………………………………….……………..Not Specified
Allocation Method:
• Competitive Grants/Cooperative Agreements
• Contracts
Program Description
In February 2019, the Ending the HIV Epidemic in the U.S (EHE) initiative was launched to
further expand federal efforts to reduce HIV infections.. The multi-year EHE initiative currently
focuses on 48 counties, Washington, D.C., San Juan (Puerto Rico), and seven states that have a
substantial rural HIV burden (EHE jurisdictions). HRSA’s RWHAP focuses on linking people
with HIV who are either newly diagnosed, diagnosed but currently not in care, or are diagnosed
in care but not yet virally suppressed, to the essential HIV care and treatment and support
services needed to help them achieve viral suppression.
Funding levels for the EHE initiative were informed by modeling by CDC that analyzed the
impact of specific activities ̶ such as increased engagement in care, viral suppression and preexposure prophylaxis (PrEP) services uptake ̶ on priority communities, and costs related to
provision of these services. At proposed FY 2025 levels, it is estimated that HRSA’s RWHAP
will serve 46,000 people who are either reengaged or were newly diagnosed in prior years of the
initiative.
Budget Request
The FY 2025 Budget Request of $175 million for the EHE initiative is $10 million more than the
FY 2023 Final level. These requested levels will support HIV care and treatment in the 48
counties, DC, San Juan (Puerto Rico) that contain more than 50 percent of new HIV infections,
and seven states with substantial rural HIV burden.
296
297.
In FY 2025, HRSA will continue to direct EHE funding to the current 39 RWHAP Part Ajurisdictions that contain one or more of the counties and the current eight RWHAP Part B states
(including funding to the state of Ohio for Hamilton County, which is not a RWHAP Part A
recipient). HRSA coordinates with the respective RWHAP ADAPs to ensure necessary resources
are available to provide assistance for medications and health care coverage premiums and cost
sharing for people newly diagnosed with HIV or re-engaged in care through the initiative. The
RWHAP’s comprehensive system of HIV care and support services and effective system for
medication delivery creates a very efficient and effective service delivery mechanism for this
initiative.
The FY 2025 request of $175 million will allow HRSA to continue current efforts to engage new
clients and support HIV care and treatment needs for an estimated 46,000 clients who are either
reengaged or were newly diagnosed in prior years of the initiative. As more people with HIV
receive HIV care and treatment, an increase in EHE funding is critical for engaging those out of
care and keeping an increasing number of patients on medications to prevent HIV transmissions
and improve HIV health outcomes.
As part of EHE, HRSA will fund the RWHAP AETC Program to provide training and technical
assistance to health care providers, clinics, and paraprofessionals, as well as health departments,
to increase HIV testing, care and treatment, the provision of PrEP services, and retention in care.
HRSA will continue to direct funding to support technical assistance and systems coordination to
enhance the current Bureau Reporting Systems (BRS) to provide timely monitoring of the EHE
initiative; to support dissemination of effective interventions to increase the number of people
with HIV served by the initiative; and to provide additional technical assistance to jurisdictions
to implement models of care that work to identify and link and retain the key populations for the
EHE initiative.
Five Year Funding History
Fiscal Year
FY 2021
FY 2022
FY 2023
FY 2024 CR
FY 2025 President’s Budget
Amount
$105,000,000
$125,000,000
$165,000,000
$165,000,000
$175,000,000
Program Accomplishments
HRSA-funded EHE jurisdictions made significant progress toward implementing the EHE
workplans despite the COVID-19 pandemic, including:
Linkage, retention, and re-engagement activities (e.g., peer navigators, data to care reengagement efforts)
Service delivery approaches (e.g., telehealth and use of technology, expanded access)
297
298.
Infrastructure development (e.g., recruitment and hiring, onboarding and training, data
infrastructure)
Community engagement and information dissemination (e.g., social media efforts,
marketing campaigns)
In 2021, EHE-funded service providers served 22,413 clients new to care and an estimated
15,318 clients re-engaged in care. This represents more than 20% of people in EHE jurisdictions
who were undiagnosed or not in care. By the end of 2021, over 78 percent of clients who were
new to care and were receiving HIV treatment reached viral suppression, which means they
cannot transmit HIV to their partner and can live longer and healthier lives. This demonstrates
that the HAB EHE-funded providers were very successful in rapidly engaging people new to
care on HIV treatment, leading to a reduction in HIV transmissions. Additionally, nearly 67
percent of EHE clients during this time were at or below the Federal Poverty Level.
The RWHAP Part F AIDS Education and Training Center (AETC) Program has also contributed
to the EHE initiative, expanding workforce capacity by training health care providers on HIV
medical care and treatment and pre-exposure prophylaxis (PrEP) service delivery; working with
clinics to develop culturally competent settings and approaches for out-of-care populations; and
providing technical assistance to increase HIV testing, linkage to care, rapid antiretroviral
therapy delivery, and improved viral suppression. Each of the eight AETC regions has at least
one EHE participating jurisdiction and 45 percent of the AETC’s NHC website visitors reside in
EHE priority jurisdictions. From July 2021 through June 2022, regional AETCs conducted a
total of 484 EHE-funded training events, a 44 percent increase over the previous year.
Outputs and Outcomes Table
RWHAP Part A, Part B, Part C, and Part D (includes Ending the HIV Epidemic initiative)
contribute to over-arching performance measures. The Outputs and Outcomes Table containing
these measures is located at the end of this document.
298
299.
Grant Awards TableThe table below includes the awards to jurisdictions only (47 total):
FY 2024 Continuing
Resolution
FY 2025 President’s
Budget
47
47
47
Average Award
$2,959,456
$2,959,456
$3,172,221
Range of Awards
$2,000,000 –
$16,750,409
$2,000,000 –
$16,750,409
$2,000,000 –
$16,750,409
FY 2023 Final
Number of
Awards
The table below includes the awards to jurisdictions (47), AIDS Education and Training Centers
(11), and Technical Assistance and Coordination Providers (2):
FY 2024 Continuing
Resolution
FY 2025 President’s
Budget
60
60
60
Average Award
$2,845,650
$2,845,650
$3,012,316
Range of Awards
$613,000 $16,750,409
$613,000 $16,750,409
$613,000 $16,750,409
FY 2023 Final
Number of Awards
299
300.
Outputs and Outcomes Table for Over-Arching Performance Measures –RWHAP Part A, Part B, Part C, and Part D (includes Ending the HIV
Epidemic initiative)
Measure
4000.04: Number of
people served by the
Ryan White HIV/AIDS
Program. (Outcome)
Year and Most
Recent Result /
Target for Recent
Result /
(Summary of Result)
FY 2022: 566,846
FY 2024
Target
FY 2025
Target
FY 2025
+/FY 2024
566,000
565,000
-1,000
Discontinued
Discontinued
N/A
Discontinued
Discontinued
N/A
85%
85%
Maintain
85%
85%
Maintain
Target: Not Defined
(Historical Actual)
4000.01: Percentage of
racial and ethnic
minorities with
diagnosed HIV served by
the Ryan White
HIV/AIDS Program as
compared with the HIV
epidemic in the United
States (Outcome)
4000.02: Percentage of
women with diagnosed
HIV served by the Ryan
White HIV/AIDS
Program as compared
with the HIV epidemic in
the United States.
(Outcome)
4000.03: Percentage of
Ryan White HIV/AIDS
Program clients who are
virally suppressed.
(Outcome)
4000.06: Percentage of
Ryan White HIV/AIDS
Program female clients
who are virally
suppressed. (Outcome)
FY 2022: 74%
Target: Not lower than
3 percentage points of
CDC data or 71%
(Target Met)
FY 2022: 25%
Target: Not lower than
3 percentage points of
CDC data or 23%
(Target Met)
FY 2022: 89.6%
Target: 83%
(Target Exceeded)
FY 2022: 89.9%
Target: Not Defined
(Historical Actual)
300
301.
Measure4000.05: Percentage of
Ryan White HIV/AIDS
Program racial and ethnic
minority clients who are
virally suppressed.
(Outcome)
17.I.A.2: Number of
RWHAP Part A visits for
health-related care.
(Output)
4020.01: Number of
AIDS Drug Assistance
Program (ADAP) clients
served through State
ADAPs annually.
(Output)
4020.02: Amount of
savings by State AIDS
Drug Assistance
Programs (ADAPs)
participation in costsavings strategies on
medications. (Efficiency)
4020.03: Percentage of
HIV-positive pregnant
women in Ryan White
HIV/AIDS Programs
who receive antiretroviral
medications. (Output)
18.I.A.2: Number of
RWHAP Part B visits for
health-related care.
(Output)
19.II.A.3: Number of
RWHAP Part C visits for
health-related care.
(Output)
Year and Most
Recent Result /
Target for Recent
Result /
(Summary of Result)
FY 2022: 88.7%
FY 2024
Target
FY 2025
Target
FY 2025
+/FY 2024
85%
85%
Maintain
Discontinued
Discontinued
N/A
289,000
289,000
Maintain
$2.5 billion
Maintain
Discontinued
Discontinued
N/A
Discontinued
Discontinued
N/A
Discontinued
Discontinued
N/A
Target: Not Defined
(Historical Actual)
FY 2022: 3.1 million
Target: 3.3 million
(Target Not Met)
FY 2021: 289,290
Target: 285,000
(Target Exceeded)
FY 2021: $2.57 billion $2.5 billion
Target: Sustain Prior
Year Results
(Target Met)
FY 2021: 99.6%
Target: 96%
(Target Exceeded)
2022: 2.7 million
Target: 2.7 million
(Target Met)
FY 2022: 2.2 million
Target: 2.2 million
(Target Met)
301
302.
Measure20.II.A.2 Number of
RWHAP Part D visits for
health-related care and
support services.
(Output)
4060.01 Number of new
clients served by
RWHAP EHE-funded
providers (Output)
4060.02 Percentage of
new clients who are
virally suppressed among
those clients in medical
care served by RWHAP
EHE-funded providers
(Outcome)
Year and Most
Recent Result /
Target for Recent
Result /
(Summary of Result)
FY 2022: 1.5 million
FY 2025
+/FY 2024
FY 2024
Target
FY 2025
Target
Discontinued
Discontinued
N/A
20,000
20,000
Maintain
76.2%
76.2%
Maintain
Target: 1.5 million
(Target Met)
FY 2021: 22,413
Target: Not Defined
(Historical Actual)
FY 2021: 78.6%
Target: Not Defined
(Historical Actual)
Considerations for Target Setting
The RWHAP aims to continue to achieve high viral suppression rates for clients in medical care
that far exceed the national average and to reduce the health disparity in viral suppression rates
among racial and ethnic minorities. The following helped inform the methodology for
establishing all four viral suppression targets (both RWHAP and EHE-specific targets):
People with HIV who are not engaged in care tend to have more complex needs than
those that remain engaged. Multiple studies indicate that patients retained in care are
more likely to achieve viral suppression compared to those not engaged in regular care.
Viral suppression can take up to three months to achieve based on viral dynamics if the
person is routinely engaged in care and able to maintain adherence to HIV medications.
Due to the significant number of clients who are not in care or routinely retained in care
who will be engaged/re-engaged through the EHE efforts, there is a potential impact that
new EHE clients may have on overall viral suppression rates as people who are not in
care or not retained in care routinely have lower viral suppression rates.
Despite the improved rates of durable viral suppression in the RWHAP overall,
populations with multiple needs, including clients who have been out of care and who
have co-morbidities such as mental health challenges, substance use disorders, or are
unhoused, remain at increased risk of not meeting optimal viral suppression.150
150
Durability of viral suppression with first-line antiretroviral therapy in patients with HIV in the UK: an
observational cohort study. Lancet HIV. 2017 Jul;4(7):e295-e302.
302
303.
The FY 2024 and 2025 targets for Measure 4000.04 were reduced to reflect a downward trend inthe number of new HIV diagnoses as reported by the CDC and rising health care costs151152.
The FY 2024 target for Measure 4060.01 was reduced and the FY 2025 target was set to
maintain due to the higher costs associated with identifying and linking key populations into care
and treatment. EHE clients face complex barriers to care which requires significant resources and
staffing. This requires significant resources and staffing. Low-barrier HIV clinics and rapid
initiation of antiretroviral therapy (ART) are two successful investments made by EHE-funded
providers to engage people in HIV care and treatment by delivering suites of multiple services,
such as behavioral health and case management, to address complex and intersecting barriers to
care. The reduced target also reflects fewer numbers of new HIV diagnoses and the increasing
costs of maintaining EHE clients in care.
The FY 2025 target for Measure 4060.02 is to maintain enrollment as each year will represent a
new cohort of patients who are new or reengaged in care and who therefore will have lower rates
of viral suppression than the overall RWHAP.
151
Dombrowski JC, et al. Implementation of Low-Barrier Human Immunodeficiency Virus Care: Lessons Learned
From the Max Clinic. Clinical Infectious Diseases. 2023;77(2):252-257.
152
Shade SB, et al. Costs and cost-effectiveness of immediate initiation of antiretroviral therapy upon diagnosis of
HIV (Rapid Start) in the United States. 2023 International AIDS Society Conference.
https://programme.ias2023.org/Abstract/Abstract/?abstractid=5952
303
304.
Health SystemsTAB
304
305.
HEALTH SYSTEMSOrgan Transplantation
FY 2024
Continuing
Resolution
FY 2023
Final Level
FY 2025
President's
Budget
FY 2025
+/FY 2023
BA
$31,549,000
$31,049,000
$67,049,000
+$35,500,000
FTE
7
7
25
+18
Authorizing Legislation: Public Health Service Act, 42 USC § 273 et seq. as amended by P.L.
118-14.
FY 2025 Authorization……………….……….….….….….….…...….….….….….….....Expired
Allocation Method…………Contracts, Competitive Grants/Cooperative Agreements, Other
(Interagency Support)
Program Description
The National Organ Transplant Act requires HRSA to oversee a national Organ Procurement and
Transplantation Network (OPTN) to allocate and distribute donor organs to individuals waiting
for transplants. The recently enacted bipartisan Public Law 118-14, Securing the U.S. Organ
Procurement and Transplantation Network Act, strengthens the tools available to HRSA to
achieve this critical mission. Given the high demand for and limited supply of organs, OPTN
policies are under continual review, and refinement to achieve the best outcomes for patients,
attain the maximum benefit for the maximum number of waitlist candidates, and make the best
use of donor organs in an equitable and efficient manner.
The Organ Transplantation Program extends and enhances the lives of individuals with end-stage
organ failure for whom an organ transplant is the most appropriate therapeutic treatment. Organ
allocation is guided by OPTN policies informed by analytical support from the Scientific
Registry of Transplant Recipients (SRTR). The SRTR provides analytical support to the OPTN
in the development, review, and refinement of organ allocation policies and performance
evaluation. HRSA also publishes user-friendly data dashboards to improve public understanding
of the performance of the system and help patients and their families in decision-making.
HRSA also awards grants to support the administration of the Living Organ Donation
Reimbursement Program (LODRP - formerly Reimbursement of Travel and Subsistence
Expenses toward Living Organ Donation Program) to provide financial assistance to eligible
living organ donors. In recent years, HRSA has increased the income eligibility threshold for the
LODRP to expand access and expanded the qualified reimbursable expenses to include lost
wages and dependent care expenses (child care and elder care) as part of the Agency’s efforts to
increase the number of kidney transplants from living donors and decrease recipient waiting
times. Activities include targeted public education and partnerships with diverse community305
306.
based organizations working on behalf of medically underserved populations to ensure access toprogram resources. Evaluation efforts will assess overall program activities and the impact of
both grants to identify gaps and opportunities to support routine performance improvement
activities.
Patients in need of organ transplant, and their families should have the benefit of a high
functioning organ transplant system. In March 2023, HRSA launched the OPTN Modernization
Initiative to support that goal. The initiative focuses on making improvements in areas such as
technology, governance, data transparency and analytics, operations, and quality improvement
and innovation. The Modernization Initiative is centered around patient and family voices and
improving outcomes for patients. In the President’s FY 2024 Budget, HRSA requested
legislative changes to help implement the Modernization Initiative. Congress responded swiftly
with the enactment of the bipartisan Securing the U.S. Organ Procurement and Transplantation
Network Act, signed into law in September 2023, which provides HRSA with new tools to drive
meaningful change, including improvements in OPTN governance, explicit authorization to
make multiple awards to manage and improve the OPTN, and removal of the statutory annual
appropriations cap.
In FY 2024 HRSA leveraged its new legislative authority by issuing solicitations to support
multiple vendor awards to improve transparency, performance, governance, and efficiency of the
U.S. transplant system. This includes a solicitation to establish an independent Board of
Directors and multi-vendor contract solicitations to bring in the best-in-class IT and other
vendors to support the transition to a modernized OPTN. These steps will increase competition
and, contingent on appropriations, help ensure patients and their families benefit from best-inclass vendors.
Budget Request
The FY 2025 Budget Request for the Organ Transplantation Program of $67.0 million is $36
million above the FY 2023 Final level. This request will support advance the patient-centered
OPTN Modernization Initiative through investments in critical areas to improve system
performance including enhancements in government oversight, including critical steps to build a
more modern OPTN information technology (IT) infrastructure.
The FY 2025 request will enable HRSA to support the critical work needed to launch the
building of a new OPTN IT infrastructure that takes advantage of modern IT capacity to help the
OPTN deliver better support for patients, donors, transplant surgeons and the public. It also will
support the new and independent Board of Directors of the OPTN, including a comprehensive
review of by-laws and conflict of interest policy, and it will support identifying multiple vendors
for operations transition contracts to modernize the OPTN. Resources will focus on the redesign
and modernization of the OPTN system. Additionally, the funding will provide support NextGeneration IT activities and transition to a modernized OPTN IT system that leverages industryleading standards.
HRSA continues to strengthen collaboration with other federal agencies, especially the Centers
for Medicare & Medicaid Services, through the Organ Transplantation Affinity Group (OTAG),
306
307.
focusing efforts on improving equity and performance of the transplantation system. OTAG isworking to implement an interdepartmental coordination strategy that will use data-driven
approaches to maximize the impact of important government levers such as conditions of
coverage, quality measurement, quality improvement, and contract requirements. Current plans
include expanding OPTN transplant center data collection to begin at the time a patient is
referred for an organ transplant and expanding organ procurement organization (OPO) data
collection to adequately meet the data collection specified in the CMS OPO Condition for
Coverage that requires OPOs to report certain data to the OPTN.
The request also includes costs associated with the contract review and award process, follow-up
performance reviews, and other program support costs.
Five Year Funding History
Fiscal Year
FY 2021
FY 2022
FY 2023
FY 2024 CR
FY 2025 President’s Budget
Amount
$29,049,000
$30,049,000
$31,549,000
$31,049,000
$67,049,000
Program Accomplishments
Since the launch of the OPTN Modernization Initiative in March 2023, HRSA has conducted
extensive market research, reviewed responses for information seeking public input on reforms,
hosted two industry day with over 300 participants each, and, engaged in more than 800
individuals, including patients and families, in discussions to better understand the perspectives
of those impacted by current OPTN governance, policies, technology, data, and operations.
One of HRSA’s primary goals for the Organ Transplantation Program is to increase the annual
number of transplants using deceased donor organs. The organ procurement and transplantation
community has increased the number of deceased donor organs procured and organ transplants
performed annually since 2015. The number of deceased donor organs transplanted in calendar
year 2022 was 39,861 compared to 38,093 in calendar year 2021.
In September 2023, HRSA and CMS announced ongoing efforts to improve organ donation,
procurement, and transplantation through OTAG. The announcement described efforts by both
agencies to drive improvements in donations, clinical outcomes, system improvement, quality
measurement and transparency, and regulatory oversight and provided an overview of the OTAG
Action Plan. CMS and HRSA through OTAG are also actively engaged in work to enhance
collaboration on federal policy development and implementation and communication to improve
transparency and advance progress on national goals.
307
308.
HRSA continues to support efforts to remove financial barriers to living organ donation underthe Living Organ Donation Reimbursement Program. The Living Organ Donation
Reimbursement Program processed more donor applications in the first half of the calendar year
2022 (2,073) than in the entire previous calendar year 2021 (1,670). In calendar year 2022, the
Living Organ Donation Reimbursement Program facilitated more than 1,230 living organ
transplants, with more than 45 percent being individuals who are racial and/or ethnic minorities.
Outputs and Outcomes Tables
Measure
5010.01: Annual
number of
deceased donor
organs
transplanted
(Outcome)
5010.02: Annual
rate eligible
deceased donors
become actual
donors after
death.
(Efficiency)
5010.03: Annual
number of
people from
racial/ethnic
minority
populations
receiving living
organ donor
transplants
facilitated via
HRSA’s Living
Organ Donation
Reimbursement
Program
(Outcome)
Year and Most Recent
Result /
Target for Recent Result
(Summary of Result)
FY 2023: 43,115
Target: 33,311
FY 2024
Target
40,000
FY 2025
Target
43,000
FY 2025
Target
+/FY 2024
Target
+3,000
74%
74%
Maintain
424
505
+81
(Target Exceeded)
FY 2023: 67%
Target: 74%
(Target Not Met)
FY 2023: 561
Target: 244
(Target Exceeded)
308
309.
Performance NarrativeThe Budget request proposes an increase to support OPTN modernization which may not impact
expected performance until after FY 2025, given the multi-year timeframe needed for
modernization while ensuring uninterrupted access to life-saving OPTN. For measure 5010.01’s
FY 2025 deceased donor organs transplanted target: the FY 2023 value represented an unusually
high year-to-year percentage increase. For measure 5010.03's FY 2025 transplants target, it is
unclear if FY 2023 data represents a new normal for the program. Accordingly, most FY 2025
targets reflect a modest increase over the recent years.
Grants Awards Table
FY 2024 CR
1
2
FY 2025
President’s Budget
2
$7,000,000
$3,850,000
$3,850,000
$7,000,000 $7,000,000
$500,000 $7,200,000
$500,000 $7,200,000
FY 2023 Final
Number of Awards
Average Award
Range of Awards
309
310.
Blood Stem Cell Transplantation ProgramFY 2023
Final Level
BA
FTE
$51,775,000
7
FY 2024
Continuing
Resolution
$52,275,000
7
FY 2025
President's
Budget
$52,275,000
7
FY 2025
+/FY 2023
+$500,000
---
Authorizing Legislation: Public Health Service Act, Section 379-379B, as amended by Public
Law 117-15
FY 2025
Authorization……………….……….….….….….….…...….….….….….….....$54,009,000
Allocation Method…………………….…………………………………………..Contract
Program Description
The Blood Stem Cell Transplantation Program (BSCTP), which includes the C.W. Bill Young
Cell Transplantation Program (CWBYCTP), and the National Cord Blood Inventory (NCBI) is
charged with increasing the number of transplants for recipients suitably matched to biologically
unrelated bone marrow153 and umbilical cord blood donors. HRSA achieves this goal by: 1)
providing a national system for recruiting potential bone marrow donors; 2) tissue typing
potential marrow donors; 3) building a genetically and ethnically diverse inventory of at least
150,000 new units of high-quality umbilical cord blood units (CBU) for transplantation; 4)
coordinating the procurement of bone marrow and umbilical cord blood units for transplantation;
5) offering patient and donor advocacy services; and 6) providing public and professional
education; collecting, analyzing, and reporting data on transplant outcomes.
Blood stem cell transplantation, which includes bone marrow and cord blood, is a potentially
curative therapy for many individuals with leukemia and other life-threatening blood and genetic
disorders. Each year, nearly 18,000 people in the U.S. are diagnosed with lifethreatening illnesses where blood stem cell transplantation from matched donors is the best
treatment option. Often, the ideal donor is a suitably matched family member; however, only 30
percent of people have a fully matched relative. The other 70 percent, often search for a matched
unrelated adult donor or umbilical cord blood unit.
The BSCTP operates through four major functions that require close coordination and oversight
and supports an Advisory Council that provides recommendations to the HHS Secretary and
HRSA on activities related to the BSCTP. The major functions of the BSCTP are:
Public Health Service Act, Sections 379-379B, as amended by P.L. 117-15 states that the term ‘bone marrow’
means the cells found in the adult bone marrow and peripheral blood.
153
310
311.
The combined Single Point of Access – Coordinating Center (SPA-CC) maintains a system forhealth care professionals and physicians to search electronically for cells derived from adult
marrow donors and cord blood units on behalf of their patients and supports coordination
activities for bone marrow and cord blood.
The Office of Patient Advocacy (OPA) maintains a system for patient advocacy, which provides
individualized patient services for ongoing searches for bone marrow donors or cord blood units.
The OPA also assists patients with information regarding treatment options and payment matters.
The Stem Cell Therapeutic Outcomes Database (SCTOD) is an electronic blood stem cell
transplant outcomes database for researchers and health care professionals. The SCTOD
provides a repository that stores donor and recipient samples for research and the collection and
analysis of data on clinical outcomes of blood stem cell transplants.
The BSCTP also provides funds through competitive contracts for the collection and storage of
qualified CBUs by a network of public umbilical cord blood banks in the U.S. HRSA prioritizes
cord blood banks that have biological license agreements with the U.S. Food and Drug
Administration and the demonstrated capability to collect and bank significant numbers of CBUs
from genetically and ethnically diverse populations.
Budget Request
The FY 2025 Budget Request for the Blood Stem Cell Transplantation Program of $52.3 million
is $0.5 million above the FY 2023 Final level. The FY 2025 request supports continued progress
toward the statutory goal of building a genetically and ethnically diverse inventory of at least
150,000 new units of high-quality cord blood for transplantation. HRSA expects the registry will
list approximately 4 million adult donors who self-identify as belonging to an underrepresented
racial or ethnic population and add approximately 3,100 cord blood units in FY 2025. The
budget request also continues the following activities: 1) collecting comprehensive outcomes
data on both related and unrelated-donor blood stem cell transplants; 2) assessing the quality of
life for transplant recipients; 3) working with foreign transplant centers to obtain data on U.S.
stem cell products provided for transplant; and 4) continuing critical planning in collaboration
with HHS on a response to a potential national radiation or chemical emergency. In such an
event, casualties could involve temporary or permanent marrow failure and could require
emergency transplants for individuals unable to recover marrow function.
The funding request also includes costs associated with the grant review and award process,
follow-up performance reviews, and information technology and other program support costs.
311
312.
Five Year Funding HistoryFiscal Year
FY 2021
FY 2022
FY 2023
FY 2024 CR
FY 2025 President’s Budget
Amount
$49,275,000
$50,275,000
$51,775,000
$52,275,000
$52,275,000
Program Accomplishments
The Blood Stem Cell Transplantation Program continues to serve a diverse patient population,
with volunteer adult donors and umbilical CBUs playing a vital role in expanding transplant
access to patients from underrepresented racial and ethnic populations. Increasing the number of
blood stem cell transplants facilitated for patients from genetically and ethnically diverse
backgrounds addresses the statutory aim of ensuring comparable access to transplantation for
patients from all populations. As of the end of FY 2023, more than41 million potential adult
volunteer donors and more than 122,500 HRSA-funded CBUs (see Table 1) were listed on the
C.W. Bill Young Cell Transplantation Program's registry.
Table 1. Cord Blood Collections
Fiscal Year
2016
2017
2018
2019
2020
2021
2022
2023
HRSA-funded
NCBI CBU
5,840
6,369
7,774
3,958
4,567
4,117
3,937
4,675
CBU Collected and
Made Available154
for Patient Searches
6,660
7,719
4,889
4,594
4,049
5,418
3,556
2,026
Cumulative CBU
Made Available
90,261
97,980
102,869
107,463
111,512
116,930
120,486
122,512
HRSA met the FY 2022 goal of 3.84 million adult donors who self-identified as belonging to an
underrepresented racial or ethnic population were listed and made available for search through
the C.W. Bill Young Cell Transplantation Program. HRSA expects the registry will list 4.02
million adult donors who self-identify as belonging to an underrepresented racial or ethnic
population and will add 3,127 CBUs in FY 2024. The number of CBUs collected varies yearly
154
Due to the lag between when cord blood units are collected and when they have been fully tested and qualified
for listing on the public registry, not all the units collected with funds from a given fiscal year will be available on
the registry during that same fiscal year.
312
313.
based on funding levels and the contractors' proposed goals to collect and store units fromdiverse populations.
The total number of CBUs released for transplantation has steadily decreased since FY 2017 due
to the increasing use of alternative curative therapies, as shown in Table 2. Despite the overall
downward trend, cord blood banking remains critical in providing care for diverse populations.
In FY 2023, 281 HRSA-funded cord blood units were used for transplants.
Table 2. Cord Blood Units Released for Transplantation
HRSA-funded CBUs
Released for
Transplantation
Fiscal Year
2017
2018
2019
2020
2021
2022
2023
494
493
459
344
313
342
281
Total CBUs (HRSA-funded and
Non-HRSA funded) released for
Transplantation through the
BSCTP
1,050
949
848
702
589
576
506
Outputs and Outcomes Tables
Measure
5020.01: The cumulative
number of cord blood
units from
underrepresented racial
and ethnic populations
available through the
C.W. Bill Young Cell
Transplantation Program
(Outcome)
Year and Most
Recent Result/
Target for Recent
Result
(Summary of Result)
FY 2023: 172,000
Target: 149,721
(Target Exceeded)
313
FY 2024
Target
173,770
FY 2025
Target
175,770
FY 2025
Target
+/FY 2024
Target
+2,000
314.
Year and MostRecent Result/
Target for Recent
Result
(Summary of Result)
FY 2023: 122.512
Target:117,000
Measure
5020.02: The number of
HRSA-funded cord blood
units banked and available
through the C.W. Bill
(Target Exceeded)
Young Cell
Transplantation Program
(Outcome)
5020.03: The number of
FY 2023: 3281
cord blood units released
Target: 350
for transplant. (Outcome)
(Target Not Met)
5020.04: The annual
FY 2023: 6,964
number of blood stem cell Target: Not Defined
transplants facilitated by
the Program. (Outcome)
(Historical Actual)
5020.05: The annual
FY 2023: 1,457
number of blood stem cell Target: Not Defined
transplants facilitated for
minority patients by the
(Historical Actual)
Program (Outcome)
5020.08: The unit cost of
FY 2023: $58.00
human leukocyte antigen
Target: $58.00
(HLA) typing of potential
donors. (Efficiency)
(Target Met)
5020.09: The number of
FY 2023: 4 million
adult volunteer potential
Target: 3.84 million
donors of blood stem cells
from under-represented
(Target Met)
racial and ethnic
populations. (Outcome)
FY 2024
Target
118,600
FY 2025
Target
121,600
FY 2025
Target
+/FY 2024
Target
+3,000
Discontinued
Discontinued
N/A
Not Defined
7,388
N/A
Not Defined
1,545
N/A
Discontinued
Discontinued
N/A
4.02 million
4.08 million
+0.06
million
Performance Narrative
The 5020.01 Performance Measure Data shows there are over 20,000 CBUs designated as
"unknown race/ethnicity" as not every cord blood bank requires donors to provide race/ethnicity
information. The inability to properly categorize these units subsequently impacts tracked data.
The 20,000 CBUs are not included in Measure 5020.01 but are included in Measure 5020.05, the
total number of cord blood units available through the BSCTP. FY 2025 projections were
updated based on unit projections by the contractor. Due to advances in the field, the number of
unrelated blood stem cell transplants using cord blood has been on the decline, which may
impact established targets for Measure 5020.03.
314
315.
Measures 5020.04 and 5020.05 are long-term measures with targets of 7,388 for Measure5020.04 and 1,545 for Measure 5020.05. The Blood Stem Cell Transplantation Program will
start the collection of data beginning in FY 2025.
Contract Awards Table
FY 2023
Final
Number of Awards
FY 2025
President’s Budget
FY 2024 CR
9
9
9
Average Award
$5,457,782
$5,440,264
$5,440,264
Range of Awards
$180,000-$23,298,805
$70,000-$23,298,805
$70,000-$23,298,805
315
316.
National Hansen’s Disease ProgramFY 2023
Final Level
BA
FTE
$13,706,000
37
FY 2024
Continuing
Resolution
$13,706,000
37
FY 2025
President's
Budget
FY 2025
+/FY 2023
$13,706,000
37
-----
Authorizing Legislation: Public Health Service Act, Section 320, as amended by Public Law
1057-220
FY 2025 Authorization ..............................................................................………………Indefinite
Allocation Method…………….…………………………….Direct Federal/Intramural, Contract
Program Description
Since 1917, the National Hansen’s Disease Program (NHDP) has provided medical care,
education, and research for Hansen’s disease (leprosy) and related conditions. Medical care
includes providing direct patient care (diagnosis, treatment, and rehabilitation), Hansen’s disease
drug regimens, consultations, laboratory services, and outpatient referral services to any patient
residing in the United States (U.S.) or its territories at no cost. The Program strengthens the
safety net infrastructure for patients with this rare disease by focusing on case management,
patient compliance, and clinical training on the diagnosis and management of Hansen’s disease.
The Program makes specific outreach efforts to health care providers who are likely to encounter
and treat patients in geographic areas most impacted by the disease. The more complicated
Hansen’s disease cases are treated as short-term referrals in the NHDP clinic in Baton Rouge,
Louisiana.
Ninety-five percent of the human population is not susceptible to infection with Mycobacterium
leprae or Mycobacterium lepromatosis - the bacteria that cause leprosy. Hansen's disease is not
highly transmissible, is very treatable, and is not disabling with early diagnosis and treatment.
Treatment with standard antibiotic drugs is very effective, and patients become
noninfectious after taking only a few doses of medication and need not be isolated from family
and friends. However, diagnosis in the U.S. is often delayed because many health care providers
are unaware of Hansen's disease and its symptoms. Early diagnosis and treatment prevent nerve
involvement and the disability it causes. People with leprosy can generally continue their normal
work and other activities while under treatment, which may last several years.
Increasing health care provider knowledge about Hansen’s disease will lead to earlier diagnosis
and treatment and arrest the trajectory of Hansen’s disease-related disability and deformity. The
Program facilitates outpatient management of leprosy by providing additional laboratory,
diagnostic, consultative, and referral services to private-sector physicians. NHDP increases U.S.
health care providers’ knowledge by serving as an education and referral center.
316
317.
Outpatient care through NHDP is comprehensive and includes treatment protocols for multi-drugtherapy, diagnostic studies, provider consultations, ancillary medical services, clinical laboratory
analysis, hand and foot rehabilitation, leprosy surveillance, and patient transportation.
The Program is improving health outcomes through scientific research. Early diagnosis and
treatment are essential for decreasing Hansen’s disease-related disability. With advanced
scientific knowledge and breakthroughs in genomics and molecular biology, the Program has
advanced the standard of care for leprosy diagnosis and treatment. Currently, lab research uses
rapid techniques for diagnosis, assessment of drug resistance, and strain typing of leprosy bacilli
to support effective treatment and determine the origin and transmission of infection.
NHDP is the sole worldwide provider of reagent-grade viable leprosy bacilli and collaborates
with researchers across the globe to support scientific advances related to the disease. NHDP
coordinates and collaborates with Federal, State, local, and private programs to promote and
improve the quality of care and health outcomes related to Hansen’s disease.
Budget Request
The FY 2025 Budget Request for the National Hansen’s Disease Program of $13.7 million is
equal to the FY 2023 Final level. This request supports the Program’s primary focus of direct
patient care activities and improving health outcomes for Hansen’s disease patients. The funding
level reflects improvements in health outcomes through research and health care provider
education.
HRSA will fund twelve ambulatory care contracts in FY 2025 with continuing efforts to align
resources with levels of care. Funding will also allow Hansen’s disease patients with severe
complications who are advanced on the Hansen’s disease spectrum or who have Hansen’s
disease-related disabilities to be referred to the primary clinic in Baton Rouge, free of charge.
The Program also provides free Hansen’s disease medication to all providers upon request for the
care and treatment of Hansen’s disease patients in the U.S. and its territories.
The FY 2025 request will allow the Program to expand and enhance outreach and training
activities to improve early diagnosis and treatment to reduce permanent disability in patients.
The funding also includes costs associated with the contract review and award process, follow-up
performance reviews, information technology, and other program support costs.
Five Year Funding History
Fiscal Year
FY 2021
FY 2022
FY 2023
FY 2024 CR
FY 2025 President’s Budget
Amount
$13,706,000
$13,706,000
$13,706,000
$13,706,000
$13,706,000
317
318.
Program AccomplishmentsIn FY 2023, NHDP conducted 1,073 face-to-face patient encounters at its location in Baton
Rouge, LA. Additionally, the Program has recorded 1,360 telehealth encounters. NHDP’s eleven
contracted ambulatory care clinics have cumulatively logged over 1,100 patient encounters. The
use of telehealth platforms improves access to care and exposure to healthcare expertise for
patients who are remote or who are not well-resourced. Many of these patients may lack health
insurance, have a low healthcare literacy, or be employed in positions that do not allow paid time
off for travel to the Baton Rouge, LA NHDP clinic. Likewise, telehealth also benefits patients
who possess these resources but choose not to travel for expertise and care. This is evidenced by
the increase in telehealth visits since the onset of the COVID-19 public health emergency (PHE),
the continued increase in the volume of consultations at the NHDP, and the diverse patient
population mix served.
Other NHDP accomplishments in FY 2023 include:
Awarded 12 new Ambulatory Care Clinic contracts
Dispensed 3,904 prescriptions nationally
Trained 1,471 healthcare professionals and scientists
Supplied 83 billion viable M. leprae bacteria to national and international research
scientists
Evaluated 10 drugs for anti-M. leprae and 1 drug for wound healing in armadillos
Completed the program’s first debit card program for patient reimbursement.
Outputs and Outcomes Tables
Measure
5050.01 Number of
health care
providers who have
received training
from NHDP
(Output)
5050.02 Number of
human tissue
samples on which
clinically diagnostic
Polymerase Chain
Reactions were
performed (Output)
Year and Most Recent
Result/Target for
Recent Result
(Summary of Result)
FY 2024
Target
FY 2025
Target
FY 2025
+/FY 2024
FY 2023: 800
Target: 600
(Target Exceeded)
700
800
+100
FY 2023: 247
Target: 200
(Target Exceeded)
200
225
+25
318
319.
Performance NarrativeSince 2021, NHDP has increased its outreach and education efforts to both the medical provider
community and the public using increased virtual training, HRSA-approved YouTube videos,
and an enhanced learning management system. These modalities have proven to be effective in
allowing NHDP to meet its target numbers for provider training for FY 2022 and FY 2023.
In FY 2022 the NHDP opened in-person training opportunities to the healthcare community to
learn more about the management of neuropathic foot care. The in-person training was
successful, and the NHDP has increased hands-on courses to include casting, splinting,
offloading, and observational training for healthcare providers to provide care for insensate
hands and feet that can result in wounds when early detection and intervention are not
completed. The hands-on programs will continue in FY 2024.
NHDP conducts Polymerase Chain Reactions (PCR) on all tissue samples received. Using PCR
in conjunction with a histopathological interpretation of tissue samples increases the accuracy of
Hansen’s disease diagnosis. Additionally, using PCR alone provides the determination of a
positive diagnosis sooner, allowing the provider to start treatment protocols without delay.
Finally, PCR is the only test currently available to distinguish between M. leprae and M.
lepromatosis infection, which has important implications in the clinical management of the
disease.
The FY 2025 request will allow NHDP to continue: 1) producing instructional videos about the
diagnosis and treatment of Hansen’s disease; and 2) increasing outreach and education to the
medical community. In addition, it will support an enhanced experience for the public through
the National Hansen’s Disease Museum in Carville, Louisiana. Finally, the request will provide
for the purchase and maintenance of state-of-the-art laboratory equipment to continue the
Program’s timely, high-quality PCR testing of patient tissue samples.
319
320.
National Hansen’s Disease Program – Buildings and FacilitiesFY 2023
Final Level
BA
FTE
$122,000
---
FY 2024
Continuing
Resolution
$122,000
---
FY 2025
President's
Budget
$122,000
---
FY 2025
+/FY 2023
-----
Authorizing Legislation: Public Health Service Act, Sections 320 and 321(a)
FY 2025 Authorization ......................................................................................................Indefinite
Allocation Method .................................................................................................... Direct Federal
Program Description
This activity provides for facility-related expenses for the buildings and facilities of the National
Hansen’s Disease Center in the vicinity of Baton Rouge, Louisiana, to eliminate deficiencies
according to applicable laws, and in keeping with accepted standards of safety, comfort, human
dignity, efficiency, and effectiveness. Projects ensure safe facilities and functional environments
for patients, research animals, the public, and staff.
Budget Request
The FY 2025 Budget Request for the National Hansen’s Disease Program – Buildings and
Facilities of $122,000 is equal to the FY 2023 Final level. The request will facilitate the ongoing
maintenance of all the National Hansen’s Disease Program facilities and minor upgrades. The
program is currently working with the Louisiana Military Department at Carville to procure a
flooring and lighting renovation to enhance the visitor experience.
Five Year Funding History
Fiscal Year
FY 2021
FY 2022
FY 2023
FY 2024 CR
FY 2025 President’s Budget
Amount
$122,000
$122,000
$122,000
$122,000
$122,000
Program Accomplishments: The museum closed in April 2020 due to the National Public
Health Emergency due to COVID-19 and reopened in July 2022. During FY 2023 the museum
conducted 63 tours and had 1,426 visitors.
320
321.
National Hansen’s Disease Program - Payment to HawaiiFY 2023
Final Level
BA
FTE
$1,857,000
---
FY 2024
Continuing
Resolution
$1,857,000
---
FY 2025
President's
Budget
FY 2025
+/FY 2023
$1,857,000
---
-----
Authorizing Legislation: Public Health Service Act, Section 320(d), as amended by Public Law
105-78, Section 211
FY 2025 Authorization………………………………………………………………Indefinite
Allocation Method…………………………………………………………. Direct Federal
Program Description
Payments are made to the State of Hawaii for the medical care and treatment of persons with
Hansen’s disease. Through the Hansen’s Disease Community Program administered by the
Hawaii Department of Health, the State monitors and treats Hansen’s disease throughout Hawaii.
Expenses above the level of the Federal funds appropriated for the support of medical care are
borne by the State of Hawaii.
Budget Request
The FY 2025 Budget Request for the National Hansen’s Disease Program - Payment to Hawaii
of $1.9 million is equal to the FY 2023 Final Level. This request supports the payment made to
the State of Hawaii for the medical care and treatment of persons with Hansen’s disease.
Five Year Funding History
Fiscal Year
FY 2021
FY 2022
FY 2023
FY 2024 CR
FY 2025 President’s Budget
Amount
$1,857,000
$1,857,000
$1,857,000
$1,857,000
$1,857,000
Program Accomplishments
In FY 2024, the Program experienced an increase in new cases back to pre-Covid levels.
Migration into Hawaii has increased due to travel restrictions lifted in countries in the Pacific
where the incidence of Hanen’s disease continues to be high. The program continues its outreach
and education activities to Job Corps and community groups now that in-person interactions can
321
322.
take place. The program also continues to conduct ongoing contact investigations and tracing,education, and has noticed increased referrals from families of index cases to their assigned
Hansen’s disease Public Health Nurses (PHNs). This contact, outreach, and screening involves
the travel of staff to neighboring islands which is now back to pre-Covid frequency. Individuals
who are screened and show symptoms of Hansen’s disease are referred for further medical
evaluation and the program covers the cost of biopsies and testing for uninsured individuals. The
program continues to find community health center programs on Oahu and the Neighbor Islands
to ensure access to referrals from the Program and keep the care of Hansen’s disease
mainstreamed in the medical care system along with specialist providers following cases.
Infectious disease MDs were found in both North Hawaii and Kona establishing access to
Hansen’s disease care as well. Neighbor Island trips to coordinate visits for new cases in this
area have helped with continuity of care and building case management with local PHNs. More
intensive case management continues to be required for the formerly institutionalized Hansen’s
disease patients who elected to live in the community on their own. This population is steadily
aging and requiring additional services and assistive aids to keep them safe in their own homes.
322
323.
RURAL HEALTHPOLICY
TAB
323
324.
FEDERAL OFFICE OF RURAL HEALTH POLICYRural Health Policy Development
FY 2024
Continuing
Resolution
FY 2023
Final
FY 2025
President’s
Budget
FY 2025
+/FY 2023
BA
$11,076,000
$11,076,000
$11,076,000
---
FTE
3
3
3
---
Authorizing Legislation: Social Security Act, Section 711, as amended by the 21st Century Cures
Act of 2016, Sections 2012, 2013, 2035, and 2043, Public Law 114-255.
FY 2025 Authorization……………………………...……………………………….Indefinite
Allocation Method………………………………Competitive Grants/Cooperative Agreement
Program Description
Section 711 of the Social Security Act gives the Federal Office of Rural Health Policy the HHSwide responsibility for analyzing the possible effects of HHS programs and policy, particularly
Medicare and Medicaid policy, on those living in rural communities. This authorizing legislation
also directs FORHP to administer grants, cooperative agreements, and contracts to provide
technical assistance and other activities as necessary to support activities related to improving
health care in rural areas. Rural Health Policy Development funds a number of programs that
provide information and technical assistance to support the improvement of health care in rural
areas while aligning with FORHP’s advisory and programmatic role. These programs include
supporting clearinghouses for collecting and disseminating information on rural health care
issues, sharing promising approaches to improving and enhancing health care delivery in rural
communities, and for disseminating policy-relevant research findings addressing rural health
care delivery.
FORHP provides funding for the only Federal research programs specifically designed to
provide publicly available, policy relevant studies on rural health issues. The Rural Health
Research Center (RHRC) Program funds eight research centers to conduct policy-oriented health
services research. The RHRCs produce policy briefs and peer-reviewed journal manuscripts and
make their publications available to policy makers and other rural stakeholders at both the
Federal and state levels. The Rapid Response Rural Data Analysis and Issue Specific Rural
Research Studies Program supports one award to conduct rapid data analyses and short-term
rural research studies. The Rural Health Research Dissemination Program, currently awarded to
the Rural Health Research Gateway, disseminates and promotes FORHP-funded rural health
services research to stakeholders at the national, state, and community levels with the goal of
informing and raising awareness of key policy issues important to rural communities. This
research also aligns with Administration priorities, such addressing substance use, increasing
access to care, and improving health equity.
FORHP funds programs that collect and disseminate information on rural health care issues and
identify promising approaches to improving and enhancing health care delivery in rural
324
325.
communities. The National Rural Health Information Clearinghouse Program, which iscompetitive in FY 2025 and is currently awarded to the Rural Health Information Hub, serves as
a clearinghouse for information on rural health, including HRSA’s rural health programs, for
residents of rural areas in the United States and other rural health stakeholders. The National
Rural Health Policy, Community, and Collaboration Program engages rural stakeholders to
educate and collaborate on national rural health policy issues and promising practices to improve
the health of people living in rural communities nationwide. The Rural Telementoring Training
Center Program provides training for academic medical centers and other centers of excellence
to create technology-enabled telementoring learning programs that focus on reaching regionally
diverse populations and addressing unique cultural aspects across rural areas. The Rural Health
Clinic (RHC) Technical Assistance Program identifies key policy, regulatory, programmatic, and
clinical issues facing RHCs and informs RHCs and other rural stakeholders about key RHC
issues. The Rural Health Innovation and Transformation Technical Assistance Program provides
technical assistance to support rural health care through innovative payment models and to
promote the value-based care landscape in the context of rural health care.
Rural Health Policy Development also supports the staffing for the National Advisory
Committee on Rural Health and Human Services (NACRHHS), which advises the HHS
Secretary on rural health and human service programs and policies, produces policy briefs, and
makes recommendations on emerging rural policy issues.
Budget Request
The FY 2025 Budget Request for the Rural Health Policy Development program of $11.1
million is equal to the FY 2023 Final level. This request would allow HRSA to fully fund the
following: Rural Health Research Center Program; Rapid Response Rural Data Analysis and
Issue Specific Rural Research Studies Program; Rural Health Research Gateway; National Rural
Health Information Clearinghouse Program; National Rural Health Policy, Community, and
Collaboration Program; Rural Telementoring Training Center Program; Rural Health Clinic
Technical Assistance Program; Rural Health Innovation and Transformation Technical
Assistance Program; and the National Advisory Committee on Rural Health and Human
Services. The funding request also includes costs associated with the grant review and award
process, follow-up performance reviews, and information technology and other program support
costs.
Five Year Funding History
Fiscal Year
FY 2021
FY 2022
FY 2023
FY 2024 CR
FY 2025 President’s Budget
Amount
$11,076,000
$11,076,000
$11,076,000
$11,076,000
$11,076,000
325
326.
Program AccomplishmentsThe Rural Health Research Center Program increases the amount of publicly available, policyrelevant research to assist providers and policymakers at the federal, state, and local levels to
better understand health and health care problems faced by rural communities. This research
informs and is regularly cited in Medicare rulemaking, Congressional testimony, and reports by
the U.S. Government Accountability Office, among other applications and is also shared with
key Congressional Committees. This work also informs FORHP’s statutory charge to advise the
HHS Secretary on rural health policy issues. The eight research centers each receiving funding
for four research projects per fiscal year with the expectation that each project will result in at
least one publication. Examples of recent research include:
• Examining rural hospital closures, including characteristics associated with increased
closure risk and the economic effects of hospital closures
• Highlighting rural models for maternal health services and postpartum supports
• Quantifying and investigating trends in health workforce supply in rural areas, including
in specific areas like obstetric care and behavioral health
• Geographic disparities in the availability of ambulance services
• Rural-urban differences in the affordability of health care
Through the Rapid Response Rural Data Analysis and Issue Specific Rural Research Studies
Program FORHP continues to monitor and track the number of rural hospitals across the country
that have closed completely or converted to another type of facility that provides only noninpatient care. From January 1, 2010, to December 1, 2023, 148 rural hospitals have either closed
completely or converted to another facility type that does not provide hospital services.
Additionally, from January 1, 2023, to December 1, 2023, 18 rural hospitals have converted to
Rural Emergency Hospitals and are currently offering services as this new type of rural provider.
FORHP has funded a number of grants that focus on addressing hospital closures, particularly
mitigating the loss of services due to hospitals closing or facing financial distress as well as the
impact of loss of rural hospital obstetric services.
Outputs and Outcomes Tables
Measure
6010.01 Number of
rural health research
products released
during the fiscal year
(Output)
Year and Most
Recent Result /
Target for
Recent Result/
FY 2024
(Summary of
Target
Result)
FY 2023: 81
47
Target: 47
(Target
Exceeded)
326
FY 2025
Target
47
FY 2025
Target +/FY 2024
Target
Maintain
327.
Performance NarrativeIn FY 2023, these Federally-funded research programs conducted and disseminated 81 research
reports, including policy briefs posted on the Rural Health Research Gateway website and
manuscripts published in peer-reviewed journals. This was significantly above the FY 2023
target of 47 research products because several studies resulted in multiple publications. The rural
research program is developing more robust technical research products and comprehensive
chartbooks and fewer short research briefs. HRSA anticipates that this adjustment will result in a
decrease in the total number of research products in FY 2024 and FY 2025 compared to FY
2023. Targets for this measure in future years remain consistent to reflect the requirement of one
publication per research project and level funding of the program.
Grant Awards Tables
FY 2023 Final
FY 2024 CR
FY 2025 President’s
Budget
16
16
15
Average Award
$830,000
$830,000
$863,000
Range of Awards
$100,000 $3,000,000
$100,000 $3,000,000
$100,000 $3,000,000
Number of Awards
327
328.
Rural Health Outreach GrantsFY 2024
Continuing
Resolution
FY 2023
Final
FY 2025
President’s
Budget
FY 2025
+/FY 2023
BA
$92,975,000
$92,975,000
$92,975,000
---
FTE
14
17
17
+3
Authorizing Legislation: Public Health Service Act, Section 330A, as amended by CARES Act,
Section 3213, Public Law 116-136, and Social Security Act, Section 711, as amended by Public
Law 108-173.
FY 2025 Authorization (330A)……..……………..………………………………….$79,500,000
FY 2025 Authorization (711)….……………………………………..Indefinite
Allocation Method……………………..………Competitive Grants and Cooperative Agreements
Program Description
The Rural Health Care Services Outreach, Network and Quality Improvement Grants (Outreach
programs) improve rural community health by focusing on quality improvement, increasing
health care access, coordination of care, and integration of services.
Outreach grant programs support collaborative models to deliver basic health care services to
rural areas and are uniquely designed to meet rural needs. The grants allow rural communities to
compete for funding against other rural communities, rather than competing against metropolitan
communities with greater resources. The Outreach programs are structured to allow applicants
and grantees to determine the best ways to meet local needs. This flexibility responds to the
unique health care challenges in rural communities and enables communities to determine the
best approaches for addressing their specific needs. Eligible entities for these programs are
community-based organizations serving rural areas. The grants provide initial start-up funding
and recipients then identify and implement strategies to continue the projects after federal
funding.
Rural Health Care Services Outreach Program focuses on improving access to health
care in rural communities through community coalitions and evidence based and
promising practice models. These grants focus on disease prevention, health
promotion, and can support the expansion of services around primary care, opioid
use disorder treatment and prevention, behavioral health, and oral health care.
HRSA will support over 40 new awards in FY 2025.
Rural Health Network Development Program supports formalized partnerships
among health care providers and social and community service organizations
collaborating to improve access and enhance the quality of healthcare in rural areas.
The program focuses on demonstrating improved health outcomes resulting from
328
329.
network collaboration, as well as positioning healthcare networks and theirproducts and services to be sustainable as the health care landscape continues to
evolve. Grantees under this program are likely to focus on improving health
outcomes, enhancing health care quality, and increasing services provided by the
network. HRSA will support 44 continuing awards in FY 2025.
Rural Health Network Development Planning Program provides support to rural
communities to identify local health care challenges and develop potential solutions
for emerging local public health issues, such as care coordination, patient
engagement, rural hospital closure/conversion, telehealth, mental health, and
substance use disorder. HRSA will make over 10 new awards in FY 2025.
Small Healthcare Provider Quality Improvement Grants help improve patient
care and chronic disease outcomes by assisting rural primary care providers with
the implementation of quality improvement activities. Specifically, program
objectives include increased care coordination, enhanced chronic disease
management, and improved health outcomes for patients. An additional program
goal is to prepare rural health care providers for quality reporting and pay-forperformance programs. HRSA will support 21 continuing awards in FY 2025.
Rural Maternity and Obstetrics Management Strategies (RMOMS) grants improve
access and continuity of maternal and obstetrics care in rural communities. In FY
2019, HRSA created RMOMS as a pilot program in response to research by the
University of Minnesota that revealed a decreasing availability of obstetric units in
rural areas.155 This program intends to demonstrate the impact on access to and
continuity of maternal and obstetrics care in rural communities through testing
models that address the following focus areas:
1) Rural Hospital Obstetric Service Aggregation and Approaches to
Risk Appropriate Care
2) Network Approach to Coordinating a Continuum of Care
3) Leveraging Telehealth and Specialty Care
4) Financial Sustainability
As part of an HHS-wide initiative to improve maternal health, HRSA will support 8
continuing awards and 2 new awards.
Rural Health Care Coordination Program supports rural health
consortiums/networks aiming to achieving the overall goals of improving access,
delivery, and quality of care through the application of care coordination strategies
in rural communities. HRSA will support 10 continuing awards in FY 2025.
Regional Grant Programs: The challenges facing rural communities often involve regional
155
Hung P, Henning-Smith C, Casey M, Kozhimannil, K. Access to Obstetric Services in Rural Counties Still
Declining, with 9 Percent Losing Services, 2004-14. Health Affairs. 2017; 36 (9): 1663-1671.
doi:10.1377/hlthaff.2017.0338
329
330.
patterns and common concerns that cut across state boundaries. The Federal government hasused regional commissions and authorities as a strategy to address unique circumstances. HRSA
administers a number of rural health programs in collaboration with these commissions that
focus on regional concerns.
The Delta States Rural Development Network Grant Program provides network
development grants to the eight states in the Mississippi Delta for network and rural
health infrastructure development. This program is geographically targeted, given
the health care disparities across this eight-state region. The program supports
chronic disease management, oral health services, and recruitment and retention
efforts for health professionals. The program requires grantees to focus on diabetes,
cardiovascular disease, and obesity and to implement programs based on promising
practices or evidence-based models. HRSA will support 12 continuing awards in FY
2025.
The Delta Region Community Health Systems Development Program provides
technical assistance to help under-resourced health care providers (hospitals and
clinics) that serve high-need populations. Through this program, hospitals and
clinics can access high-level technical support that they otherwise would not be able
to support to improve their financial and operational performance. As a result, these
facilities are able to remain economically viable and preserve access to care for
essential services. HRSA implements this program in coordination with the Delta
Regional Authority. Through a single awardee HRSA will continue supporting 20
communities and incorporate 10 new communities for technical assistance in FY
2025. HRSA will re-compete this program in FY 2025.
The Delta Health Systems Implementation Program provides the opportunity for
Critical Access Hospitals and small rural hospitals in rural areas of the Mississippi
Delta Region that have shown mastery and success of their technical assistance
projects through the Delta Region Community Health Systems Development
program to receive direct funding to address complex financial and operation,
quality improvement, telehealth, and workforce development activities. HRSA will
support five continuing awards and five new awards in FY 2025.
The Delta Region Rural Health Workforce Training Program helps improve
healthcare delivery in rural areas by training current and future health professionals
for high-quality jobs in the rural counties and parishes of the Mississippi Delta
Region in the following critical administrative support professions: medical coding
and billing, insurance claims processing, health information management, clinical
documentation, business operations for healthcare organizations, and supply chain
and materials management. HRSA will support five continuing awards in FY 2025.
The Rural Northern Border Region Healthcare Support Program supports rural
communities in the region of the Northern Border Regional Commission (NBRC) in
their efforts to enhance access to health care services; improve recruitment and
330
331.
retention of health care providers; and assist rural hospitals and clinics in theirefforts to take part in health care value efforts. HRSA will support one new award in
FY 2025.
Budget Request
The FY 2025 Budget Request for the Rural Health Outreach Grants program of $93 million is
equal to the FY 2023 Final level. This request will support the continuation of 105 existing
grantees, and 59 new competitive grants that will positively affect health care service delivery
for over 520,000 people. Within this total, $10.4 million is allocated toward RMOMS, which is
equal to the FY 2023 Final level for this activity. This investment will help address unmet needs
for rural communities which include populations who have historically suffered from poorer
health outcomes, health disparities and other inequities. Funding also includes costs associated
with the grant review and award process, follow-up performance reviews, and information
technology and other program support costs.
Five Year Funding History
Fiscal Year
FY 2021
FY 2022
FY 2023
FY 2024 CR
FY 2025 President’s Budget
Amount
$82,153,000
$85,975,000
$92,975,000
$92,975,000
$92,975,000
Program Accomplishments
The programs funded under the Rural Health Outreach authority often develop innovative
approaches that could be replicated in whole or part in other rural communities. To leverage
those lessons learned, the Rural Health Information Hub (RHI Hub) highlights many of the
program successes in the Models and Innovations Hub and also houses summaries of all funded
projects so other communities can learn about successful approaches. This empowers rural
communities nationwide to draw upon these insights and replicate successful program elements
in their own settings. Outreach funds also supported the technical assistance for grantees to
ensure successful implementation of their programs and evaluation to demonstrate outcomes of
the program.
The most recent data show that nearly 476,000 unique individuals received services through the
Outreach, Delta and Quality Improvement Programs and has consistently increased throughout
the years. Additionally, these grants are intended to kick start an initiative that may not be
otherwise be implemented with scarce resources and level of competition within the federal
grants process. Therefore, sustainability of their projects has been a critical element of these
grants and. HRSA expects the majority of projects to continue after Federal funding. In FY
2022, the Rural Health Network Development Program grantees reported that 98% will sustain
all or part of their projects. This is partly accomplished by the technical assistance provided by
FORHP to the grantees during their grant cycle.
331
332.
Grantees use the RHI Hub’s Economic Impact Analysis tool to assess the economic impact ofFederal investments. The tool translates project impacts into community-wide benefits, such as
number of jobs created, new spending, and impacts of new and expanded services. The most
recent data shows that Rural Health Network Development Program grantees generated an
average of $2.00 of economic impact into their rural communities for every HRSA dollar spent.
Additionally, beginning in FY 2021, FORHP assessed grantees that showed improvement in one
or more clinical quality measures. Clinical measures include reductions in diabetic hemoglobin
A1c scores (HgbA1c), blood pressure scores, and body mass index (BMI’s) calculation. For FY
2022, the Small Healthcare Provider Quality Improvement Grants showed that 88% of grantees
showed improvement in at least one or more improvement in clinical measures. These grantees
are operating in a challenging environment given that rural communities have higher rates of
chronic disease and higher rates of avoidable or excess death from the five leading causes of
death as identified by the Centers for Disease Control and Prevention (respiratory disease, injury,
heart disease, cancer and stroke).156
Outputs and Outcomes Tables
Measure
6020.01 Number of
unique individuals who
received direct services
through Federal Office of
Rural Health Policy
Outreach grants (Output)
6020.02 Percent of
Outreach Authority
grantees that will
continue to offer services
after the Federal grant
funding ends. (Output)
Year and Most
Recent Result /
Target for Recent
Result /
(Summary of
Result)
FY 2022: 475,895
FY 2024
Target
FY 2025
Target
FY 2025
Target
+/FY 2024
Target
525,000
525,000
Maintain
85%
85%
Maintain
Target: 430,000
(Target Exceeded)
FY 2022: 98%
Target: 75%
(Target Exceeded)
156
https://www.cdc.gov/chronicdisease/resources/publications/factsheets/research-in-ruralcommunities.htm#:~:text=People%20who%20live%20in%20rural,lower%20respiratory%20disease%2C%20and%2
0stroke.
332
333.
Measure6020.03 Percentage of
grantees that showed
improvement in one or
more clinical quality
measures. (Outcome)
Year and Most
Recent Result /
Target for Recent
Result /
(Summary of
Result)
FY 2022: 88%
FY 2024
Target
90%
FY 2025
Target
90%
FY 2025
Target
+/FY 2024
Target
Maintain
Target: Not
Defined
(Baseline)
Performance Narrative
Due to the flexible nature of Outreach programs, not all grantees have projects with direct clinical
services/outcomes and associated measures. Grantees report on the measures that are applicable
to their funded project. For the purposes of measure 6020.03, “Improvement” is defined as
showing an improvement from baseline (either year 1 or year 2, as not all grantees report in year
1) compared to the end (final year) of the grant.
Grant Awards Tables
FY 2023 Final
Number of Awards
FY 2024 CR
FY 2025 President’s
Budget
184
169
164
Average Award
$329,615
$385,960
$385,960
Range of Awards
$100,000 –
15,000,000
$100,000 $10,000,000
$100,000 $10,000,000
333
334.
Rural Hospital Flexibility GrantsFY 2024
Continuing
Resolution
FY 2023
Final
FY 2025
President’s Budget
FY 2025
+/FY 2023
BA
$64,277,000
$64,277,000
$64,277,000
---
FTE
3
3
3
---
Authorizing Legislation: Social Security Act, Section 1820(j), as amended by Patient Protection and
Affordable Care Act, Section 3129, Public Law 111-148. Social Security Act, Section 711, as
amended by Public Law 108-173
FY 2025 Authorization…………………………………………………………………...Expired
Allocation Method…………………….Competitive Grants/Cooperative Agreements/Contracts
Program Description
The Rural Hospital Flexibility Grants are offered through three grant programs:
Medicare Rural Hospital Flexibility Grant (Flex) Program supports a partnership between
45 states and more than 1,300 Critical Access Hospitals (CAHs) to work on quality,
financial, and performance improvement activities, as well as help eligible rural hospitals
convert to CAH status and enhance CAH-related emergency medical services. The Flex
Program’s goal is to help CAHs maintain high-quality and economically viable facilities
to ensure that rural community residents, particularly Medicare beneficiaries, have access
to high-quality health care services. States use Flex resources to address identified CAH
needs and to achieve improved and measurable outcomes in selected program areas. In
FY 2025, HRSA will continue supporting emergency medical services (EMS) through
awards across eight states focused on building EMS workforce capacity. Additionally,
the general Flex program will continue to support 45 awards.
The Flex Program plays a key role in ensuring that CAHs are aligned with certain
Medicare Program quality initiatives. All prospective payment system hospitals
(PPS) are required to submit quality data to the Centers for Medicare & Medicaid
Services (CMS) to receive a full Medicare payment update. While not subject to this
CMS requirement, CAHs, through this program, can elect to submit quality data to
CMS to demonstrate areas of high quality while also identifying areas for
improvement. This provides an avenue for ensuring that CAH quality efforts are
aligned with broader Medicare quality initiatives without imposing across-the-board
administrative burden on CAHs.
Small Rural Hospital Improvement Program (SHIP) provides support to states who assist
rural hospitals with fewer than 50 beds to enhance their administrative capabilities in
meeting information technology and reporting requirements under value-based care
334
335.
through awards to 46 states with eligible hospitals. SHIP provides funding for equipmentand training to upgrade billing requirements, such as incorporating new ICD-11
standards, and for software that captures patient satisfaction data.
Flex Rural Veterans Health Access Program focuses on improving access and the
delivery of health care services to meet the needs of Operation Iraqi Freedom and
Operation Enduring Freedom veterans living in rural areas.
Rural Emergency Hospital Technical Assistance supports one national center to ensure
rural hospitals and the communities they serve have the information and resources needed
to make informed decisions as to whether the Rural Emergency Hospital model of care is
best for their communities and facilitate a successful implementation of Rural Emergency
Hospital requirements for those hospitals converting to this new provider type.
Budget Request
The FY 2025 Budget Request for the Rural Hospital Flexibility Grants of approximately
$64.3 million is equal to the FY 2023 Final level. This request will fund the continued
efforts to states to support Medicare Rural Hospital Flexibility Grant, Small Rural Hospital
Improvement Grant, and the Rural Veterans Health Access Program. Additionally, this
request will support funding for the Rural Emergency Hospital Technical Assistance.
Funding also includes costs associated with the grant review and award process, follow-up
performance reviews, and information technology and other program support costs.
Five Year Funding History
Fiscal Year
FY 2021
FY 2022
FY 2023
FY 2024 CR
FY 2025 President’s Budget
Amount
$55,442,000
$62,277,000
$64,277,000
$64,277,000
$64,277,000
Program Accomplishments
FORHP strengthened collaboration with rural stakeholders to shape the future of the Medicare
Beneficiary Quality Improvement Project, ensuring alignment with hospital priorities in
delivering high-quality care. Through active engagement with stakeholders, FORHP gained
valuable input on a fundamental set of rural-relevant quality measures, harmonizing them with
existing federal programs. This effort culminated in the development of a strategic framework,
paving the way for rural Critical Access Hospitals (CAHs) to voluntarily report on these
measures, aiming for significant improvements in at least one measure starting in FY 2025.
335
336.
Outputs and Outcomes TablesYear and Most
Recent Result/
Target for Recent
Result/
(Summary of
FY 2024
Result)
Target
FY 2022: 94.6%
78%
Measure
6030.03 Increase the
percent of Critical Access
Hospitals participating in Target: 70%
the Hospital Consumer
Assessment of Healthcare (Target Exceeded)
Providers and Systems
(HCAHPS) survey
(Output)
6030.01 Percentage of
FY 2022: 75%
Critical Access Hospitals
participating in one or
Target: 70%
more Flex-funded required
quality improvement
(Target Exceeded)
initiatives that showed
improvement in one or
more specified quality
domains. (Outcome)
6030.02 Percentage of
FY 2022: 45%
Critical Access Hospitals
participating in one or
Target: 50%
more Flex-funded optional
quality improvement
(Target Not Met)
initiatives that showed
improvement in one or
more specified quality
domains. (Outcome)
FY 2025
Target
78%
FY 2025
+/FY 2024
Maintain
75%
75%
Maintain
55%
55%
Maintain
Performance Narrative
FORHP increased support to states in FY 2021 to focus on quality improvement efforts on
measures meaningful to the hospitals. The percentage of hospitals demonstrating
improvement in both the required and optional quality improvement initiatives increased.
The participation in CAHs in the Hospital Consumer Assessment of Healthcare Providers
& Systems (HCAHPS) patient experience reporting continued to improve. With the focus
on improvement efforts through the program, the targets for FY 2025 are to maintain the
efforts of hospitals focusing on quality, recognizing the continued challenges to finance
and quality that rural hospitals face coming out of the pandemic.
336
337.
Grant Awards TablesFY 2023
Final
103
103
FY 2025
President’s Budget
103
Average Award
$635,000
$635,000
$635,000
Range of Awards
$37,297 - $5,000,000
$37,297 - $5,000,000
$37,297 - $5,000,000
Number of Awards
FY 2024
CR
337
338.
State Offices of Rural HealthFY 2024
Continuing
Resolution
FY 2023
Final
FY 2025
President’s
Budget
FY 2025
+/FY 2023
BA
$12,500,000
$12,500,000
$12,500,000
---
FTE
---
---
---
---
Authorizing Legislation: Public Health Services Act, Section 338J, as reauthorized by State
Offices of Rural Health Reauthorization Act of 2022, Section 2, Public Law 117-356.
FY 2025 Authorization………………………………………………………..Expires FY 2027
Allocation Method……………………………….Competitive Grants/Cooperative Agreement
Program Description
This program provides funding to establish and maintain a State Office of Rural Health (SORH)
within states to strengthen rural health care delivery systems. Every dollar of Federal support is
matched by three state dollars. SORHs serve as focal points and clearinghouses for the collection
and dissemination of information on rural health issues, research findings, innovative
approaches, and best practices pertaining to the delivery of health care in rural areas.
As the state’s rural institutional framework, SORHs help link rural communities with state and
Federal resources to develop long-term solutions to rural health problems. SORHs form
collaborative partnerships to better coordinate rural health activities, maximize limited resources,
and avoid duplication of effort and activities. SORHs facilitate clinical placements through
recruitment initiatives and help rural constituents meet recruitment challenges by sharing
information. SORHs identify Federal, state, and nongovernmental programs and funding
opportunities and provide technical assistance to public and nonprofit private entities regarding
participation in rural health programs.
Budget Request
The FY 2025 Budget Request for the State Offices of Rural Health program of $12.5 million is
equal to the FY 2023 Final level. This request will continue to invest in the State Offices of
Rural Health who will continue to support rural communities by connecting them with resources
about funding opportunities, information on health care policy changes. The State Offices of
Rural Health will partner with federal, regional, state, local agencies, and communities to
improve access to high quality maternal health and behavioral health services in rural areas.
Funding also includes costs associated with the grant review and award process, follow-up
performance reviews, and information technology and other program support costs.
338
339.
Funding HistoryFiscal Year
FY 2021
FY 2022
FY 2023
FY 2024 CR
FY 2025 President’s Budget
Amount
$12,462,000
$12,500,000
$12,500,000
$12,500,000
$12,500,000
Program Accomplishments
With the end of the public health emergency, many SORHs have been working to help rural
stakeholders navigate the impacts of losing Medicaid coverage. SORHs have worked with
various state agencies to ensure residents in rural areas have access to information and systems
related to enrollment services.
Outputs and Outcomes Tables
Measure
6040.01 Number of
technical assistance
(TA) encounters
provided directly to
clients by State Offices
of Rural Health (Output)
6040.02 Number of
clients (unduplicated)
that received technical
assistance directly from
State Offices of Rural
Health. (Output)
6040.03 Number of
clinician placements
facilitated by the State
Offices of Rural Health
through their
recruitment initiatives
(Output)
Year and Most
Recent Result /
Target for Recent
Result /
(Summary of
Result)
FY 2022: 90,745
FY 2024
Target
FY 2025
Target
FY 2025
+/FY 2024
69,000
69,000
Maintain
24,000
24,000
Maintain
1,350
1,350
Maintain
Target: 68,371
(Target Exceeded)
FY 2022: 30,154
Target: 23,611
(Target Exceeded)
FY 2022: 3,262
Target:
1,300
(Target Exceeded)
339
340.
Performance NarrativeThe FY 2022 results are a reflection that all State Offices of Rural Health continue to play a key
role in sharing public health information during through the end of the public health emergency,
and many SORHs were actively involved in state response efforts, which created the opportunity
for SORHs to build new strategic relationships. With the public health emergency ending, the
SORH program anticipates the number of technical assistance encounters, number of clients
receiving technical assistance, and number of clinician placements to reduce as rural
communities rebalance their priorities.
Grant Awards Tables
FY 2023
Final
Number of Awards
FY 2024
CR
FY 2025
President’s Budget
50
50
50
Average Award
$229,270
$229,270
$229,270
Range of Awards
$229,270 - $229,270
$229,270 - $229,270
$229,270 - $229,270
340
341.
Radiation Exposure Screening and Education ProgramFY 2024
Continuing
Resolution
FY 2023 Final
FY 2025
President’s
Budget
FY 2025
+/FY 2023
BA
$1,889,000
$1,889,000
$1,889,000
---
FTE
1
1
1
---
Authorizing Legislation: Public Health Service Act, Section 417C, as amended by National
Institutes of Health Reform Act of 2006, Section 103, 104, Public Law 109-482.
FY 2025 Authorization………………………………………………………………Indefinite
Allocation Method……………………...…………………………………Competitive Grants
Program Description
Established in 2000 under the Radiation Exposure Compensation Act (RECA), (42 U.S.C. 2210
and Public Law 106-245) the Radiation Exposure Screening and Education Program (RESEP)
provides grants to states, local governments, and appropriate health care organizations to support
programs for cancer screening for individuals adversely affected by the mining, transport and
processing of uranium and the testing of nuclear weapons for the Nation’s weapons arsenal.
RECA identifies high-impact states including Arizona, Colorado, Idaho, Nevada, New Mexico,
North Dakota, Oregon, South Dakota, Texas, Utah, Washington, or Wyoming where most of the
target population for RESEP funded projects reside.
RESEP grantees also assist clients with appropriate medical referrals, and engage in public
information development and dissemination. On June 7, 2022, the President signed into law the
RECA Extension Act of 2022. This law extends the termination of the RECA Trust Fund and the
filing deadline for all claims for two years from its date of enactment, extending the statutory
deadline to June 10, 2024. With this change, HRSA’s resources will assist RESEP grantees on
maximizing outreach and education to facilitate RECA claims documentation before this
deadline.
Budget Request
The FY 2025 Budget Request for the Radiation Exposure Screening and Education Program of
$1.9 million is equal to the FY 2023 Final level. This request will continue to support activities
such as: implementing cancer screening programs; developing education programs;
disseminating information on radiogenic diseases and the importance of early detection;
screening eligible individuals for cancer and other radiogenic diseases; providing appropriate
referrals for medical treatment.
Funding also includes costs associated with the grant review and award process, follow-up
performance reviews, and information technology and other program support costs.
341
342.
Five Year Funding HistoryFiscal Year
FY 2021
FY 2022
FY 2023
FY 2024 CR
FY 2025 President’s Budget
Amount
$1,828,000
$1,889,000
$1,889,000
$1,889,000
$1,889,000
Program Accomplishments
RESEP grantees have continued to implement cancer screening and education programs, share
information on radiogenic diseases and the importance of early detection, screen eligible
individuals for cancer and other radiogenic disease, provide appropriate referrals for medical
treatment, and facilitate documentation of Radiation Exposure Compensation Act claims.
Grantees use evidence-based practice strategies to accomplish their work, incorporating elements
including clinical expertise, current best evidence and patient perspectives. Performance has
remained consistent compared with previous years.
Outputs and Outcomes Tables
Measure
6050.01 Total number
of individuals screened
per year through the
Radiation Exposure
Screening and
Education Program
(Output)
6050.02 Percentage of
successful Radiation
Exposure
Compensation Act
claims filed by
Radiation Exposure
Screening and
Education Program
clinics. (Outcome)
Year and Most
Recent Result/
Target for
Recent Result/
(Summary of
Result)
FY 2022: 705
750
750
FY 2025
Target +/FY 2024
Target
Maintain
80%
80%
Maintain
FY 2024
Target
FY 2025
Target
Target: 300
(Target Met)
FY 2022: 92.5%
Target: Not
Defined
(Historical
Actual)
342
343.
Performance NarrativeDue to statutory requirements and demographic realities the population utilizing RESEP services
and the eligible population for RECA compensation are decreasing. These realities have a direct
impact on the results of RESEP performance measures.
Grant Awards Tables
FY 2023 Final
Number of Awards
FY 2025 President’s
Budget
FY 2024 CR
8
8
8
Average Award
$212,510
$212,510
$212,510
Range of Awards
$110,446 - $231,132
$110,446 - $231,132
$110,446 - $231,132
343
344.
Black LungFY 2024
Continuing
Resolution
FY 2023
Final
FY 2025
President’s
Budget
FY 2025
+/FY 2023
BA
$12,190,000
$12,190,000
$12,190,000
---
FTE
1
1
1
---
Authorizing Legislation: Federal Mine Safety and Health Act, Public Law 91-173, Section
427(a), as amended by Black Lung Benefits Reform Act of 1977, Section 9, Public Law 95-239.
FY 2025 Authorization…………………………………………………………………Indefinite
Allocation Method…………………….……………Competitive Grants/Cooperative Agreement
Program Description
Established in 1979, through authorization from the Federal Mine Safety and Health Act of 1977,
the Black Lung Clinics Program (BLCP) funds eligible public, private, and state entities that
provide medical, outreach, educational, and benefits counseling services to active, inactive,
retired, and disabled coal miners throughout the United States. Black Lung Clinics work to
reduce the morbidity and mortality associated with occupationally related coal-mine dust lung
disease. To support the longer-term need faced by miners with severe disability due to black lung
disease, grantees may also assist coal miners and their families in preparing the detailed
application for Federal Black Lung benefits from the Department of Labor (DOL). In the recent
years, grantees have been able to use funds to upgrade equipment, enhance their workforce
capacity and increase behavioral health screenings and care integration.
HRSA also funds the Black Lung Data and Resource Center (BLDRC) to support the operations
of BLCP awardees and strengthen their ability to examine and treat respiratory and pulmonary
impairments in active and inactive coal miners. BLDRC supports Black Lung Clinics through
improved patient-level data collection, analysis, and expansion the body of knowledge of
knowledge related to the health status and needs of coal miners nationally.
Budget Request
The FY 2025 Budget Request for the Black Lung program of $12.2 million is equal to the FY
2023 Final level. HRSA will continue to fund 15 Black Lung Clinic Program awards that provide
primary care and other services to coal miners and one cooperative agreement with the Black
Lung Data and Resource Center to enhance the quality of services provided by BLCP grantees
and work closely with HRSA to strengthen the quality of data collection and analysis.
Funding also includes costs associated with the grant review and award process, follow-up
performance reviews, and information technology and other program support costs.
344
345.
Funding HistoryFiscal Year
FY 2021
FY 2022
FY 2023
FY 2024 CR
FY 2025 President’s Budget
Amount
$11,565,000
$11,845,000
$12,190,000
$12,190,000
$12,190,000
Program Accomplishments
Deployment of vaccines and intensive clinical protocols have allowed Black Lung Clinics to
transition back to pre-pandemic levels of clinical operations for their complex respiratory and
pulmonary services. Accordingly, the patient-level data reporting system shows an increase in
number of miners served between FY 2021 and FY 2022.
As well as supporting internal data management for BLCP, the Black Lung Data and Resource
Center has utilized HRSA funding, and BLCP data, to begin improving the quantity, and quality,
of available data related to the health status of the miners they serve and ensure ease of reporting
into the patient-level data system.
Outputs and Outcomes Tables
Measure
6060.01 Number of
miners served each year
through the Black Lung
Clinics Program (Output)
6060.02 Number of
miners screened each year
through the Black Lung
Clinics Program (Output)
33.I.A.2 Number of
medical encounters from
Black Lung each year.
(Output)
Year and Most
Recent Result /
Target for Recent
Result /
(Summary of
Result)
FY 2022: 7,042
12,300
7,800
FY 2025
Target +/FY 2024
Target
Maintain
3,300
3,300
Maintain
Discontinued
Discontinued
N/A
FY 2024
Target
FY 2025
Target
Target: 12,000
(Target Not Met)
FY 2022: 4,759
Target:
Not Defined
(Historical Actual)
FY 2022: 6,012
Target: 19,000
(Target Not Met)
345
346.
Performance NarrativeWith the introduction of the BLCP’s Patient Level Data (PLD) reporting system came the
adoption of more strictly standardized definitions for what clinics may count as unique
encounters. Due to this change, we are now able to quantify the impact of the BLCP awardees
more confidently. Although previously established goals were not met, likely due to a
combination of lasting COVID-19 impacts as well adjustment of grantee data collection, overall
grantee data continues to present an upward trend in productivity. This upward trend aligns with
grantee reported observations of increased numbers of young miners presenting with Progressive
Massive Fibrosis (PMF), the more severe stage of Black Lung, as well as rekindled interest from
older miners who had been delaying seeking care until the COVID-19 pandemic arrived.
Grant Awards Tables
FY 2023 Final
Number of Awards
FY 2025
President’s Budget
FY 2024 CR
16
16
16
Average Award
$729,918
$729,918
$729,918
Range of Awards
$125,000 $2,120,763
$125,000 $2,120,763
$125,000 $2,120,763
346
347.
Rural Residency Planning and DevelopmentFY 2024
Continuing
Resolution
FY 2023
Final
FY 2025
President’s
Budget
FY 2025
+/FY 2023
BA
$12,500,000
$12,500,000
$12,500,000
---
FTE
2
2
2
---
Authorizing Legislation: Social Security Act, Section 711(b)(5), as amended by Medicare
Prescription Drug, Improvement, and Modernization Act of 2003, Section 432, Public Law
108- 173.
FY 2025 Authorization……………………………………………………….Indefinite
Allocation Method………………………Competitive Grants/Cooperative Agreement
Program Description
Established in FY 2018, the Rural Residency Planning and Development Program seeks to
expand the number of rural residency training programs, increase the number of physicians
training in rural settings, and subsequently increase the number of physicians choosing to
practice in rural areas. For the purpose of this program, rural residencies are Accreditation
Council for Graduate Medical Education (ACGME) accredited physician residency programs
that primarily train residents in rural training sites for greater than 50 percent of their total time
in residency and focus on producing physicians who will practice in rural communities. Rural
residencies include Rural Track Programs (RTPs) a specific model of rural residency training in
which residents gain both urban and rural experience with more than half of the training taking
place in rural areas. Eligible primary care and high need rural residency specialties include
family medicine, family medicine with enhanced obstetrical training, internal medicine,
preventive medicine, psychiatry, general surgery, and obstetrics and gynecology. RRPD funds
support the creation of the residency with grantees than qualifying for ongoing training support
through Medicare, Medicaid and other state or private support.
Research has shown that residents often practice near where they complete their residency
training. Spending more than half of training time in rural locations during family medicine
residency is associated with a 5- to 6-fold increase in subsequent rural practice157. Rural training
is more strongly associated with rural practice for physicians than having a rural background.158
The Federal Office of Rural Health Policy collaborates with HRSA’s Bureau of Health Workforce
(BHW) to fund two activities that create new rural residencies:
157
Russell, DJ, Wilkinson E, Petterson S, Chen C, Bazemore, A; Family Medicine Residencies: How Rural Training
Exposure in GME Is Associated With Subsequent Rural Practice. J Grad Med Educ. 1 August 2022; 14 (4): 441–
450. doi: https://doi.org/10.4300/JGME-D-21-01143.1
158
Patterson, DG, Shipman, SA, Pollack, SW, et al. Growing a rural family physician workforce: The contributions
of rural background and rural place of residency training. Health Serv Res. 2023; 1-7. doi:10.1111/1475-6773.14168
347
348.
The Rural Residency Planning and Development (RRPD) creates new physician
residency training programs that support physician workforce expansion in rural areas
and that are sustainable beyond the grant period of performance through public (i.e.,
Medicare or Medicaid), other state, or private funding. Recipients may use grant funds to
cover planning and development costs incurred while achieving program accreditation
through ACGME. Since FY 2019, the program has made new awards each fiscal year and
HRSA plans a new competition for FY 2025. The RRPD grants have a three-year period
of performance and are fully funded when issued to allow flexibility for the varied
schedules necessary to develop new residency programs.
The Rural Residency Planning and Development Technical Assistance (RRPD-TA) funds
one cooperative agreement that creates a technical assistance center to support RRPD
grant applicants and recipients. Eligible entities include domestic non-profit organizations
with the capability to be national in scope to reflect the distribution of current and future
RRPD cohorts. The most recent competition was in FY 2021 and the cooperative
agreement has a five-year period of performance. HRSA plans a new competition for FY
2025.
Budget Request
The FY 2025 Budget Request for the Rural Residency Planning and Development program of
$12.5 million is equal to the FY 2023 Final level. This request will enable HRSA to make 10
new 3-year awards of $750,000 each under RRPD and one competitive award of $5 million for
technical assistance under RRPD-TA. In FY 2025 HRSA will be awarding fewer RRPD grants
than in FY 2024 due to the competition of the RRPD-TA program in FY 2025. The new RRPD
and RRPD-TA awards will develop new rural residency programs to train physicians in rural
areas and provide technical assistance to applicants and award recipients. In FY 2023, HRSA
piloted a new pathway with priority points to increase the number of programs offering family
medicine with enhanced obstetrical training and successfully funded three award recipients
focused on this specialty. The previous RRPD competitions generated significant interest from
rural stakeholders and HRSA received more competitive applications than they were able to
fund; HRSA anticipates similar interest in the FY 2025 competition.
Funding also includes costs associated with the grant review and award process, follow-up
performance reviews, and information technology and other program support costs.
Five Year Funding History
Fiscal Year
FY 2021
FY 2022
FY 2023
FY 2024 CR
FY 2025 President’s Budget
Amount
$10,468,000
$10,500,000
$12,500,000
$12,500,000
$12,500,000
348
349.
Program AccomplishmentsIn FY 2023, a total of 20 grant recipients from RRPD Cohort 1 (FY 2019) and Cohort 2 (FY
2020) finished their period of performance and 95% of them successfully achieved ACGME
accreditation of new rural residency programs. In addition, twelve active grant recipients
achieved ACGME accreditation ahead of schedule and they are strengthening their new
residency programs as they complete their period of performance. As of December 1, 2023,
across all RRPD cohorts, 39 award recipients have achieved ACGME accreditation, for a total of
521 new approved residency positions at full complement in the following specialties:
31 New Family Medicine Residency Programs and 402 Residency Positions
6 New Psychiatry Medicine Residency Programs and 68 Residency Positions
1 New Internal Medicine Residency Program and 36 Residency Positions
1 New General Surgery Residency Program and 15 Residency Positions
Outputs and Outcomes Tables
Measure
6080.01 Percentage
of Rural Residency
Planning and
Development
grantees who
achieve
Accreditation
Council for
Graduate Medical
Education
accreditation by the
end of the period of
performance
(Outcome)
Year and Most
Recent Result/
Target for Recent
Result/
(Summary of
FY 2024
Result)
Target
FY 2023: 95%
90%
FY 2025
Target
90%
FY 2025 Target
+/FY 2024 Target
Maintain
Target: Not
Defined
(Historical Actual)
Performance Narrative
For Measure 6080.01, one grant recipient that completed its period of performance in FY 2023
was unable to apply for accreditation due to financial sustainability barriers to training residents
at an Indian Health Service clinical site. HRSA is applying lessons learned from this effort to
inform future program development in non-traditional training sites. HRSA is maintaining the
FY 2025 target at 90% for Measure 6080.01 to account for the potential external barriers and
limited residency training experience of anticipated future award recipients.
349
350.
Grant Awards TablesFY 2023 Final
Number of Awards
FY 2025 President’s
Budget
FY 2024 CR
15
15
11
Average Award
$727,633
$750,000
$1,136,363
Range of Awards
$416,937 - $750,000
$750,000 - $750,000
$750,000 - $5,000,000
350
351.
Rural Communities Opioid ResponseFY 2024
Continuing
Resolution
FY 2023
Final
FY 2025
President’s Budget
FY 2025
+/FY 2023
BA
$145,000,000
$145,000,000
$145,000,000
---
FTE
24
27
27
+3
Authorizing Legislation: Social Security Act, Section 711, as amended by Medicare Prescription
Drug, Improvement, and Modernization Act of 2003, Section 432, Public Law 108-173.
FY 2025 Authorization…………………………………………………………...Indefinite
Allocation Method…………………………...Competitive Grants/Cooperative Agreement
Program Description
The Rural Communities Opioid Response Program (RCORP) seeks to reduce the factors
that result in increased morbidity and mortality associated with substance use disorder
(SUD), including opioid use disorder (OUD), in high need rural communities by
establishing, expanding, and sustaining prevention, treatment, and recovery services at the
county, state, and/or regional levels. More than 1,900 counties across 47 states and two
territories have taken part in the RCORP initiative.
HRSA supports the following grant and cooperative agreement programs through RCORP:
The RCORP-Impact program provides funding to rural communities to improve
access to integrated and coordinated treatment and recovery services for SUD and
OUD with the aim to reduce morbidity and mortality and promote long-term,
sustained recovery. HRSA will support the continuation of approximately 9 awards
in FY 2025.
The RCORP-Overdose Response program provides funding to rural communities to
meet their immediate needs related to the overdose crisis, including the distribution
of naloxone. HRSA will support approximately 20 new awards in FY 2025.
The RCORP-Stimulant Support program provides funding to rural communities to
reduce the prevalence and impact of stimulant use disorder through providing
coordinated and comprehensive prevention, treatment, recovery, and harm
reduction services for impacted individuals and families. HRSA will support
approximately 20 new awards in FY 2025.
The RCORP-Medication Assisted Treatment (MAT) Access program provides
funding to establish new sustainable MAT access points in for SUD/OUD rural
communities that do not currently have access to these treatments. HRSA will
351
352.
support the continuation of 26 awards in FY 2025.The RCORP-Neonatal Abstinence Syndrome program provides funding to rural
communities to reduce the incidence and impact of neonatal abstinence syndrome in
rural communities by improving systems of care, family supports, and social
determinants of health. HRSA will support the continuation of 41 awards in FY
2025.
The RCORP-Child and Adolescent Behavioral Health program provides funding to
rural communities to establish and expand behavioral health care services, including
mental and substance use disorder, across the prevention, treatment, and recovery
continuum for rural children and adolescents aged 5-17 years. HRSA will support
the continuation of 9 awards in FY 2025.
The RCORP-Behavioral Health Care Support program provides funding to rural
communities to improve access to and quality of mental health and SUD and other
in rural communities. The program focuses on building the infrastructural capacity
of rural communities to deliver behavioral health, including SUD/OUD, services
across the continuum; enhancing care coordination to provide effective care; and
addressing social determinants of health to promote health equity. HRSA will
support the continuation of 58 awards in FY 2025.
The RCORP-Rural Centers of Excellence on Substance Use Disorders provides
funding to support the dissemination of best practices related to the treatment for,
and prevention of substance use disorders within rural communities, with a focus on
the current opioid crisis. HRSA will support the continuation of these 3 cooperative
agreements in FY 2025.
The Rural Behavioral Health Workforce Centers provide funding to support the
development and implementation of training and mentorship programs that build
the capacity of rural health care providers, paraprofessionals, non-clinical staff, and
community members to care for individuals with behavioral health, including
SUD/OUD, needs in rural locations within the Northern Border Regional
Commission service area. HRSA will support approximately 4 new cooperative
agreements in FY 2025.
The RCORP-Technical Assistance and Evaluation provides funding to support
technical assistance and evaluation efforts encompassing the entire RCORP
initiative. HRSA will support the continuation of funding for one technical
assistance and one evaluation cooperative agreement in FY 2025.
Budget Request
The FY 2025 Budget Request for the Rural Communities Opioid Response program of $145
million is equal to the FY 2023 Final level. This request will support the development and
352
353.
continuation of community-based grant programs and technical assistance that provide neededbehavioral health, including SUD/OUD, services directly to rural residents. Drug overdose death
rates in rural areas rose from 19.6159 in 2019 to 26.2160 per 100,000 standard population in
2020. The rate of deaths involving psychostimulants with abuse potential was 31% higher in
rural counties (9.4) than in urban counties (7.2), and the rate of deaths involving natural and
semisynthetic opioids was nearly 13% higher in rural counties (4.5) than in urban counties
(4.0).161 Further, over 60 percent of mental health professional shortage designations are located
in rural areas.4 Through progress reports, listening sessions, and town halls, RCORP award
recipients and other rural stakeholders have described continued workforce shortages,
reimbursement issues, continually evolving and emerging threats related to SUD/OUD (e.g.
fentanyl and xylazine), and the need for additional resources to address substances beyond
opioids and co-occurring mental health disorders.
This request will enable HRSA to continue supporting RCORP programs that address emergent
behavioral health needs in rural communities, health equity, and needed prevention, treatment,
and recovery services to rural residents, including for children and adolescents, and pregnant and
postpartum people. In FY 2023, HRSA piloted the Overdose Response program that provided
funds to rural communities to rapidly address their immediate SUD/OUD needs (including the
purchase and distribution of lifesaving naloxone) and addressed health equity.
In FY 2025, HRSA plans to continue funding activities that provide technical assistance,
evaluation, and rural behavioral health care workforce development support. Additionally, due to
the high-level of need identified in FYs 2023 and 2024, HRSA will support approximately 20
new RCORP-Overdose Response awards to continue to allow rural communities to address their
immediate and evolving needs around SUD/OUD. To address the high rate of overdose death
from stimulants in rural communities (including psychostimulants), HRSA will also support
approximately 20 new RCORP-Stimulant Support awards. HRSA will continue to solicit
feedback from rural stakeholders and engage and partner with other Federal agencies to promote
a coordinated approach to combatting this devastating epidemic and ensure HRSA’s efforts are
aligned with Administration priorities. This request will enable HRSA to strengthen RCORP’s
commitment to reducing disparities in health outcomes and access among underserved
populations.
Funding also includes costs associated with the grant review and award process, follow-up
performance reviews, and information technology and other program support costs.
159 https://www.cdc.gov/nchs/products/databriefs/db403.htm#:~:text=Data%20from%20the%20National%20Vital,to
%2019.6%20in%20rural%20counties.
160 https://www.cdc.gov/nchs/products/databriefs/db440.htm#:~:text=Overall%2C%20the%20rate%20of%20drug,in
%20rural%20counties%20(26.2).
161 https://www.cdc.gov/nchs/products/databriefs/db440.htm
353
354.
Five Year Funding HistoryFiscal Year
Amount
$109,670,000
$135,000,000
$145,000,000
$145,000,000
$145,000,000
FY 2021
FY 2022
FY 2023
FY 2024 CR
FY 2025 President’s Budget
Program Accomplishments
In FY 2021, RCORP award recipients provided direct prevention, treatment, and recovery
services to 2,133,874 rural individuals across the country, including medication-assisted
treatment services to 112,373 rural individuals.162 Between September 1, 2022 and February 28,
2023, approximately 39 percent of RCORP award recipients reported using RCORP funding to
establish or expand access to prevention services in their communities; approximately 37 percent
established or expanded harm reduction services; and approximately 43 percent established or
expanded recovery support services.163 To increase the likelihood of sustaining these services and
enhance community buy-in, RCORP award recipients have collectively engaged with more than
3,400 state and local agencies and organizations representing a diverse array of sectors, including
school systems, health centers, hospitals, law enforcement agencies, community-based
organizations, and others to implement their programs. Finally, RCORP expanded the number of
rural counties served by the initiative from around 1,800 in FY 2022 to over 1,900 in FY 2023.
Outputs and Outcomes Tables
Year and Most
Recent Result /
Target for Recent
Result /
Measure
6090.01 Number of
individuals screened for
Substance Use Disorder
(Output)
(Summary of
FY 2024
Result)
Target
FY 2022: 2,021,501 1,400,000
FY 2025
Target
910,000
FY 2025
Target +/FY 2024
Target
-490,000
Target: Not
Defined
(Historical Actual)
162
Self-reported performance data submitted to HRSA by RCORP award recipients, covering the September 1,
2021-August 31, 2022 time period.
163
Subset of award recipients that self-reported performance data submitted to HRSA covering the September 1,
2022-February 28, 2023 time period.
354
355.
Year and MostRecent Result /
Target for Recent
Result /
Measure
6090.02 Percentage of
Rural Communities
Opioid Response
Program (RCORP)
grantees with other
sources of funding for
sustainability (aside
from RCORP grant)
(Output)
6090.03 Number of
providers who have
provided MedicationAssisted Treatment
(Output)
(Summary of
Result)
FY 2022: 95%
FY 2024
Target
80%
FY 2025
Target
80%
FY 2025
Target +/FY 2024
Target
Maintain
2,150
1,615
-535
Target: Not
Defined
(Historical Actual)
FY 2022: 5,587
Target: 2,000
(Historical Actual)
Performance Narrative
For Measure 6090.01, we anticipate a decrease in the FY 2025 targets due to a reduction in the
number of active grantees funded by multi-year appropriations versus annual appropriations.
For Measure 6090.03, we anticipate a decrease in the FY 2025 targets due to a reduction in the
number of active grant programs that will be more explicitly focused on MAT provision.
Grant Awards Tables
FY 2023 Final
Number of Awards
FY 2024 CR
FY 2025
President’s Budget
201
182
192
Average Award
$673,026
$737,573
$700,456
Range of Awards
$300,000 $10,000,000
$300,000 $10,000,000
$300,000 $10,000,000
355
356.
HRSA-WIDEACTIVITIES
TAB
356
357.
HRSA-WIDE ACTIVITIES AND PROGRAM SUPPORTProgram Management
FY 2023
FY 2024
FY 2025
Final
Continuing
Resolution
President's
Budget
FY 2025 +/- FY
2023
BA
$163,800,000
$163,800,000
$163,800,000
---
FTE
826
826
836
+10
Authorizing Legislation: Public Health Service Act, Section 301 amended by 21st Century Cures
Act, Sections 2012, 2013, 2035, and 2043, Public Law 114-255.
FY 2025 Authorization……………………………………………………………...…Indefinite
Allocation Method…………………………………………………………………………..Other
Program Description
To achieve its mission, HRSA requires qualified staff to operate at maximum efficiency. One of
HRSA’s goals is to strengthen program management and operations by improving program
customer satisfaction, increasing employee engagement, and implementing organizational
improvements and innovative projects. Program Management is the primary means of support
for staff, business operations and processes, information technology and overhead expenses such
as rent, utilities, and miscellaneous charges for HRSA.
Numerous efforts are underway to enhance efficiency and effectiveness of the agency and to
ensure the workforce is positioned to succeed in the 21st century. HRSA relies on HHSprovided shared services for many of the services, such as human resources, financial
management, grants, and procurement. HRSA actively seeks out and deploys shared services to
improve and simplify processes, and to maximize the efficiency of shared services with other
components of HHS.
Program Management also supports Enterprise Risk Management (ERM) activities that align
with core principles and performance and strategic planning activities to reduce programmatic
risk and improve performance. HRSA has established a HRSA-wide governance structure for
enterprise-wide business operations and risk management activities to ensure a proactive and
customer-focused suite of business operation services and risk management functions. HRSA’s
ERM efforts include Governance and Process support for the promotion of a risk-aware
organizational culture, the creation of a comprehensive view of risks to drive strategic decision
making and the establishment and communication of risk appetite.
357
358.
Budget RequestThe FY 2025 Budget Request for Program Management of $163.8 million is equal to the FY
2023 Final level. This funding level supports program management activities to effectively and
efficiently support HRSA’s operations.
HRSA is committed to improving quality at a lower cost and improving the effectiveness and
efficiency of government operations. HRSA supports telework by increasing the agency-wide
utilization of web collaboration tools, which have led to greater business productivity.
HRSA also continues to enhance its program integrity activities by supporting analytical tools
using HRSA’s electronic grants system, program data, Office of Federal Assistance Management
data sources, HHS sources, and government-wide sources. The goal is for HRSA to identify
potential issues in the pre- and post-award processes and to address issues before they become
audit findings. HRSA plans to focus on a risk-based approach to grantee monitoring using the
information and corresponding analysis to help staff spend their time on grantees at risk of
noncompliance. HRSA will also continue to provide training for grants management and
program staff to support the alignment of program integrity initiatives with planning and
performance activities. These efforts will enhance HRSA grantees awareness and ability to
avoid potential financial integrity issues.
IT Investments
Significant progress has been made in a range of IT investments. In FY 2022, HRSA
successfully transitioned the majority of the workforce from remote work to hybrid work
schedules, while adapting to changing environments and workplace requirements. HRSA
continuously works to enhance employees IT end-user support by enhancing collaboration
platforms, including implementing a SharePoint hoteling space system. HRSA continues to
utilize Microsoft Teams to provide a feature rich collaboration platform that provides
audio/video calling and conferencing, chat, and file sharing all in a secure environment. HRSA
piloted several hybrid virtual meeting technology improvements to enhance the collaborative
space, including Zoom Rooms.
In FY 2022, HRSA deployed a pilot Snowflake data cloud to enable secure data sharing and
support high volume data processing and enhance multiple other reporting and case management
systems to maximize efficiencies. These systems maximized program efficiency and increased
program integrity by creating interactive dashboards for call centers and executive reporting. The
systems also improved application portal capabilities and audit reporting.
HRSA is also prioritizing the implementation of Zero Trust Strategy in support of the
Administration’s goals regarding Zero Trust Cybersecurity Principles164.HRSA continues to
improve HRSA IT security incident prevention, detection and response capabilities by improving
penetration testing capabilities and deploying Crowdstrike on all IT assets.
164
https://www.whitehouse.gov/wp-content/uploads/2022/01/M-22-09.pdf
358
359.
Funding History:Fiscal Year
Amount
FY 2021
$155,300,000
FY 2022
$155,300,000
FY 2023
$163,800,000
FY 2024 CR
$163,800,000
FY 2025 President’s Budget
$163,800,000
Program Accomplishments:
Improving Processes and Business Operations
HRSA continued to improve operational processes to maximize efficiencies. During FY 2023, in
support of HRSA’s Return to the Workplace Initiative, a comprehensive evaluation of HRSA
Headquarters physical space utilization was conducted; a new the hoteling space reservation
system was launched that improved the capacity to make data-informed decisions as building
occupancy continued to increase, this included having expanded the number of hoteling spaces
from 260 to 486, an increase of 187 percent, over four times the goal of 40 percent.
Additionally, identified areas for consolidation, enabling HRSA to return 150 workspaces to
HHS for reallocation, thereby reducing HRSA’s HQ footprint by 10 percent. HRSA also
designed, developed, and implemented a web-based system for processing and recording
Workplace Flexibilities Agreements. The new cost-effective system reduces the manual burden
of uploading forms, centralizes recordkeeping across HRSA, and improves reporting capabilities.
HRSA also increased efficiencies and improved customer service by conducting an acquisitions
workforce assessment and implementing key changes. After identifying that the workload
responsibility for HRSA contract specialists exceeded that of the other agencies by three times,
redeployed resources to hire 20 new employees, increasing the contract workforce capacity by 34
percent and improving processing time for planned HRSA procurements by 21 percent.
To better inform recruitment strategies and help evaluate recruitment performance HRSA
developed a recruitment optimization model, using historic qualitative and quantitative data such
as audience type, announcement duration, and number of applicants, referred applicants, and
selections. This tool streamlines the data pulling from USA Staffing, resulting in a consolidated
visualization of HRSA recruitment data.
Enhancing an Engaged Workforce
The hiring process continues to be streamlined, reducing the time it takes to complete the hiring
cycle from recruitment to onboarding, which has resulted in enhanced program oversight and
integrity, and increased effectiveness and efficiency of the recruitment process. These
359
360.
improvements supported the efficient hiring of 385 new HRSA staff in FY 2023, along withproviding recruitment and hiring services to AHRQ resulting in hiring 33 employees for them.
HRSA is also focused on intense employee engagement improvement efforts. During FY 2023,
HRSA continued to build upon successful Employee Viewpoint Survey program management.
HRSA had the 4th highest EVS response rate in HHS at 82.2 percent, exceeding both HRSA’s
goal and previous year’s response rate. HRSA also implemented a HRSA Engagement Network,
a group of HRSA employees who come together to share resources and develop engagement
tools to be shared across that agency.
Outputs and Outcomes Table
Measure
35.VII.B.1. Ensure Critical
Infrastructure Protection: Security
Awareness Training (Output)
Year and Most
Recent Result /
Target for Recent
Result /
(Summary of
Result)
FY 2023: 100%
FY 2024
Target
FY 2025
Target
FY 2025
Target
+/FY 2024
Target
Discontinued Discontinued N/A
Target: 100%
(Target Met)
7010.01 Ensure Critical
Infrastructure Protection: Security
Authorization to Operate:
Percentage of HRSA information
systems assessed and Authorized
to Operate (ATO) (Output)
FY 2023: 100%
35.VII.B.2b Ensure Critical
Infrastructure Protection: Security
Cyber Sprint (Output)
FY 2023: < 30
days
Discontinued Discontinued N/A
Target: 100%
(Target Met)
Target: 30 days
(Target Met)
360
Discontinued Discontinued N/A
361.
Measure35.VII.B.2c Ensure Critical
Infrastructure Protection: Security
Privacy Impact Assessment (PIA)
or Privacy Threshold Assessment
(PTA) (Output)
Year and Most
Recent Result /
Target for Recent
Result /
(Summary of
Result)
FY 2023: 100%
FY 2024
Target
FY 2025
Target
FY 2025
Target
+/FY 2024
Target
Discontinued Discontinued N/A
Target: Identify
95% of systems
that require a PIA
or a Privacy
Threshold
Assessment (PTA)
(Target Met)
7010.02 Ensure Critical
Infrastructure Protection: Security
Phishing: Number of phishing
campaigns completed (Output)
FY 2023: 21
Discontinued Discontinued N/A
Target: 24
(Target Not Met)
7010.03 Enterprise Architecture:
Percentage of IT systems reported
to OMB with mapping to at least
one HHS segment and domain
(Output)
FY 2023: 92.5%
7010.04 Ensure Critical
Infrastructure Protection: Average
annual overall score for HRSA IT
Systems on the HRSA-wide
Capital Planning and Investment
Control (CPIC) Scorecard.
FY 2023: 97%
90%
90%
Maintain
90%
90%
Maintain
Target: 90%
(Target Met)
Target: 90
(Target Met)
361
362.
Office of Pharmacy Affairs/340B Drug Pricing ProgramBA
FTE
FY 2023
Final
$12,238,000
21
FY 2024
Continuing
FY 2025
Resolution
President’s Budget
$12,238,000
$12,238,000
21
21
FY 2025
+/FY 2023
-----
Authorizing Legislation: Public Health Service Act, Section 340B, as amended by Public Law
111-309, Section 204
FY 2025 Authorization……………………………………………………………………………………………………SSAN
Allocation Method ………………………………………………………………………………………………………Contract
Program Description
The 340B Program requires drug manufacturers to provide discounts on covered outpatient drugs
to certain categories of safety net health care providers specified in statute, known as covered
entities. These categories include Federally Qualified Health Centers, Federally qualified health
center look-alikes, family planning grantees, Ryan White grantees, Black Lung clinics,
hemophilia treatment centers, native Hawaiian health centers, Urban Indian organizations, Tribal
Compacts, Sexually Transmitted Disease and Tuberculosis grantees, children’s hospitals, critical
access hospitals, free standing cancer hospitals, rural referral centers, sole community hospitals
and disproportionate share hospitals. HRSA is responsible for administering the 340B program
and providing oversight, including conducting audits of covered entities and manufacturers. The
ability to access discounted prices for outpatient medications supports HRSA’s ability to provide
equitable healthcare to the nation’s highest need communities and enhances their ability to
stretch Federal resources, reach more eligible patients, and provide more comprehensive
services. As of October 1, 2023, 14,060 covered entities and over 800 manufacturers participate
in the 340B Program.
The 340B ceiling price – the maximum amount a drug manufacturer can charge a covered entity
for a given drug – is equal to the Average Manufacturer Price (AMP) minus the Unit Rebate
Amount, both set by the Centers for Medicare & Medicaid Services (CMS). By law, ceiling
prices are confidential and can only be shared with eligible covered entities and
manufacturers. HRSA’s Office of Pharmacy Affairs (OPA) Information System (OPAIS)
provides covered entities access to 340B ceiling price information via a secure website, including
quarterly updates reflective of manufacturers submissions.
The 340B statute also includes the establishment of a Prime Vendor Program (PVP) to develop,
maintain, and coordinate a program capable of facilitating distribution of covered outpatient
drugs.
362
363.
Budget RequestThe FY 2025 Budget Request for the 340B Program of $12.2 million is equal to the FY 2023
Final level. This request supports implementation of 340B Program statutory obligations,
oversight of participating manufacturers and covered entities, operational improvements,
increased efficiencies using information technology, and management strategic responses to
extensive litigation. The FY 2025 Budget Request provides resources for the 340B Program to
continue and expand program integrity and compliance activities, including audits of
manufacturers and covered entities, to prevent and address specific instances of noncompliance,
produce a sentinel effect that bolsters program integrity overall, and develop technical assistance
and other tools and mechanisms to reduce the risk of future compliance issues.
The request supports enhancements to the element of the 340B OPAIS where covered entities
access 340B ceiling price information via a secure website to provide transparency of data to
authorized users. System improvements are continuously made to enhance compliance, improve
the user interface for manufacturers and covered entities, and support program needs and system
reliability. In FY 2023, HRSA began implementing the Administrative Dispute Resolution
(ADR) process by establishing policies and procedures for submission and resolution of
claims. In addition, HRSA began work on an internal only system for handling claims in that
same year. Furthermore, HRSA published a 340B ADR Notice of Proposed Rule Making
(NPRM) in November 2022 that proposed to revise the current process to ensure it is more
efficient, accessible, administratively feasible, and timely for all parties. The final rule is
expected to publish early 2024.
The FY 2025 Budget Request proposes to enhance 340B Program integrity by requiring covered
entities to annually report to HRSA how the savings achieved through the Program benefits the
communities they serve and provide HRSA regulatory authority to implement this requirement.
HRSA also proposes explicit regulatory authority to define necessary terms and is proposing to
strengthen compliance and transparency related to the utilization of contract pharmacies.
The FY 2025 Budget Request for budget authority includes program support costs associated
with contract award processes, follow-up reviews, information technology and program support.
Five Year Funding History
Fiscal Year
FY 2021
FY 2022
FY 2023
FY 2024 CR
FY 2025 President’s Budget
Amount
$10,238,000
$11,238,000
$12,238,000
$12,238,000
$12,238,000
363
364.
Program AccomplishmentsHRSA places a high priority on the integrity of the 340B Program and continually works to
improve Program oversight. HRSA conducts the following activities to ensure both covered
entities and manufacturers are in compliance with program requirements:
Provides extensive technical assistance to HRSA grantees and other covered entities that
supports safety-net provider participation in the program and education/training to
support program integrity.
Performs initial eligibility checks of all entities seeking to register with the Program.
Recertifies covered entities annually.
Performs audits of covered entities to assure compliance within the Program. Since FY
2021, HRSA completed 2,085 covered entity audits, which included review of 27,131
offsite outpatient facilities and 51,700 contract pharmacies. Final audit results, including
statuses of corrective actions, are available on HRSA’s website.
Reviews every non-compliance allegation received through targeted communication and,
if necessary, performs an audit. Performs audits of manufacturers. Since FY 2015,
HRSA finalized 41 audits of manufacturers.
Supports an integrated IT system of tracking correspondence and compliance concerns
related to covered entities and manufacturers, that enhances HRSA’s ability to use data
and trends of information to target program integrity efforts.
Publishes verified ceiling prices of 44,000 covered outpatient drugs available for
purchase under the 340B Program by over 800 manufacturers on a quarterly basis in the
340B Office of Pharmacy Affairs Information System (OPAIS).
Outputs and Outcomes Tables
Year and Most
Recent Result/
Target for Recent
Result
Measure
5040.01: Number of
covered entity audits
conducted (Output)
5040.02: Number of
manufactures audits
conducted (Output)
(Summary of
Results)
FY 2023: 200
Target: 225
(Target Not Met)
FY 2023: 5
Target: 10
(Target Not Met)
FY 2025
Target
+/FY 2024
FY 2025
FY 2024
Target
Target
Target
200
200
Maintain
5
364
5
Maintain
365.
Contracts Awards TableFY 2023
Final
Number of
Contracts
Average Contract
Range of
Contracts
FY 2024
CR
3
FY 2025
President’s Budget
3
3
$3,000,000
$3,000,000
$3,000,000
$1,000,000$4,000,000
$2,000,000$5,000,000
$2,5000,000 $5,000,000
Performance Narrative
The FY 2023 Targets were based on a higher funding level.
365
366.
Office for the Advancement of TelehealthFY 2023
Final
BA
FTE
$38,050,000
7
FY 2024
Continuing
Resolution
$38,050,000
8
FY 2025
President’s
Budget
$38,050,000
8
FY 2025
+/FY 2023
--+1
Authorizing Legislation: Public Health Service Act, Section 330I, Section 330L, and Section
330N, as amended by CARES Act, Section 3212
FY 2025 Authorization (Section 330I and 330L)………………………………..$ 38,050,000
Allocation Method ...................................Competitive Grants/Cooperative Agreements/Contracts
Program Description
The Office for the Advancement of Telehealth (OAT) promotes the use of telehealth
technologies for health care delivery, education, and health information services. OAT
administers the following programs and activities:
Telehealth Network Grant Program supports the use of telehealth networks to improve
health care services for medically underserved populations in urban, rural, and frontier
communities. More specifically, the networks: (a) expand access to, coordinate, and
improve the quality of health care services; (b) improve and expand the training of health
care providers; and/or (c) expand and improve the quality of health information available
to health care providers, patients, and their families. This program funds different cohorts
of grantees, usually with unique clinical or population focus areas, although grantees can
also provide other clinical services in their projects. In addition, the program conducts
project evaluations to establish an evidence-base assessing the effectiveness of telehealth
care for patients, providers, and payers.
o Behavioral Health Integration (BHI) Evidence Based Telehealth Network
Program (EB-TNP) increases access to integrated behavioral health services in
primary care settings in rural and underserved communities by using telehealth
technology through telehealth networks. The period of performance for this
program starts September 1, 2024. HRSA will support 25 continuation awards in
FY 2025.
o Evidence-Based Direct-to-Consumer Telehealth Network Program (TNP)
increases access to healthcare services utilizing Direct-to-Consumer technologies.
The Evidence-Based TNP for Direct-to-Consumer care enhances the existing
health care infrastructure and increases access to care for underserved populations
366
367.
utilizing synchronous video visits and remote patient monitoring for primaryfocus areas such as behavioral health, primary care, and acute care. The current
period of performance for this program began September 1, 2021. HRSA will
support 11 continuation awards in FY 2025.
Telehealth Resource Center (TRC) Program provides expert and customizable
telehealth technical assistance across the country. The TRCs provide training and
support, disseminate information and research findings, promote effective collaboration,
and foster the use of telehealth technologies to provide health care information and
education for providers who serve rural and medically underserved areas and populations.
The current period of performance for this program began September 1, 2021. HRSA
will support 12 regional and 2 national TRC new awards in FY 2025.
Telehealth Center of Excellence program examines the efficacy of telehealth services in
rural and urban areas and serves as a national clearinghouse for telehealth research and
resources. The current period of performance for this program began September 30,
2021. HRSA will support 2 continuation awards in FY 2025.
Telehealth Research Centers conduct policy-relevant, clinically informed telehealth
research to expand the evidence base and comprehensive evaluation of nationwide
telehealth investments in rural areas and populations. As part of the research and
evaluation, the Telehealth Research Centers will also work with the Evidence-Based TNP
awardees to analyze their results and prepare summaries and publications of EvidenceBased TNP’s clinical impact. The Telehealth Research centers will assist rural health
providers and decision-makers at the federal, state, and local levels by examining the
impact of telehealth services in rural communities. The current period of performance for
this program began September 1, 2020. HRSA will support 2 new awards in FY 2025.
Licensure Portability Grant Program provides support to state professional licensing
boards to carry out programs under which the boards cooperate to develop and implement
state policies that will reduce statutory and regulatory barriers to telemedicine. The
period of performance for this program starts July 1, 2024. HRSA will support 4
continuation awards in FY 2025.
Telehealth Technology-Enabled Learning Program supports the connection of
specialists at academic medical centers with primary care providers in rural, frontier, and
underserved populations, providing evidence-based training and support to help them
treat patients with complex conditions in their communities. The current period of
performance for this program began September 30, 2021. HRSA will support 9
continuation awards in FY 2025.
HHS Telehealth Hub continues support for the HHS telehealth coordination of
resources to patients, providers, and states through the following components:
o Telehealth.HHS.gov will allow for the continuation of this HHS Telehealth Hub.
It is a one-stop resource for patients, providers, and states for information about
367
368.
telehealth such as telehealth best practices, policy and reimbursement updates,funding opportunities, and events.
o Telehealth.HHS.gov Promotional Campaign will allow for the continued
dissemination of critical telehealth resources for patients, providers, and states
through Telehealth.HHS.gov.
Budget Request
The FY 2025 Budget Request for the Office for the Advancement of Telehealth is $38.05
million, equal to the FY 2023 Final level. HRSA will continue to utilize telehealth to provide
access to healthcare in rural and underserved areas. In FY 2025, HRSA will support the
continuation of 51 existing grantees, and 16 new competitive grants through the Telehealth
Resource Center and Telehealth Research Center Programs, which will be re-competed in FY
2025. These programs strengthen the networks and the technical assistance providers that
support effective implementation of telehealth services. The funding also includes costs
associated with the grant review and award process, follow-up performance reviews, and
information technology and other program support costs.
Five Year Funding History
Fiscal Year
FY 2021
FY 2022
FY 2023
FY 2024 Continuing Resolution
FY 2025 President’s Budget
Amount
$34,000,000
$35,050,000
$38,050,000
$38,050,000
$38,050,000
Program Accomplishments
The Office for the Advancement of Telehealth had several accomplishments through its program
activities and collaborative efforts.
The EB-TNP for Direct-to-Consumer increases access to care for underserved
populations utilizing Direct-to-Consumer technologies such as synchronous video visits
and remote patient monitoring services. In the most recent reporting cycle, this program
has served approximately 11,000 patients.
The TRCs have provided over 7,400 technical assistance requests in FY 2023 to assist
providers with implementing telehealth and understanding evolving telehealth policy. In
addition, the National Telehealth Technology Assessment Resource Center, continues to
implement HRSA’s Telehealth Broadband Pilot Program, which now has over 650
broadband measurement devices within the four target states – Alaska, Michigan, Texas,
and West Virginia—that have resulted in over 2.2 million bandwidth tests.
368
369.
The Telehealth Centers of Excellence have contributed to the evidence-base for telehealth
with over 36 published articles to date on topics such as telehealth costs and utilization
and remote patient monitoring.
Since its inception, the Telehealth Technology-Enabled Learning Program has had over
4,600 providers participating in ECHO or ECHO-like learning sessions that have focused
on topics such as behavioral health, Long COVID, chronic disease management, and
pediatric care.
Through the Licensure Portability Grant Program, grantees developed tools such as the
Provider Bridge to provide key information for health care professionals across various
disciplines, with over 227,000 providers registered to use the platform.
The HHS Telehealth Hub, through the Telehealth.hhs.gov and Telehealth.hhs.gov
promotional campaign, had over 5.9 million views since its launch. The website provides
telehealth resources and information in English and Spanish.
Supported by Telehealth.hhs.gov, OAT hosted its second virtual National Telehealth
Conference in 2023, with over 3,000 registered participants and covering a wide range of
topics such as tele-behavioral health, broadband, workforce and health policy.
OAT has also led efforts to coordinate telehealth activities across HRSA and HHS by
leading the annual telehealth inventory for HRSA activities, an HHS data call for
telehealth research, and keeping the federal workforce informed on the latest telehealth
issues by convening a Federal Telehealth Workgroup (FedTel).
Outputs and Outcomes Table
Measure
6070.01 Increase the number of
communities that have access to
tele-behavioral health services
where access did not exist in the
community prior to Telehealth
Network Grant Program
(Outcome)
Year and Most
Recent Result /
Target for
Recent Result
(Summary of
Result)
FY 2022: 56
Target:
Not Defined
(Historical
Actual)
369
FY 2024
Target
40
FY 2025
Target
65
FY 2025
Target
+/- FY
2024
Target
+25
370.
Measure6070.02 Increase the number of
telehealth encounters provided
through the Telehealth Network
Grant Program (Output)
6070.03 Increase the number of
unduplicated patients receiving
care via telehealth through the
Telehealth Network Program
Grant (Output)
6070.04 Increase the number of
clients receiving technical
assistance from the Telehealth
Resource Centers Program
(Output)
Year and Most
Recent Result /
Target for
Recent Result
(Summary of
Result)
FY 2022:
27,821
FY 2024
Target
22,100
FY 2025
Target
28,500
FY 2025
Target
+/- FY
2024
Target
+6,400
9,400
14,000
+4,600
6,500
7,000
+500
Target:
Not Defined
(Historical
Actual)
FY 2022:
13,011
Target:
Not Defined
(Historical
Actual)
FY 2022: 7,499
Target:
Not Defined
(Historical
Actual)
Performance Narrative
The Telehealth Network Grant Program (TNGP) measures (6070.01, 6070.02, 6070.03) reflect
programs with different focus areas and cohorts. As such, measure results will vary from yearto-year due to expected turnover in grantee cohorts and focus areas, and targets will need to be
evaluated on an ongoing basis. In addition, the data represents results from FY 2022 funding and
was collected between September 2022 through August 2023, aligning with the program funding
period. The targets for FY 2025 have been established based on the cohorts for the Telehealth
Network Grant program: Behavioral Health Integration (BHI) Evidence Based Telehealth
Network and the Evidence-Based Telehealth Network program for Direct-to-Consumer services.
The Telehealth Resource Center (TRC) program measure (6070.04) represents results from FY
2022 funding and was collected between September 2022 through August 2023, aligning with
the program funding period. These results will vary based on the need for telehealth-related
technical assistance from providers as well as funding for the program. The target for FY 2025
370
371.
has been established based on level funding for the TRC program, which can affect TRC’scapacity in providing technical assistance.
Grant Awards Table
FY 2023
Final
Number of Awards
Average Award
Range of Awards
FY 2025
President’s Budget
FY 2024 CR
70
67
67
$478,700
$500,110
$500,110
$74,250 - $4,250,000
$250,000 $4,250,000
$250,000 $4,250,000
371
372.
TITLE XFAMILY PLANNING
TAB
372
373.
TITLE X FAMILY PLANNING PROGRAMFY 2025
President’s Budget
FY 2025
+/FY 2023
FY 2023
Final
FY 2024
CR
BA
$286,479,000
$286,479,000
$390,000,000
+$103,521,000
FTE
20
20
35
+15
Authorizing Legislation ………………………………Title X of the Public Health Service Act
FY 2025 Authorization…………………………………………………………….…....Expired
Allocation Method:
• Direct Federal
• Contract
• Competitive Grant
Program Description
The Title X Family Planning Program (Title X Program or Title X) is the only federal grant
program dedicated to providing individuals with comprehensive family planning and related
health services. Enacted in 1970 as part of the Public Health Service Act, the mission of the
Title X Program is to assist individuals and families in determining the number and spacing of
children and to provide access to voluntary family planning methods, services, and information
to all who want and need them. Title X authorizing legislation requires that projects provide a
broad range of effective and acceptable family planning methods and services, including fertility
awareness-based methods, infertility services, and services for adolescents. By law, priority is
given to persons from low-income families. The Title X Program is administered by the Office
of Population Affairs (OPA) in the Office of the Assistant Secretary for Health (OASH).
Advancing equity for all, including people from low-income families, people of color, and others
who have been historically underserved, marginalized, and adversely affected by persistent
poverty and inequality, is a priority for the Department, for OASH/OPA, and for the Title X
Program. Grantees, subrecipients, and service sites funded by the Title X Program work to
ensure the predominantly low-income clients, who rely on Title X services as their usual source
of medical care, have access to the same quality healthcare, including full medical information
and referrals, that higher-income clients and clients with private insurance are able to
access. Key strategies for advancing equity include removing barriers to accessing services,
improving the quality of services, and providing client-centered services.
Budget Request
The Title X Family Planning Program’s FY 2025 request is $390.0 million, which is an increase
of $103.5 million above the FY 2023 Final level. This request will fund family planning services
for approximately 3.6 million individuals, with 90% having family incomes at or below 250% of
373
374.
the federal poverty level. Funding at this increased level will enable Title X providers tocontinue to expand services to additional clients and additional communities. OPA will continue
to work with Title X grantees to focus on expanding access and advancing equity to the greatest
extent possible. This FY 2025 request will also support program administration and evaluation,
as well as continued training and technical assistance to grantees, including supporting the
operation of the Reproductive Health National Training Center and the National Clinical
Training Center for Family Planning. In FY 2025, OPA also plans to finalize and release an
update to the Quality Family Planning guidelines, the nationally recognized standards of care
that define quality in a family planning visit.
Five Year Funding History
Fiscal Year
FY 2021
FY 2022
FY 2023
FY 2024 CR
FY 2025 President’s Budget
Amount
$285,619,000
$286,479,000
$286,479,000
$286,479,000
$390,000,000
Program Accomplishments
For more than 50 years, the Title X Program has played a critical role in ensuring access to a
broad range of family planning and preventive health services for low-income or uninsured
individuals, including cervical cancer screening, contraceptive counseling and care, and STI
testing. OPA provides Title X services through a network of 86 competitively awarded grants to
public and private nonprofit organizations. Title X services are delivered in all 50 states, the
District of Columbia, Guam, the Commonwealth of Puerto Rico, the Northern Mariana Islands,
the U.S. Virgin Islands, American Samoa, the Federated State of Micronesia, and the Republic of
Palau. Title X services are provided through a diverse network of clinics, including state and
local health departments, federally qualified health centers, hospital-based sites, and other private
nonprofit and community-based health centers.
In 2022, the latest year data available, 2,600,663 clients received Title X services through a
network of 4,126 clinical service sites. This represents an increase of 938,197 clients and 842
clinical service sites in 2022 compared to 2021. Title X sites provide client-centered services by
ensuring access to a broad range of acceptable and effective family planning methods and
services. In 2022, 36% of female clients used short-term hormonal methods, 17% used longacting reversible methods,15% relied on barrier methods, 3% used permanent methods, 1% used
a fertility awareness-based method (FAM); and others used no method because they were either
pregnant, seeking to become pregnant, or abstinent.
Title X sites provided cervical cancer screening services for 440,732 female clients, and 15% of
the tests performed required further evaluation and possible treatment. Title X sites also
provided STI and HIV testing necessary for preventing disease transmission and adverse health
consequences. Title X providers screened 1,277,703 clients for chlamydia; 1,501,331 clients for
374
375.
gonorrhea; 660,992 clients for syphilis; and 878,728 clients for HIV. Of the confidential HIVtests performed, 3,557 were positive for HIV.
In addition to providing Title X services nationwide, OPA launched FPAR 2.0 in 2023 to collect
encounter-level data on all services provided through the Title X program, increasing OPA’s
ability to report outputs and outcomes of Title X projects and the overall program. OPA also
funds several family planning research projects to expand our understanding of best practices
and promising strategies to advance equity, bolster access, and improve quality of family
planning services. In addition, it continues to provide training and technical assistance support
for all staff, including clinical service providers, working in Title X clinics through the
Reproductive Health National Training Center and the National Clinical Training Center for
Family Planning.
Outputs and Outcomes Table
Long Term Objective: Increase awareness of voluntary family planning resources and methods
by providing Title X family planning services, education and research with a priority focus on
providing services to low-income individuals.
The targets for FY 2024 assume other sources of revenue that contribute to the family planning
program at the grantee level will remain at current levels, including Medicaid, state and local
government programs, other federal, state, and private grants, and private insurance.
Note: Measures were updated/revised for 2022 and 2023; thus, baselines aren’t available at this
time.
Year and Most
Recent Result/
Target for Recent
FY 2025
Measure
Result/
Target +/(Summary of
FY 2024 FY 2025
FY 2024
Result)
Target
Target
Target
8000.01 Total number of unduplicated FY 2022:
3,300,000 3,600,000 +100,000
clients served in Title X service sites. 2,600,663
Target: 3,500,000
(Target Not Met)
FY 2022: 84%
8000.02 Maintain the proportion of
clients served who are at or below
250% of the Federal poverty level at Target: 90%
90% of total unduplicated family
planning users.
(Target Not Met)
8000.05 Increase the proportion of
FY 2022: 54%
females ages 15 – 24 attending Title X
family planning clinics screened for
Target: 64%
Chlamydia infection.
(Target Not Met)
375
90%
90%
Maintain
60%
62%
+2
percentage
points
376.
Year and MostRecent Result/
Target for Recent
FY 2025
Measure
Result/
Target +/(Summary of
FY 2024 FY 2025
FY 2024
Result)
Target
Target
Target
8000.07 Percentage of Title X clinic FY 2022: 75%
79%
80%
+1
female clients who adopted or who
percentage
reported using a contraceptive method Target: Not
points
at their last visit
Defined
(Pending)
8000.08 Increase the percentage of
FY 2022: 20%
Title X clinic clients who are screened
for cervical cancer
Target: Not
Defined
(Pending)
8000.09 Percentage of clients attending FY 2022: 31%
a Title X clinic who are uninsured
Target: Not
Defined
8000.10 Percentage of Title X sites
with telehealth capabilities
(Pending)
FY 2022: 31%
27%
28%
+1
percentage
points
37%
36%
-1
percentage
points
23%
30%
+7
percentage
points
53%
Maintain
29%
Maintain
Target: Not
Defined
(Pending)
8000.11 Increase the proportion of
FY 2022: Not
N/A
Title X female clients ages 15-24 who available until 2026
are screened for gonorrhea
Target: Not
Defined
8000.12 Increase the proportion of
Title X clients who are screened for
syphilis
(Pending)
FY 2022: Not
available until
2026
Target: Not
Defined
(Pending)
376
N/A
377.
Measure8000.13 Increase the proportion of
Title X clients who are screened for
HIV
Year and Most
Recent Result/
Target for Recent
FY 2025
Result/
Target +/(Summary of
FY 2024 FY 2025
FY 2024
Result)
Target
Target
Target
FY 2022: Not
N/A
30%
Maintain
available until 2026
Target: Not
Defined
(Pending)
Performance Narrative
OPA funded 90 Title X service grantees at the beginning of FY 2019. Following implementation
of the Title X Final Rule in FY 2019, 19 grantees discontinued participating in the Title X
Program, and another 18 grantees reported significant losses to their service networks. OPA
funded an additional five Title X grantees in FY 2020; however, there remained six states (HI,
ME, OR, UT, VT, and WA) without any Title X services available and another seven states (AK,
CT, IL, MA, MN, NH, and NY) with Title X services available on a very limited basis. This
resulted in Title X serving fewer clients and therefore not meeting the performance targets for
2019, 2020, and 2021.
In October 2021, HHS finalized rulemaking to revise the regulations (effective November 8,
2021) that govern the Title X family planning program (authorized by Title X of the Public
Health Service Act). OPA currently provides funding to 86 grantees who have restored Title X
services nationwide and who continue to increase the total number of clients served.
Grants Awards Table
FY 2023
Final
Number of Awards
FY 2024
CR
86
FY 2025
President’s Budget
86
86
Average Award
$3,323,078
$3,323,078
$3,700,000
Range of Awards
$200,000 $15,400,000
$200,000 $15,400,000
$200,000 $17,000,000
377
378.
SUPPLEMENTARYTABLES
378
379.
Object Class Tables(dollars in thousands)
DISCRETIONARY
OBJECT CLASS
Full-time permanent (11.1)
Other than full-time permanent (11.3)
Other personnel compensation (11.5)
Military personnel (11.7)
Special personnel services payments (11.8)
Subtotal personnel compensation
Civilian benefits (12.1)
Military benefits (12.2)
Benefits to former personnel (13.1)
Total Pay Costs
Travel and transportation of persons (21.0)
Transportation of things (22.0)
Rental payments to GSA (23.1)
Rental payments to Others (23.2)
Communication, utilities, and misc. charges (23.3)
Printing and reproduction (24.0)
Other Contractual Services: 25.0
Advisory and assistance services (25.1)
Other services (25.2)
Purchase of goods/services from govt accounts (25.3)
Operation and maintenance of facilities (25.4)
Research and Development Contracts (25.5)
Medical care (25.6)
Operation and maintenance of equipment (25.7)
Subsistence and support of persons (25.8)
Discounts and Interest (25.9)
Supplies and materials (26.0)
Subtotal Other Contractual Services
Equipment (31.0)
Land and Structures (32)
Investments and Loans (33.0)
Grants, subsidies, and contributions (41.0)
Insurance Claims and Indemnities (42.0)
Total Non-Pay Costs
Total Budget Authority by Object Class
FY 2023 Final
FY 2024 CR
211,634
4,161
5,882
16,965
21
238,663
77,144
1,726
1,291
318,824
2747
212
15,935
102
49
144
25,375
327,135
215,574
679
126
3,120
4,364
61
231,168
4,371
6,173
17,702
22
259,436
86,683
1,807
347,926
2747
212
15,935
102
49
144
25,375
327,135
215,574
679
126
3,120
4,364
61
552
576,986
5,540
8,439,671
105,073
9,146,459
9,465,283
553
576,987
5,540
8,410,568
105,073
9,117,357
9,465,283
379
FY 2025
President's
Budget
240,228
4,493
6,346
18,530
22
269,619
90,647
1,891
362,157
2747
212
15,935
102
49
144
25,375
327,135
215,574
679
126
3,120
4,364
61
554
576,988
5,540
7,164,690
105,073
7,871,480
8,233,637
FY2025+/- FY
2023
+28,594
+332
+464
+1,565
+1
+30,956
+13,503
+165
+43,333
+2
+2
-1,274,981
-1,274,979
-1,231,646
380.
PRIMARY HEALTH CAREOBJECT CLASS
FY 2023
Final
FY 2024
CR
FY 2025
President's
Budget
FY2025+/FY 2023
Full-time permanent (11.1)
Other than full-time permanent (11.3)
Other personnel compensation (11.5)
Military personnel (11.7)
Special personnel services payments (11.8)
Subtotal personnel compensation
Civilian benefits (12.1)
Military benefits (12.2)
Benefits to former personnel (13.1)
33,253
270
778
3,470
14
37,785
12,187
301
-
38,532
283
817
3,645
14
43,292
15,052
316
-
39,611
291
840
3,816
15
44,573
15,474
331
-
+6,358
+22
+62
+346
+1
+6,789
+3,287
+30
-
Total Pay Costs
Travel and transportation of persons (21.0)
Transportation of things (22.0)
Rental payments to GSA (23.1)
Rental payments to Others (23.2)
Communication, utilities, and misc. charges (23.3)
Printing and reproduction (24.0)
Other Contractual Services: 25.0
Advisory and assistance services (25.1)
Other services (25.2)
Purchase of goods/services from govt accounts (25.3)
Operation and maintenance of facilities (25.4)
Research and Development Contracts (25.5)
Medical care (25.6)
Operation and maintenance of equipment (25.7)
Subsistence and support of persons (25.8)
Discounts and Interest (25.9)
Supplies and materials (26.0)
50,272
801
3,299
126,441
61,659
547
45
58,660
801
3,299
126,441
61,659
547
45
60,378
801
3,299
126,441
61,659
547
45
+10,106
-
Subtotal Other Contractual Services
Equipment (31.0)
Land and Structures (32)
Investments and Loans (33.0)
Grants, subsidies, and contributions (41.0)
Insurance Claims and Indemnities (42.0)
188,693
2,251
1,508,631
104,824
188,693
2,251
1,500,243
104,824
188,693
2,251
1,498,526
104,824
-10,105
-
Total Non-Pay Costs
1,808,499
1,800,112
1,798,394
-10,105
Total Budget Authority by Object Class
1,858,772
1,858,772
1,858,772
-
380
381.
HEALTH WORKFORCEFY 2024 CR
FY 2025
President's
Budget
20,505
352
543
1,854
23,253
7,660
239
31,152
2,747
212
15,935
102
49
144
25,375
53,938
41,794
94
521
121,722
453
25,050
370
570
1,947
27,937
9,215
251
37,404
2,747
212
15,935
102
49
144
25,375
53,938
41,794
94
521
121,722
453
26,426
380
586
2,038
29,431
9,698
263
39,392
2,747
212
15,935
102
49
144
25,375
53,938
41,794
94
521
121,722
453
1,217,857
4
1,359,224
1,390,376
1,211,605
4
1,352,972
1,390,376
1,286,617
4
1,427,984
1,467,376
FY 2023
Final
OBJECT CLASS
Full-time permanent (11.1)
Other than full-time permanent (11.3)
Other personnel compensation (11.5)
Military personnel (11.7)
Special personnel services payments (11.8)
Subtotal personnel compensation
Civilian benefits (12.1)
Military benefits (12.2)
Benefits to former personnel (13.1)
Total Pay Costs
Travel and transportation of persons (21.0)
Transportation of things (22.0)
Rental payments to GSA (23.1)
Rental payments to Others (23.2)
Communication, utilities, and misc. charges (23.3)
Printing and reproduction (24.0)
Other Contractual Services: 25.0
Advisory and assistance services (25.1)
Other services (25.2)
Purchase of goods/services from govt accounts (25.3)
Operation and maintenance of facilities (25.4)
Research and Development Contracts (25.5)
Medical care (25.6)
Operation and maintenance of equipment (25.7)
Subsistence and support of persons (25.8)
Discounts and Interest (25.9)
Supplies and materials (26.0)
Subtotal Other Contractual Services
Equipment (31.0)
Land and Structures (32)
Investments and Loans (33.0)
Grants, subsidies, and contributions (41.0)
Insurance Claims and Indemnities (42.0)
Total Non-Pay Costs
Total Budget Authority by Object Class
381
FY2025+/FY 2023
+5,922
+28
+43
+185
+0
+6,178
+2,038
+24
+0
+8,240
+68,760
+68,760
+77,000
382.
MATERNAL AND CHILD HEALTHOBJECT CLASS
FY 2023
Final
Full-time permanent (11.1)
Other than full-time permanent (11.3)
Other personnel compensation (11.5)
Military personnel (11.7)
Special personnel services payments (11.8)
Subtotal personnel compensation
Civilian benefits (12.1)
Military benefits (12.2)
Benefits to former personnel (13.1)
Total Pay Costs
Travel and transportation of persons (21.0)
Transportation of things (22.0)
Rental payments to GSA (23.1)
Rental payments to Others (23.2)
Communication, utilities, and misc. charges (23.3)
Printing and reproduction (24.0)
Other Contractual Services: 25.0
Advisory and assistance services (25.1)
Other services (25.2)
Purchase of goods/services from govt accounts (25.3)
Operation and maintenance of facilities (25.4)
Research and Development Contracts (25.5)
Medical care (25.6)
Operation and maintenance of equipment (25.7)
Subsistence and support of persons (25.8)
Discounts and Interest (25.9)
Supplies and materials (26.0)
Subtotal Other Contractual Services
Equipment (31.0)
Land and Structures (32)
Investments and Loans (33.0)
Grants, subsidies, and contributions (41.0)
Insurance Claims and Indemnities (42.0)
Total Non-Pay Costs
Total Budget Authority by Object Class
17,262
67
423
490
18,242
6,310
46
24,598
731
2,097
3
2
22,604
14,036
24,594
37
632
2
61,905
817
1,081,155
122
1,146,832
1,171,430
382
FY 2024 CR
FY 2025
President's
Budget
FY2025+/FY 2023
38,532
283
817
3,645
14
43,292
15,052
316
58,660
801
3,299
126,441
61,659
547
45
188,693
2,251
812,901
104,824
1,112,770
1,171,430
39,611
291
840
3,816
15
44,573
15,474
331
60,378
801
3,299
126,441
61,659
547
45
188,693
2,251
874,698
104,824
1,174,566
1,234,944
+22,349
+224
+417
+3,326
+15
+26,331
+9,164
+285
+35,780
+70
+1,202
-3
-2
-22,604
+112,405
+37,065
-37
-85
+43
+126,788
+1,434
-206,457
+104,702
+27,734
+63,514
383.
HIV/AIDSOBJECT CLASS
Full-time permanent (11.1)
Other than full-time permanent (11.3)
Other personnel compensation (11.5)
Military personnel (11.7)
Special personnel services payments (11.8)
Subtotal personnel compensation
Civilian benefits (12.1)
Military benefits (12.2)
Benefits to former personnel (13.1)
Total Pay Costs
Travel and transportation of persons (21.0)
Transportation of things (22.0)
Rental payments to GSA (23.1)
Rental payments to Others (23.2)
Communication, utilities, and misc. charges (23.3)
Printing and reproduction (24.0)
Other Contractual Services: 25.0
Advisory and assistance services (25.1)
Other services (25.2)
Purchase of goods/services from govt accounts (25.3)
Operation and maintenance of facilities (25.4)
Research and Development Contracts (25.5)
Medical care (25.6)
Operation and maintenance of equipment (25.7)
Subsistence and support of persons (25.8)
Discounts and Interest (25.9)
Supplies and materials (26.0)
Subtotal Other Contractual Services
Equipment (31.0)
Land and Structures (32)
Investments and Loans (33.0)
Grants, subsidies, and contributions (41.0)
Insurance Claims and Indemnities (42.0)
Total Non-Pay Costs
Total Budget Authority by Object Class
FY 2023
Final
28,208
278
758
3,228
32,472
10,324
358
43,154
377
18
3,183
9
50,884
62,366
29
1,559
51
114,898
755
2,408,643
13
2,527,887
2,571,041
383
FY 2024 CR
FY 2025
President's
Budget
FY2025+/FY 2023
29,621
292
796
3,391
34,100
10,845
375
45,321
377
18
3,183
9
50,884
62,366
29
1,559
51
114,898
755
2,406,476
13
2,525,720
2,571,041
30,451
300
819
3,549
35,119
11,149
393
46,661
377
18
3,183
9
50,884
62,366
29
1,559
51
114,898
755
2,415,136
13
2,534,380
2,581,041
+2,243
+22
+61
+321
+2,647
+825
+35
+3,507
+6,493
+6,493
+10,000
384.
HEALTH SERVICESOBJECT CLASS
Full-time permanent (11.1)
Other than full-time permanent (11.3)
Other personnel compensation (11.5)
Military personnel (11.7)
Special personnel services payments (11.8)
Subtotal personnel compensation
Civilian benefits (12.1)
Military benefits (12.2)
Benefits to former personnel (13.1)
Total Pay Costs
Travel and transportation of persons (21.0)
Transportation of things (22.0)
Rental payments to GSA (23.1)
Rental payments to Others (23.2)
Communication, utilities, and misc. charges (23.3)
Printing and reproduction (24.0)
Other Contractual Services: 25.0
Advisory and assistance services (25.1)
Other services (25.2)
Purchase of goods/services from govt accounts (25.3)
Operation and maintenance of facilities (25.4)
Research and Development Contracts (25.5)
Medical care (25.6)
Operation and maintenance of equipment (25.7)
Subsistence and support of persons (25.8)
Discounts and Interest (25.9)
Supplies and materials (26.0)
Subtotal Other Contractual Services
Equipment (31.0)
Land and Structures (32)
Investments and Loans (33.0)
Grants, subsidies, and contributions (41.0)
Insurance Claims and Indemnities (42.0)
Total Non-Pay Costs
Total Budget Authority by Object Class
FY 2023
Final
5,038
130
187
843
6,199
1984
56
8,239
82
62
2237
95
25
1
7
71,293
3138
435
379
3120
275
61
397
79,106
298
8,850
15
90,770
99,009
384
FY 2024
CR
5,038
130
187
843
6,199
1,984
56
8,239
82
62
2237
95
25
1
7
71,294
3138
435
379
3120
275
61
398
79,108
298
8,848
15
90,770
99,009
FY 2025
President's
Budget
FY2025+/FY 2023
5,040
140
196
803
6,179
2,670
55
8,904
82
62
2237
95
25
1
7
71,295
3138
435
379
3120
275
61
399
79,110
298
44,181
15
126,105
135,009
+2
+10
+9
-40
-20
+686
-1
+665
+2
+2
+4
+35,331
+35,335
+36,000
385.
RURAL HEALTH POLICYFY 2023
Final
OBJECT CLASS
Full-time permanent (11.1)
Other than full-time permanent (11.3)
Other personnel compensation (11.5)
Military personnel (11.7)
Special personnel services payments (11.8)
Subtotal personnel compensation
Civilian benefits (12.1)
Military benefits (12.2)
Benefits to former personnel (13.1)
Total Pay Costs
Travel and transportation of persons (21.0)
Transportation of things (22.0)
Rental payments to GSA (23.1)
Rental payments to Others (23.2)
Communication, utilities, and misc. charges (23.3)
Printing and reproduction (24.0)
Other Contractual Services: 25.0
Advisory and assistance services (25.1)
Other services (25.2)
Purchase of goods/services from govt accounts (25.3)
Operation and maintenance of facilities (25.4)
Research and Development Contracts (25.5)
Medical care (25.6)
Operation and maintenance of equipment (25.7)
Subsistence and support of persons (25.8)
Discounts and Interest (25.9)
Supplies and materials (26.0)
Subtotal Other Contractual Services
Equipment (31.0)
Land and Structures (32)
Investments and Loans (33.0)
Grants, subsidies, and contributions (41.0)
Insurance Claims and Indemnities (42.0)
Total Non-Pay Costs
Total Budget Authority by Object Class
5,230
225
135
5,590
1,967
7557
275
30
5
85
10,621
4922
30
573
16,231
656
327,353
344,850
352,407
385
FY 2024 CR
FY 2025
President's
Budget
FY2025+/FY 2023
5831
237
141
6,209
2,179
8388
275
330
5
85
10,622
4922
30
573
16,232
657
326,520
344,019
352,407
5,994
243
145
6,382
2,241
8623
275
330
5
85
10,623
4922
30
573
16,233
658
326,283
343,784
352,407
+764
+18
+10
+792
+274
+10
+2
+2
+2
-1,070
-1,066
-
386.
HRSA-WIDE ACTIVITIES AND PROGRAM SUPPORTProgram Management
OBJECT CLASS
Full-time permanent (11.1)
Other than full-time permanent (11.3)
Other personnel compensation (11.5)
Military personnel (11.7)
Special personnel services payments (11.8)
Subtotal personnel compensation
Civilian benefits (12.1)
Military benefits (12.2)
Benefits to former personnel (13.1)
Total Pay Costs
Travel and transportation of persons (21.0)
Transportation of things (22.0)
Rental payments to GSA (23.1)
Rental payments to Others (23.2)
Communication, utilities, and misc. charges (23.3)
Printing and reproduction (24.0)
Other Contractual Services: 25.0
Advisory and assistance services (25.1)
Other services (25.2)
Purchase of goods/services from govt accounts (25.3)
Operation and maintenance of facilities (25.4)
Research and Development Contracts (25.5)
Medical care (25.6)
Operation and maintenance of equipment (25.7)
Subsistence and support of persons (25.8)
Discounts and Interest (25.9)
Supplies and materials (26.0)
Subtotal Other Contractual Services
Equipment (31.0)
Land and Structures (32)
Investments and Loans (33.0)
Grants, subsidies, and contributions (41.0)
Insurance Claims and Indemnities (42.0)
Total Non-Pay Costs
Total Budget Authority by Object Class
FY 2023
Final
FY 2024 CR
98,615
2,711
3,009
5,994
64
110,393
36,727
623
1,292
149,035
124
106
2,498
18
138
8,843
5946
7
-
102,828
2,845
3,098
6,297
7
115,075
38,289
654
1,357
155,375
124
106
2,498
18
138
8,843
5946
7
1
25
123
14,944
310
1,518,351
95
1,536,446
1,685,481
26
123
14,946
310
1,512,008
96
1,530,106
1,685,481
386
FY 2025
President's
Budget
FY2025+/FY 2023
106,832
2,925
3,185
6,591
7
119,540
39,736
685
1,395
161,356
2,347
97
2,444
163,800
+8,217
+214
+176
+597
-57
+9,147
+3,009
+62
+103
+12,321
-151
-18
-138
-8,843
-5,946
-7
+0
-25
-123
-14,944
-310
-1,518,351
+2
-1,534,002
-1,521,681
387.
340BOBJECT CLASS
Full-time permanent (11.1)
Other than full-time permanent (11.3)
Other personnel compensation (11.5)
Military personnel (11.7)
Special personnel services payments (11.8)
Subtotal personnel compensation
Civilian benefits (12.1)
Military benefits (12.2)
Benefits to former personnel (13.1)
Total Pay Costs
Travel and transportation of persons (21.0)
Transportation of things (22.0)
Rental payments to GSA (23.1)
Rental payments to Others (23.2)
Communication, utilities, and misc. charges (23.3)
Printing and reproduction (24.0)
Other Contractual Services: 25.0
Advisory and assistance services (25.1)
Other services (25.2)
Purchase of goods/services from govt accounts (25.3)
Operation and maintenance of facilities (25.4)
Research and Development Contracts (25.5)
Medical care (25.6)
Operation and maintenance of equipment (25.7)
Subsistence and support of persons (25.8)
Discounts and Interest (25.9)
Supplies and materials (26.0)
Subtotal Other Contractual Services
Equipment (31.0)
Land and Structures (32)
Investments and Loans (33.0)
Grants, subsidies, and contributions (41.0)
Insurance Claims and Indemnities (42.0)
Total Non-Pay Costs
Total Budget Authority by Object Class
FY 2023
Final
FY 2024
CR
FY 2025
President's
Budget
2,385
17
58
952
3,412
818
97
2,505
18
61
1,000
3,584
859
102
2,575
18
63
1,047
3,703
883
107
4,327
9
262
5,928
1,648
60
5
7,641
7,912
12,238
4,545
9
262
5,928
1,429
60
5
7,422
7,693
12,238
4,693
9
262
5,928
1,281
60
5
7,274
7,545
12,238
387
FY2025+/FY 2023
+190
+1
+5
+95
+291
+65
+10
+0
+366
-367
-367
-367
-
388.
TelehealthOBJECT CLASS
Full-time permanent (11.1)
Other than full-time permanent (11.3)
Other personnel compensation (11.5)
Military personnel (11.7)
Special personnel services payments (11.8)
Subtotal personnel compensation
Civilian benefits (12.1)
Military benefits (12.2)
Benefits to former personnel (13.1)
Total Pay Costs
Travel and transportation of persons (21.0)
Transportation of things (22.0)
Rental payments to GSA (23.1)
Rental payments to Others (23.2)
Communication, utilities, and misc. charges (23.3)
Printing and reproduction (24.0)
Other Contractual Services: 25.0
Advisory and assistance services (25.1)
Other services (25.2)
Purchase of goods/services from govt accounts (25.3)
Operation and maintenance of facilities (25.4)
Research and Development Contracts (25.5)
Medical care (25.6)
Operation and maintenance of equipment (25.7)
Subsistence and support of persons (25.8)
Discounts and Interest (25.9)
Supplies and materials (26.0)
Subtotal Other Contractual Services
Equipment (31.0)
Land and Structures (32)
Investments and Loans (33.0)
Grants, subsidies, and contributions (41.0)
Insurance Claims and Indemnities (42.0)
Total Non-Pay Costs
Total Budget Authority by Object Class
FY 2023
Final
FY 2024
CR
FY 2025
President's
Budget
820
20
17
857
302
1,159
17
973
20
18
1,011
355
1,366
17
1,001
21
19
1,041
364
1,405
17
55
-
55
-
55
-
1,522
1,377
1,522
1,377
1,522
1,377
166
3,065
33,754
36,891
38,050
166
3,065
33,547
36,684
38,050
166
3,065
33,508
36,645
38,050
388
FY2025+/FY 2023
+181
+1
+2
+184
+62
+246
-246
-246
-
389.
Family PlanningOBJECT CLASS
Full-time permanent (11.1)
Other than full-time permanent (11.3)
Other personnel compensation (11.5)
Military personnel (11.7)
Special personnel services payments (11.8)
Subtotal personnel compensation
Civilian benefits (12.1)
Military benefits (12.2)
Benefits to former personnel (13.1)
Total Pay Costs
Travel and transportation of persons (21.0)
Transportation of things (22.0)
Rental payments to GSA (23.1)
Rental payments to Others (23.2)
Communication, utilities, and misc. charges (23.3)
Printing and reproduction (24.0)
Other Contractual Services: 25.0
Advisory and assistance services (25.1)
Other services (25.2)
Purchase of goods/services from govt accounts (25.3)
Operation and maintenance of facilities (25.4)
Research and Development Contracts (25.5)
Medical care (25.6)
Operation and maintenance of equipment (25.7)
Subsistence and support of persons (25.8)
Discounts and Interest (25.9)
Supplies and materials (26.0)
Subtotal Other Contractual Services
Equipment (31.0)
Land and Structures (32)
Investments and Loans (33.0)
Grants, subsidies, and contributions (41.0)
Insurance Claims and Indemnities (42.0)
Total Non-Pay Costs
Total Budget Authority by Object Class
FY 2023
Final
5,601
138
162
314
6,215
2,117
17
8,348
180
5
3
2,669
262
10,449
2
5
74
13,462
4
264,476
278,131
286,479
389
FY 2024 CR
FY 2025
President's
Budget
FY2025+/FY 2023
7,572
145
170
329
8,216
2,786
17
11,019
180
5
3
2,669
262
10,449
2
5
0
75
13,463
5
261,802
1
275,460
286,479
7,784
149
175
345
8,453
2,864
18
11,335
180
5
3
2,669
262
10,449
2
5
76
13,464
6
365,004
2
378,665
390,000
+2,183
+11
+13
+31
+2,238
+747
+1
+2,987
+2
+2
+2
+100,528
+2
+100,534
+103,521
390.
MANDATORYOBJECT CLASS
Full-time permanent (11.1)
Other than full-time permanent (11.3)
Other personnel compensation (11.5)
Military personnel (11.7)
Special personnel services payments (11.8)
Subtotal personnel compensation
Civilian benefits (12.1)
Military benefits (12.2)
Benefits to former personnel (13.1)
Total Pay Costs
Travel and transportation of persons (21.0)
Transportation of things (22.0)
Rental payments to GSA (23.1)
Rental payments to Others (23.2)
Communication, utilities, and misc. charges (23.3)
Printing and reproduction (24.0)
Other Contractual Services: 25.0
Advisory and assistance services (25.1)
Other services (25.2)
Purchase of goods/services from govt accounts (25.3)
Operation and maintenance of facilities (25.4)
Research and Development Contracts (25.5)
Medical care (25.6)
Operation and maintenance of equipment (25.7)
Subsistence and support of persons (25.8)
Discounts and Interest (25.9)
Supplies and materials (26.0)
Subtotal Other Contractual Services
Equipment (31.0)
Land and Structures (32)
Investments and Loans (33.0)
Grants, subsidies, and contributions (41.0)
Insurance Claims and Indemnities (42.0)
Total Non-Pay Costs
Total Budget Authority by Object Class
`
FY 2024 CR
FY 2025
President's
Budget
66,086
1,241
2,322
9,258
14
78,921
24,690
927
104,538
173
24
3,667
30
8,618
58,296
121,572
84
1,570
-
70,747
892
2,062
8,225
14
81,940
26,012
838
108,790
173
24
3,667
30
8,619
58,297
121,572
84
1,570
-
79,590
917
2,119
8,609
15
91,250
29,028
877
121,155
173
24
3,667
30
8,620
58,298
121,572
84
1,570
-
190,140
1,416
4,522,638
4,718,088
4,822,626
190,142
1,416
6,337,066
6,532,518
6,641,308
190,144
1,416
7,711,191
7,906,645
8,027,800
FY 2023
Final
390
FY2025+/FY 2023
+13,504
-324
-203
-649
+1
+12,329
+4,338
-50
+16,617
+2
+2
+4
+3,188,553
+3,188,557
+3,205,174
391.
Salary and ExpensesDiscretionary
OBJECT CLASS
Full-time permanent (11.1)
Other than full-time permanent (11.3)
Other personnel compensation (11.5)
Military personnel (11.7)
Special personnel services payments (11.8)
Subtotal personnel compensation
Civilian benefits (12.1)
Military benefits (12.2)
Benefits to former personnel (13.1)
Total Pay Costs
Travel and transportation of persons (21.0)
Transportation of things (22.0)
Rental payments to Others (23.2)
Communication, utilities, and misc. charges (23.3)
Printing and reproduction (24.0)
Other Contractual Services: 25.0
Advisory and assistance services (25.1)
Other services (25.2)
Purchase of goods/services from govt accounts (25.3)
Operation and maintenance of facilities (25.4)
Medical care (25.6)
Operation and maintenance of equipment (25.7)
Subsistence and support of persons (25.8)
Discounts and Interest (25.9)
Supplies and materials (26.0)
Subtotal Other Contractual Services
Equipment (31.0)
Insurance Claims and Indemnities (42.0)
Total Non-Pay Costs
Total Budget Authority by Object Class
FY 2023
Final
211,634
4,161
5,882
16,965
21
238,663
77,144
1,726
1,291
318,824
2,747
212
102
49
144
25,375
327,135
215,574
679
3,120
4,364
61
552
576,860
5,540
105,073
690,727
1,009,551
391
FY 2024 CR
FY 2025
President's
Budget
231,168
4,371
6,173
17,702
22
259,436
86,683
1,807
347,926
2,747
212
102
49
144
25,375
327,135
215,574
679
3,120
4,364
61
553
576,861
5,540
105,073
690,728
1,038,654
240,228
4,493
6,346
18,530
22
269,619
90,647
1,891
362,157
2,747
212
102
49
144
25,375
327,135
215,574
679
3,120
4,364
61
554
576,862
5,540
105,073
690,729
1,052,886
FY2025+/FY 2023
+28,594
+332
+464
+1,565
+1
+30,956
+13,503
+165
-1,291
+43,333
+2
+2
+43,335
392.
Salary and ExpensesMandatory
OBJECT CLASS
Full-time permanent (11.1)
Other than full-time permanent (11.3)
Other personnel compensation (11.5)
Military personnel (11.7)
Special personnel services payments (11.8)
Subtotal personnel compensation
Civilian benefits (12.1)
Military benefits (12.2)
Benefits to former personnel (13.1)
Total Pay Costs
Travel and transportation of persons (21.0)
Transportation of things (22.0)
Rental payments to Others (23.2)
Communication, utilities, and misc. charges (23.3)
Printing and reproduction (24.0)
Other Contractual Services: 25.0
Advisory and assistance services (25.1)
Other services (25.2)
Purchase of goods/services from govt accounts (25.3)
Operation and maintenance of facilities (25.4)
Medical care (25.6)
Operation and maintenance of equipment (25.7)
Subsistence and support of persons (25.8)
Discounts and Interest (25.9)
Supplies and materials (26.0)
Subtotal Other Contractual Services
Equipment (31.0)
Total Non-Pay Costs
Total Budget Authority by Object Class
FY 2023
Final
FY 2024
CR
FY 2025
President's
Budget
FY2025+/FY 2023
+13,504
-324
-203
-649
+1
+12,329
+4,338
-50
66,086
1,241
2,322
9,258
14
78,921
24,690
927
104,538
173
24
30
8,618
58,296
121,572
84
1,570
-
70,747
892
2,062
8,225
14
81,940
26,012
838
108,790
173
24
30
8,619
58,297
121,572
84
1,570
-
79,590
917
2,119
8,609
15
91,250
29,028
877
121,155
173
24
30
8,620
58,298
121,572
84
1,570
-
190,140
1,416
191,783
296,321
190,142
1,416
191,785
300,575
190,144
1,416
191,787
312,942
392
+16,617
+4
+4
+16,621
393.
Statement of Personnel ResourcesPrograms
Civilian
2023 Actual
Military
Total
Civilian
2024 Enacted
Military
Total
265
265
27
27
292
292
297
297
27
27
324
324
297
297
27
27
324
324
Mandatory:
Health Centers
Total, Mandatory
257
257
27
27
284
284
317
317
27
27
344
344
377
377
27
27
404
404
Total FTE, BPHC
522
54
576
614
54
668
674
54
728
13
1
6
2
5
5
4
2
3
15
4
26
10
2
1
1
2
2
3
2
1
15
1
7
2
5
6
6
2
5
18
4
28
11
14
1
6
2
7
8
4
2
4
24
6
32
12
2
1
1
2
2
3
2
1
16
1
7
2
7
9
6
2
6
27
6
34
13
14
1
6
2
7
8
4
2
4
28
6
32
12
2
1
1
2
2
3
2
1
16
1
7
2
7
9
6
2
6
31
6
34
13
Bureau of Primary Health Care:
Direct:
Health Centers/Tort
Free Clinics Medical Malpractice
Total, Direct:
Health Workforce:
Direct:
National Health Service Corps
Loan Repayment/Faculty Fellowships
Centers for Excellence
Scholarships for Disadvantaged Students
Health Careers Opportunity Program
Health Care Workforce Assessment
Primary Care Training and Enhancement
Oral Health Training
Area Health Education Centers
Geriatric Programs
Behavioral Health Workforce Development Programs
Public Health/Preventive Medicine
NURSE Corps Loan Repayment & Scholarship
Advanced Education Nursing Program
393
2025 President's Budget
Civilian
Military
Total
394.
ProgramsCivilian
5
3
4
21
1
130
2023 Actual
Military
1
1
16
Total
5
4
4
22
1
146
Civilian
5
7
5
21
1
161
2024 Enacted
Military
1
1
16
Total
5
8
5
22
1
177
Reimbursable:
National Practitioner Data Bank
Total, Reimbursable:
32
32
1
1
33
33
33
33
1
1
34
34
33
33
1
1
34
34
Mandatory:
National Health Service Corps
Teaching Health Centers
Nurse Corps
Behavioral Health Workforce Education and Training
Mental and Behavioral Health
Promote Mental and Behavioral Health
Community Health Workforce
Total, Mandatory
215
8
6
4
2
2
3
240
21
2
1
1
25
236
10
6
4
3
2
4
265
233
14
247
21
2
23
254
16
270
233
14
247
21
2
23
254
16
270
402
42
444
441
40
481
447
40
487
68
4
8
3
5
8
1
1
-
69
4
9
3
5
8
68
4
8
3
5
8
1
1
-
69
4
9
3
5
8
72
6
8
3
5
8
1
1
-
73
6
9
3
5
8
Nurse Workforce Diversity
Nurse Education, Practice & Retention
Nurse Faculty Loan Program
Children's Hospitals GME Program
Graduate Medical Student Education
Health Care Workforce Innovation
Total, Direct
Total FTE, Health Workforce
2025 President's Budget
Civilian
Military
Total
5
5
7
1
8
5
5
21
1
22
1
1
2
2
167
16
183
Maternal and Child Health Bureau:
Direct:
Maternal & Child Health Block Grant
Innovation for Maternal Health
Autism and Other Developmental Disorders
Sickle Cell Service Demonstrations
Early Hearing Detection and Intervention
Emergency Medical Services for Children
394
395.
ProgramsCivilian
26
5
5
1
3
136
2023 Actual
Military
1
1
4
Total
26
6
5
2
3
140
Civilian
26
5
8
1
3
139
2024 Enacted
Military
1
1
4
Total
26
6
8
2
3
143
1
47
2
50
4
4
1
51
2
54
1
47
48
4
4
1
51
52
2
47
49
4
4
2
51
53
186
8
194
187
8
195
195
8
203
57
66
48
10
3
2
32
218
4
4
8
1
2
19
61
70
56
11
5
2
32
237
57
66
48
10
3
2
32
218
4
4
8
1
2
19
61
70
56
11
5
2
32
237
57
66
48
10
3
2
32
218
4
4
8
1
2
19
61
70
56
11
5
2
32
237
Total FTE, HAB
218
19
237
218
19
237
218
19
237
Healthcare Systems Bureau:
Direct:
Organ Transplantation
6
1
7
6
1
7
24
1
25
Healthy Start
Heritable Disorders
Pediatric Mental Health Care Access Grants
Screening and Treatment for Maternal Depression
Poison Control Centers
Total, Direct:
Mandatory
Family to Family Health Info Centers
Home Visiting
Pediatric Mental Health
Total, Mandatory
Total FTE, MCHB
HIV/AIDS Bureau:
Direct:
Ryan White Part A
Ryan White Part B
Ryan White Part C
Ryan White Part D
Ryan White Part F
Ryan White Part F Dental
Special Project of National Significance (SPNS)
Ending HIV/AIDS
Total, Direct:
395
2025 President's Budget
Civilian
Military
Total
27
27
5
1
6
8
8
1
1
2
3
3
146
4
150
396.
ProgramsCivilian
4
2
32
24
16
84
2023 Actual
Military
1
4
13
7
26
Total
4
3
36
37
23
110
Civilian
4
2
32
24
16
84
2024 Enacted
Military
1
4
13
7
26
Total
4
3
36
37
23
110
Reimbursable:
Hansen's Disease Center
Total, Reimbursable
1
1
-
1
1
1
1
-
1
1
1
1
-
1
1
Mandatory
Community Based Workforce Vaccine Outreach
Vaccine Confidence Initiative
Total, Mandatory
5
1
6
2
2
7
1
8
-
-
-
-
-
-
91
28
119
85
26
111
113
26
139
3
14
3
1
1
24
2
1
49
-
3
14
3
1
1
24
2
1
49
3
17
3
1
1
27
2
54
-
3
17
3
1
1
27
2
54
3
17
3
1
1
27
2
54
-
3
17
3
1
1
27
2
54
2
-
2
-
-
-
-
-
-
CW Bill Young Cell Transplantation Program
National Cord Blood Inventory
Hansen's Disease Center
Covered Countermeasures Compensation
Vaccine
Total, Direct:
Total FTE, HSB
Federal Office of Rural Health Policy:
Direct:
Rural Health Policy Development
Rural Health Outreach Grants
Rural Hospital Flexibility Grants
State Offices of Rural Health
Radiation Exposure Screening & Education Program
Black Lung
Rural Communities Opioid Response
Rural Residency
COVID 19 Reporting
Total, Direct:
Mandatory
Rural Health Clinics
396
2025 President's Budget
Civilian
Military
Total
4
4
2
1
3
32
4
36
29
13
42
21
7
28
112
26
138
397.
ProgramsCivilian
2
2
6
2023 Actual
Military
-
Total
2
2
6
Civilian
-
2024 Enacted
Military
-
Total
-
55
-
55
54
-
54
54
-
54
793
7
33
826
7
793
8
33
-
826
8
803
8
33
-
836
8
16
816
5
38
21
854
16
817
5
38
21
855
16
827
5
38
21
865
OGAC Global AIDS (Reimbursable)
Family Planning (Direct)
18
19
2
1
20
20
18
34
2
1
20
35
18
34
2
1
20
35
Provider Relief Bureau:
Provider Relief Fund Supplemental Funding
Uninsured Supplemental Funding
ARP OPS
Total, Direct
115
2
1
118
2
2
117
2
1
120
115
2
1
118
2
2
117
2
1
120
75
2
1
78
2
2
77
2
1
80
Subtotal Direct (non add)
Subtotal Reimbursable (non add)
Subtotal Mandatory (non add)
1,835
51
559
133
3
58
1,968
54
617
1,922
52
612
133
3
54
2,055
55
666
1,933
52
673
133
3
54
2,066
55
727
Subtotal, HRSA FTE
2,445
194
2,639
2,586
190
2,776
2,658
190
2,848
Rural Health Clinic Vaccine Confidence
Rural Health Clinic Vaccine Distribution
Total, Mandatory
Total, FORHP
HRSA-Wide Activities and Program Support:
Direct:
Program Management
Telehealth
340B Drug Pricing Program/Office of Pharmacy
Affairs
Total, Direct
397
2025 President's Budget
Civilian
Military
Total
-
398.
FTEs Funded by P.L. 111-148 and Any Supplementals(Dollars in Thousands)
FY 2013
Program
FY 2014
FY 2015
FY 2016
FTE
Total
Funding
FTE
Total
Funding
FTE
1,500,000
60
2,144,716
95
3,509,111
122
-
-
-
-
-
-
-
-
-
-
-
-
3,600,000
240
3.510.661
225
3,800,000
174
-
-
-
-
-
-
-
-
-
-
-
-
47,500
8
-
9
-
7
-
7
-
9
-
9
300,000
229
283,040
219
287,370
214
-
-
-
-
-
-
-
-
-
-
-
-
310,000
226
288,610
225
310,000
206
-
6
-
-
5
-
-
4
-
60,000
8
55,860
8
126,500
10
H.R. 3590,
Section 5507
5,000
-
5,000
1
5,000
1
5,000
1
4,655
1
6,000
1
H.R. 3590,
Section 2951
379,600
22
-
-
-
-
-
-
371,200
22
400,000
25
400,000
37
372,400
44
400,000
42
2,232,100
325
2,803,956
351
4,201,481
373
4,375,000
519
4,232,186
512
4,642,500
442
FTE
Total
Funding
FY 2018
Total
Funding
Section
Total
Funding
FY 2017
FTE
Total
Funding
FTE
Community Health Center Fund:
P.L. 111-148 Mandatory
Non-P.L. 111-148 Mandatory
H.R. 3590,
Section
10503(b)(1)
Health Centers - Facilities
Construction
H.R. 3590,
Section 10503(c)
School-Based Health CentersFacilities
H.R. 3590,
Section 4101
National Health Service Corps:
P.L. 111-148 Mandatory
Non-P.L. 111-148 Mandatory
GME Payments Teaching Health
Centers:
P.L. 111-148 Mandatory
Non-P.L. 111-148 Mandatory
H.R. 3590,
Section
10503(b)(2)
H.R. 3590,
Section 5508
Family to Family Health
Information Centers:
Non-P.L. 111-148 Mandatory
Home Visiting Program:
P.L. 111-148 Mandatory
Non-P.L. 111-148 Mandatory
Total
398
399.
FY 2019Program
Section
Total
Funding
FY 2020
FTE
Total
Funding
FY 2021
FTE
Total
Funding
FY 2022
FTE
Total
Funding
FY 2023
FTE
Total
Funding
FY 2024
FTE
Total
Funding
FTE
Community Health Center Fund:
P.L. 111-148 Mandatory
Non-P.L. 111-148 Mandatory
Health Centers - Facilities
Construction
School-Based Health CentersFacilities
H.R. 3590,
Section
10503(b)(1)
-
-
-
-
-
-
-
-
-
-
-
-
4,000,000
177
4,000,000
203
4,000,000
285
3,905,348
270
3,905,348
284
5,170,000
344
-
-
-
-
-
-
-
-
-
-
-
-
-
8
-
4
-
-
-
-
-
-
-
-
-
-
-
-
-
-
-
-
-
-
-
-
310,000
209
310,000
205
310,000
222
292,330
216
292,330
236
790,000
254
126,500
7
126,500
8
126,500
8
119,290
11
119,290
10
157,000
16
H.R. 3590,
Section 5507
6,000
1
6,000
1
5,658
1
5,658
1
5,658
1
5,658
1
H.R. 3590,
Section 2951
-
-
-
-
-
-
-
-
-
-
-
-
400,000
39
376,40000
38
377,200
41
377,200
50
500,000
55
518,650
55
4,818,900
441
4,819,358
441
4,819,358
557
4,699,826
557
4,822,626
586
6,641,308
670
H.R. 3590,
Section
10503(c)
H.R. 3590,
Section 4101
National Health Service Corps:
P.L. 111-148 Mandatory
Non-P.L. 111-148 Mandatory
GME Payments Teaching Health
Centers:
P.L. 111-148 Mandatory
Non-P.L. 111-148 Mandatory
H.R. 3590,
Section
10503(b)(2)
H.R. 3590,
Section 5508
Family to Family Health
Information Centers:
Non-P.L. 111-148 Mandatory
Home Visiting Program:
P.L. 111-148 Mandatory
Non-P.L. 111-148 Mandatory
Total
399
400.
FY 2025Program
Section
Total
Funding
FTE
Community Health Center Fund:
P.L. 111-148 Mandatory
Non-P.L. 111-148 Mandatory
Health Centers - Facilities
Construction
School-Based Health CentersFacilities
H.R. 3590,
Section
10503(b)(1)
H.R. 3590,
Section
10503(c)
H.R. 3590,
Section 4101
-
-
6,340,000
404
-
-
-
-
-
-
790,000
254
320,000
16
12,000
2
565,800
51
8,027,800
727
National Health Service Corps:
P.L. 111-148 Mandatory
Non-P.L. 111-148 Mandatory
GME Payments Teaching Health
Centers:
P.L. 111-148 Mandatory
Non-P.L. 111-148 Mandatory
H.R. 3590,
Section
10503(b)(2)
H.R. 3590,
Section 5508
Family to Family Health
Information Centers:
Non-P.L. 111-148 Mandatory
H.R. 3590,
Section 5507
Home Visiting Program:
P.L. 111-148 Mandatory
Non-P.L. 111-148 Mandatory
Total
H.R. 3590,
Section 2951
400
401.
Physicians’ Comparability Allowance (PCA) Worksheet1) Department and component:
Department of Health and Human Service, Health Resources and Services Administration
2) Explain the recruitment and retention problem(s) justifying the need for the PCA pay authority.
FY23 included (2) Separations of which (1) resigned and (1) retired. The average length of service was 4 years.
In FY23, we have (6) vacancies. At this time, (6) vacancies announcement have been posted and (5) vacancies have
been filled at this point. Quality applicants have been limited. For example, an average of 100 applications for
remote duty location and 20 applications for Rockville, MD are received for a vacancy.
To date there have been (5) Accessions.
3-4) Please complete the table below with details of the PCA agreement for the following years:
3a) Number of Physicians Receiving PCAs
3b) Number of Physicians with One-Year PCA Agreements
3c) Number of Physicians with Multi-Year PCA Agreements
4a) Average Annual PCA Physician Pay (without PCA payment)
4b) Average Annual PCA Payment
PY 2023
(Actual)
34
3
31
$181,577
$20,705
CY 2024
(Estimates)
37
0
37
$180,800
$21,658
BY* 2025
(Estimates)
37
0
37
$180,800
$21,658
*FY 2024 data will be approved during the FY 2025 Budget cycle.
5) Explain the degree to which recruitment and retention problems were alleviated in your agency through
the use of PCAs in the prior fiscal year.
In FY22 included (3) Separations of which (2) resigned and (1) retired. The average length of service was 13.5
years. To date there have been (3) Accessions. PCA in addition to their base salary was needed to meet their
current salary or salary expectations.
6) Provide any additional information that may be useful in planning PCA staffing levels and amounts in
your agency.
n/a
401
402.
CybersecurityCyber Category
Cyber Human Capital...............................................................
Planning Roles and Responsibilities........................................
Sector Risk Assessment, Management, and Operations..........
Sector Coordination ................................................................
Other NIST CSF Capabilities:
Detect..................................................................................
Identity.................................................................................
Protect.................................................................................
Recover................................................................................
Respond...............................................................................
Total Cyber Request..............................................................
Technology Ecosystems (non-add)...............................
Zero Trust Implementation (non-add)..........................
402
FY 2023
Final
FY 2024
CR
FY 2025
President's
Budget
FY 2025
+/- FY
2024
-----
0.300
0.220
0.120
0.220
0.590
0.440
0.140
1.510
+0.290
+0.220
+0.020
+1.290
1.763
13.556
34.159
1.567
1.567
52.612
0.450
24.200
1.816
13.962
44.096
1.616
1.616
63.966
0.390
25.600
1.870
14.381
50.342
1.666
1.666
72.605
0.220
30.200
+0.054
+0.419
+6.246
+0.050
+0.050
8.639
-0.170
4.600
403.
Drug Control BudgetHealth Resources and Services Administration
Resource Summary
Budget Authority (in millions)
FY 2024
Continuing
Resolution
FY 2023
Final
FY 2025
President’s
Budget
FY 2025
+/FY 2024
Drug Resources by Budget Decision Unit and Function:
Health Center Program
Prevention
$53.200
$123.200
$123.200
---
Treatment: Recovery
$478.800
$1,108.800
$1,108.800
---
Total, Health Center Program
$532.000
$1,232.000
$1,232.000
---
$105.000
$105.000
$105.000
---
$105.000
$105.000
$105.000
---
National Health Service Corps SUD Workforce Program
Treatment: Recovery
Total, National Health Service Corps SUD Workforce Program
Addiction Medicine Fellowship Program
Treatment: Recovery
Total, Addiction Medicine Fellowship Program
$25.000
$25.000
$25.000
---
$25.000
$25.000
$25.000
---
SUD Treatment and Recovery Loan Repayment Program
Treatment: Recovery
$40.000
$40.000
$40.000
---
$40.000
$40.000
$40.000
---
Prevention
$88.000
$69.400
$75.400
+$6.000
Treatment: Recovery
$57.000
$75.600
$69.600
-$6.000
Total, Rural Communities Opioid Response Program
$145.000
$145.000
$145.000
---
Total Funding
$847.000
$1,547.000
$1,547.000
---
HIDTA Transfer
---
---
---
---
ICDE Resources
---
---
---
---
---
---
---
---
Total Agency Budget (in billions)
$14.3
$16.1
$16.3
+$0.2
Drug Resources Percentage
5.9%
9.6%
9.5%
-0.1%
Total, SUD Treatment and Recovery Loan Repayment Program
Rural Communities Opioid Response Program
Drug Resources Personnel Summary
Total FTEs (direct only)
Drug Resources as a Percent of the Budget
403
404.
METHODOLOGYHealth Center Program
For each of Fiscal Years (FYs) 2016-2019, HRSA provided new annual ongoing grant funding
supporting substance use disorder (SUD)/mental health (MH) service expansion in health centers
totaling $545 million projected to remain in Health Center Program base continuation funding in
future fiscal years.
Subsequently in FY 2020, HRSA found that 36 health centers were unable to demonstrate
sufficient progress to merit continuing their AIMS awards, resulting in a $2 million total
reduction in drug control funding. For FY 2021, HRSA found that 63 health centers were unable
to demonstrate sufficient progress to merit continuing their SUD/MH awards, resulting in a $3
million total reduction in drug control funding. Additionally, since the initial targeted awards
were made, the total ongoing annual amount provided to sustain health centers’ efforts supported
by the initial targeted awards has decreased by an estimated $8 million. The remaining estimate
of $532 million in ongoing supplemental SUD/MH funding initiated in prior fiscal years and
incorporated in annual health center continuation awards is scored as drug control funding. The
FY 2024 level includes an additional $700 million in proposed mandatory SUD/MH funding for
health centers. The FY 2025 President’s Budget maintains the proposed 2024 SUD/MH funding
for health centers.
National Health Service Corps (NHSC) SUD Workforce Loan Repayment Program
Funds are used to provide loan repayment assistance to reduce the educational financial debt of
qualified SUD treatment providers in exchange for service at SUD treatment facilities in
underserved areas. Funds reflect the portion of NHSC discretionary budget requests dedicated to
the SUD Workforce Loan Repayment Program. As these funds support providers of SUD
treatment services, 100 percent of the amount is scored as treatment funding.
Addiction Medicine Fellowship (AMF) Program
Funds are used to support the clinical training of addiction medicine or addiction psychiatry
physicians in underserved, community-based settings. Funds reflect the portion of Behavioral
Health Workforce budget line requests dedicated to the AMF Program. As these funds support
providers of SUD treatment services, 100 percent of the amount is scored as treatment funding.
Substance Use Disorder Treatment and Recovery (STAR) Loan Repayment Program (LRP)
Funds are used to provide loan repayment assistance to reduce the educational financial debt of
qualified SUD treatment providers in exchange for service at SUD treatment facilities in
underserved areas. Funds reflect the portion of Behavioral Health Workforce budget line
requests dedicated to the STAR Loan Repayment Program. As these funds support providers of
SUD treatment services, 100 percent of the amount is scored as treatment funding.
404
405.
Rural Communities Opioid Response Program (RCORP)The allocation of funds for RCORP is through competitive grants and cooperative agreements.
The entirety of these programs is scored as drug control funding.
The prevention-treatment split for FY 2023 reflects the enacted budget level. The FY 2024
prevention-treatment split reflects the Continuing Resolution, which is level with the FY 2023
enacted level. The FY 2025 prevention-treatment split reflects the President’s Budget, which is
level with the FY 2024 Continuing Resolution.
BUDGET SUMMARY
The drug control budget for the Health Resources and Services Administration is $1.5 billion at
the FY 2025 President’s Budget request, level with the FY 2024 Continuing Resolution.
Health Center Program
FY 2025 President’s Budget request: $1.2 billion (level with the FY 2024 Continuing
Resolution)
In FY 2025, the Health Center Program plans to support over 1,400 grantees and provide
primary health care services to 37.4 million patients at the President’s Budget Level. HRSA will
require the provision of mental health and substance use disorder services including provision of
MAT in all HRSA-funded health centers.
The FY 2020 through FY 2023 Health Center Program enacted levels include $532 million in
ongoing SUD/MH targeted funding in health center continuation awards. The reported amount
of estimated drug resources for FY 2022 and FY 2023, and those projected for FY 2024, reflect
the ongoing annual SUD/MH awards initiated in prior fiscal years. The total drug resource
budget projections for FY 2024 include the ongoing annual SUD/MH amount of $532 million
plus the additional $700 million in proposed mandatory funding included in the FY 2024 level.
The FY 2025 President’s Budget level maintains the FY 2024 level of SUD/MH funding for
health centers.
National Health Service Corps SUD Workforce Loan Repayment Program
FY 2025 President’s Budget request: $105 million (level with the FY 2024 Continuing
Resolution)
Funding has been appropriated to the NHSC for the express purpose of expanding and improving
access to quality SUD treatment in rural and underserved areas nationwide. This funding is
dedicated to expanding the availability of SUD treatment providers to include the SUD
workforce and categories for outpatient services, including Opioid Treatment Programs, Officebased Opioid Treatment Facilities, and Non-opioid Outpatient SUD Treatment Facilities. The
funding supports the recruitment and retention of health professionals needed in underserved
areas to provide evidence-based SUD treatment and prevent overdose deaths. Providers receive
405
406.
loan repayment assistance to reduce their educational financial debt in exchange for service atSUD treatment facilities.
In FY 2025, HRSA will make approximately 1,150 new awards to clinicians who are combating
SUD in rural and underserved communities.
Addiction Medicine Fellowship Program
FY 2025 President’s Budget request: $25 million (level with the FY 2024 Continuing
Resolution)
The AMF Program seeks to increase the number of board-certified addiction medicine and
addiction psychiatry specialist physicians trained in providing interprofessional behavioral health
services, including SUD prevention, treatment, and recovery services, in underserved,
community-based settings. The AMF Program is designed to foster robust community-based
clinical training of addiction medicine and addiction psychiatry physicians in underserved,
community-based settings who see patients at various access points of care and provide addiction
prevention, treatment, and recovery services across healthcare sectors. In FY 2025, funding will
support a new competition for the AMF Program.
Substance Use Disorder Treatment and Recovery Loan Repayment Program
FY 2025 President’s Budget request: $40 million (level with the FY 2024 Continuing
Resolution)
The STAR LRP provides for the repayment of educational loans for individuals working in a
full-time SUD treatment job that involves direct patient care in either a Mental Health or Health
Professional Shortage Area (HPSA) or a county where the mean drug overdose death rate
exceeds the national average. The STAR LRP complements the NHSC SUD Workforce LRP, as
the STAR LRP is able to award loan repayment to more provider types and at a broader range of
site types than those that are eligible for the NHSC SUD Workforce LRP. In FY 2025, HRSA
will make approximately 295 new awards to eligible providers.
Rural Communities Opioid Response Program
FY 2025 President’s Budget request: $145 million (level with the FY 2024 Continuing
Resolution)
The RCORP initiative aims to reduce the morbidity and mortality associated with SUD,
including opioid use disorder (OUD), in high need rural communities by establishing, expanding,
and sustaining prevention, treatment, and recovery services at the county, state, and/or regional
levels. Since RCORP’s inception in FY 2018, the program has invested over $650 million in
grants and technical assistance to rural communities serving more than 1,900 counties across 47
states and two territories. The most recent full-year of performance measurement data collection
shows that a cohort of FY 2022 RCORP grantees provided direct SUD/OUD prevention,
406
407.
treatment, and recovery services to more than 2.1 million rural residents, and ensured that112,373 rural residents received medication assisted treatment (MAT) services.
In FY 2025, HRSA will support the following continuing grant and cooperative agreement
programs through RCORP:
RCORP-Overdose Response will provide funding to rural communities to meet their
immediate needs related to the overdose crisis. HRSA will support new awards in FY
2025.
RCORP-Impact provides funding to rural organizations improve access to integrated
and coordinated opioid use disorder prevention, treatment, harm reduction, and recovery
services, to reduce morbidity and mortality from opioid use disorder and promote longterm, sustained recovery. In FY 2025, HRSA will support the continuation of grants
awarded in FY 2024.
RCORP-Psychostimulant Support provides support to rural communities to strengthen
prevention, treatment, and recovery services for individuals who misuse
psychostimulants. HRSA will support new awards in FY 2025.
RCORP-Neonatal Abstinence Syndrome provides support to reduce the incidence and
impact of neonatal abstinence syndrome in rural communities by improving systems of
care, family supports, and social determinants of health. In FY 2025, HRSA will support
the continuation of grants awarded in FY 2023.
RCORP-Child and Adolescent Behavioral Health strengthens and expands behavioral
health care services across the prevention, treatment, and recovery continuum for rural
children and adolescents aged 5-17 years. In FY 2025, HRSA will support the
continuation of grants awarded in FY 2023.
RCORP-Behavioral Health Care Support provides support to rural communities to
respond to new and ongoing behavioral health needs of rural residents at risk for, or
diagnosed with, SUD/OUD and/or co-occurring disorders. The program focuses on
building the infrastructural capacity of rural communities to deliver behavioral health,
including SUD/OUD, services across the continuum; enhancing care coordination to
provide effective care; and addressing social determinants of health to promote health
equity. In FY 2025, HRSA will support the continuation of grants awarded in FY 2022.
RCORP-Medication Assisted Treatment Access provides support to establish new
MAT access points and increase the capacity for sustainable MAT service provision in
rural areas that do not currently have access to MAT for SUD/OUD. In FY 2025, HRSA
will support the continuation of grants awarded in FY 2023.
407
408.
RCORP-Rural Centers of Excellence on Substance Use Disorders support the
dissemination of best practices related to the treatment for and prevention of substance
use disorders within rural communities, with a focus on the current opioid crisis. In
FY 2025, HRSA will support the continuation of these cooperative agreements.
RCORP-Technical Assistance and Evaluation provide technical assistance and
evaluation support encompassing the entire RCORP initiative. HRSA will support the
continuation of funding for each of the initiative-wide technical assistance and evaluation
cooperative agreements in FY 2025.
HRSA will continue to solicit feedback from rural stakeholders and engage and partner with
other Federal agencies to promote a coordinated approach to combatting this devastating
epidemic and ensure HRSA’s efforts are aligned with the HHS Overdose Prevention Strategy
and other Administration priorities.
EQUITY
Health Center Program
The health center model of care uniquely positions health centers to address health disparities
and advance health equity. As community-based and patient-directed organizations, health
centers ensure access to affordable, quality, and cost-effective primary health care to the nation’s
underserved and most socially vulnerable populations. Nearly 1,400 HRSA-funded health
centers operate nearly 15,000, providing comprehensive primary and preventive care on a sliding
fee scale to over 30 million patients annually. Approximately 90% of health center patients are
individuals or families living at or below 200% of the Federal Poverty Guidelines and
approximately 63% of health center patients are racial/ethnic minorities. Health centers also
serve over 1 million agricultural workers, about 1.3 million individuals experiencing
homelessness, and approximately 5.7 million individuals living in or near public housing. In
addition to ensuring access to primary and preventive care, health centers’ model of care
includes the provision of non-clinical enabling services, including translation, transportation,
outreach and education, care coordination, and eligibility assistance, that recognize and help to
address the social and environmental barriers to health and to health care experienced by their
patients.
National Health Service Corps SUD Workforce Loan Repayment Program
The NHSC SUD Workforce LRP has worked to increase access to evidence-based SUD
treatment to communities in need. Providers recognized through this program are dedicated to
caring for underserved communities in urban, rural, and tribal areas. Each NHSC clinician
serves patients in Health Professional Shortage Areas (HPSA) – communities with limited access
to health care. In addition, NHSC SUD Workforce LRP clinicians work at NHSC-approved SUD
treatment facilities that have implemented a Sliding Fee Discount Program that enables the sites
to offer services to patients regardless of their ability to pay.
408
409.
Addiction Medicine Fellowship ProgramThe AMF Program aims to address equity by improving underserved communities’ access to
evidence-based substance use prevention and treatment services. The Program does so by
connecting skilled addiction treatment professionals to areas of greatest need. Awardees
collaborate and establish relationships with underserved, community-based settings. Within these
settings, the addiction medicine/addiction psychiatry fellows complete clinical rotations in which
they provide substance use screening, diagnosis, and treatment services with the goal of
increasing their practice knowledge and skills as well as their ability to provide culturally
competent care. Fellows may also complete a clinical rotation at a community-based setting that
specializes in the treatment of infants, children, adolescents, or pregnant or postpartum women
where they develop skills and knowledge specific to the needs of these populations.
Substance Use Disorder Treatment and Recovery Loan Repayment Program
The STAR LRP aims to improve equity by reducing the barriers to accessing SUD treatment,
including opioid treatment and recovery services. The workforce supported through this
program works in both Mental Health and Health Professional Shortage Areas (HPSA) and areas
where the mean drug overdose mortality rates are above the national average. The STAR LRP
also recognizes behavioral health paraprofessionals as eligible provider types, and new
community-based settings (e.g., faith-based settings, crisis management centers, etc.) as eligible
access points for treatment or recovery services.
Rural Communities Opioid Response Program
RCORP addresses the disproportionate challenges rural communities face in accessing
behavioral health care services, which include limited workforce, transportation barriers, and
stigma, through community-based grants and technical assistance. RCORP funding also targets
behavioral health care disparities within rural communities. For example, applicants to RCORP
programs are encouraged to include populations that have historically suffered from poorer
health outcomes, health disparities, and other inequities as compared to the rest of the
population. Examples of these populations include, but are not limited to: racial and ethnic
minorities, people who are pregnant, adolescents and youth, LGBTQ+ individuals, veterans,
socioeconomically disadvantaged populations, the elderly, individuals with disabilities, etc.
Since FY 2021, RCORP recipients have been required to produce a Disparities Impact Statement
during the course of their grant to enable them to monitor and assess the impact their programs
have on vulnerable populations within their service areas. In accordance with Executive Order
13985, RCORP programs will continue to emphasize consistent and systematic fair, just, and
impartial treatment of all individuals, including individuals who belong to underserved
communities that have been denied such treatment.
409
410.
LEGISLATIVEPROPSALS
TAB
410
411.
LEGISLATIVE PROPOSALSFY 2025 A-19 Proposal Summaries
Mandatory A-19s
Extend Authorization and Appropriation of Funding and Add Authority to Create a
Technical Assistance Center to the Family-to-Family Health Information Centers
Program
HRSA is requesting a 5-year extension of mandatory funding for the Family-to-Family Health
Information Centers (F2F HIC) Program, which expires at the end of FY 2024. The proposal
would provide for increased mandatory funding of $12 million per year, an increase of $6
million per year above the current authorized level, in FY 2025 through FY 2029 for a total of
$60 million over five years. Increased funding will allow F2F HIC awardees to serve more
families of children and youth with special health care needs (CYSHCN) and expand the
capacity of F2F HICs to partner and engage with families, providers, and other community and
state stakeholders to ensure a thriving system of care for CYSHCN. To support this expanded
work, the proposal also requests a technical change that would provide specific statutory
authority to create a new technical assistance center to coordinate and provide intensive technical
assistance to grantees of the F2F HIC Program. The technical assistance center would help F2F
HICs, including the newly established territorial and tribal HICs, receive the support necessary to
fulfill their statutory requirements and collect data to evaluate the reach of the program. The
reauthorization and increased funding are vital to advance health equity for CYSHCN and
improve health outcomes of CYSHCN.
Joint Summary: Reauthorization of Mandatory Appropriations for the Community Health
Center Fund & Requiring Health Centers to Provide Behavioral Health Services
HRSA is requesting a 3-year extension of mandatory funding of the Community Health
Center Fund for the Health Center Program, which expired at the end of FY 2023165, and
to make behavioral health services required primary care services of the Program. The
Health Center Program provides primary care services at over 14,000 service delivery
sites through nearly 1,400 health centers. Health centers operate in every U.S state, the
District of Columbia, Puerto Rico, the U.S. Virgin Islands, and the Pacific Basin. With
continued funding for the Community Health Center Fund, the Health Center Program
will further strengthen and expand this vital source of primary care for millions of
uninsured and medically underserved patients seeking a quality source of care.
Additionally, by adding behavioral health services as a required service, health centers
will be able to meet the growing demand for mental health and substance use disorder
services across the country.
165
P.L. 118-15, P.L.118-22, and P.L. 118-35 provided funding through March 8, 2024.
411
412.
Individual Summaries (if needed):
o Reauthorization of Mandatory Appropriations for the Community Health Center
Fund
HRSA is requesting a 3-year extension of mandatory funding of the Community Health
Center Fund for the Health Center Program, which expired at the end of FY 2023.29 The
Health Center Program provides primary care services at over 14,000 service delivery
sites through nearly 1,400 health centers. Health centers operate in every U.S state, the
District of Columbia, Puerto Rico, the U.S. Virgin Islands, and the Pacific Basin. With
continued funding for the Community Health Center Fund, the Health Center Program
will further strengthen and expand this vital source of primary care for millions of
uninsured and medically underserved patients seeking a quality source of care.
o Requiring Health Centers to Provide Behavioral Health Services
HRSA is seeking to add behavioral health services to the statutorily required primary
health services in the Health Center Program. Requiring health centers to provide mental
health and substance use disorder services will improve access to these services in the
most medically underserved communities, including rural communities, and will reduce
disparities and improve health outcomes.
o Reauthorization of Mandatory Appropriations for the National Health Service
Corps Fund
HRSA is requesting a 3-year extension of mandatory funding for the National Health Service
Corps (NHSC), which expired at the end of FY 2023.166 Since its inception in 1972, the NHSC
has worked to support qualified health care providers dedicated to working in underserved
communities. NHSC clinicians serve patients in Health Professional Shortage Areas
(communities with limited access to health care) in return for scholarships and loan repayment.
The proposed funding levels will maintain current investments and ensure that the NHSC
recruitment and retention programs continue to be a significant source of highly qualified
clinicians working in areas of greatest need across the country.
o Reauthorization of Mandatory Appropriations for the Teaching Health Center
Graduate Medical Education Program
HRSA is requesting a 3-year extension of mandatory funding for the Teaching Health Center
Graduate Medical Education Program (THCGME), which expired at the end of FY 2023.167
The program focuses on supporting residents in primary care, including obstetrics and
gynecology and psychiatry, and dental residency training programs to meet the medical and
mental health care needs of rural and underserved communities. Increased funding for THCGME
will maintain current residents’ investments and allow them to complete residency training and
graduate from their respective programs. In addition, HRSA is proposing removal of the
statutory annual cap on payments made through THCGME. Removing this limitation would
166 166
167 167
P.L. 118-15, P.L.118-22, and P.L. 118-35 provided funding through March 8, 2024.
P.L. 118-15, P.L.118-22, and P.L. 118-35 provided funding through March 8, 2024.
412
413.
enable HRSA to utilize all funds appropriated for THCGME (including those recouped afterreconciliation).
Discretionary A-19s
Expand National Health Service Corps Scholarship and Loan Repayment Eligibility to
Grow the Health Workforce
This proposal recommends expanding eligibility requirements for the National Health Service
Corps (NHSC) Scholarship and Loan Repayment Programs to include lawful U.S. permanent
residents. Current statutes limit eligibility for NHSC programs to U.S. citizens or nationals.
However, a significant subset of the immigrant health workforce in the United States consists of
lawful permanent residents, or “green card holders.” Lawful permanent residents are individuals
authorized to live and work in the United States on a permanent basis but who do not yet hold
U.S. citizenship, and therefore are not eligible for participation in the NHSC Scholarship or Loan
Repayment programs. Allowing qualified permanent residents to participate in NHSC will better
align HRSA’s health workforce training and service programs and ensure that the NHSC
recruitment and retention programs continue to include a significant source of highly qualified
clinicians.
Extend the Autism Education, Early Detection, and Intervention Program
HRSA is requesting a 5-year extension of the authorization for the Autism and Other
Developmental Disabilities programs, which sunsets at the end of FY 2024. Extending the
authority will allow the Autism and Other Developmental Disabilities Program to continue to
address the screening, diagnostic, and intervention needs of increasing numbers of individuals
with autism and other developmental disabilities through its training and research activities.
Reauthorization is vital to advance health equity and improve health outcomes of individuals
with autism and other developmental disabilities.
340B Drug Pricing Program Integrity: Establishment of Reporting Requirements and
Definitions for the Use of Savings and Contract Pharmacy Utilization
To enhance integrity in the 340B Program, HRSA is requesting regulatory authority to require
covered entities to report annually how the savings achieved through the Program benefit the
communities being served. The proposal also seeks to strengthen compliance and transparency
related to the utilization of contract pharmacies. Additionally, HRSA proposes explicit authority
to define necessary terms.
Extending Tax-Exempt Status to Specific Scholarship and Loan Repayment Programs
The Budget proposes extending the tax-exempt status that is provided to the National Health
Service Corps Program award recipients to HRSA’s similar health care workforce programs,
including the Nurse Corps Scholarship and Loan Repayment Programs, Native Hawaiian Health
Scholarship Program, the Faculty Loan Repayment Program, the Pediatric Specialty Loan
Repayment Program, and the Substance Use Disorder Treatment and Recovery Loan Repayment
413
414.
Program. The savings would allow HRSA to make additional awards through these programs togrow and expand the health workforce, including behavioral health providers.
414
415.
Vaccine InjuryCompensation
Program
TAB
415
416.
VACCINE INJURY COMPENSATION PROGRAMTable of Contents
FY 2025 Budget
Appropriation Language ............................................................................................................. 417
Amounts Available for Obligation.............................................................................................. 418
Budget Authority by Activity ..................................................................................................... 419
Budget Authority by Object ........................................................................................................ 419
Authorizing Legislation .............................................................................................................. 420
Appropriation History Table ....................................................................................................... 421
Vaccine Injury Compensation Program ...................................................................................... 422
416
417.
Appropriation LanguageVACCINE INJURY COMPENSATION PROGRAM TRUST FUND
For payments from the Vaccine Injury Compensation Program Trust Fund (the "Trust Fund"),
such sums as may be necessary for claims associated with vaccine-related injury or death with
respect to vaccines administered after September 30, 1988, pursuant to subtitle 2 of title XXI of
the PHS Act, to remain available until expended: Provided, That for necessary administrative
expenses, not to exceed $20,200,000 shall be available from the Trust Fund to the Secretary.
417
418.
Amounts Available for ObligationDiscretionary Appropriation:
Transfer to Other Accounts
Transfer from Other Accounts
Subtotal, adjusted Discretionary Appropriation
FY 2023
Final
$56,913,000
-$15,200,000
$15,200,000
$56,913,000
Mandatory Appropriation
Transfer to Other Accounts
Transfer from Other Accounts
Subtotal, adjusted Mandatory Appropriation
$174,926,000
-$174,926,000
$174,926,000
$174,926,000
Spending Auth Offsets
FY 2024
Continuing
Resolution
$57,933,000
FY 2025
President’s
Budget
$68,611,000
$57,933,000
$68,611,000
$261,497,000
$266,727,000
$261,497,000
$266,727,000
$57,933,000
$261,497,000
$319,430,000
$68,611,000
$266,727,000
$335,338,000
--
Administrative Expenses
Total HRSA Claims
Total New Obligations
$56,913,000
$174,926,000
$231,839,000
418
419.
Budget Authority by ActivityTrust Fund Obligations: Post-10/1/88
claims
Administrative Expenses: HRSA
Direct Operations
Total Obligations
FY 2023
Final
FY 2024
Continuing
Resolution
FY 2025
President’s
Budget
$174,926,000
$261,497,000
$266,727,000
$15,200,000
$15,200,000
$20,200,000
$190,126,000
$276,697,000
$286,927,000
FY 2025
President’s
Budget
$266,727,000
$20,200,000
$286,927,000
FY 2025 +/FY 2024
+$5,230,000
+$5,000,000
+$10,230,000
Budget Authority by Object
Insurance claims and indemnities
Salaries & Expenses/Other Services
Total
FY 2024
Continuing
Resolution
$261,497,000
$15,200,000
$276,697,000
419
420.
Authorizing Legislation(a) PHS Act,
Title XXI, Subtitle 2,
Parts A and D:
Pre-FY 1989 Claims
Post-FY 1989 Claims
(b) Sec. 6601 (r)d ORBA
of 1989 (P.L. 101-239):
HRSA Operations
FY 2023
Final
FY 2024
Continuing
Resolution
FY 2025
President’s
Budget
--$174,926,000
--$261,497,000
--$266,727,000
$15,200,000
$15,200,000
$20,200,000
420
421.
Appropriation History Table(Pre-1988 Claims Appropriation)
Budget
Estimate
to Congress
House
Allowance
Senate
Allowance
Appropriation
1996
110,000,000
110,000,000
110,000,000
110,000,000
1997
1998
1999
110,000,000
-----
110,000,000
-----
110,000,000
--100,000,000
110,000,000
--100,000,000
2000
---
---
---
---
2001
2002
2003
-------
-------
-------
-------
2004
---
---
---
---
2005
2006
2007
-------
-------
-------
-------
2008
---
---
---
---
2009
2010
2011
-------
-------
-------
-------
2012
---------
---------
---------
---------
2018
-------
-------
-------
-------
2019
---
---
---
---
2020
---
---
---
---
2021
---
---
---
---
2022
---
---
---
---
2023
---
---
---
---
2024
---
---
---
---
2025
---
---
---
---
2013
2014
2015
2016
2017
421
422.
Vaccine Injury Compensation ProgramFY 2023
Final
FY 2024
Continuing
Resolution
FY 2025
President’s
Budget
FY 2025
+/FY 2023
Claims BA
$174,926,000
$261,497,000
$266,727,000
+$91,801,000
Admin BA
$15,200,000
$15,200,000
$20,200,000
+$5,000,000
Total
$190,126,000
$276,697,000
$286,927,000
+$96,801,000
FTE
23
23
28
+5
Authorizing Legislation – Public Health Service Act, Title XXI, Subtitle 2, Parts A and D,
Sections 2110-19 and 2131-34, as amended by Public Law 114-255, Section 3093(c).
FY 2025 Authorization………………………………………………………...Indefinite
Allocation Method………………………………………………………………….Other
Program Description
Serving as an alternative to the traditional tort system, the National Vaccine Injury
Compensation Program (VICP) compensates individuals or families of individuals who have
been injured by vaccines recommended by the Centers for Disease Control and Prevention
(CDC) for routine administration to children or individuals who are pregnant. HRSA
administers the VICP, and the Department of Justice (DOJ) represents HHS in the U.S. Court of
Federal Claims (Court), which ultimately decides to provide compensation or dismiss claims.
HRSA receives claims requesting compensation for vaccine injuries or deaths, which the
petitioner has served against the HHS Secretary and filed with the Court. Petitioners include
individuals, parents, or legal representatives/estates applying on behalf of others. HRSA
providers with special expertise in pediatric and adult medicine review these claims, including
supporting documentation. HRSA also contracts with health care professionals for claim
reviews and other medical specialists to provide independent claim reviews and testify in
Court. HRSA medical officers develop preliminary recommendations regarding petitioner
eligibility for compensation, and DOJ incorporates these recommendations in Rule 4(b) reports
submitted to the Court. Lastly, HRSA processes payments to petitioners and their attorneys
based on judgments entered by the Court.
HRSA also publishes notices in the Federal Register listing each claim received and promulgates
regulations to modify the Vaccine Injury Table that lists injuries and/or conditions associated
with covered vaccines. HRSA provides administrative support to the Advisory Commission on
Childhood Vaccines (ACCV), which is responsible for advising the HHS Secretary on issues
related to VICP operations. The ACCV has nine voting members, including health care
professionals, attorneys, parents, or legal representatives of children who have suffered vaccinerelated injuries or death, and non-voting HHS officials.
422
423.
Vaccine Injury Compensation Trust FundCongress annually appropriates funding from the Vaccine Injury Compensation Trust Fund
(Trust Fund) for VICP administration and compensation for vaccine-related injuries or death
claims for covered vaccines administered on or after October 1, 1988. As of September 30,
2023, the Trust Fund has a balance of over $4 billion. The Department of Treasury maintains the
Trust Fund through a $0.75 excise tax on vaccines recommended by the CDC for routine
administration to children or individuals who are pregnant. The excise tax applies to each
disease prevented per vaccine dose. For example, the influenza vaccine is taxed at $0.75 because
it prevents one disease, while the measles-mumps-rubella vaccine, which prevents three diseases,
is taxed at $2.25. The Department of Treasury collects the excise taxes and manages Trust Fund
investments.
VICP Administration
VICP claims have increased from 633 claims filed in FY 2014 to 2,057 claims filed in FY 2022
and 1,167 claims filed in FY 2023. HRSA began experiencing a backlog of vaccine injury claims
awaiting medical review since the volume of claims exceeded the resources available to conduct
timely medical reviews. The cumulative claims backlog was 966 claims at the end of FY 2020
and 1,106 by the end of FY 2022 resulting in a 9 – 12 month backlog for VICP medical review.
Due to increased administrative funding in FY 2022 and FY 2023, the VICP contracted with
companies and medical reviewers to reduce the backlog. At the end of FY 2023, VICP
successfully reduced the backlog to 163 claims and wait times for medical review to four (4)
months. Continued funding is needed to ensure prompt review of medical claims and eliminate
the medical review backlog.
Table 1. 10-Year Trend in Number of Claims Filed and Administrative Costs
(dollars in millions)
Number of
Administrative
Fiscal Year
Claims Filed
Funding
2014
633
$6.50
2015
803
$7.50
2016
1,120
$7.50
2017
1,243
$7.75
2018
1,238
$9.20
2019
1,282
$9.20
2020
1,192
$10.20
1
2021
2,057
$11.20
2022
1,029
$13.20
2
2023
1,167
$15.20
1/Significant influx of 800 claims in January 2021 due to the expected implementation of the final rule proposed to remove Shoulder Injury
Related to Vaccine Administration (SIRVA) from the Vaccine Injury Table.
2/Estimate of 2023 number of claims (as of July 31, 2023)
423
424.
Budget RequestVICP Claims Compensation
The FY 2025 Budget Request for the National Vaccine Injury Compensation Program of $266.7
million is $91.8 million above the FY 2023 Final level. This request will provide the funds
necessary to compensate petitioners and pay their attorneys’ fees and costs.
VICP Administration
The FY 2025 Budget Request for the National Vaccine Injury Compensation Program of $20.2
million is $5 million above the FY 2023 Final level. This request will support administrative
expenses necessary to continue the prompt review of claims, to prevent a future backlog of
claims awaiting medical review, and to process expected incoming claims in FY 2025. This
request will also support timely claims adjudication by providing funding for medical review
staff, contractors to conduct timely medical reviews, medical experts for reviews, and expert
testimony given during Court proceedings. Continued funding is needed to safeguard the timely
review of claims and ensure scalability of the VICP due to the variability of claims filed. Over
the past two FYs, the CDC has included new vaccines in the Child and Adolescent Immunization
Schedule, recommending these vaccines for routine use in children and/or individuals who are
pregnant. Additional action would be required to enact VICP coverage of these vaccines This
request will support any VICP expansion, including supporting Federal rulemaking efforts to
amend the Vaccine Injury Table, as necessary. Finally, this request will support information
technology infrastructure, communication to stakeholders for any additions in VICP coverage,
operations, and maintenance for the newly implemented claims management system, and cover
costs associated with the claims award process, follow-up performance reviews, and other
program support costs.
Five Year Funding History - VICP Claims
Fiscal Year
FY 2021
FY 2022
FY 2023
FY 2024 CR
FY 2025 President’s Budget
Amount
$246,414,977
$316,778,000
$256,370,000
$261,497,000
$266,727,000
424
425.
Five Year Funding History - VICP AdminFiscal Year
FY 2021
FY 2022
FY 2023
FY 2024 CR
FY 2025 President’s Budget
Amount
$11,200,000
$13,200,000
$15,200,000
$15,200,000
$20,200,000
Program Accomplishments
Table 2 shows the number of petitioners awarded compensation and vaccine injury compensation
provided over the last five years.
Table 2. Growth in Families and Individuals Receiving Compensation
Fiscal Year
2019
2020
2021
2022
2023
No. of
Petitioners
653
733
719
927
885
Compensation
($ in millions)
$226
$218
$245
$230
$174
Outputs and Outcomes Tables
Measure
9000.03 Average
time that lump sum
only awards are paid
from the receipt of
all required
documentation to
make a payment.
(Efficiency)
Year and Most
Recent Result/
Target for Recent
Result
(Summary of
Result)
FY 2023: 1.5 days
Target: 3 days
FY 2024
Target
4 days
(Target Exceeded)
425
FY 2025
Target
3 days
FY 2025
Target
+/FY 2024
Target
-1 day
426.
Measure9000.07 Percentage
of medical reports
that are completed
within 90 days of the
date the claim is
assigned to a
medical reviewer
(Efficiency)
9000.08 Percentage
of filed claims
assigned for medical
review within 9
months of the date
the claim is
activated by the
Court (Efficiency)
9000.01 Percentage
of cases in which
judgment awarding
compensation is
rejected and an
election to pursue a
civil action is filed.
(Outcome)
9000.02 Average
time settlements are
approved from the
date of receipt of the
DOJ settlement
proposal.
(Outcome)
Year and Most
Recent Result/
Target for Recent
Result
(Summary of
Result)
FY 2023: 94%
Target: 80%
FY 2025
Target
+/FY 2024
Target
+1
percentage
point
FY 2024
Target
93%
FY 2025
Target
94%
75%
80%
+5
percentage
points
Discontinued
Discontinued
N/A
Discontinued
Discontinued
N/A
(Target Exceeded)
FY 2023: 92%
Target: 75%
(Baseline)
FY 2023: 0%
Target: 0%
(Target Met)
FY 2023: 1 days
Target: 5 days
(Target Exceeded)
426
427.
Measure9000.04 Percentage
of cases in which
court-ordered
annuities are funded
within the carrier's
established
underwriting
deadline. (Outcome)
9000.05 Percentage
of medical reports
that are completed
within 90 days of
receipt of any
medical records.
(Outcome and
Developmental)
9000.06 Percentage
of FY 2017 and
subsequently filed
claims with any
medical records
assigned for medical
review within 4
months of receipt
from the Court.
(Outcome)
Year and Most
Recent Result/
Target for Recent
Result
(Summary of
Result)
FY 2023: 100%
Target: 99%
FY 2024
Target
Discontinued
FY 2025
Target
Discontinued
FY 2025
Target
+/FY 2024
Target
N/A
Discontinued
Discontinued
N/A
Discontinued
Discontinued
N/A
(Target Exceeded)
FY 2023: 94%
Target: 80%
(Target Exceeded)
FY 2023: 62%
Target: 65%
(Target Not Met)
Performance Narrative
VICP has three performance measures (9000.03, 9000.07, and 9000.08) to better reflect HRSA’s
two roles in administering the VICP. HRSA conducts the medical review of VICP claims and
makes Court-ordered payments to VICP claimants. In FY 2023, VICP set a performance
measure (9000.03) of paying lump sum payments within three days of receiving all
documentation to issue a payment. In FY 2025, VICP is aligning its target to issue lump sum
payments with a prior performance of three days or less. Additionally, based on FY 2022
performance indicators, VICP established a performance measure (9000.07) of completing 80%
of medical reports within 90 days of assignment. In FY 2023, VICP exceeded this target and has
accordingly increased its performance goals by 1 percentage point. Finally, in FY 2023, VICP
427
428.
established a performance measure (9000.08) of assigning 75% of medical reviews within ninemonths of activation, based on its performance in FY 2022 of assigning 74% of claims within
nine months of activation from the Court. VICP exceeded this target by assigning 92% of these
cases within nine months of activation, and as such, is increasing its target by 5 percentage
points. These measures capture the efficiency of conducting medical reviews and making
payments.
428
429.
CountermeasuresInjury Compensation
TAB
429
430.
COUNTERMEASURES INJURY COMPENSATION PROGRAMTable of Contents
FY 2025 Budget
Appropriations Language............................................................................................................ 431
Amounts Available for Obligation.............................................................................................. 431
Budget Authority by Activity ..................................................................................................... 432
Authorizing Legislation .............................................................................................................. 432
Countermeasures Injury Compensation Program ....................................................................... 433
430
431.
Appropriations LanguageCOVERED COUNTERMEASURE PROCESS FUND
For carrying out section 319F-4 of the PHS Act, $10,000,000 to remain available until
expended.
Amounts Available for Obligation
FY 2023
Final
FY 2024
Continuing
Resolution
FY 2025
President’s
Budget
Discretionary Appropriation:
Direct Appropriation
$7,000,000
$7,000,000
$10,000,000
Unobligated Balance:
Unobligated Balance, start of year
Unobligated Balance, Transfer from Other Accounts
Subtotal, Unobligated Balance
$8,742,652
$7,370,000
$16,112,652
$2,125,266
$7,000,000
$9,125,266
-------
Administrative Expenses
Compensation Funding
Total New Obligations
$14,605,286
$1,507,366
$16,112,652
$8,383,008
$742,258
$9,125,266
$9,000,000
$1,000,000
$10,000,000
431
432.
Budget Authority by ActivityFY 2024
Continuing
Resolution
$7,000,000
FY 2023
Final
$7,000,000
Countermeasures Injury Compensation Program168
FY 2025
President’s
Budget
$10,000,000
Authorizing Legislation
FY 2024
Amount
Authorized
Countermeasures Injury
Compensation Program: PHS
Act, Sections 319F-3 and
319F-4, as added by P.L. 109148, as amended by P.L. 113-5
(to Section 319F-3)
FY 2024
Amount
Appropriated
Not Specified
$7,000,000
168
FY 2025
Amount
Authorized
Not Specified
FY 2025
Amount
Appropriated
$10,000,000
Since October 2009, CICP has received funding from the Public Health and Social Services Emergency Fund
(PHSSEF).
432
433.
Countermeasures Injury Compensation ProgramFY 2024
Continuing
Resolution
FY 2023
Final
FY 2025
President’s
Budget
FY 2025
+/FY 2023
BA
$7,000,000
$7,000,000
$10,000,000
+$3,000,000
FTE
37
37
42
+5
Authorizing Legislation: Public Health Service Act, Sections 319F-3 and 319F-4, as amended
by Public Law 116-136.
FY 2025 Authorization…………………………………………………… Indefinite
Allocation Method…………………………………………………………. Other
Program Description
The Countermeasures Injury Compensation Program (CICP) provides benefits for serious
injuries or deaths determined to be directly caused by the administration or use of covered
countermeasures. A countermeasure is a vaccination, medication, device, or other item
recommended to diagnose, prevent, or treat a declared pandemic, epidemic, or security threat.
The Public Readiness and Emergency Preparedness Act (PREP Act) authorizes the CICP to
provide medical and lost employment income benefits to certain individuals or estates of
individuals who sustain covered serious physical injuries as the direct result of the administration
or use of covered countermeasures. The CICP also provides death benefits to certain survivors
of eligible deceased injured countermeasure recipients. The PREP Act declarations identify the
countermeasures covered by CICP.
Prior to 2020, the CICP received fewer than 500 claims since it began processing claims in 2010.
However, on February 4, 2020, as the global Coronavirus Disease 2019 (COVID-19) pandemic
developed, the Secretary of HHS issued a PREP Act declaration for medical countermeasures
against COVID-19. Following the issuance of the PREP Act declaration, eligible individuals
could submit a Request for Benefits Form (RFB) alleging injuries from COVID-19
countermeasures, including COVID-19 vaccines. As a result, the CICP saw a significant
caseload increase of nearly 12,700 cases, as of December 1, 2023, that has presented significant
logistical, staffing, and budgetary challenges for the Program.
Budget Request
The FY 2025 Budget Request for the Countermeasures Injury Compensation Program of $10
million is $3 million above the FY 2023 Final level. This request for funding will be used to
provide compensation to eligible individuals and achieve a timely review of countermeasure
injury claims in FY 2025. The request will also be used to enhance the CICP information
technology (IT) infrastructure to improve efficiency and streamline operations, to increase
433
434.
business process efficiencies that will optimize programmatic workflows, improvecommunication with requesters ensuring effective and timely interactions, leverage contracts to
review and fully process at least 2,500 claims in FY 2025, and support the independent process
of reconvening reconsideration panels.
Funding History
Fiscal Year
FY 2021
FY 2022
FY 2023
FY 2024 CR
FY 2025 President’s Budget
Amount
--$5,000,000
$7,000,000
$7,000,000
$10,000,000
Program Accomplishments
During the ten years prior to the COVID-19 pandemic, the CICP received and closed
approximately 500 claims in total. As of December 1, 2023, nearly 12,700 claims alleging
injuries/deaths from COVID-19 countermeasures have been filed with the CICP, including 9,621
claims alleging injuries from COVID-19 vaccines. With current resources, CICP staff and
federal contractors have made 1,837 determinations for COVID-19 claims as of December 1,
2023.
Other CICP accomplishments in FY 2023 include:
Expanded medical review capacity by hiring additional medical reviewers as well as
contracting for medical review services which have significantly increased the number of
claims reviewed;
Secured program management and business process improvement expertise to improve
claims processing workflows and processes;
Developed and launched a new feature in the CICP document submission portal that
allows claimants to check the status of their claims online, even if they submitted claims
by physical mail.
Launched a chat function on its website to assist requesters and the public with
information about the CICP and the claim review process.
Initiated efforts to modernize the program’s legacy information system to improve claims
processing and communication with requesters; and
Built staffing/contractor capacity to support the reconsideration process.
434
435.
Outputs and Outcomes TablesMeasure
Year and Most Recent
Result /
FY 2024
Target
FY 2025
Target
FY 2025
+/FY 2024
Not
Defined
80%
N/A
Target for Recent
Result
(Summary of Result)
(Summary of Result)
9010.01 Percentage
of compensable
claims that are paid
within 180 days of
confirming receipt
of required
documentation.
(Efficiency)
FY 2023:100%
Target: Not defined
(Historical Actual)
Performance Narrative
In FY 2025, the CICP is adding a new performance measure. CICP conducts the medical review
of CICP claims. Once deemed eligible for compensation, CICP requests additional
documentation to determine eligible expenses to be compensated. Determination of benefits is
an iterative process, requiring an exchange of information between CICP and the requester to
determine the amount and type of compensation to which a requester is entitled. CICP has
received over 12,700 requests for benefits and is working to process the significant caseload for
both claims filed and claims eligible for compensable benefits. This measure captures the
efficiency of claims compensated once all required documentation has been received to process
payment.
435
436.
NonrecurringExpenses Fund
TAB
436
437.
Nonrecurring Expenses FundBudget Summary
(Dollars in Thousands)
Notification1
FY 20232
FY 20243
FY 20254
$41,940
$49,490
$93,414
Authorizing Legislation:
Authorization………….Section 223 of Division G of the Consolidated Appropriations Act, 2008
Allocation Method…………………………………………..Direct Federal, Competitive Contract
Program Description and Accomplishments
The Nonrecurring Expenses Fund (NEF) permits HHS to transfer unobligated balances of
expired discretionary funds from FY 2008 and subsequent years into the NEF account. Congress
authorized use of the funds for capital acquisitions necessary for the operation of the
Department, specifically information technology (IT) and facilities infrastructure acquisitions.
NEF resources have allowed HRSA to make critical capital investments in information
technology that modernize and secure HRSA’s systems and improve the effectiveness of agency
operations and the utilization of data across HRSA. Since FY 2016, HRSA has requested
$214.65 million from the NEF and received $141.59 million.
Budget Allocation FY 2025
In FY 2025 HRSA has seven NEF projects planned:
BHW Management Information System Solution (BMISS) Mobile Application: HRSA
plans to create a mobile application for clinicians applying to the National Health Service
Corps, Nurse Corps and Substance Use Disorder Treatment and Recovery loan
repayment and scholarship programs. This application would allow prospective
participants as well as participants in the field to communicate easily, more efficiently
access program data, services and ensure they stay in close communication with
programs to ensure compliance.
Rural Safety Net Provider Data Solution: HRSA will create a single-entry point to access
consolidated data internal and external to HHS related to rural healthcare safety net
providers – specifically Critical Access Hospitals (CAHs) and CMS-certified Rural
Health Clinics (RHCs). This data will help inform efforts to further expand access to
care, address health disparities, and make decisions about programs and initiatives
relevant to CAHs and RHCs.
Injury Compensation System Intelligent Document Processing: HRSA will implement a
437
438.
cloud-based service (Saas) platform that will support the Injury Compensation SystemCloud Solution and shorten medical review times by using intelligent document
processing (IDP). This investment is expected to significantly reduce the time required to
manually review and summarize medical records.
Next Gen Organ Procurement and Transplantation Network: HRSA plans to develop a
government owned technology solution to fully modernize the OPTN and improve its
ability to serve the needs of patients and families. This investment will support the
development of the Next Gen OPTN using a human-centered design (HCD) approach and
adoption of best-in-class technology.
HRSA Data Warehouse Web Systems and Data System Modernization: HRSA will
enhance the Data Lakehouse by adding tools for data governance, data cataloging, data
testing and validation of open Data APIs and replace legacy data explorer and querying
tools with natural language processing (NLP) and Artificial Intelligence (AI) platform.
As well as consolidate internal and external facing web systems into a single-entry point
to align with OMB Zero Trust.
Enterprise Site Repositories (ESR) Modernization Phase 2: HRSA will further advance
the ESR modernization initiative to integrate an additional five types of sites and services
at HRSA into the ESR.
HRSA Electronic Records Management System: HRSA will operationalize an Electronic
Records Management solution and begin implementation and integration for three key
critical HRSA IT systems. The consolidation of sites and streamlining of the process will
reduce low-value work for HRSA staff and improve quality and consistency of available
geographic data for service delivery sites across the agency. HRSA will also develop and
pilot a mobile application to maintain bi-directional communication during time of
emergency with Health Providers working at the service delivery sites in the frontlines.
Budget Allocation FY 2024
In FY 2024, HRSA received $49.49 million in funding for nine NEF projects:
Health Workforce Connector Community: This project will expand the Health Workforce to
meet evolving community needs, improve the distribution of Health Workforce to reduce
shortages, enhance health care equity and quality through collaboration, and develop and
apply data evidence to strengthen the health workforce.
National Center for Health Workforce Analysis (NCHAWA)Enhanced and Advanced Data
Analytics & Tools: NCHWA serves as a national resource on the health workforce in the
U.S. This initiative will improve HRSA’s ability to provide Federal and non-Federal
stakeholders improved access to valuable methodology and datasets created and managed by
the National Center for Health Workforce Analysis.
Robotic Process: This project will establish an enterprise-wide RPA framework that will
focus on bot development and deployment rather than establishing infrastructure,
438
439.
maintenance and security compliance.Organ Procurement and Transplantation Network: HRSA aims to streamline the OPTN by
laying the foundational efforts to transitioning from a large custom-built monolithic solution
to a modular approach, which will greatly reduce system complexity.
Tenant Move: The National Hansen’s Disease Program is requesting additional funds
necessary to build out a new space for their Lab Research Branch which includes new
laboratory equipment and cost associated from the move.
Data Warehouse: HRSA will migrate the Data Warehouse system to cloud as well as
automate the continuous integration and continuous delivery software delivery pipeline.
Data Center: HRSA will modernize the End of Life (EOL) datacenter infrastructure to ensure
that various security and file storage functions continue to operate on supported hardware as
well as allow HRSA to meet critical OMB mandates, and DHS/HHS security policies and
operational requirements.
ServiceNow: HRSA plans to undertake four key initiatives using the ServiceNow platform to
improve operational efficiency at HRSA over time, integrate ServiceNow with Azure cloud
services, and monitoring and managing software licenses, reclaiming unused licenses,
providing a service portal and reporting capability for audits and compliance, and implement
an Enterprise Architecture platform using ServiceNow that can integrate and synchronize
with the HHS instance of EANow for secure data exchange about HRSA software and
systems to improve governance and productivity.
SharePoint: HRSA will modernize the existing SharePoint-based custom business workflow
solutions using the latest Microsoft cloud-based Power Platform to replace legacy SharePoint
technology workflows reaching EOL support. HRSA will also use the funding to
redesign/modernize the migrated HRSA SharePoint sites using cloud native tools.
Budget Allocation FY 2023
In FY 2023, HRSA received $41.94 million in funding for four NEF projects:
Tenant Improvement Expense for the National Hansen’s Disease Program Lab Research:
The funding for this project will help build laboratory and animal housing, cover costs
associated with relocation and recalibration of the laboratory equipment and movement of the
research animals.
Expanding Access to Advanced Data Analytic Tools: This project will improve HRSA’s
ability to provide Federal and non-Federal stakeholders improved access to valuable datasets
created and managed by the National Center for Health Workforce Analysis.
Data Solution – Phase Two: This project will implement the identified strategies and
solutions from Phase One and will include a soft roll-out to include staff and public training
439
440.
and support for users of the system. The ultimate goal is to ensure that data reporting andsharing is accurate, high-quality, and non-duplicative and to increase ease of use by both
public and federal users.
Data Center and Security Infrastructure: HRSA will be replacing the existing underling
physical server hardware that is in use by many applications at HRSA in Rockville, MD and
Sterling, VA locations. This modernization will bring the HRSA systems up to the current
technology.
Budget Allocation FY 2022 and prior
Between FY’s 2022 - 2016 HRSA received a total of $50.16 million for multiple NEF
projects. Projects included HRSA’s SharePoint Cloud Migration Phase 2 which completed
the migration of existing on-premise SharePoint platform to secure and efficient cloud
environments.
The Enterprise Site Repository (ESR) Expanding Access to Advanced Data Analytic Tools
enhanced program decision-making and reporting.
The Network Infrastructure Refresh allows HRSA staff to connect to network resources
securely and reliably. HRSA replaced the 6510 SAN platform, which provides connectivity
for the HRSA Storage Area Network and provides connectivity to end users and phones
throughout the 5600 Fishers Lane building.
HRSA’s Data Warehouse: modernized and enriches the HRSA Data Warehouse website
with additional program data, usability improvements, and important security upgrades. The
Enhanced Data Analytics and Tools built enhanced data analytics capabilities to support
metric-driven, programmatic decision making by utilizing existing dashboards as well as data
marts.
The Injury Compensation System Cloud Solution developed an interface to manually create
claims and request for benefit packages, which allowed HRSA to set up and configure
multiple Salesforce Development Sandboxes.
The Injury Compensation Systems Enhancements supported financial management
modernization and measurably improved security, data protection, accuracy, efficiency, and
internal controls within the VICP and CICP operations.
The Data Warehouse Database Reengineering modernized HRSA’s Data Warehouse data
architecture.
HRSA Security Operations Upgrades (B1) allowed HRSA to bring together raw data
generated from various cybersecurity tools and more effectively correlate the data and
transform it into usable information.
The Security Operations Upgrades (B2) improves endpoint detection, performance, and
440
441.
incident response automation capabilities.The BMISS Platform Migrations to Cloud (A1) and (A2) allowed HRSA to migrate the
BMISS platform, currently hosted at the NIH data center, into a cloud-hosting environment
and enabled business flexibility and scalability for HRSA’s computing needs.
The BHW Data Management Initiative expanded the use of BHW datasets and analysis tools.
The EHBs Modernization and Security Improvements allowed HRSA to pilot a cloud
solution and enhanced EHBs security features.
The Cloud Migration & Data Center Optimization migrated its IT systems to the cloud to
accomplish OMB’s Data Center Optimization Initiative.
The Electronic Handbooks Modernization modified the HRSA Electronic Handbooks to
ensure compliance with the DATA Act.
The Cybersecurity and Data Warehouse Modernization increased cybersecurity for HRSA’s
programs in support of standards and requirements set forth by various federal agencies and
helped to establish the foundation for the future Data Warehouse. The Cybersecurity project
made critical upgrades to HRSA cybersecurity activities including implementing new tools
and 2-factor authentication for external facing systems.
1
Pursuant to Section 223 of Division G of the Consolidated Appropriation Act, 2008,
notification is required of planned use.
2
Notification submitted to the Committees on Appropriations in the House of Representatives
and the Senate on September 23, 2022.
3
Notification submitted to the Committees on Appropriations in the House of Representatives
and the Senate on October 19, 2023.
4
HHS has not yet notified for FY 2025.
441