


")


 Method")


")
")
")


")


 Финансы
Похожие презентации:

")


Depreciation and Income Taxes
1. American University of Armenia IE 340 – Engineering Economics Spring Semester, 2016
AMERICAN UNIVERSITY OF ARMENIAIE 340 – ENGINEERING ECONOMICS
SPRING SEMESTER, 2016
Chapter 7 – Depreciation and
Income Taxes
2. Objective
The objective is to introduce some of theconcepts and mechanics of depreciation and
depletion, some historical depreciation
methods, as well illustrate different types of
taxes
3. General Accounting
General Accounting:› Preparation of financial statements for a firm. A financial
statement (or financial report) is a formal record of financial
activities of a business, person, or other entity
Cost Accounting:
› A branch of general accounting that deals with the
measurement of costs
Depreciation Accounting:
› A branch of general accounting that deals with capital
assets depreciation
3
4. General Accounting
Balance sheet:› Static picture of assets, liabilities and net worth at a
single point in time or a summary of financial
balances of a corporation
› Assets, liabilities and ownership equity (or
shareholder’s equity = initial amount of money invested
into a business) are listed as of a specific date, such as the
end of its financial year. A balance sheet is often described
as a "snapshot of a company's financial condition"
4
5. It is comprised of the following 3 elements:
• Assets: Something a business owns or controls (e.g. cash,inventory, plant and machinery, etc.)
• Liabilities: Something a business owes to someone (e.g.
creditors, bank loans, etc.)
• Equity: What the business owes to its owners. This
represents the amount of capital that remains in the
business after its assets are used to pay off its outstanding
liabilities. Equity therefore represents the difference
between the assets and liabilities.
6. Balance Sheet Sample
7. General Accounting
Profit and loss statement:› Also called “income statement”
› Income Statement reports the company's financial
performance in terms of net profit or loss over a
specified period.
8. Income Statement
• Income Statement is composed of the followingtwo elements:
• Income: What the business has earned over a
period (e.g. sales revenue, dividend income, etc.)
• Expense: The cost incurred by the business over a
period (e.g. salaries and wages, depreciation,
rental charges, etc.)
• Net profit or loss is arrived by deducting
expenses from income.
9. Cost Accounting
Costs incurred to produce and sell an item orproduct are classified as:
–
–
–
–
–
Direct labor
Direct material
Manufacturing cost
Administrative cost
Selling cost
9
10. Direct Costs
Direct material:› Material whose cost is directly charged to a product
› Measured as the sum of charges for materials
necessary to produce the product
Direct labor:
› Labor cost directly attributable to a product
› Measured by multiplying direct labor hours by the
hourly wage rate
10
11. Manufacturing Costs
• Factory Overhead:– Indirect labor costs (sick leaves, vacations, bonuses
as well as labor connected to inspection, cleaning…)
– Indirect material costs (costs of materials that
cannot be attributed to a particular product)
– Fixed costs (taxes, insurance, depreciation,
maintenance)
• Factory Costs are the sum of:
– Direct labor costs
– Direct material costs
– Factory overhead
11
12. Administrative and Selling Costs
• Administrative costs:– Salaries of executive and clerical personnel, office
space, traveling, auditing, necessary to direct the
whole enterprise (not just its production or selling
activities)
• Selling costs
– Any expense involved in selling the products or services
that tie in directly with sales (selling commissions,
market surveys, selling bags, advertising)
12
13. Depreciation
• As time passes, the assets lose value ordepreciate
– Physical loss
• Use related
• Time related
– Functional loss
• Efficiency (technology) related
• Demand (changing tastes) related
• Capacity related
13
14. DEPRECIATION
• Decrease in value of physical properties withpassage of time and use
• Accounting concept establishing annual deduction
against before-tax income
- to reflect effect of time and use on asset’s
value in firm’s financial statement
15. PROPERTY IS DEPRECIABLE IF IT MUST :
• be used in business or held to produce income• have a determinable useful life which is longer than one
year
• wear out, decay, get used up, become obsolete, or lose
value from natural causes
• not be inventory, stock in trade, or investment property
16. DEPRECIABLE PROPERTY
• TANGIBLE - can be seen or touchedpersonal property - includes assets such as machinery,
vehicles, equipment, furniture, etc...
real property - anything erected on, growing on, or
attached to land
(Since land does not have a determinable life itself, it is
not depreciable)
• INTANGIBLE - personal property, such as copyright,
patent or franchise (out of scope of the lecture)
17. WHEN DEPRECIATION STARTS AND STOPS
Depreciation starts when property is placed inservice for use in business or for production of
income
Property is considered in service when ready
and available for specific use, even if not
actually used yet
Depreciation stops when cost of placing it in
service has been recovered or it is retired from
service
18. DEPRECIATION CONCEPTS
The following terms are used in the classical(historical) depreciation method equations:
› N = depreciable life of the asset in years
› P = adjusted or cost basis, including allowable adjustments
(cost of improvement or theft)
› D t = annual depreciation deduction in year t (1< t <N)
› TD t = cummulative depreciation through year t
› BV t = book value at the end of year k
› BV N = book value at the end of the depreciable (useful) life
› SV N = salvage value at the end of year N
› d = the ratio of depreciation in any one year to the BV at the
beginning of the year
19. Value of an asset
Market value› The actual value an asset can be sold for
Book value
› The depreciated value of an asset as shown on the
accounting records of company. Not a useful
measure of its market value
Salvage value
› Actual value of an asset at the end of its useful life.
It is the expected selling price of a property when
the asset can no longer be used productively by its
owner
19
20. Book Value
• Let:o P = adjusted cost basis
o BVt = book value at the end of period t
o Dt = depreciation during period t
• Then:
o BVt = BVt-1 – Dt
o BVt = P - jt=1 Dt
20
21. Capital versus expense
• Consider a copy shop, which buys:– Ink and paper
– Copying (Xerox) machines
• Ink and paper are used up when they
are bought (for all practical purposes):
– Treated as an expense
– When company buys/uses $1000 of paper,
• It is $1000 poorer (not counting any revenue)!
21
22. Capital versus expense
Copying (Xerox) machines are used up onlyslowly over time:
› Treated as “capital goods”
› When company buys a $1000 machine
It trades $1000 cash for $1000 in equipment
Not poorer at all! (assets just changed form)
That is why expenses can be deducted from
the income fully and instantly, assets or
capital need to be depreciated
22
23. Definitions
• Capital gains:– Item selling price greater than purchase
price
• Depreciation recapture:
– Item selling price greater than book value
• (Up to purchase price)
• Taxed as ordinary income
• Capital loss:
– Item sold for less than book value
23
24. Example
• If at the end of 1 year– I go out of business and sell my tools for $40K.
• I bought them for $35K and Book Value=$25
– How much capital gain (or loss) do I have?
• If at the end of 5 years
– I go out of business and sell my tools for $5K
• I bought them for $35K and Book Value=$10
– How much capital gain (or loss) do I have?
• Note that book value may be 0 even when
market value is positive!
24
25. Salvage value
• If a salvage value is expected,– Depreciation applies to P - SV
• Example:
– If P = $35K and I expected $5K salvage
value in year 5,
• I would depreciate $30K over 5 years
– (only $6K per year)
– That is, ($35K-$5K)/5 instead of $35K/5
– Ending book value would be $5K
• No capital gain/loss unless real salvage value
differs
25
26. Depreciation and taxes
• Depreciation is treated as an expense– (i.e., a tax deduction) in computation of
income taxes
• It is a fictitious expense!
– No cash changes hands
• Would you rather have that “expense”
occur sooner or later?
26
27. Observations
• Depreciation methods are conventions– Not based strictly on market value!
• Different types of assets have:
– Different recovery periods
• (Only partially related to actual lifetime)
– Different allowable depreciation schedules
• (Usually codified in lookup tables)
27
28. Some Depreciation Schedules
Straight line method (SL)Declining Balance method (DB)
Double Declining Balance (DDB)
There are more schedules used
28
29. SL Depreciation
• Constant rate of loss in the value of an asset• Graphically: straight line between the first cost
and the salvage or scrap value of the asset
Book Value ($)
800
200
0
Years
8
29
30. SL depreciation
• Recovery period = n• Depreciation rate = 1/n
– (Same for all years!)
– It depreciates (1/n)% each year
• SL Depreciation = (first cost - salvage)/n
– (Same in all years)
• Book value in period (t)
= book value in period (t-1) – depreciation(t)
30
31. SL Depreciation – Cont.
Dsl(t) = (P-SV) / NDsl(t): depreciation for period t
P: purchase value
SV: salvage value
N: useful life of the asset
BVsl(t) = P - t [(P-SV) / N] = P-t * Dsl
BVsl(t): book-value at the end of period t
31
32. Example 1
• Small computers purchased by a company cost$7000 each. Past records indicate that they
should have a useful life of 5 years, after which
they will be disposed of, with no salvage value.
Determine:
– The depreciation charge during year 1
– The depreciation charge during year 2
– The book value of the computers at the end of year 3
32
33. Example 1 – Cont.
Dsl(1) = Dsl(2) = 7000 / 5 = $1400BV(3) = 7000 – 3 [7000 / 5] = $2800
33
34. Example 2
• A machine tool has:– First cost $35,000
– Recovery period 20 years
• (based on estimated life)
– Estimated salvage value $3,500
• Depreciation = ($35,000 - $3,500)/20
= $1,575 (same in all years)
34
35. In table form …
t0
1
2
3
…
19
20
Cash Flow
-35,000
3,500
Depreciation
1,575
1,575
1,575
1,575
1,575
1,575
BV in year n = 1st cost – (SL Deprec)*n
35
36. Straight line depreciation
• Writes off capital investment linearly• Estimated salvage value is considered:
– Only estimated!
– Actual (future) salvage value is not known
when depreciation schedule is set
– SL Depreciation gives you a constant amount
each year
36
37. Declining Balance Depreciation
Sometimes called constant percentage methodor Matheson formula: assumes that the annual
cost of depreciation is a fixed percentage of the
BV at the beginning of the year
Constant proportion loss in value of an asset
Depreciation rate: a constant percentage
Ddb (t) = BVdb(t - 1) × d
Ddb (t):
BVdb (t):
P:
d:
depreciation amount in period t
book value at the end of period t
purchase price
depreciation rate
37
38. DB Depreciation
D(1) = P × d
D(2) = d × (P- D(1)) = P(1-d) × d
D(3) = d × (P- D(1)-D(2)) = P(1-d)2 × d
…
…
Ddb (t) = P(1-d)t-1 × d
39. DB Depreciation
D1 = P × dDdb (t) = P(1-d)t-1 × d
Ddb (t) = BVdb(t - 1) × d
BVdb(t) = BVdb(t-1) - Ddb(t) = BVdb(t-1) (1-d)
BVdb(t) = P(1-d)t
39
40. Example 3: Example 1 revisited
• Use a depreciation rate of 40% for decliningbalance method. Consider the previous example 1Ddb(1) = BV(0) * (0.4) = 7000 (0.4) = $2800
Ddb(2) = BV(1) * (0.4) = (7000–2800) (0.4)
Ddb(2) = $1680
BVdb(3) = 7000 (1-0.4)3 = $1512
40
41. Double declining balance (DDB)
• Most common form of declining balance isdouble declining balance or 200%
declining balance (it would have been the
triple and more, if the law permitted it, but
the double was the maximum rate
allowed):
d = 2/n, where n = recovery period
41
42. Example 4: example 2 revisited
• Consider the same machine tool• d = 2/20 years
= 10% per year (or 0.1)
• Depreciation in year 1 = 0.1($35,000)
– We use $35,000 since that is the BV in year 0
– = $3,500 (versus $1,575 for straight line)
• Depreciation in year 2
– = 0.1 (BV in t-1)
– = 0.1 ($35,000 - $3,500) = $3,150, etc.
42
43. In table form
t0
1
2
3
4
5
…
19
20
Cash Flow
-35000
-
Depreciation
3500
3150
2835
2552
2296
BV
35000
31500
28350
25515
22964
20667
525
473
4728
4255
43
44. DDB With Conversion to SL at the Most Desirable Time
• Since DDB does not use a value for Salvage, wehave three possible scenarios at time of disposal:
– Over depreciation: Book Value < Salvage Value. Tax
savings realized early. Small gain upon sale of the
asset and taxes on the gain.
– Exact depreciation: Book value = Salvage value.
There are no tax consequences upon sale of the asset.
– Under depreciation: Book Value > Salvage Value. Did
not deduct as much as you could have and lost tax
savings.
• To allow companies take advantage of all the depreciation
charges they are entitled to, they can switch from DDB to
straight line at the most favorable time.
44
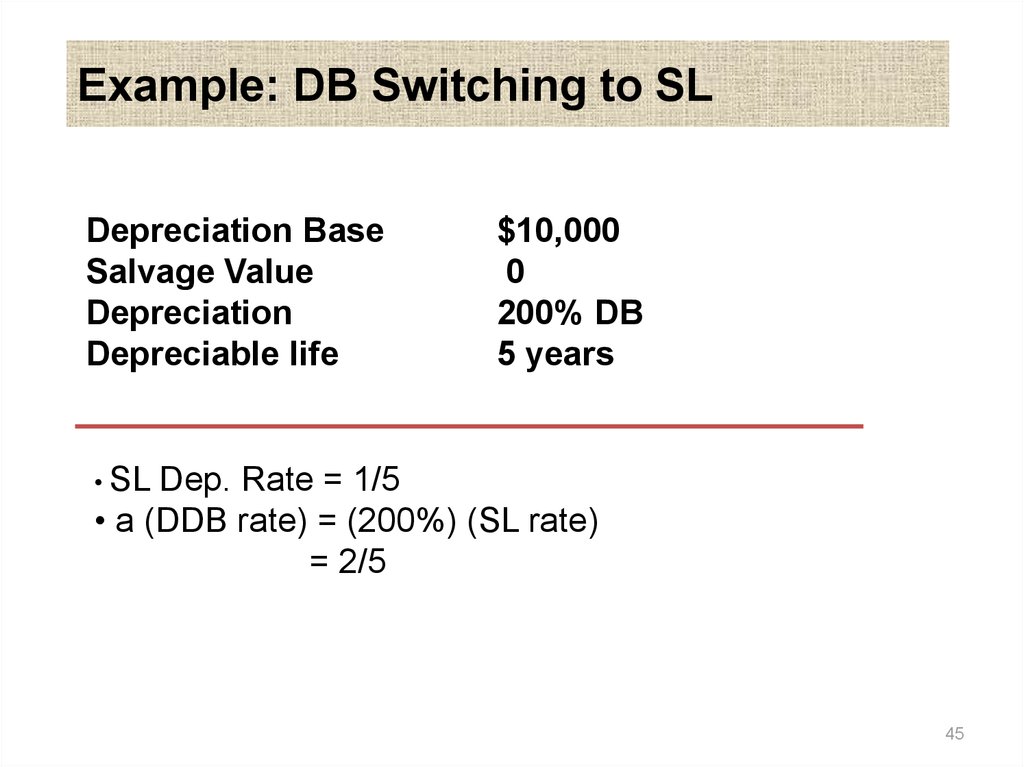
45.
Example: DB Switching to SLDepreciation Base
Salvage Value
Depreciation
Depreciable life
$10,000
0
200% DB
5 years
• SL
Dep. Rate = 1/5
• a (DDB rate) = (200%) (SL rate)
= 2/5
45
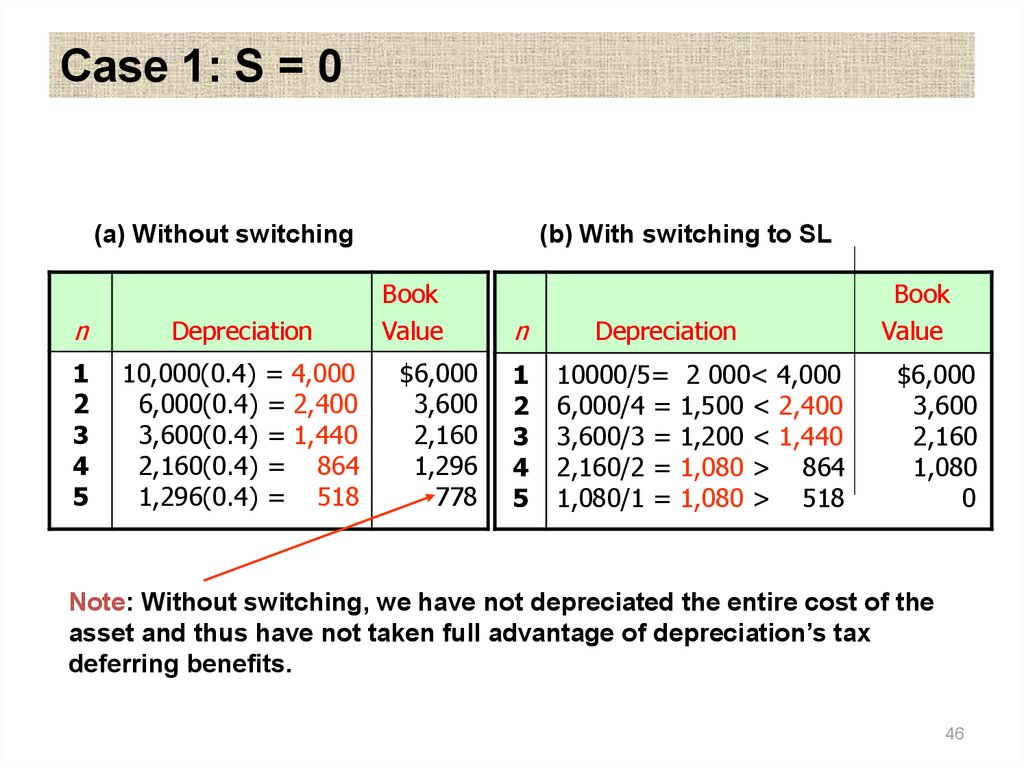
46.
Case 1: S = 0(a) Without switching
n
Depreciation
1
2
3
4
5
10,000(0.4) = 4,000
6,000(0.4) = 2,400
3,600(0.4) = 1,440
2,160(0.4) = 864
1,296(0.4) = 518
(b) With switching to SL
Book
Value
$6,000
3,600
2,160
1,296
778
n
1
2
3
4
5
Depreciation
10000/5=
6,000/4 =
3,600/3 =
2,160/2 =
1,080/1 =
2 000< 4,000
1,500 < 2,400
1,200 < 1,440
1,080 > 864
1,080 > 518
Book
Value
$6,000
3,600
2,160
1,080
0
Note: Without switching, we have not depreciated the entire cost of the
asset and thus have not taken full advantage of depreciation’s tax
deferring benefits.
46
47.
Case 2: S = $2,000End of
Year
Depreciation
Book Value
1
0.4($10,000) = $4,000
$10,000 - $4,000 = $6,000
2
0.4(6,000) = 2,400
6,000 – 2,400 = 3,600
3
0.4(3,600) = 1,440
3,600 –1,440 = 2,160
4
0.4(2,160) = 864 > 160
2,160 – 160 = 2,000
5
0
2,000 – 0 = 2,000
Note: Tax law does not permit us to depreciate assets below
their salvage values.
47
48. Sum-of-Years’ Digits (SYD) Method
• PrincipleDepreciation concept similar to DB but with decreasing depreciation
rate.
Charges a larger fraction of the cost as an expense of the early years
than of the later years.
• Formula
•Annual Depreciation
•Book Value
Dt ( P S )( N t 1) / SOYD
Bt P j 1 D j
t
where SYD=N(N+1)/2
48
49. Example 10.7 – SYD method
$10,000D1
$6,000
$4,000
Total depreciation at end of life
$8,000
D2
D3
B1
B2
D4
Annual Depreciation
Book Value
P = $10,000
N = 5 years
S = $2,000
SOYD = 15
D5
$2,000
B3
0
0 1
2
3
B4
4
B5
5
n
n
1
2
3
4
5
Dn
Bn
(5/15)(8,000)=$2,667 $7,333
(4/15)(8,000)=$2,133 5,200
(3/15)(8,000)=$1,600 3,600
(2/15)(8,000)=$1,067 2,533
(1/15)(8,000)=$533 2,000
49
50. Units-of-Production Method
• PrincipleService units will be consumed in a non time-phased
fashion (decrease in value of property is a function of use
and not function of time)
• Formula
(P - SV)
Dper unit =
Estimated lifetime production units
See Example 7-4
50
51. See Example 7-4
A piece of equipment used in a business has a basis of $50.000and is expected to have a $10.000 SV when replaced after 30.000
hours of use. Find its depreciation rate per hour of use, and find
its BV after 10.000 hours of operation.
Solution
Depreciation per unit of production = ($50.000-$10000)/30.000
hours = $1.33 per hour
After 10.000 hours BV = $50.000 - $1.33*(10.000 hours) = 36.700
52. Depletion
Two methods of natural resource depletion• Cost or factor depletion
• Percentage depletion
52
53. Cost Depletion
Depletion is computed on a per unit basisPer unit amount is determined by dividing the basis
of the resource (FC) by the estimated recoverable
units of resource
Number of units sold in year × per unit depletion =
depletion for year
Total depletion can not exceed total cost of the
property
53
54. Cost Depletion: An Example
Suppose a reservoir contains an estimated1,000,000 barrels of oil, and requires an initial
investment of $7,000,000 to develop. Asume that
50,000 barrels of oil are produced annually
Unit Depletion Rate = 7,000,000/1,000,000 = $7 per
barrel
Depletion Charge = 50,000 (7) = $350,000
54
55. Percentage Depletion
• Percentage depletion– Depletion is computed by using the statutory
percentage rate for the type of resource
– Rate is applied to the gross income from the property
• Percentage depletion
– Percentage depletion cannot exceed 50% of the
taxable income (before depletion) from the property
– Percentage depletion reduces basis in property
– However, total percentage depletion may exceed the
total cost of the property
55
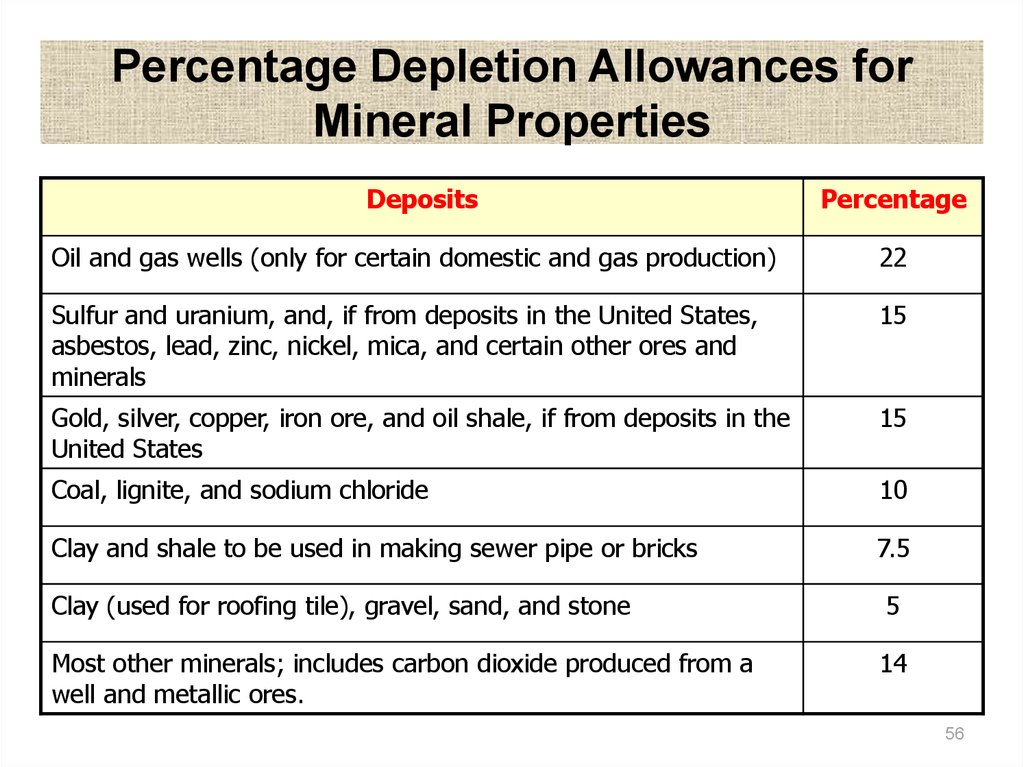
56.
Percentage Depletion Allowances forMineral Properties
Deposits
Percentage
Oil and gas wells (only for certain domestic and gas production)
22
Sulfur and uranium, and, if from deposits in the United States,
asbestos, lead, zinc, nickel, mica, and certain other ores and
minerals
15
Gold, silver, copper, iron ore, and oil shale, if from deposits in the
United States
15
Coal, lignite, and sodium chloride
10
Clay and shale to be used in making sewer pipe or bricks
7.5
Clay (used for roofing tile), gravel, sand, and stone
5
Most other minerals; includes carbon dioxide produced from a
well and metallic ores.
14
56
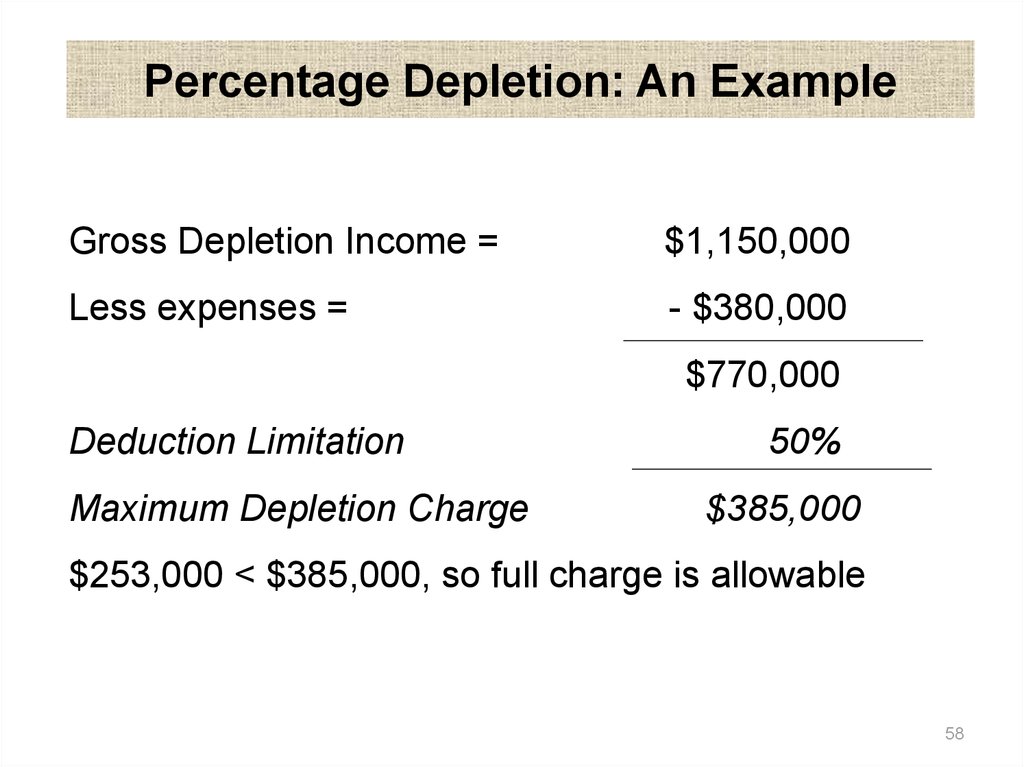
57.
Percentage Depletion: An ExampleAssume in the previous (oil) example that the price
for oil is $23 per barrel and the expenses to produce
oil (apart from the initial cost) are $380,000
Gross Depletion Income = 50,000*23 = $1,150,000
Depletion Rate = 22%
Percentage Depletion Charge = $253,000
Now check if that amount exceeds the maximum
depletion charge allowed by law
57
58.
Percentage Depletion: An ExampleGross Depletion Income =
$1,150,000
Less expenses =
- $380,000
$770,000
Deduction Limitation
Maximum Depletion Charge
50%
$385,000
$253,000 < $385,000, so full charge is allowable
58
59. Agenda for today
• We will learn how to determine:– Before-tax cash flows
– Taxable income
– Income taxes
– After-tax cash flow
• We will see the effects of depreciation
schedule on after-tax IRR
• Examples
59
60. Agenda for today
• Review terms and definitions– Rate of return (ROR)
– Tax deduction
– Tax credit
– Capital gain/loss
– Charity deductions
– Bonds
• Examples
60
61. Why do we calculate depreciation?
• Since depreciation is an “expense” we canuse that expense to reduce our taxable
income, and therefore reduce the amount
of taxes we pay.
• We have to know how much our
equipment has depreciated to determine
the deductions to be made.
61
62. Definitions
• Net versus gross income:– Gross income = revenue or receipts
– Net income = revenue minus expenses
• Corporate tax is on net income (profit)
– Individual tax is on gross income
• Income taxes are an additional expense
62
63. How to calculate After-Tax Cash Flow?
• Determine before-tax cash flows (BTCF)• Determine taxable income (TI):
– Revenues – (depreciation & other expenses)
• Compute income taxes (Tax):
– (Taxable income) * (tax rate)
• Determine after-tax cash flow (ATCF):
– Before-tax cash flow - income taxes
63
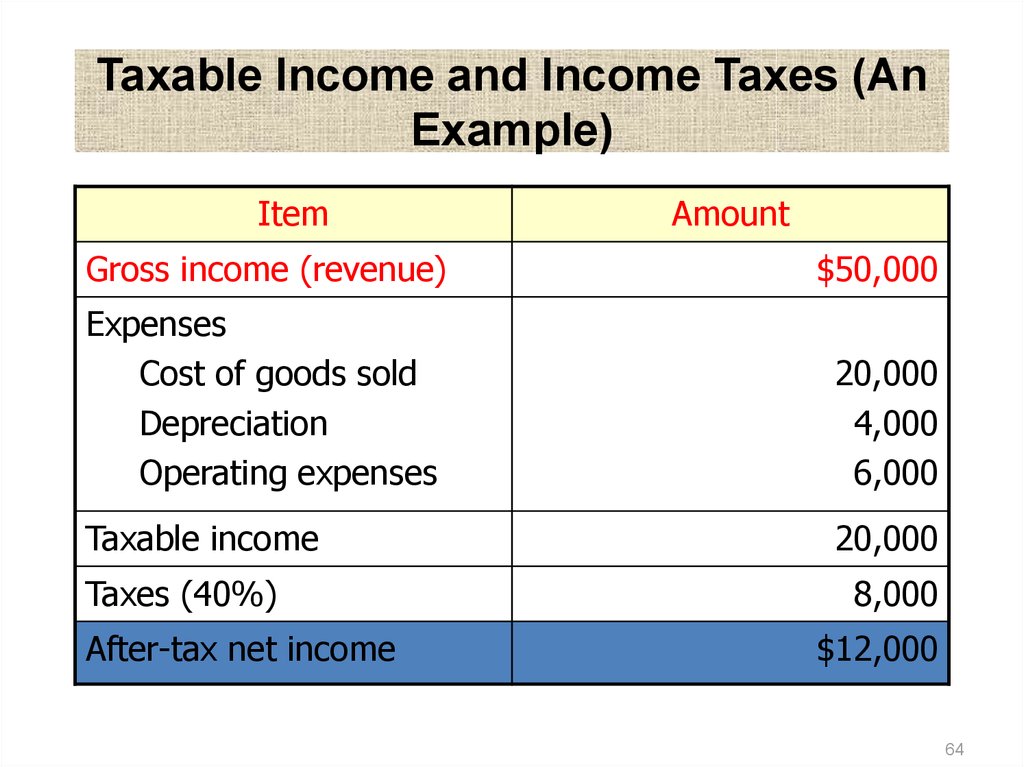
64.
Taxable Income and Income Taxes (AnExample)
Item
Amount
Gross income (revenue)
$50,000
Expenses
Cost of goods sold
Depreciation
Operating expenses
20,000
4,000
6,000
Taxable income
20,000
Taxes (40%)
After-tax net income
8,000
$12,000
64
65. General table …
Assume first cost=120, revenue=32, SL dep, SV=0, tax=40%A
Year
0
1
2
3
4
5
6
7
8
9
10
B
C
D
E
F
Cash flow Deprec. Tax. Inc. Taxes After-tax cash flow
(120/8)
(B-C) (D*40%)
(B-E)
-120.0
-120.0
32.0
15.0
17.0
6.8
25.2
32.0
15.0
17.0
6.8
25.2
32.0
15.0
17.0
6.8
25.2
32.0
15.0
17.0
6.8
25.2
32.0
15.0
17.0
6.8
25.2
32.0
15.0
17.0
6.8
25.2
32.0
15.0
17.0
6.8
25.2
32.0
15.0
17.0
6.8
25.2
32.0
0.0
32.0
12.8
19.2
32.0
0.0
32.0
12.8
19.2
65
66. Observations
• Land is capital– Land purchase is not an expense!
– Land sale proceeds are not revenue!
• Just convert cash assets into land, vice versa
• Capital gains are revenue.
• Income taxes are an additional expense
– But the timing of this expense is critical!
– Results can vary a great deal depending on
the timing of depreciation
66
67. Depreciation example (SL)
• Investment with depreciation• Buy equipment for $110K for 10 years:
– No salvage value
– Straight-line depreciation
– Savings of $32K per year
– Costs of $5.7K per year
• Net savings of $26.3K per year
– Tax is 40%
67
68. Depreciation example (SL)
Year Cash flow Deprec. Tax. Inc. Taxes After-tax cash flow0
-$110K
-$110K
1-10 +$26.3K
$11K
+$15.3K $6.12K +$20.18K
SL Deprec. = (110-0)/10 = 11
Taxable income = income - depreciation
Depreciation is treated as an expense!
Rate of return (IRR) =
20.1% before taxes
12.9% after taxes
68
69. Longer depreciation (25 years)
0-$110K
1-10 +$26.3K
11-25 $0K
$4.4K
$4.4K
-$110K
+$21.9K $8.76K +$17.54K
-$4.4K $0K
$0K
What would you expect:
Will IRR go up or down?
I am extending the depreciation and paying
more taxes sooner.
69
70. Comparison
• 10 year (SL) depreciation schedule:– Rate of return
• 20.1% before taxes,
• 12.9% after taxes
• 25 year (SL) depreciation schedule:
– After-tax rate of return = 9.5%
• Why is it less?
– What happens to after-tax rate of return?
70
71. Accelerated depreciation
7 year depreciation lifetime:Double declining balance for 4 years
Followed by straight line for 3 years
What would you expect:
Will IRR go up or down?
71
72. Accelerated depreciation
Year Cash flow Deprec. Tax. Inc. Taxes After-tax cash flow0
-110
-110
1
26.3
31.43
-5.13
-2.05
28.35
2
26.3
22.45
3.85
1.54
24.76
3
26.3
16.03
10.27
4.11
22.19
4
26.3
11.45
14.85
5.94
20.36
5
26.3
9.54
16.76
6.70
19.60
6
26.3
9.54
16.76
6.70
19.60
7
26.3
9.54
16.76
6.70
19.60
8
26.3
26.3
10.52
15.78
9
26.3
26.3
10.52
15.78
10
26.3
26.3
10.52
15.78
Sum
110
72
73. Accelerated depreciation
• How to figure out after-tax IRR?– Use column for after-tax cash flow (just that
column!)
– Calculate IRR as usual
– After-tax IRR = 14.7%
• Tax benefit of depreciation accelerated,
– So after-tax IRR went up (>12.9%)
73
74. Net Income vs. Cash Flow
Net income is an accounting means of measuring a firm’s profitabilitybased on the matching concept. Costs become expenses as they are
matched against revenue. The actual timing of cash inflows and
outflows are ignored.
Cash flow: Given the time value of money, it is better to receive cash
now than later, because cash can be invested to earn more money.
That is why cash flows are relevant data to use in project evaluation.
74
75. Why Do We Use Cash Flow in Project Evaluation?
Example: Both companies (A & B) have the same amount ofnet income and cash sum over 2 years, but Company A returns $1
million cash yearly, while Company B returns $2 million at the end of
2nd year. Company A can invest $1 million in year 1, while Company
B has nothing to invest during the same period.
Company A
Company B
Year 1
Net income
Cash flow
$1,000,000
1,000,000
$1,000,000
0
Year 2
Net income
Cash flow
1,000,000
1,000,000
1,000,000
2,000,000
75
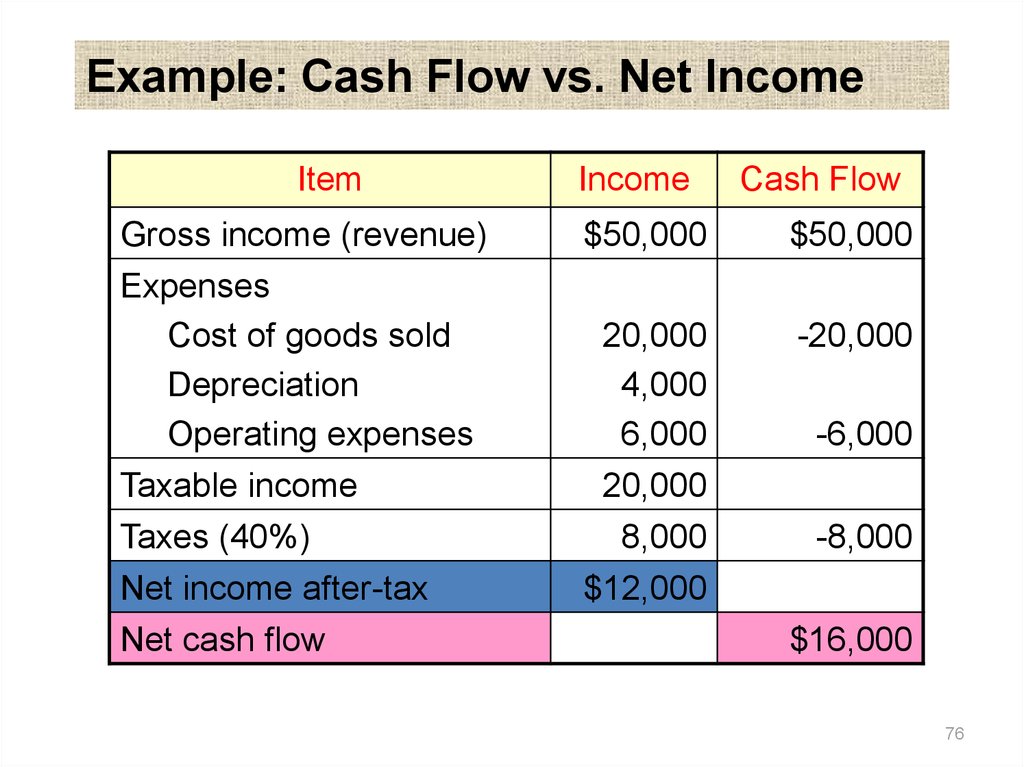
76.
Example: Cash Flow vs. Net IncomeItem
Income
Cash Flow
Gross income (revenue)
Expenses
Cost of goods sold
Depreciation
Operating expenses
Taxable income
$50,000
$50,000
20,000
4,000
6,000
20,000
-20,000
Taxes (40%)
Net income after-tax
8,000
$12,000
-8,000
Net cash flow
-6,000
$16,000
76
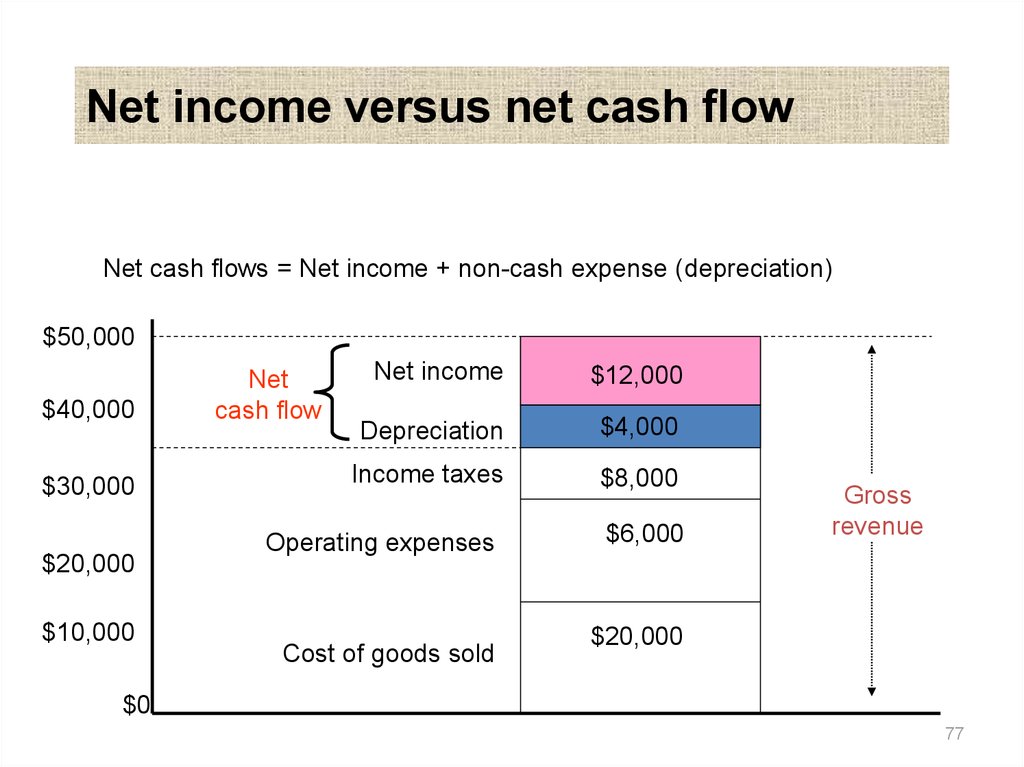
77.
Net income versus net cash flowNet cash flows = Net income + non-cash expense (depreciation)
$50,000
$40,000
$30,000
$20,000
$10,000
Net
cash flow
Net income
$12,000
Depreciation
$4,000
Income taxes
$8,000
Operating expenses
Cost of goods sold
$6,000
Gross
revenue
$20,000
$0
77
78. Definitions
• Tax deduction:– Expense deducted from taxable income
• Saving = (deduction) x (tax rate)
• Savings are not equal to deductions, just a %
• Tax credit:
– Expense deducted from taxes
• Saving = 100% of tax credit
• Tax exemption:
– Income that is not taxable
78
79. Definitions
• Book value:– Purchase price
• (for land, stocks, other non-depreciable assets)
– Depreciated value
• (for physical assets, patents, other depreciable
assets)
79
80. Definitions
• Capital gains:– Item selling price greater than purchase price
• Depreciation recapture:
– Item selling price greater than book value
• (Up to purchase price)
• Taxed as ordinary income
• Capital loss:
– Item sold for less than book value
80
81. Capital gain/loss
• Generally attributed to year of sale• Long-term capital gains (> 1 year)
– Can be taxed less than ordinary income
• Capital loss not deducted from income:
– Only from capital gains (for companies)
• Losses can be carried over to future
years!
81
82. Capital gain/loss
• Carrying backward or forward:– Some businesses are very volatile
• E.g., oil prospecting!
– Some years may have net losses
– Can use past losses to offset future gains
• Can carry forward for up to 5 years
82
83. Example
• Investment with depreciation• Buy equipment for $110K for 10 years:
– No salvage value
– Straight-line depreciation
83
84. Example
• Sell for $30K in year 8:– Book value = $22K
– Depreciation recapture = $8K
• Sell for $20K in year 8:
– Capital loss = $2K
– Cannot deduct from ordinary income
• Deduct from gain (now or in another year)
84
85. Non-depreciable example
• Investment with no depreciation• Buy land for $110K
• Sell for $130K:
– Capital gain = $20K
• Sell for $100K:
– Capital loss = $10K (offset against gains)
• Note: with land there can’t be
Depreciation Recapture. Why?
85
86. Capital gain/loss
• Taxable income =– Gross income (i.e., revenues or receipts)
Minus operating expenses
Minus depreciation
Plus depreciation recapture
Plus capital gains
Minus capital losses
– (up to size of capital gains, but no greater)
86
87. Personal income tax
• Same general issues as corporate tax:– Tax exempt income
• (E.g., government bonds)
– Tax deductions
• (E.g., charitable donations, interest payments)
87
88. Tax-exempt example
• Purchase $5K bond (20 years)– From phone company at 11%:
• $550/year, paid as $275 every 6 months
– Municipal bond from …. at 7.5%:
• $375/year, paid as $187.50 every 6 months
• Assume a tax rate:
• tax rate = 33.8%
88
89. Tax-exempt example
• Phone company bond at 11%:– $550/year, paid as $275 every 6 months
– Tax = ($550) x (33.8%) = $185.9
– After-tax income
• $550 - $185.9 = $364.10
• Municipal bond at 7.5% (tax exempt):
– $375/year (after-tax income greater!)
89
90. Observation
• A government bond (tax-exempt) at 7.5%may give higher income than a private
11% bond!
• Desirability will vary with income:
– Higher income gives higher tax rate
– Tax exemption becomes more desirable
90
91. Charitable deduction example
• Assume the following tax rate:• tax rate = 38.4%
• Charitable gift of $1000:
– Tax deduction = ($1000) x (38.4%) = $384
– True cost of gift = $1000 - $384 = $616
• Government is encouraging charity!
91
92. Graduated income tax
• Constant tax rate:– “Flat tax”
• If tax rate is not constant:
– “Graduated” income tax
92
93. Graduated income tax
• Example:– 15% if taxable income < $50K
– $7.5K + 25% of amount above $50K
• If taxable income between $50K and $75K
– $13.75K + 34% of excess over $75K
• If taxable income > $75K
93
94. Example - Corporate Income Taxes
Facts:Capital expenditure
(allowed depreciation)
$100,000
$58,000
Gross Sales revenue
$1,250,000
Expenses:
Cost of goods sold
Depreciation
Leasing warehouse
$840,000
$58,000
$20,000
Question: Taxable income?
94
95. Example - Corporate Income Taxes
Taxable income:Gross income
- Expenses:
(cost of goods sold)
(depreciation)
(leasing expense)
Taxable income
Income taxes:
First $50,000 @ 15%
$25,000 @ 25%
$25,000 @ 34%
$232,000 @ 39%
Total taxes
$1,250,000
$840,000
$58,000
$20,000
$332,000
$7,500
$6,250
$8,500
$90,480
$112,730
95
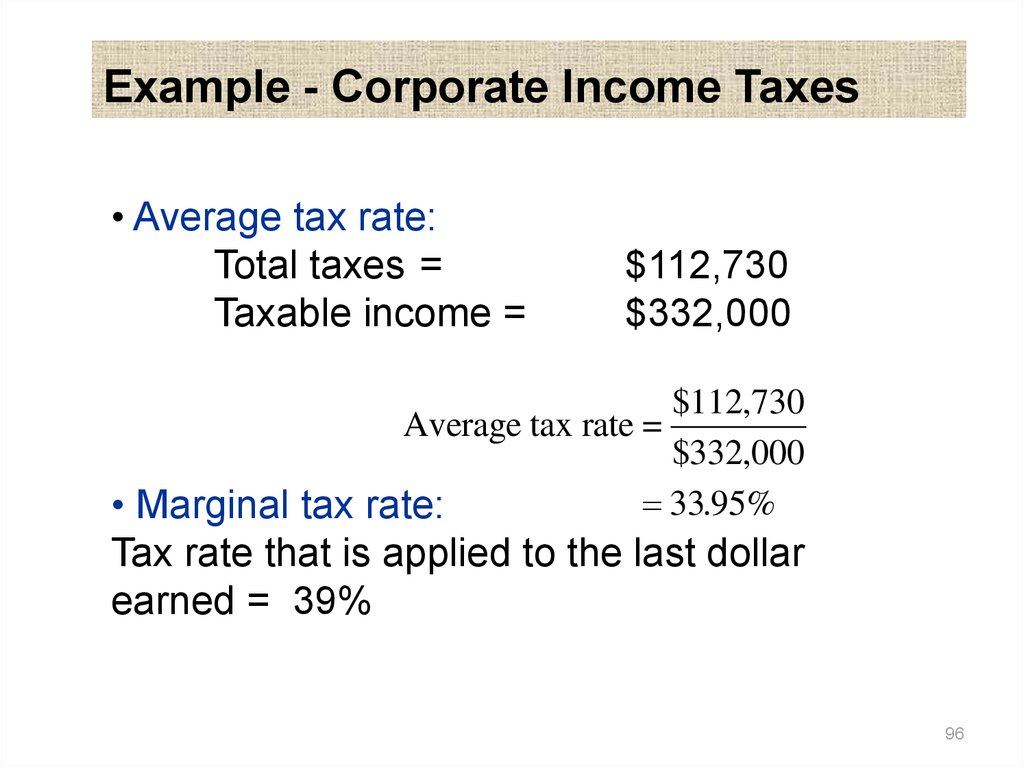
96.
Example - Corporate Income Taxes• Average tax rate:
Total taxes =
Taxable income =
$112,730
$332,000
$112,730
Average tax rate =
$332,000
33.95%
• Marginal tax rate:
Tax rate that is applied to the last dollar
earned = 39%
96
97. U.S. Corporate Tax Rate (2001)
Taxable income0-$50,000
$50,001-$75,000
$75,001-$100,000
$100,001-$335,000
$335,001-$10,000,000
$10,000,001-$15,000,000
$15,000,001-$18,333,333
$18,333,334 and Up
Tax rate
15%
25%
34%
39%
34%
35%
38%
35%
Tax computation
$0 + 0.15(D)
$7,500 + 0.25 (D)
$13,750 + 0.34(D)
$22,250 + 0.39 (D)
$113,900 + 0.34 (D)
$3,400,000 + 0.35 (D)
$5,150,000 + 0.38 (D)
$6,416,666 + 0.35 (D)
(D) denotes the taxable income in excess of the lower bound of each tax
bracket
97
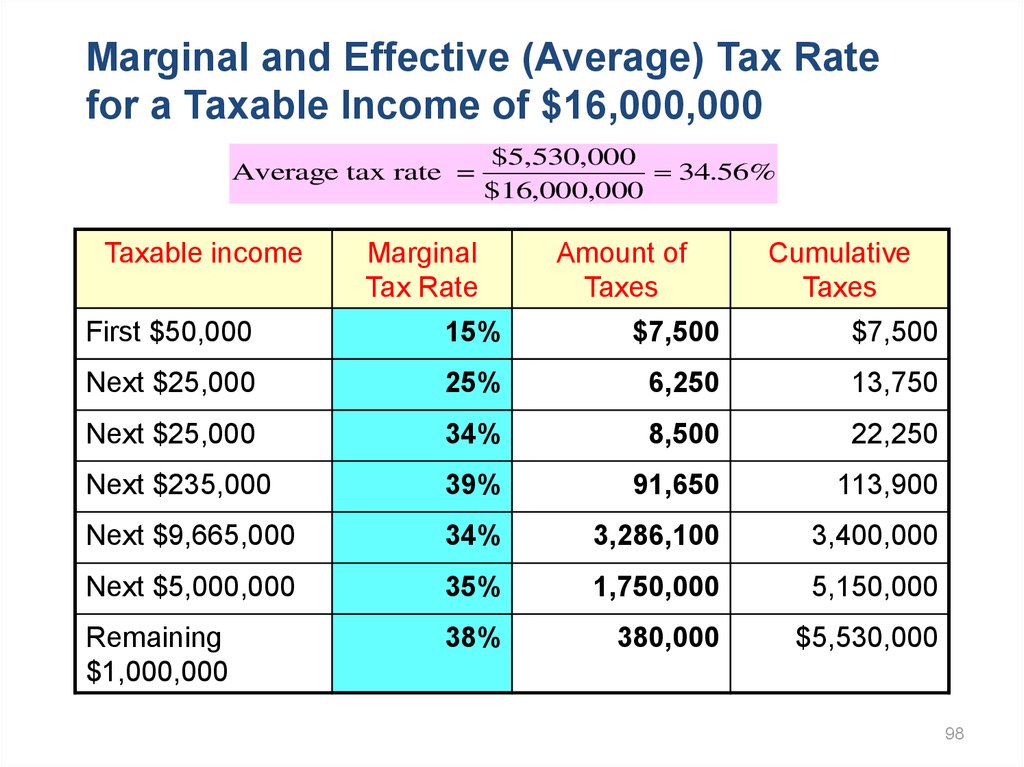
98.
Marginal and Effective (Average) Tax Ratefor a Taxable Income of $16,000,000
Average tax rate =
Taxable income
$5,530,000
34.56%
$16,000,000
Marginal
Tax Rate
Amount of
Taxes
Cumulative
Taxes
First $50,000
15%
$7,500
$7,500
Next $25,000
25%
6,250
13,750
Next $25,000
34%
8,500
22,250
Next $235,000
39%
91,650
113,900
Next $9,665,000
34%
3,286,100
3,400,000
Next $5,000,000
35%
1,750,000
5,150,000
Remaining
$1,000,000
38%
380,000
$5,530,000
98
99. How to Determine Income Tax Rate to be Used in Economic Analysis?
RevenuesExpenses
Taxable Income
Income Taxes
Regular
Business
$200,000
$130,000
$70,000
$12,500
Project
$40,000
$20,000
$20,000
?
99
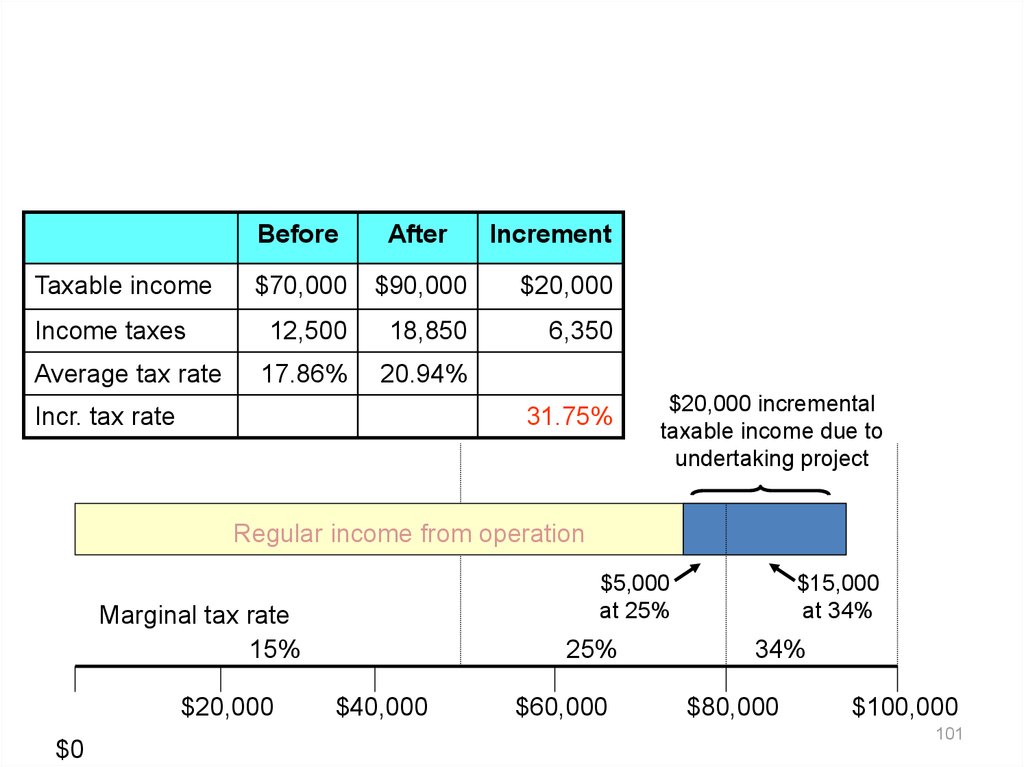
100.
Incremental Income Tax RateGross revenue
Expenses
Taxable income
Income taxes
Average tax rate
Before
After
The Effect
Undertaking Undertaking of Project
Project
Project
$200,000
$240,000
$40,000
130,000
$70,000
$12,500
17.86%
150,000
$90,000
$18,850
20.94%
20,000
$20,000
$6,350
31.75%
0.25($5,000/$20,000) + 0.34($15,000/$20,000) = 31.75%
100
101.
Taxable incomeIncome taxes
Average tax rate
Before
After
$70,000
$90,000
$20,000
12,500
18,850
6,350
17.86%
20.94%
Incr. tax rate
Increment
31.75%
$20,000 incremental
taxable income due to
undertaking project
Regular income from operation
$5,000
at 25%
Marginal tax rate
15%
$20,000
$0
25%
$40,000
$60,000
$15,000
at 34%
34%
$80,000
$100,000
101
102. Accelerated depreciation
• With accelerated depreciation– Depreciation expenses happen sooner than
with straight line depreciation (is this better or
worse?)
• Income tax liability is reduced early on
– Greater in future years
• This is beneficial due to time value of money!
102