Похожие презентации:


KazMunayGas_Economic_Audit_Presentation (1)
1.
Economic Audit of KazMunayGasCorporate & Industry Economic Analysis (Oil & Gas Sector, Kazakhstan)
Team: ____________________ | Date: 09.02.2026
2.
Agenda• 1) Macro context: Kazakhstan oil & gas sector (2024–2025)
• 2) Market structure and external factors (inflation, FX, regulation)
• 3) KazMunayGas: business model, revenues, costs, profitability (2023–2024)
• 4) Problems, economic impact, and recommendations
All figures and claims are sourced in the written report (no new content added).
3.
Macro Context: Inflation (CPI)14
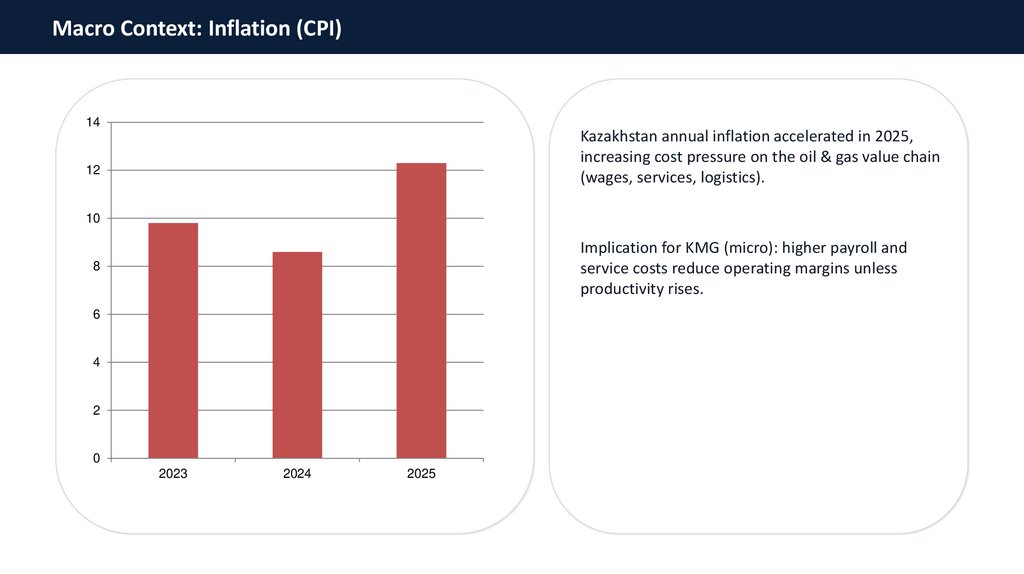
Kazakhstan annual inflation accelerated in 2025,
increasing cost pressure on the oil & gas value chain
(wages, services, logistics).
12
10
Implication for KMG (micro): higher payroll and
service costs reduce operating margins unless
productivity rises.
8
6
4
2
0
2023
2024
2025
4.
Macro Context: Oil & Gas in GDPKey point:
17
16,9
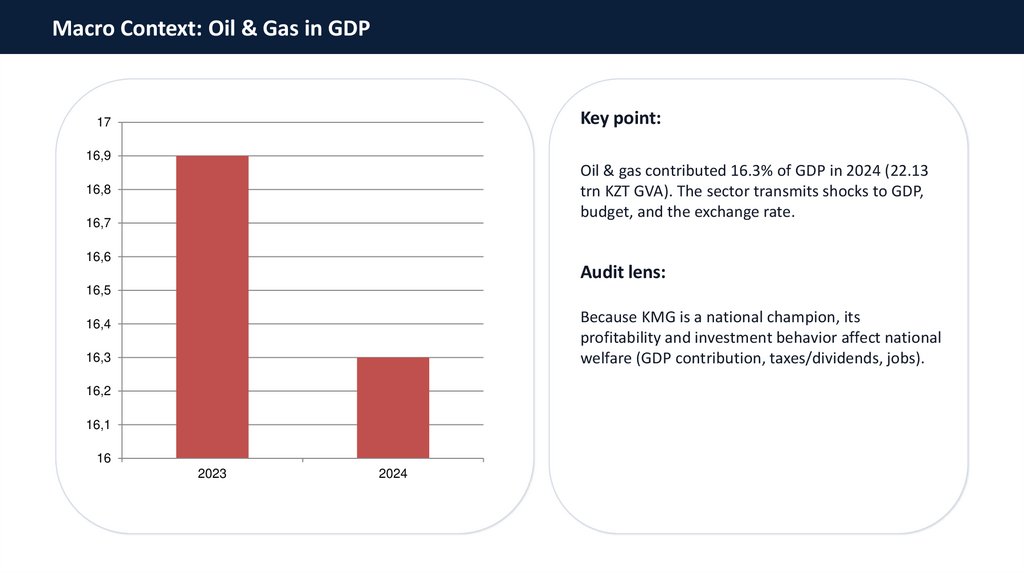
Oil & gas contributed 16.3% of GDP in 2024 (22.13
trn KZT GVA). The sector transmits shocks to GDP,
budget, and the exchange rate.
16,8
16,7
16,6
Audit lens:
16,5
Because KMG is a national champion, its
profitability and investment behavior affect national
welfare (GDP contribution, taxes/dividends, jobs).
16,4
16,3
16,2
16,1
16
2023
2024
5.
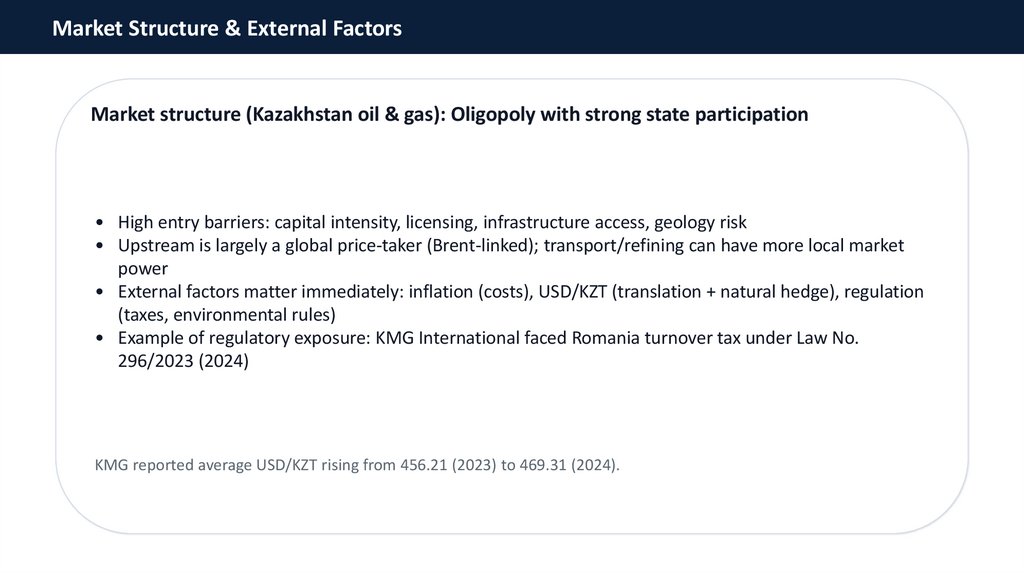
Market Structure & External FactorsMarket structure (Kazakhstan oil & gas): Oligopoly with strong state participation
• High entry barriers: capital intensity, licensing, infrastructure access, geology risk
• Upstream is largely a global price-taker (Brent-linked); transport/refining can have more local market
power
• External factors matter immediately: inflation (costs), USD/KZT (translation + natural hedge), regulation
(taxes, environmental rules)
• Example of regulatory exposure: KMG International faced Romania turnover tax under Law No.
296/2023 (2024)
KMG reported average USD/KZT rising from 456.21 (2023) to 469.31 (2024).
6.
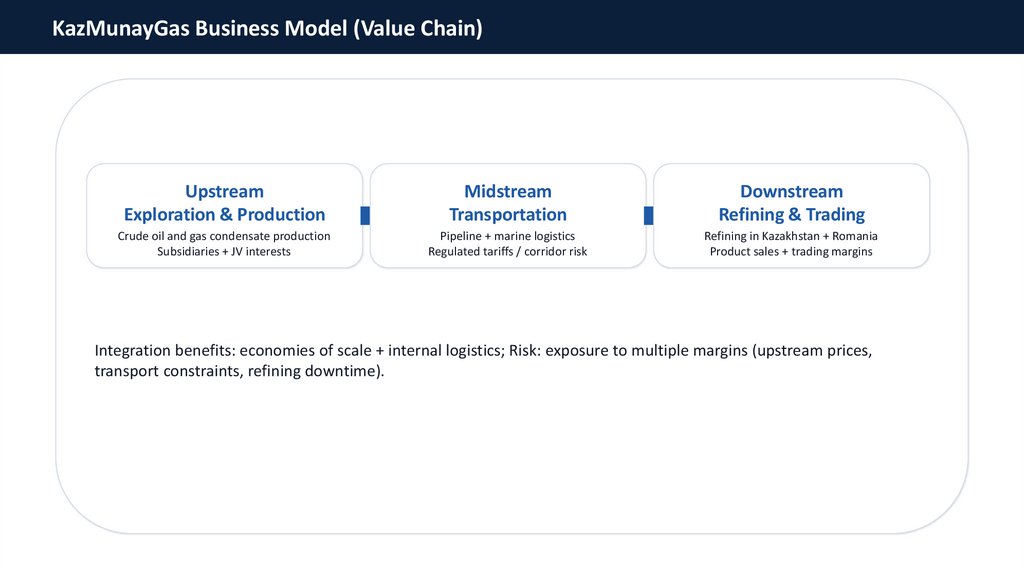
KazMunayGas Business Model (Value Chain)Upstream
Exploration & Production
Midstream
Transportation
Downstream
Refining & Trading
Crude oil and gas condensate production
Subsidiaries + JV interests
Pipeline + marine logistics
Regulated tariffs / corridor risk
Refining in Kazakhstan + Romania
Product sales + trading margins
Integration benefits: economies of scale + internal logistics; Risk: exposure to multiple margins (upstream prices,
transport constraints, refining downtime).
7.
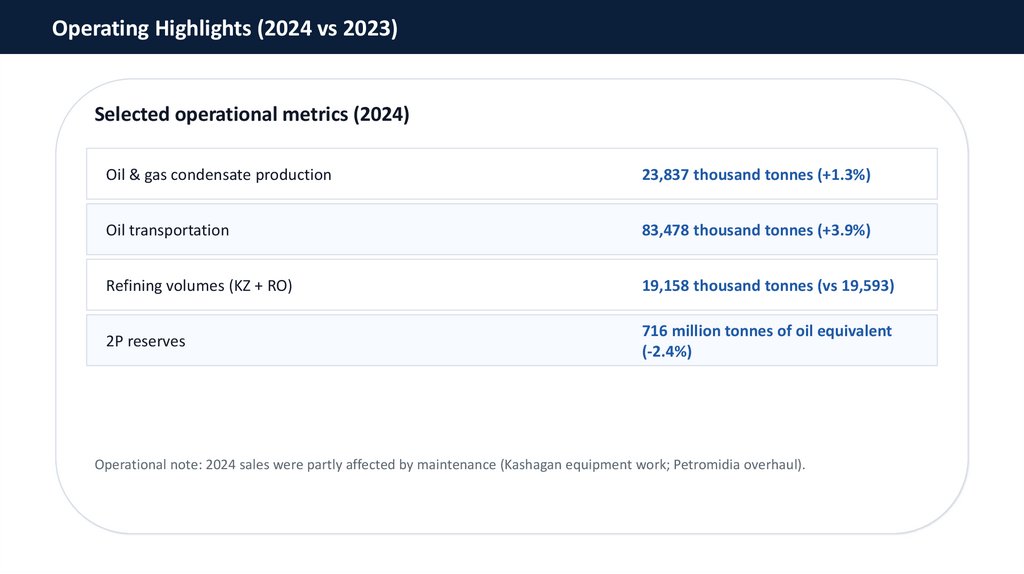
Operating Highlights (2024 vs 2023)Selected operational metrics (2024)
Oil & gas condensate production
23,837 thousand tonnes (+1.3%)
Oil transportation
83,478 thousand tonnes (+3.9%)
Refining volumes (KZ + RO)
19,158 thousand tonnes (vs 19,593)
2P reserves
716 million tonnes of oil equivalent
(-2.4%)
Operational note: 2024 sales were partly affected by maintenance (Kashagan equipment work; Petromidia overhaul).
8.
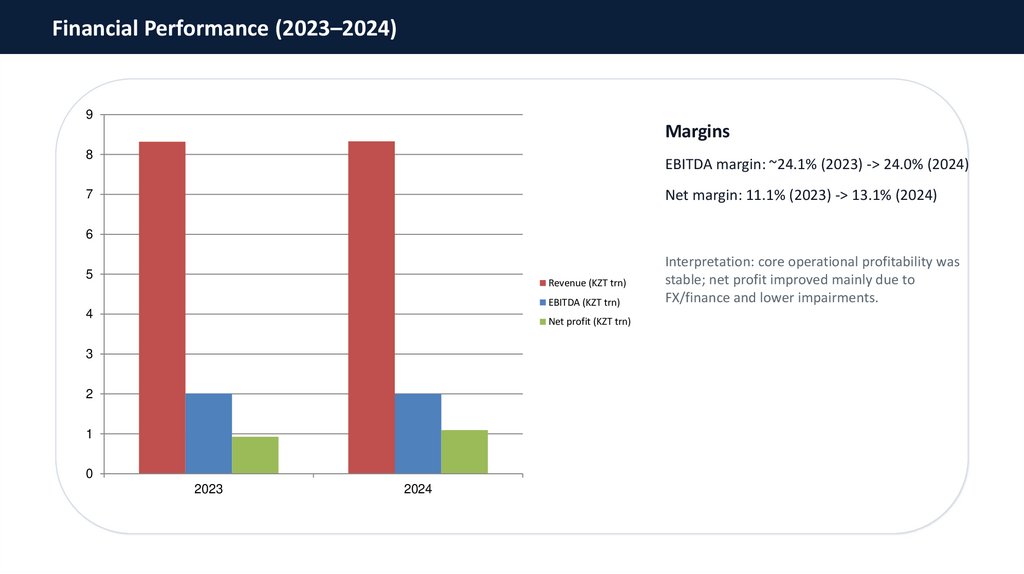
Financial Performance (2023–2024)9
Margins
8
EBITDA margin: ~24.1% (2023) -> 24.0% (2024)
Net margin: 11.1% (2023) -> 13.1% (2024)
7
6
5
Revenue (KZT trn)
EBITDA (KZT trn)
4
Net profit (KZT trn)
3
2
1
0
2023
2024
Interpretation: core operational profitability was
stable; net profit improved mainly due to
FX/finance and lower impairments.
9.
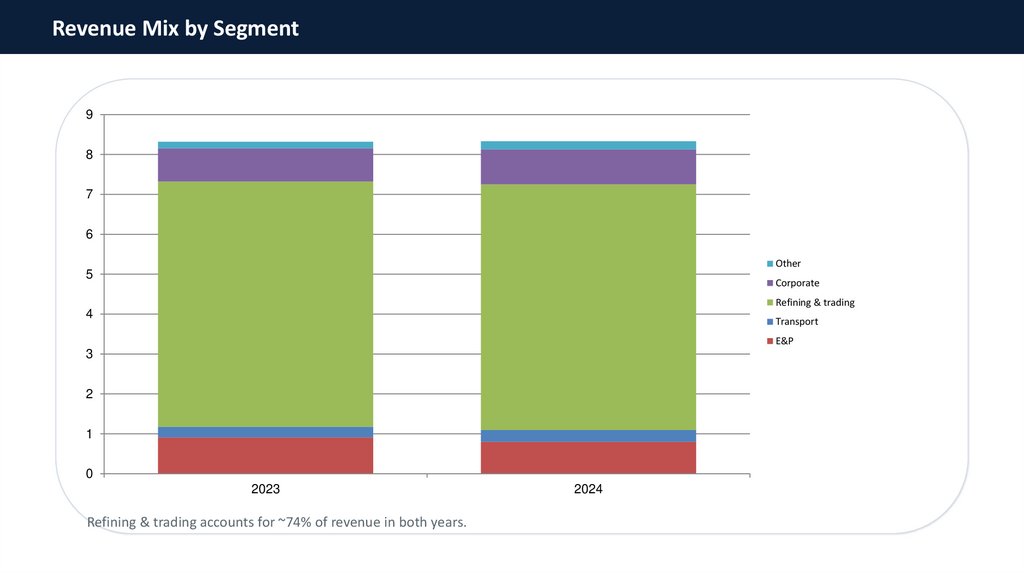
Revenue Mix by Segment9
8
7
6
Other
5
Corporate
Refining & trading
4
Transport
E&P
3
2
1
0
2023
Refining & trading accounts for ~74% of revenue in both years.
2024
10.
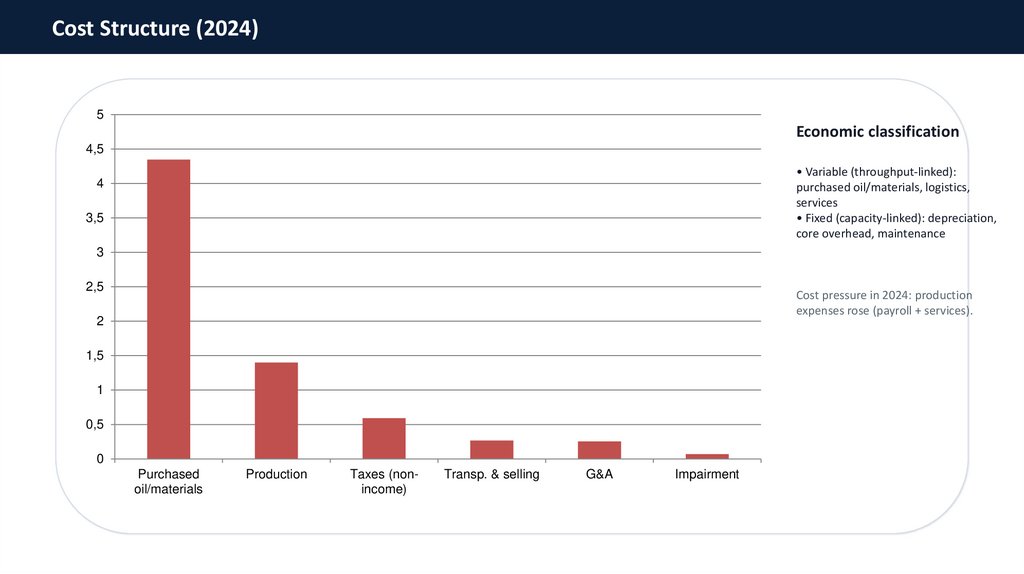
Cost Structure (2024)5
Economic classification
4,5
• Variable (throughput-linked):
purchased oil/materials, logistics,
services
• Fixed (capacity-linked): depreciation,
core overhead, maintenance
4
3,5
3
2,5
Cost pressure in 2024: production
expenses rose (payroll + services).
2
1,5
1
0,5
0
Purchased
oil/materials
Production
Taxes (nonincome)
Transp. & selling
G&A
Impairment
11.
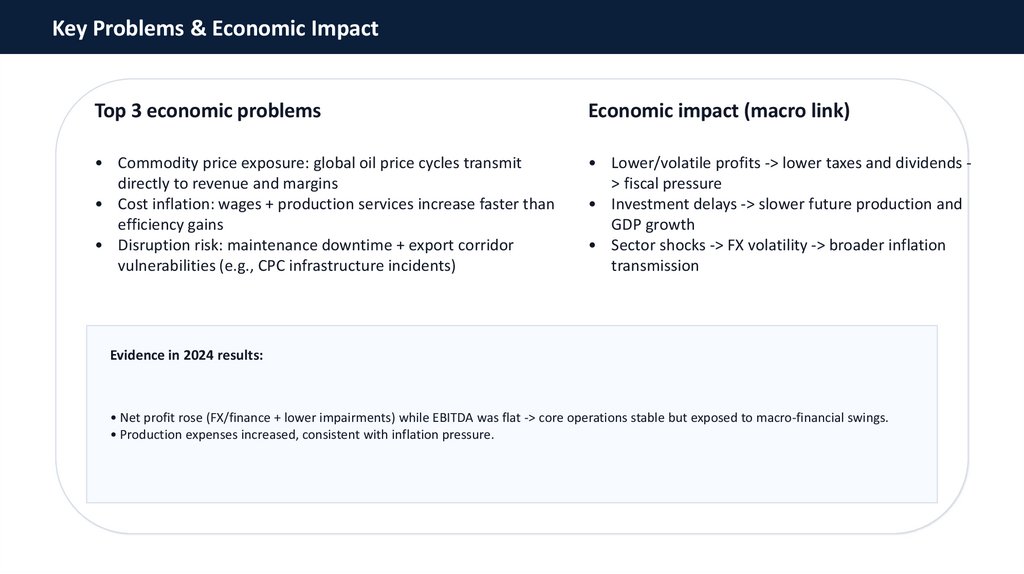
Key Problems & Economic ImpactTop 3 economic problems
Economic impact (macro link)
• Commodity price exposure: global oil price cycles transmit
directly to revenue and margins
• Cost inflation: wages + production services increase faster than
efficiency gains
• Disruption risk: maintenance downtime + export corridor
vulnerabilities (e.g., CPC infrastructure incidents)
• Lower/volatile profits -> lower taxes and dividends > fiscal pressure
• Investment delays -> slower future production and
GDP growth
• Sector shocks -> FX volatility -> broader inflation
transmission
Evidence in 2024 results:
• Net profit rose (FX/finance + lower impairments) while EBITDA was flat -> core operations stable but exposed to macro-financial swings.
• Production expenses increased, consistent with inflation pressure.
12.
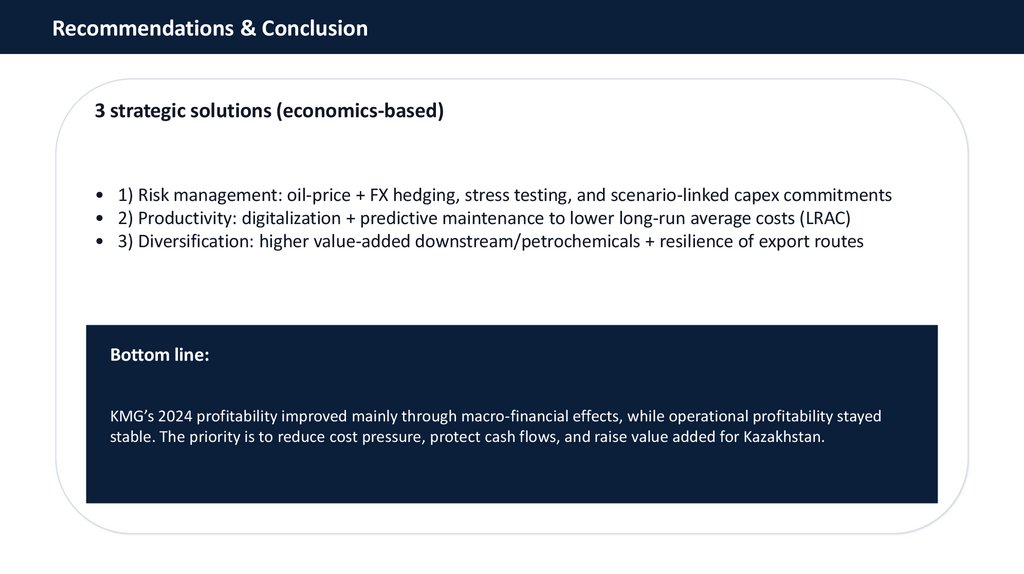
Recommendations & Conclusion3 strategic solutions (economics-based)
• 1) Risk management: oil-price + FX hedging, stress testing, and scenario-linked capex commitments
• 2) Productivity: digitalization + predictive maintenance to lower long-run average costs (LRAC)
• 3) Diversification: higher value-added downstream/petrochemicals + resilience of export routes
Bottom line:
KMG’s 2024 profitability improved mainly through macro-financial effects, while operational profitability stayed
stable. The priority is to reduce cost pressure, protect cash flows, and raise value added for Kazakhstan.