




 Медицина
Похожие презентации:



Flow Cytometry
1.
FLOWCYTOMETRY
2. FLOW CYTOMETRY
Definition:Measuring properties of cell as they flow in a
fluid suspension across an illuminated light
path.
3. Basic mechanism
Biological sampleLabel it with a fluorescent marker
Cells move in a linear stream through a focused light
source (laser beam)
Fluorescent molecule gets activated and emits light
that is filtered and detected by sensitive light
detectors (usually a photomultiplier tube)
Conversion of analog fluorescent signals to digital
signals
4. Flow Cytometry
This method allows the quantitative andqualitative analysis of several properties of cell
populations from virtually any type of fresh
unfixed tissue or body fluid.
The properties measured include a particle’s
related size, relative granularity or internal
complexity, and relative fluorescence intensity
Most commonly analyzed materials are:
blood,
bone marrow aspirate and
lymph node suspensions.
5. Principle of Flow Cytometry
Flow cytometer is composed of three maincomponents:
The Flow system (fluidics)
Cells in suspension are brought in single file past
The Optical system (light sensing)
a focused laser which scatter light and emit
fluorescence that is filtered and collected
The Electronic system (signal processing)
emitted light is converted to digitized values that
are stored in a file for analysis
6. The Flow System
One of the fundamentals of flow cytometry is the abilityto measure the properties of individual particles, which
is managed by the fluidics system.
When a sample is injected into a flow cytometer, it is
ordered into a stream of single particles.
The fluidic system consists of a FLOW CELL (Quartz
Chamber):
Central channel/ core - through which the sample is
injected.
Outer sheath - contains faster flowing fluid k/a
Sheath fluid (0.9% Saline / PBS) , enclosing the
central core.
7. Hydrodynamic Focusing
Once the sample is injectedinto a stream of sheath fluid
within the flow chamber, they
are forced into the center of
the stream forming a single
file by the PRINCIPLE OF
HYDRODYNAMIC
FOCUSING.
'Only one cell or particle can
pass through the laser beam
at a given moment.'
8.
• The sample pressure is always higher than thesheath fluid pressure, ensuring a high flow rate
allowing more cells to enter the stream at a
given moment.
• High Flow Rate - Immunophenotyping analysis
of cells
• Low Flow Rate - DNAAnalysis
Sample
Tube
Waste
Tank
Sheath
Tank
Vacuum
Sheath
Pressure
(Constant)
Sample
Pressure
(Variable)
Line Pressure
9. OPTICS
After the cell delivery system, the need is to excite thecells using a light source.
The light source used in a flow cytometer:
Laser (more commonly)
Arc lamp
Why Lasers are more common?
They are highly coherent and uniform. They can be easily
focused on a very small area (like a sample stream).
They are monochromatic, emitting single wavelengths of light.
ARGON Lasers - 488nm wavelength (blue to
blue green)
10.
When a light intersects a laser beam at the so called'interogation point' two events occur:
a) light scattering
b) emission of light (fluorescence )
Fluorescence is light emitted during decay of
excited electron to its basal state.
11. OPTICS
a) LIGHT SCATTERWhen light from a laser interrogates a cell, that cell
scatters light in all directions.
The scattered light can travel from the interrogation point
down a path to a detector.
12. OPTICS - FORWARD SCATTER (FSC)
Light that is scattered in the forward direction
(along the same axis the laser is traveling) is
detected in the Forward Scatter Channel.
The intensity of this signal has been attributed to
cell size, refractive index
(membrane
perm
eability).
13.
OPTICS - SIDE SCATTER(SSC)
Laser light that is scattered at 90 degrees to the axis of
the laser path is detected in the Side Scatter Channel.
The intensity of this signal is proportional to the amount
of cytosolic structure in the cell (eg. granules, cell
inclusions, etc.)
Side scatter detector
Measuring cell granularity
14.
FSCDetector
Laser Beam
Collection
Lens
SSC
Detector
15. Why FSC & SSC?
Why FSC & SSC?Granulocytes
SSC
Lymphocytes
Monocytes
RBCs, Debris,
Dead Cells
FSC
Study of FSC and SSC allows us to know the
differentiation of different types of cells.
16.
Thelight scattered in the forward direction
is proportional to the square of the radius of a
sphere, and so to the size of the cell or particle.
The cells are labelled with fluorochrome-linked
antibodies or stained with fluorescent membrane,
cytoplasmic or nuclear dye.
17. Commonly used Fluorochromes
FLUOROCHROMESEMISSION
MAXIMUM
Fluorescein Isothiocynate (FITC)
530nm
Phycoerythrin (PE)
576nm
Peridin-chlorophyll alpha complex
(PerCP)
680nm
Allophycocyanin (APC)
660nm
Texas red
620nm
ECD( PE - Texas Red Tandem)
615nm
PC5 (PE - cyanin 5 dye tandem)
667nm
18. Optics
B) EMISSION OF FLUORESCENT LIGHT(FLUORESCENCE)
As the fluorescent molecule present in or on the
particle is interrogated by the laser light, it will absorb
energy from the laser light and release the absorbed
energy at longer wave length.
Emitted photons pass through the collection lens and
are split and steered down specific channels with the
use of filters.
19. Optics- Filters
Differentwavelengths
of
light
are
scattered simultaneously from a cell
Need to split the light into its specific wavelengths in
order to measure and quantify them independently.
This is done with filters.
The system of filters ensures that each photodetector
receives light bands of various wavelengths.
Optical filters are designed such that they absorb or
reflect some wavelengths of light, while transmitting
others.
Types of filters
1. Long Pass
2. Short Pass
3. Band Pass
4. Dichroic
20. Optics- Long Pass Filters
Transmit all wavelengths greater than specifiedwavelength
Example: 500LP will transmit all wavelengths greater
than 500nm
Transmittance
400nm
Original from Cytomation Training Manual
500nm
600nm
700nm
21. Optics- Short Pass Filter
Transmits all wavelengths less than specifiedwavelength
600SP will transmit all wavelengths less
than 600nm.
Transmittance
Example:
400nm
Original from Cytomation Training Manual
500nm
600nm
700nm
22. Optics- Band Pass Filter
Transmits a specific band of wavelengths550/20BP Filter will transmit wavelengths
of light between 540nm and 560nm (550/20 =
550+/- 10, not 550+/-20)
Transmittance
Example:
400nm
Original from Cytomation Training Manual
500nm
600nm
700nm
23. Optics- Dichroic Filters
Long pass or short pass filtersPlaced at a 45º angle of incidence
Part of the light is reflected at 90º , and part of the light is
transmitted and continues.
Detector 1
Dichroic Filter
Detector 2
24. OPTICS - DETECTORS
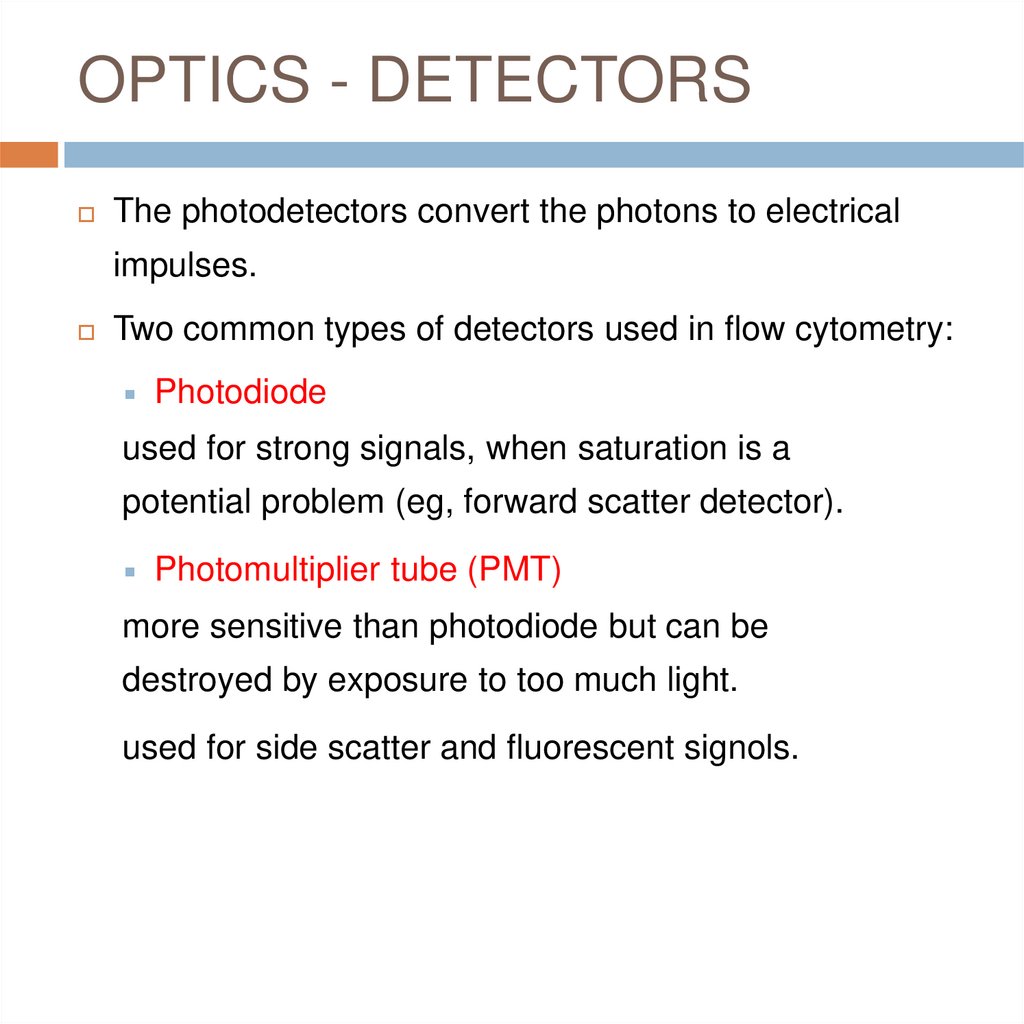
The photodetectors convert the photons to electricalimpulses.
Two common types of detectors used in flow cytometry:
Photodiode
used for strong signals, when saturation is a
potential problem (eg, forward scatter detector).
Photomultiplier tube (PMT)
more sensitive than photodiode but can be
destroyed by exposure to too much light.
used for side scatter and fluorescent signols.
25. ELECTRONICS
The electronic subsystem converts photons tophotoelectrons.
Measures amplitude, area and width of photoelectron
pulse.
It amplifies pulse either linearly or logarithmically
and then digitalizing the amplified pulse.
26. Electronics- Creation of a Voltage Pulse
Time27. Data Analysis- Plot Types
There are several plot choices:Single Color Histogram
Fluorescence intensity (FI) versus the number of
cells counted.
Two Color Dot Plot
FI of parameter 1 versus FI of Parameter 2
Two Color Contour Plot
Concentric rings form around populations. The more
dense the population, the closer the rings are to each
other
Two Color Density Plot
Areas of higher density will have a different color than
other areas
28. Plot Types
Contour PlotDensity Plot
Greyscale Density
Dot Plot
Histogram
www.treestar.com
29. DATA ANALYSIS - GATING
DATAANALYSIS - GATINGGating is in essence electronic window that sets
upper and lower limits on the type and amount
of material that passes through.
Selection of only a certain population of cells
for analysis on a plot.
Allows the ability to look at parameters specific
to only that subset.
30. Interpretation of Graphs
An important tool for evaluating data is the dotplot.
The instrument detects each cell as a point on
an X-Y graph. This form of data presentation
looks at two parameters of the sample at the
same time.
31. Three common modes for dot plots are:
Forward scatter (FSC) vs. side scatter (SSC)To look at the distribution of cells based upon size &
granularity
Single color vs. side scatter
To visualize the expression of the fluorescence of the
cells
Two-color fluorescence plot.
To differentiate between those cells that express only one
of the particular fluorescent markers, those that express
neither, and those that express both.
used to discriminate dead cells from the live ones that
are expressing the desired fluorescence.
32. How to differentiate dim & bright expression of an antigen?
How to differentiate dim & brightexpression of an antigen?
Dim : cells are
present more towards
the origin(0) on x(red)
- y axis (pink)
Bright : cells are
present away from
the origin(0) on
x(green) & y(yellow)
axis.
BRIGHT
DIM
Y-axis
CD4
X-axis
CD8
33. WHAT IS UNIQUE IN FLOWCYTOMETRY
MULTIPARAMETRICRAPID ANALYSIS OF LARGE NUMBER OF
CELLS
INFORMATION AT A SINGLE CELL LEVEL
DETECTION OF RARE CELL POPULATIONS
ALLOWS PHYSICAL ISOLATION OF CELLS
OF INTEREST
34.
USES OFFLOWCYTOMETRY
35. APPLICATIONS
ANALYSISImmunophenotyping
Dyes that bind to nucleic acids (DNA, RNA)
Functional assays
CELL COUNTING
CELL SORTING
36. CLINICAL APPLICATIONS
CLINICALAPPLICATIONSHIV/AIDS
Joint Pain
• Absolute CD4 counts
• HLA B27 assay
Hematological
Malignancies
• Diagnosis and Classification
• Detection of MRD
Solid Tumours
• DNA Ploidy
• S Phase fraction
Primary
Immunodeficiency
disorders
• TBNK
• Phagocytic function defect
37. Cont..
Hemolytic anaemia• Reticulocyte count
• PNH
• Osmotic fragility assay
Fetal Hb detection
• Feto- maternal Hemorrhage
• treatment response in Sickle Cell Anemia
Bleeding Disorders
• Platelet receptor assays (Platelet count, GT,
BSS)
• Platelet function assay (CD62P, PAC-1)
Transfusion and
Transplant
Host Immune
response in Sepsis
• CD34 STEM CELL COUNTS
• Residual WBC count in leukodepleted blood
packs
• Flow cytometry Crossmatch
• Surface markers in PMN, Monocytes
• Cytokine response
38. References
• THE FLOW CYTOMETRIC EVALUATION OF HEMATOPOIETIC NEOPLASIABrent L. Wood, Michael J. Borowitz. Henry’s, 22nd edition, Chapter 34
• https://www.bosterbio.com/protocol-and-troubleshooting/flowcytometry-principle
• https://www.abcam.com/protocols/introduction-to-flow-cytometry
• Video Link:
• https://www.youtube.com/watch?v=5IdYFgYb9ls
• https://www.youtube.com/watch?v=7bCZx5xPwt0&t=94s