


")
")
")
")


")

 Астрономия
 Английский язык
Похожие презентации:


 Optical")


Comparative analysis of gas and dust properties in comets of different dynamical groups
1. Comparative analysis of gas and dust properties in comets of different dynamical groups
Ivanova Oleksandra2.
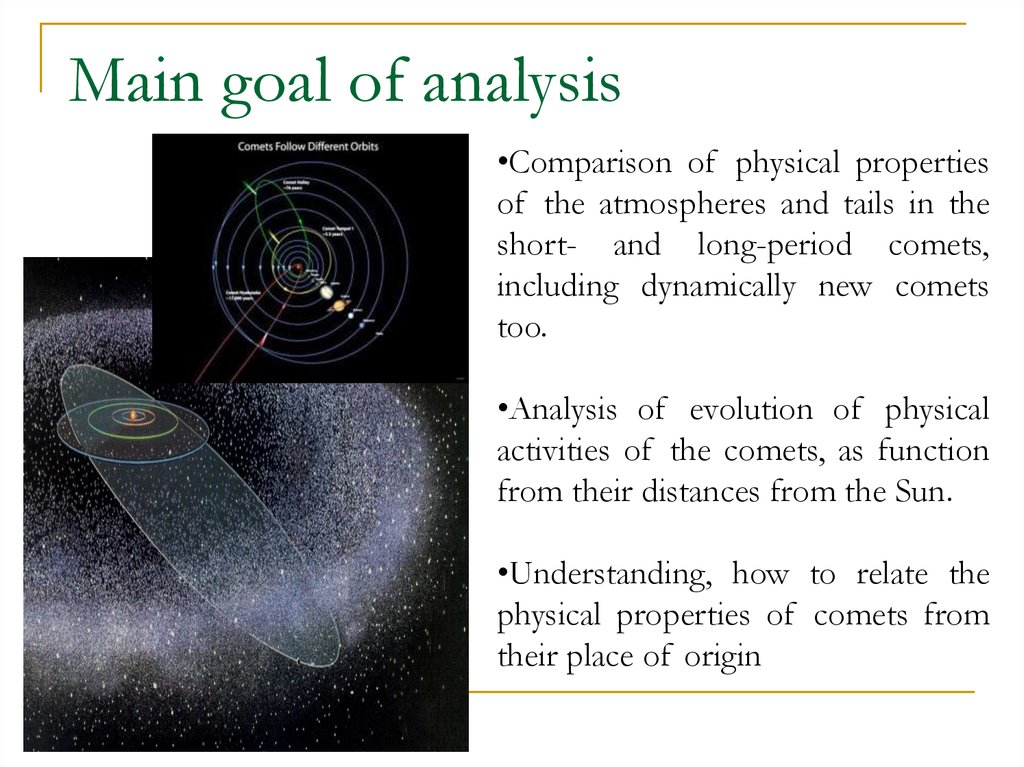
Main goal of analysis•Comparison of physical properties
of the atmospheres and tails in the
short- and long-period comets,
including dynamically new comets
too.
•Analysis of evolution of physical
activities of the comets, as function
from their distances from the Sun.
•Understanding, how to relate the
physical properties of comets from
their place of origin
3.
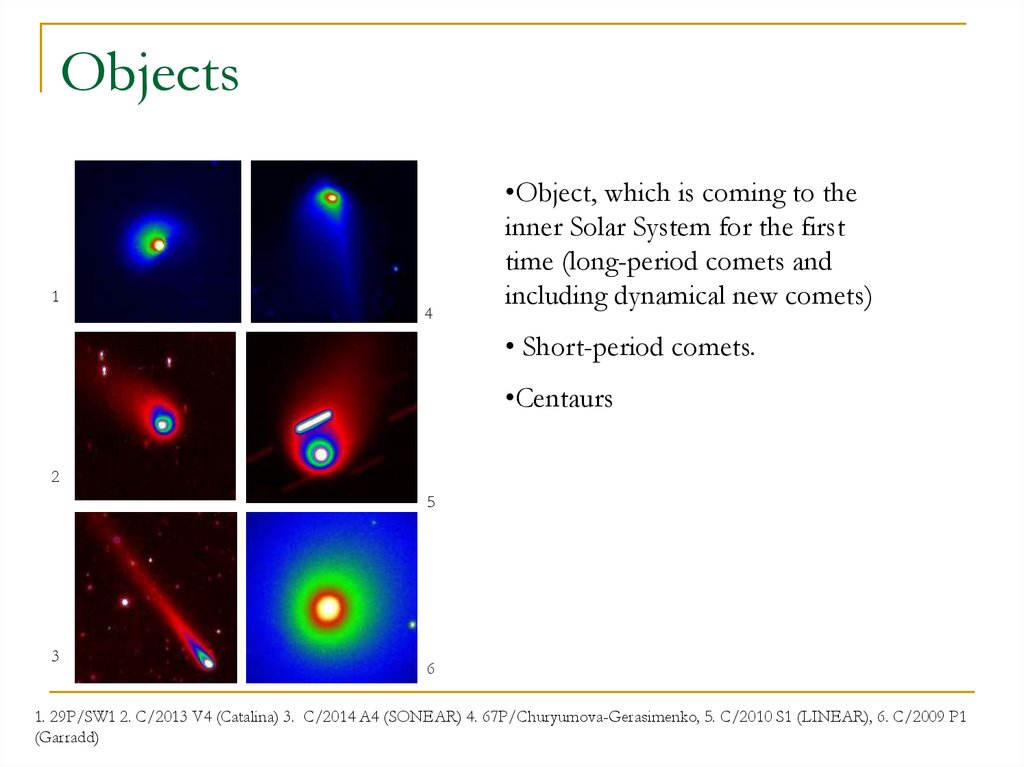
Objects1
4
•Object, which is coming to the
inner Solar System for the first
time (long-period comets and
including dynamical new comets)
• Short-period comets.
•Centaurs
2
5
3
6
1. 29P/SW1 2. C/2013 V4 (Catalina) 3. C/2014 A4 (SONEAR) 4. 67P/Churyumova-Gerasimenko, 5. C/2010 S1 (LINEAR), 6. C/2009 P1
(Garradd)
4. Telescopes
•6-m telescope SAO RAS (Russia)•4.1-m telescope SOAR (Chile)
•2-m telescope (p. Terskol, Russia)
•2-m Faulkes Telescope of South Siding Spring Observatory
(Australia)
•1.6- m telescope of the National Laboratory for Astrophysics (LNA, Brazil)
•1.3-m telescope Skalnato Pleso (AI SAS, Slovakia) (in future)
•1.0 -m telescope (SAO RAS)
•1.0 -m telescope (Kaurovka observatory, Russia )
•0.70 -m telescope KAO (p. Lisnyky)
•0.61 - m telescope Skalnato Pleso (AI SAS, Slovakia)
•0.60- m telescope (p. Terskol, Russia)
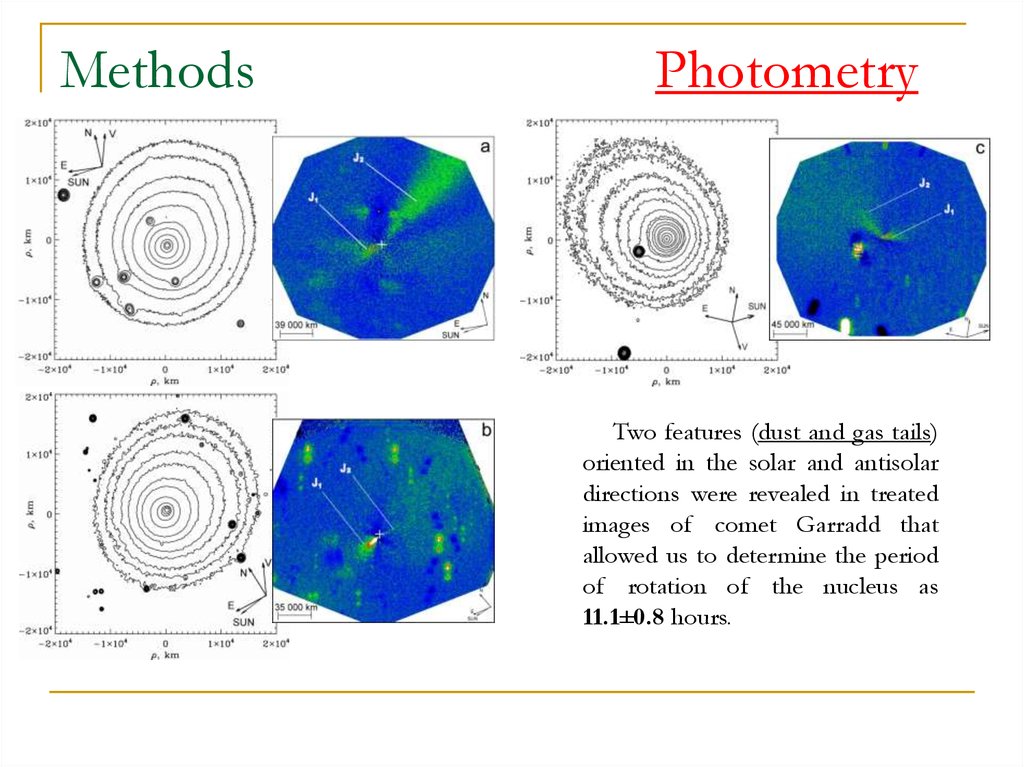
5. Methods Photometry
MethodsBroad band filters BVR (heliocentric distances from 8 to 4 AU)
Dust production rates
Radius of cometary nucleus
Morphology of cometary coma
Color indexes
Period rotation of cometary nucleus
Outburst and long lasting activity
Split of the comets
Comet filters (at heliocentric distances < 3 AU)
Gas/Dust production rates
Modeling of dust tails
Morphology of cometary coma
Period of rotation of cometary nucleus
Photometry
C/2003
WT42
6-m SAO
RAN
(r=5.52 AU)
C/2001 Q4
Zeiss-600
(r=0.96 AU)
6. Methods Spectroscopy
29P/SW1 - 1.6 m BrazilC/2004 Q2 (Machholz) – 60 cm AAO
C/2009 R1 (McNaught) – 2m p.Terskol
Dust production rates
Gas production rates
Detection of emission
7. Methods Polarimetry
C/2010 S1(Linear)
r = 5.9 AU
= 5.6 AU
= 9.2
Filter R
Study of physical properties of the dust in
comets at different heliocentric distances are
very important for study of their evolution.
C/2009 P1 (GARRADD)
r = 1.71 AU, = 1.38 AU, = 35.2
CCD polarimetry of distant comets C/2010 S1 (LINEAR) and C/2010 R1 (LINEAR) at the 6-m telescope of the SAO RAS. Oleksandra V. Ivanova,
Janna M. Dlugach, Viktor L. Afanasiev, Volodymyr M. Reshetnyk, Pavlo P. Korsun. Published in Planetary and Space Science, 2014
8.
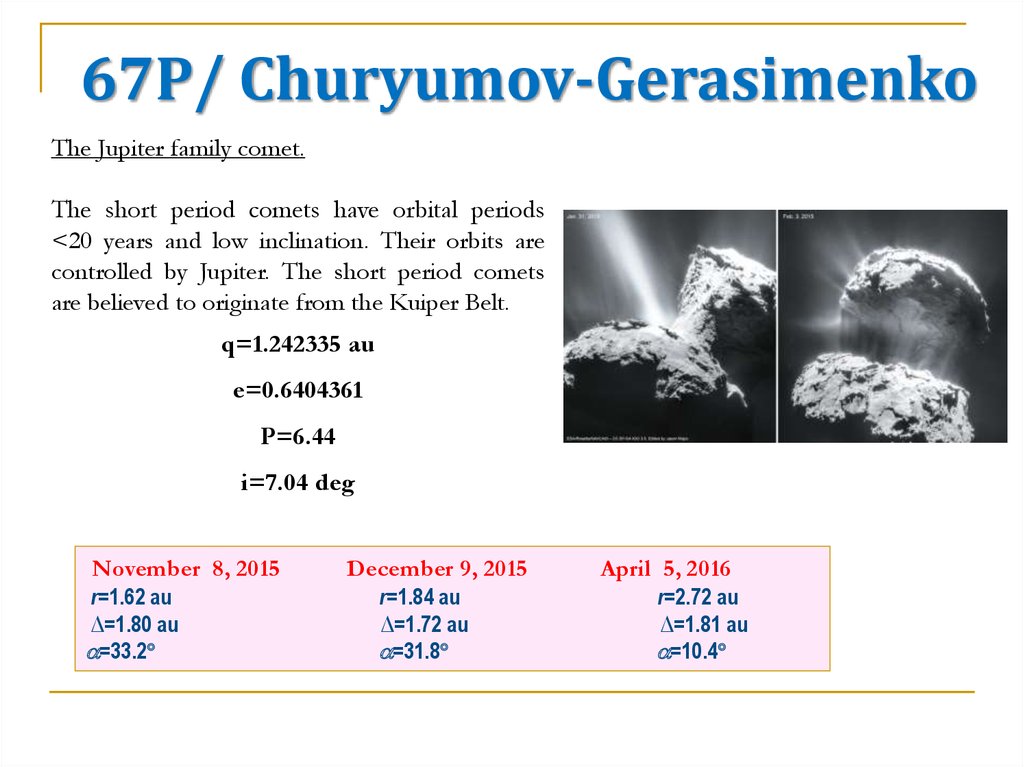
67P/ Churyumov-GerasimenkoThe Jupiter family comet.
The short period comets have orbital periods
<20 years and low inclination. Their orbits are
controlled by Jupiter. The short period comets
are believed to originate from the Kuiper Belt.
q=1.242335 au
e=0.6404361
P=6.44
i=7.04 deg
November 8, 2015
r=1.62 au
∆=1.80 au
=33.2
December 9, 2015
r=1.84 au
∆=1.72 au
=31.8
April 5, 2016
r=2.72 au
∆=1.81 au
=10.4
9.
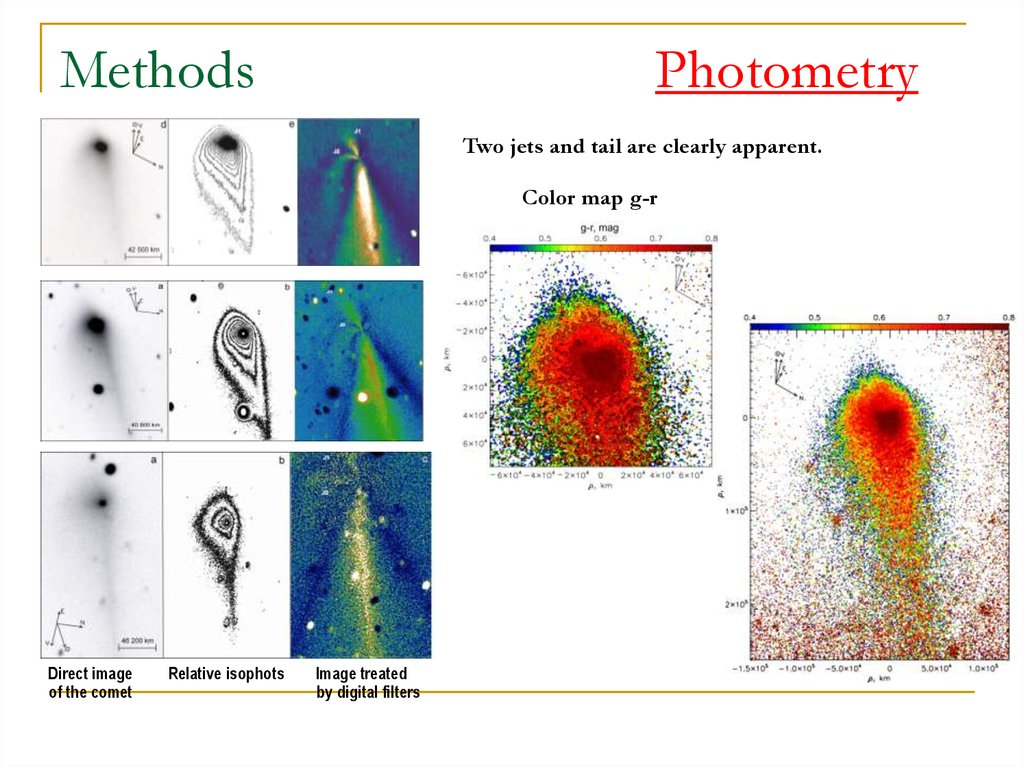
MethodsPhotometry
Two jets and tail are clearly apparent.
Color map g-r
Direct image
of the comet
Relative isophots
Image treated
by digital filters
10.
MethodsSpectroscopy
Long-slit spectroscopy of the comet was performed at the
6-m telescope BTA with the multi-mode focal reducer
SCORPIO-2. The gratings VPHG2400 (3600–7070 Å,
=5 Å) and VPHG2400 (3600–5100 Å, =4 Å) and slits
6.1' × 1.0”, 6.1’ × 2.0”were used.
November 8.078, 2015
r=1.62 au, ∆=1.80 au
a
b
December 9.09, 2016
r=1.84 au, ∆=1.72 au
December 9.093, 2015
r=1.84 au, ∆=1.72 au, =31.8
c
April 4.928, 2016
r=2.72 au, ∆=1.81 au
S(3600, 7070) = 12.5 %/1000 Å
The long-slit spectrum of comet 67P derived on November 8, 2015.
(a) – the raw spectrum; (b) – the distribution of energy in spectrum of the
comet; (c) – normalized reddening of the dust continuum vs wavelength.
The emission spectra of comet 67P and the modeled
spectra for comparison.
11.
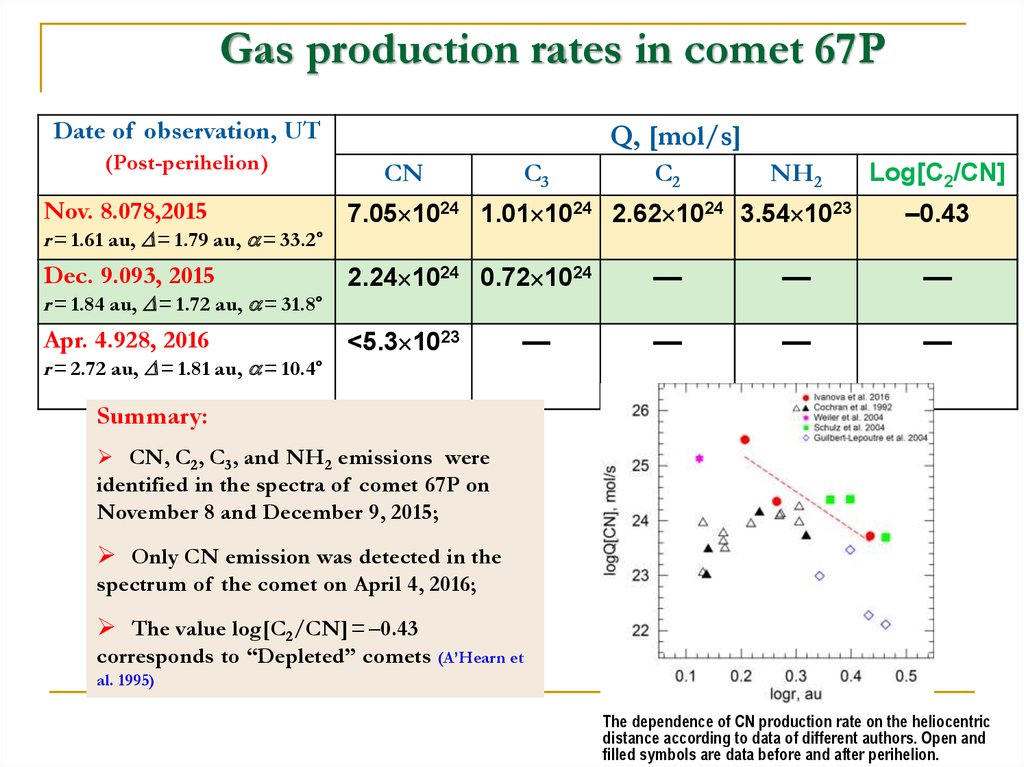
Gas production rates in comet 67PDate of observation, UT
(Post-perihelion)
Q, [mol/s]
CN
C3
C2
NH2
Nov. 8.078,2015
7.05 1024 1.01 1024 2.62 1024 3.54 1023
Dec. 9.093, 2015
2.24 1024 0.72 1024
Apr. 4.928, 2016
<5.3 1023
r = 1.61 au, = 1.79 au, = 33.2°
r = 1.84 au, = 1.72 au, = 31.8°
r = 2.72 au, = 1.81 au, = 10.4°
––
Log[C2/CN]
–0.43
––
––
––
––
––
––
Summary:
CN, C2, C3, and NH2 emissions were
identified in the spectra of comet 67P on
November 8 and December 9, 2015;
Only CN emission was detected in the
spectrum of the comet on April 4, 2016;
The value log[C2/CN]= –0.43
corresponds to “Depleted” comets (A’Hearn et
al. 1995)
The dependence of CN production rate on the heliocentric
distance according to data of different authors. Open and
filled symbols are data before and after perihelion.
12. Methods Polarimetry
MethodsNovember 8, 2015
r=1.62 au
∆=1.80 au
=33.2
Polarimetry
December 9, 2015
April 5, 2016
r=1.84 au
∆=1.72 au
=31.8
r=2.72 au
∆=1.81 au
=10.4
Distribution of linear polarization over the coma of comet 67P.
Linear polarization maps: there is a complex structure of the coma in
polarized light with areas of high and low polarization
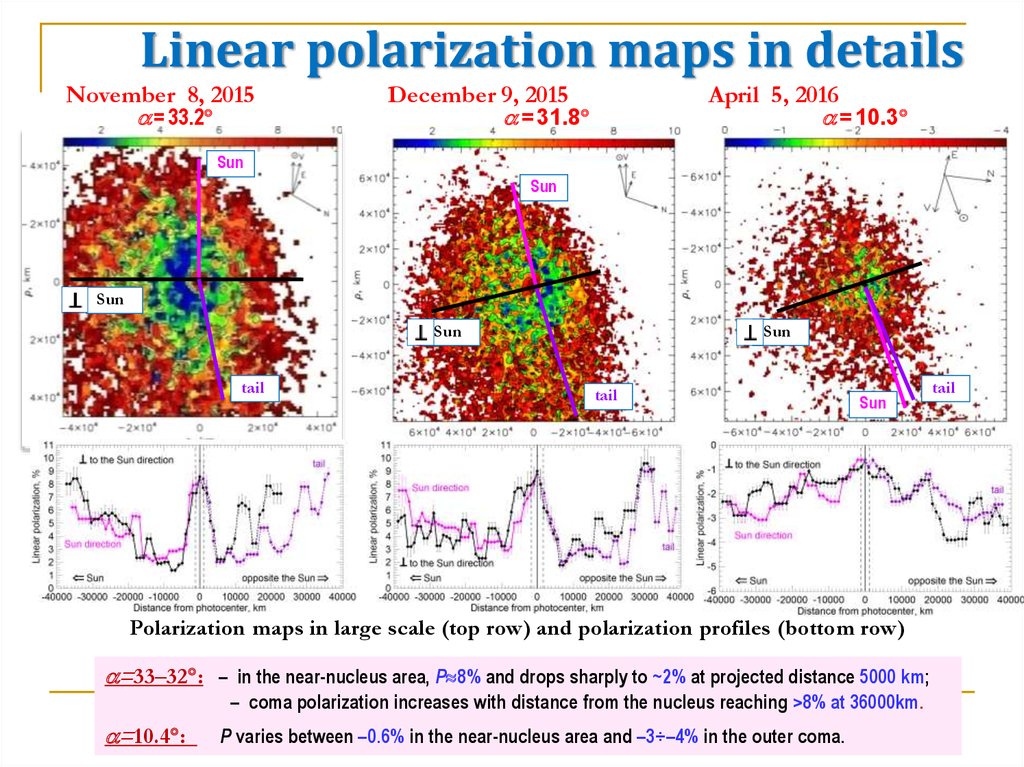
13.
Linear polarization maps in detailsNovember 8, 2015
= 33.2
December 9, 2015
= 31.8
April 5, 2016
= 10.3
Sun
Sun
Sun
Sun
tail
Sun
tail
Sun
Polarization maps in large scale (top row) and polarization profiles (bottom row)
=33–32 : – in the near-nucleus area, P 8% and drops sharply to ~2% at projected distance 5000 km;
– coma polarization increases with distance from the nucleus reaching >8% at 36000km.
=10.4 :
P varies between –0.6% in the near-nucleus area and –3÷–4% in the outer coma.
tail
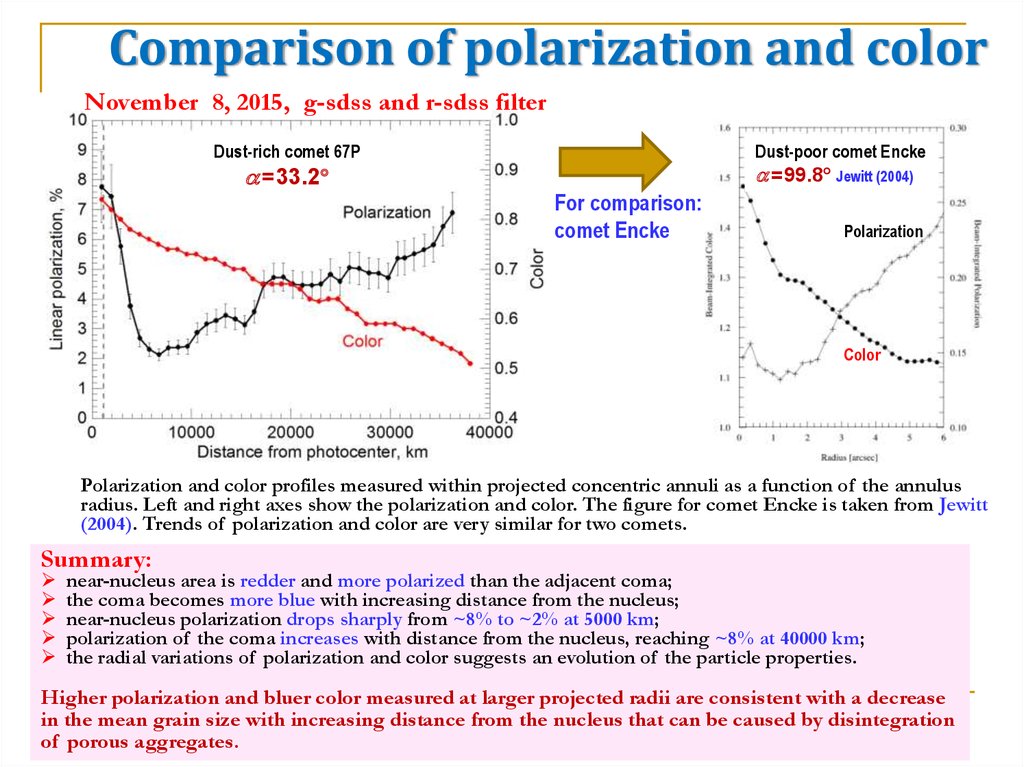
14.
Comparison of polarization and colorNovember 8, 2015, g-sdss and r-sdss filter
Dust-rich comet 67P
=33.2
Dust-poor comet Encke
= 99.8 Jewitt (2004)
For comparison:
comet Encke
Polarization
Color
Polarization and color profiles measured within projected concentric annuli as a function of the annulus
radius. Left and right axes show the polarization and color. The figure for comet Encke is taken from Jewitt
(2004). Trends of polarization and color are very similar for two comets.
Summary:
near-nucleus area is redder and more polarized than the adjacent coma;
the coma becomes more blue with increasing distance from the nucleus;
near-nucleus polarization drops sharply from ~8% to ~2% at 5000 km;
polarization of the coma increases with distance from the nucleus, reaching ~8% at 40000 km;
the radial variations of polarization and color suggests an evolution of the particle properties.
Higher polarization and bluer color measured at larger projected radii are consistent with a decrease
in the mean grain size with increasing distance from the nucleus that can be caused by disintegration
of porous aggregates.
15.
Circular polarizationCP in other comets
November 08, 2015, =33.2
Circular polarization map
Comparison with
comets showing
CP and comets
with CP ≈ 0%
(–0.08 ± 0.02)%
((–0.12÷–0.4) ± 0.01)%
C/2009 P1 (Garradd)
C/2011 R1 (McNaught)
Comets with CP ≈ 0%
67P/Churyumov–Gerasimenko
290P/Jager
(–0.01 ± 0.01)%
Circular polarization has not
been registered in comet 67P
(–0.005 ± 0.01)%
108P/Criffeo
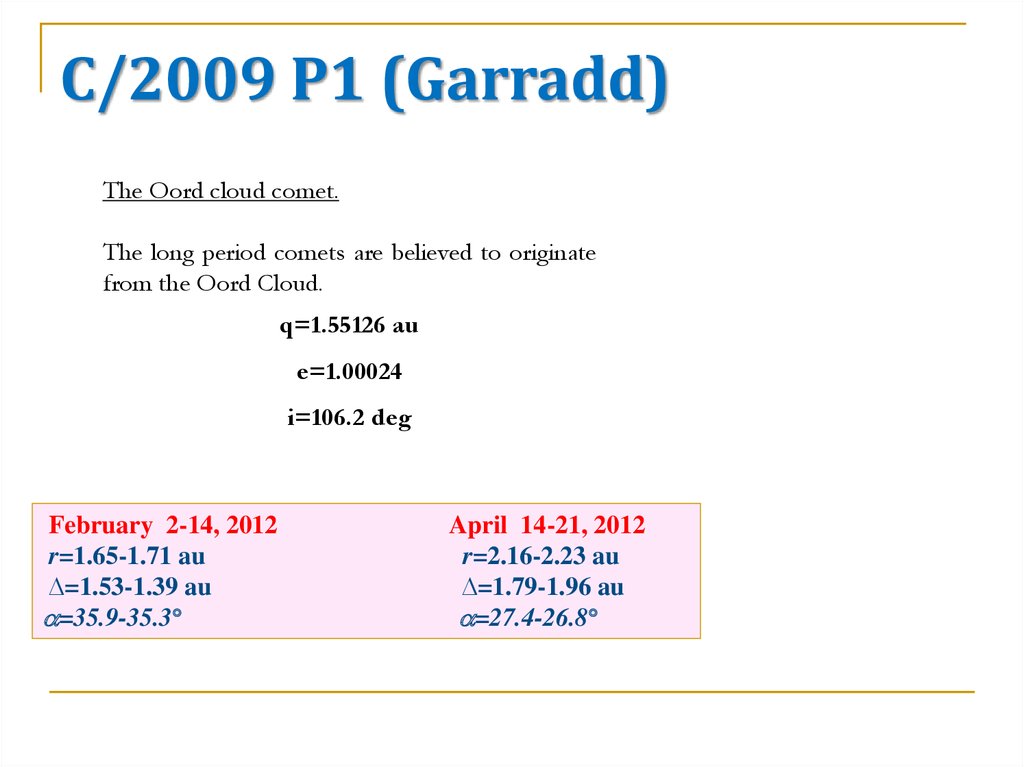
16.
C/2009 P1 (Garradd)The Oord cloud comet.
The long period comets are believed to originate
from the Oord Cloud.
q=1.55126 au
e=1.00024
i=106.2 deg
February 2-14, 2012
r=1.65-1.71 au
∆=1.53-1.39 au
=35.9-35.3
April 14-21, 2012
r=2.16-2.23 au
∆=1.79-1.96 au
=27.4-26.8
17.
MethodsPhotometry
Two features (dust and gas tails)
oriented in the solar and antisolar
directions were revealed in treated
images of comet Garradd that
allowed us to determine the period
of rotation of the nucleus as
11.1±0.8 hours.
18.
MethodsSpectroscopy
a
Long-slit spectroscopy of the comet
was performed at the 6-m telescope
BTA with the multi-mode focal
reducer SCORPIO-2. slit 6.1' × 1.0”
was used.
• Emission bands of
neutral molecules such as C2,
C3, CN, CH, and NH2 as well
as CO+ and H2O+ ions were
identified in the spectra of the
comet Garradd.
•Long-slit spectroscopy of the
comet. The comet is “CO-rich”
19. Methods Spectropolarimetry
MethodsThe long-slit spectra of comet Garradd obtained at
phase angle 35.9 on February 2.086, 2012. The top
and bottom panels display the integral intensity and
the degree of linear polarization as a function of
wavelength in 3×10 arcsec (3329×11097 km) area
around the center of the comet.
Spectropolarimetry
The long-slit spectra of comet Garradd
obtained at phase angle 27.4 on April
14.864, 2012. The area measured around the
optocenter of the comet is 3×10 arcsec
(3916×13055 km). The notations are the
same as in Fig. 9.
Ivanova O., Rosenbush V.K., Afanasiev V.L., Kiselev N.N., Polarimetry, photometry, and spectroscopy of
comet C/2009 P1 (Garradd), 2016 accepted to Icarus
20.
Circular polarization• The significant lefthanded (negative)
circular polarization was
detected at distances up
to 3×10⁴ km from the
cometary nucleus with
values from about –
0.06% to –0.5% (with
errors 0.02%) on
February 14 and April
21, respectively.
• There is some
systematic
increase in the degree
of circular polarization
to the outer edge of the
coma on April 21.
21.
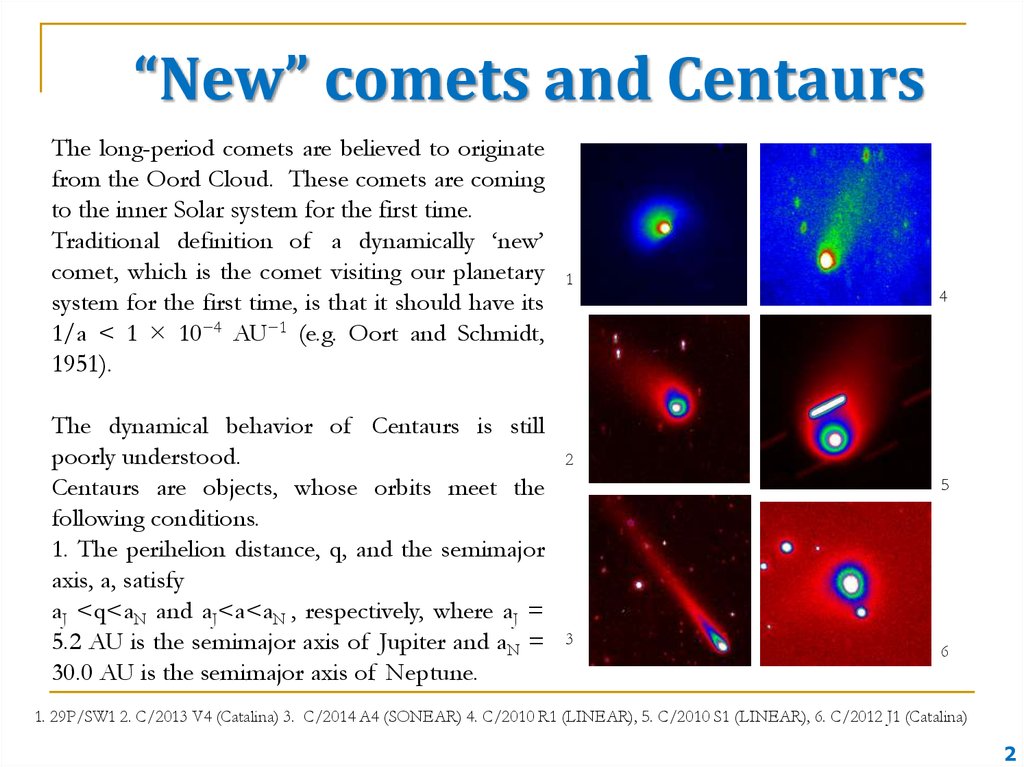
“New” comets and CentaursThe long-period comets are believed to originate
from the Oord Cloud. These comets are coming
to the inner Solar system for the first time.
Traditional definition of a dynamically ‘new’
comet, which is the comet visiting our planetary
system for the first time, is that it should have its
1/a < 1 × 10⁻⁴ AU−1 (e.g. Oort and Schmidt,
1951).
The dynamical behavior of Centaurs is still
poorly understood.
Centaurs are objects, whose orbits meet the
following conditions.
1. The perihelion distance, q, and the semimajor
axis, a, satisfy
aJ <q<aN and aJ<a<aN , respectively, where aJ =
5.2 AU is the semimajor axis of Jupiter and aN =
30.0 AU is the semimajor axis of Neptune.
1
4
2
5
3
6
1. 29P/SW1 2. C/2013 V4 (Catalina) 3. C/2014 A4 (SONEAR) 4. C/2010 R1 (LINEAR), 5. C/2010 S1 (LINEAR), 6. C/2012 J1 (Catalina)
2
22. C/2010 R1 (LINEAR)
2013, Feb. 6r = 5.9 AU
= 5.6 AU
= 9.2
Filter R
23. C/2014 A4 (SONEAR)
2015, Nov. 5r = 4.21AU
= 3.28 AU
= 4.9
Filter R
24. C/2013 V4 (Catalina)
2015, Nov. 6r = 5.19 AU
= 4.96 AU
= 9.4
Filter R
25. C/2012 J1 (Catalina)
2012, Nov. 15r = 3.17 AU
= 2.45 AU
= 14.02
26. 29P/Schwassmann-Wachmann 1
Intensity2012, Feb 14
r = 6.26 AU
= 5.51 AU
= 6.3
Filter 6840 Å
Linear
polarization
jet
27.
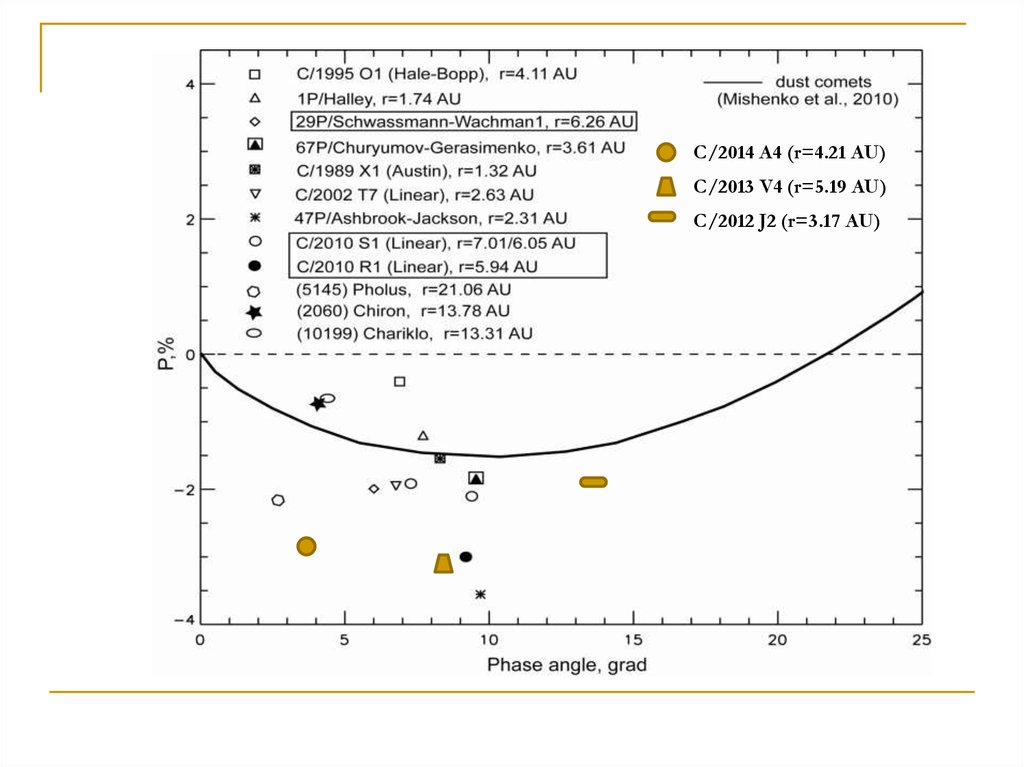
C/2014 A4 (r=4.21 AU)C/2013 V4 (r=5.19 AU)
C/2012 J2 (r=3.17 AU)
28.
29. 174P/Echeclus
August, 2016We obtained new observations of an outburst of Centaur 174P/Echeclus at a
heliocentric distance of 6.2 au and determined dust production rates and dust
colors. We found changes in the dust productivity and morphology of the
coma compared to the last outburst. Based on photometrical data, we analyzed
the color slope using the model of agglomerated debris particles.
Article in preparation
30. PRODUCTION RATE Q(O1D)
Radial velocity:From observations: 9.3 ± 0.3
km/s
From Ephemeris: 9.5 km/s
Table 2. Q(O1D) production rate for comets
Comet
Bennet 1970 II1
1P/Halley2
C/1990 V (Austin)3
C/1995 O1 (Halle-Bopp)4
252P/(LINEAR)5
1Delseme
Date, UT
Apr 18,1970
Jan 16, 1986
May 16,
1990
Mar 5, 1997
Apr 5, 2016
0.841
0.790
1.035
Q(O1D),
atom/s
2.8 1028
2.9 1030
1.2 1028
1.029
1.030
3.21 1030
6.1 1025
r, au
and Combi, 1976; 3Schultz et al., 1993; 4Morgenthaler et al., 2001;
5This work
atom/s