")
")


")


")


 Экономика
Похожие презентации:

")

")

. Unit 1. The capitalist revolution")


")

Macroeconomics Productivity GDP per capita Venezuela. (Lecture 6)
1. Productivity / GDP per capita & GDP (PPP)
Productivity / GDP percapita & GDP (PPP)
Prof. Zharova Liubov
Zharova_l@ua.fm
2. GDP Per Capita / GDP PPP (purchasing parity power)
GDP per capita = GDP / Population (number of people in the country)The per capita GDP is especially useful when comparing one
country to another, because it shows the relative performance of
the countries. A rise in per capita GDP signals growth in the
economy and tends to reflect an increase in productivity.
3. Why do we need GDP per capita?
sometimes used as an indicator of standard of living,with higher per capita GDP equating to a higher
standard of living.
NB: A standard of living is the level of wealth, comfort, material goods
and necessities available to a certain socioeconomic class or a
certain geographic area. The standard of living includes factors such
as income, gross domestic product, national economic growth,
economic and political stability, political and religious freedom,
environmental quality, climate, and safety. The standard of living is
closely related to quality of life.
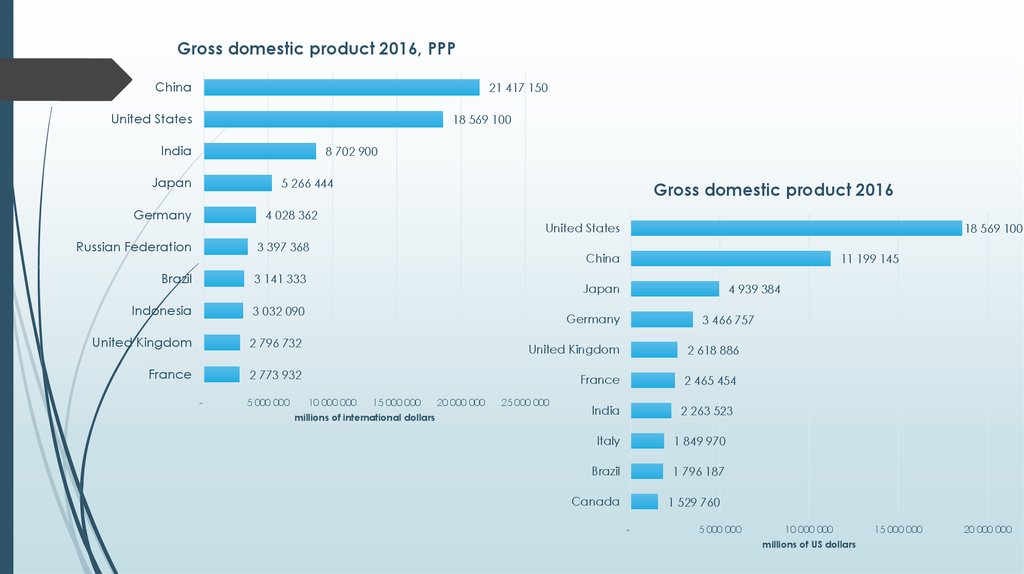
4.
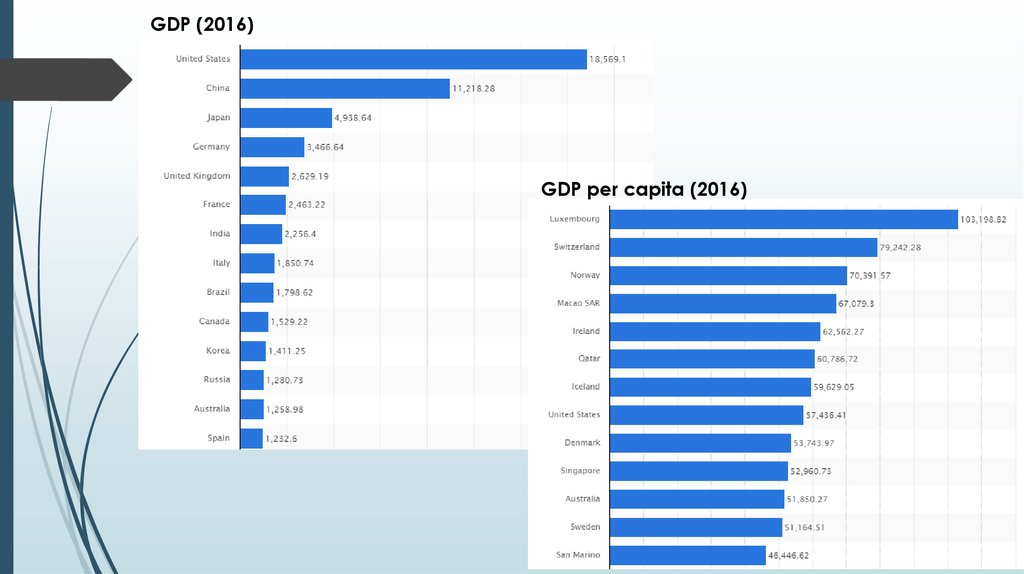
GDP (2016)GDP per capita (2016)
5. Why do we need GDP per capita?
can also be used to measure the productivity of acountry's workforce, as it measures the total output
of goods and services per each member of the
workforce in a given nation. (better measure of worker
productivity may be GDP per hours worked (?) - per capita GDP does not take
into account the influence of technology over a worker's output. If two
countries each have a workforce that possesses an equal measure of per
capita GDP, it appears that both nations hold an equal standard of living.
However, a further examination of GDP per hours worked offers a different view
of worker efficiency. The country with the lower GDP per hours worked actually
enjoys more leisure time.)
Methodology: Productivity is calculated by dividing each
country's GDP by the average number of hours worked annually
by all employed citizens. Hours worked include full-time and
part-time workers, excluding holidays and vacation time.
6. The most productive countries (2015)
RankCountry
GDP per hour
worked, USD
Employed
Population
GDP (USD)
Average work
week (hrs)
1
Luxembourg
93.4
405,600
57b
29
2
Ireland
87.3
1,989,400
302b
33.5
3
Norway
81.3
2,753,000
318b
27.3
4
Belgium
69.7
4,601,200
498b
29.8
5
United States
68.3
151,000,000
18,037b
33.6
6
Denmark
67.6
2,829,000
270b
27.2
7
France
65.6
27,523,000
2,648b
28.2
8
9
Germany
Netherlands
65.5
65.4
43,057,000
8,792,000
3,857b
818b
26.3
27.4
10
Switzerland
64.2
4,962,600
506b
30.6
NB: Working longer hours doesn't necessarily result in increased productivity. Mexico—the least productive
of the 38 countries listed in 2015 data from the Organization for Economic Cooperation and Development
(OECD)—has the world's longest average work week at 41.2 hours (including full-time and part-time
workers). At the other end of the spectrum, Luxembourg, the most productive country, has an average
workweek of just 29 hours.
7.
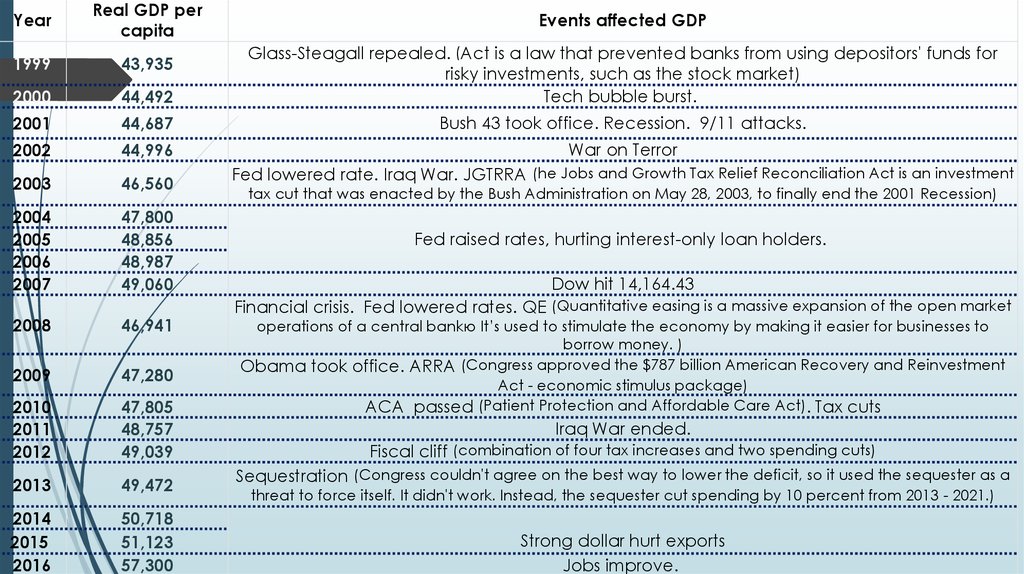
YearReal GDP per
capita
1999
43,935
2000
44,492
Glass-Steagall repealed. (Act is a law that prevented banks from using depositors' funds for
risky investments, such as the stock market)
Tech bubble burst.
2001
44,687
Bush 43 took office. Recession. 9/11 attacks.
2002
44,996
War on Terror
2003
46,560
2004
2005
2006
2007
47,800
48,856
48,987
49,060
2008
46,941
2009
47,280
2010
2011
2012
47,805
48,757
49,039
2013
49,472
2014
2015
2016
50,718
51,123
57,300
Events affected GDP
Fed lowered rate. Iraq War. JGTRRA (he Jobs and Growth Tax Relief Reconciliation Act is an investment
tax cut that was enacted by the Bush Administration on May 28, 2003, to finally end the 2001 Recession)
Fed raised rates, hurting interest-only loan holders.
Dow hit 14,164.43
Financial crisis. Fed lowered rates. QE (Quantitative easing is a massive expansion of the open market
operations of a central bankю It’s used to stimulate the economy by making it easier for businesses to
borrow money. )
Obama took office. ARRA (Congress approved the $787 billion American Recovery and Reinvestment
Act - economic stimulus package)
ACA passed (Patient Protection and Affordable Care Act). Tax cuts
Iraq War ended.
Fiscal cliff (combination of four tax increases and two spending cuts)
Sequestration (Congress couldn't agree on the best way to lower the deficit, so it used the sequester as a
threat to force itself. It didn't work. Instead, the sequester cut spending by 10 percent from 2013 - 2021.)
Strong dollar hurt exports
Jobs improve.
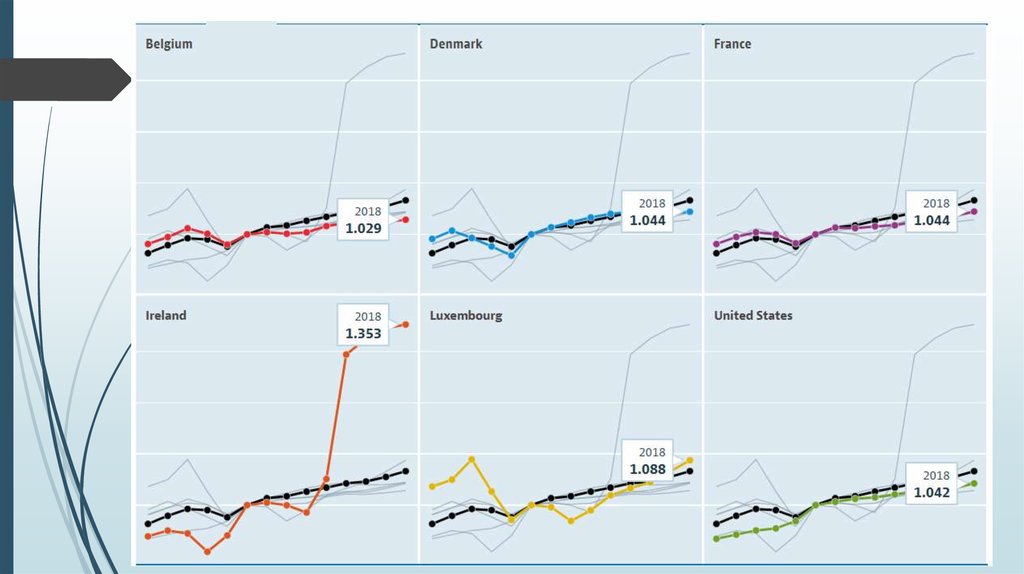
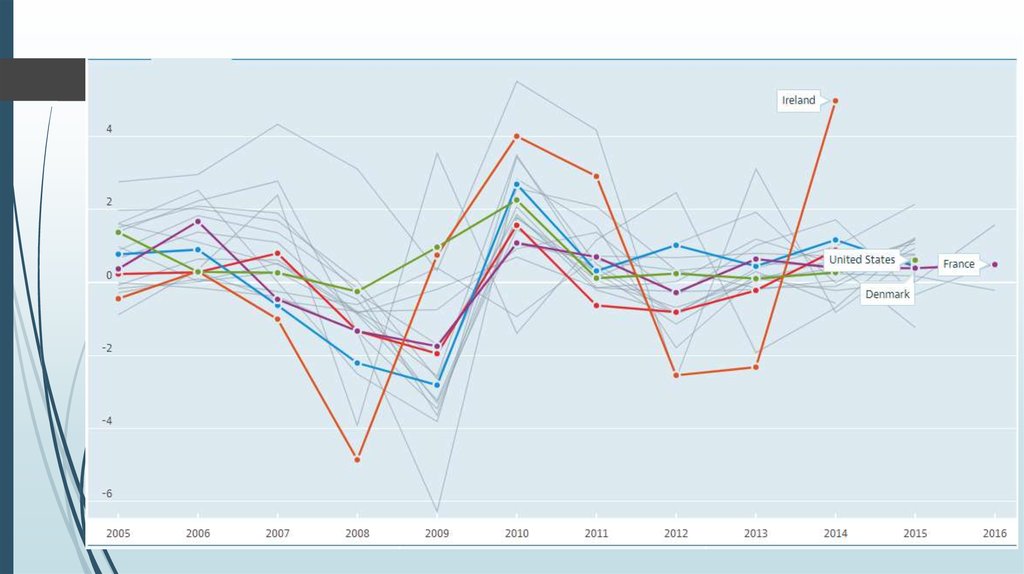
8. Labour productivity
Labour productivity is defined as real gross domestic product (GDP)per hour worked.
This captures the use of labour inputs better than just output per
employee, with labour input defined as total hours worked by all
persons involved.
The data are derived as average hours worked multiplied by the
corresponding and consistent measure of employment for each
particular country. Forecast is based on an assessment of the
economic climate in individual countries and the world economy,
using a combination of model-based analyses and expert judgement.
This indicator is measured as an index with 2010=1.
9.
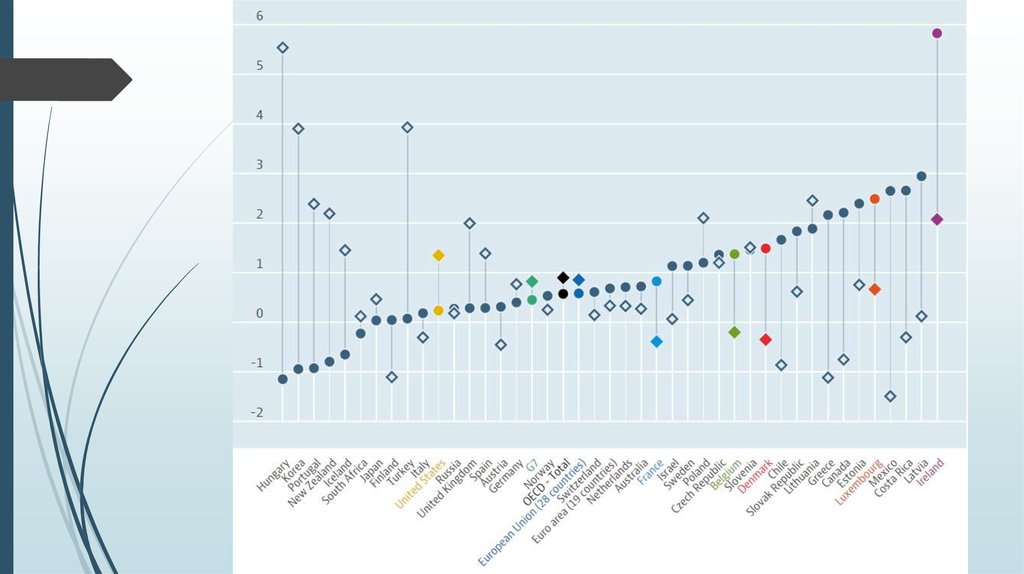
10. Labour productivity and utilization
Labour productivity growth is a key dimension of economicperformance and an essential driver of changes in living standards.
Growth in gross domestic product (GDP) per capita can be broken
down into growth in labour productivity, measured as growth in
GDP per hour worked, and changes in the extent of labour
utilisation, measured as changes in hours worked per capita. High
labour productivity growth can reflect greater use of capital,
and/or a decrease in the employment of low-productivity workers,
or general efficiency gains and innovation
11.
12. Multifactor productivity
Multifactor productivity (MFP) reflects the overall efficiency withwhich labour and capital inputs are used together in the production
process. Changes in MFP reflect the effects of changes in
management practices, brand names, organizational change,
general knowledge, network effects, spillovers from production
factors, adjustment costs, economies of scale, the effects of
imperfect competition and measurement errors.
Growth in MFP is measured as a residual, i.e. that part of GDP growth
that cannot be explained by changes in labour and capital inputs. In
simple terms therefore, if labour and capital inputs remained
unchanged between two periods, any changes in output would reflect
changes in MFP. This indicator is measured as an index and in annual
growth rates.
13.
14. What Is Purchasing Power Parity?
Macroeconomic analysis relies on several different metrics to compareeconomic productivity and standards of living between countries and
across time. One popular metric is purchasing power parity (PPP).
Purchasing Power Parity (PPP) is an economic theory that compares
different countries' currencies through a market "basket of goods"
approach. According to this concept, two currencies are in equilibrium or
at par when a market basket of goods (taking into account the exchange
rate) is priced the same in both countries.
S=