


 Информатика
Похожие презентации:

 and the fundamental tree algorithm")


Graphs of motion draw and analyze
1.
GRAPHS OF MOTIONDRAW AND ANALYZE
Distance – Time Graph
Displacement– Time Graph
Velocity – Time Graph
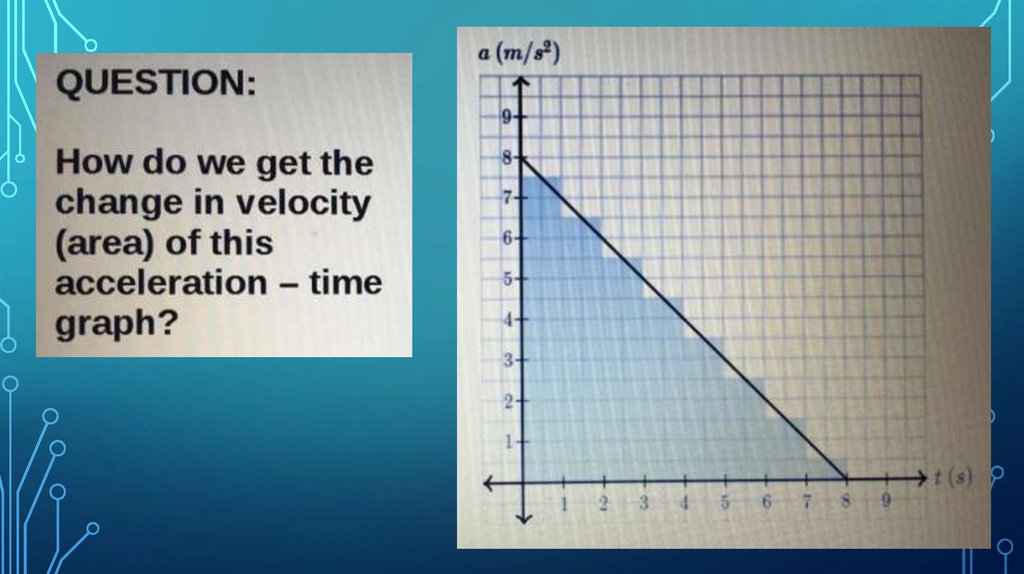
Acceleration – Time Graph
2.
Learning Objectives:Plot and interpret distance – time,
displacement – time, velocity – time,
and acceleration – time graphs
calculating the area under velocity –
time graph to work out distance
travelled for motion with constant
velocity or constant acceleration.
3.
RecallDefine the following:
a. Time
b. Distance
c. Displacement
d. Speed
e. Velocity
f. Acceleration
4.
Difference betweenDistance – time graph from
Displacement – time graph
* The position-time graph (x-t) is the
same as displacement-time graph. This
graph will tell you the exact change in
position of a body (using the shortest
path between the initial and final
point), irrespective of the actual path
used (that is called displacement), with
respect to time.
5.
Difference betweenDistance – time graph from
Displacement – time grap
A distance-time graph, on the other hand,
will tell you the distance covered, that is the
exact length of the actual path used to travel
from initial point to final point, with respect
to time.
6.
Plot the following data of a car traveling on a straight roadwith a constant speed, which is indicated by the speedometer
of the car. The driver measures the time the car takes to pass
every successive kilometers stone on the side of the road. He
finds that the car passes the first kilometers in 1 and ½ min.,
the second kilometre in 3 min. and so on. Thus he notes the
position of the car every one and a half minutes :
7.
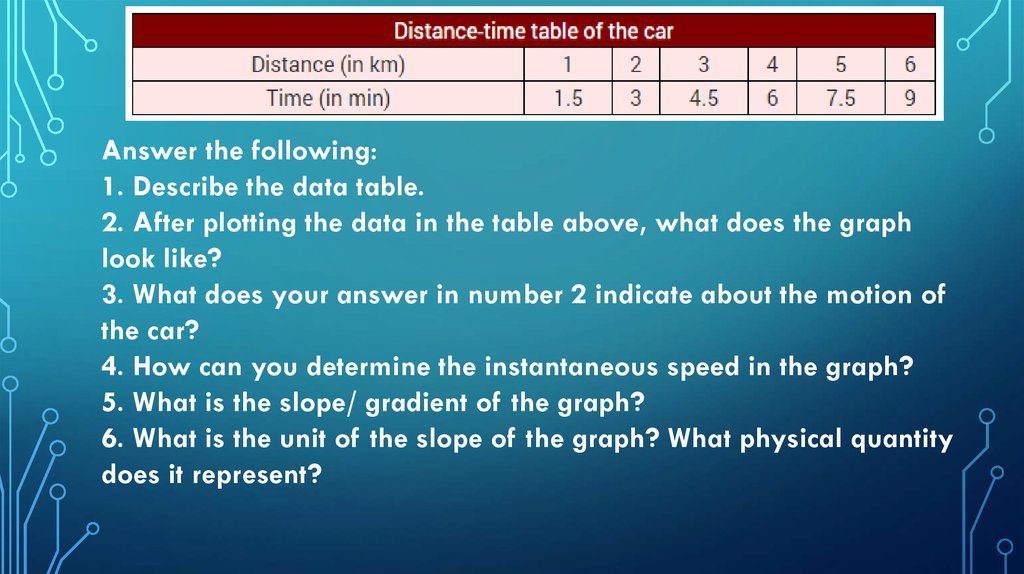
Answer the following:1. Describe the data table.
2. After plotting the data in the table above, what does the graph
look like?
3. What does your answer in number 2 indicate about the motion of
the car?
4. How can you determine the instantaneous speed in the graph?
5. What is the slope/ gradient of the graph?
6. What is the unit of the slope of the graph? What physical quantity
does it represent?
8.
Describe themotion of
the object
having a
graph like
this.
9.
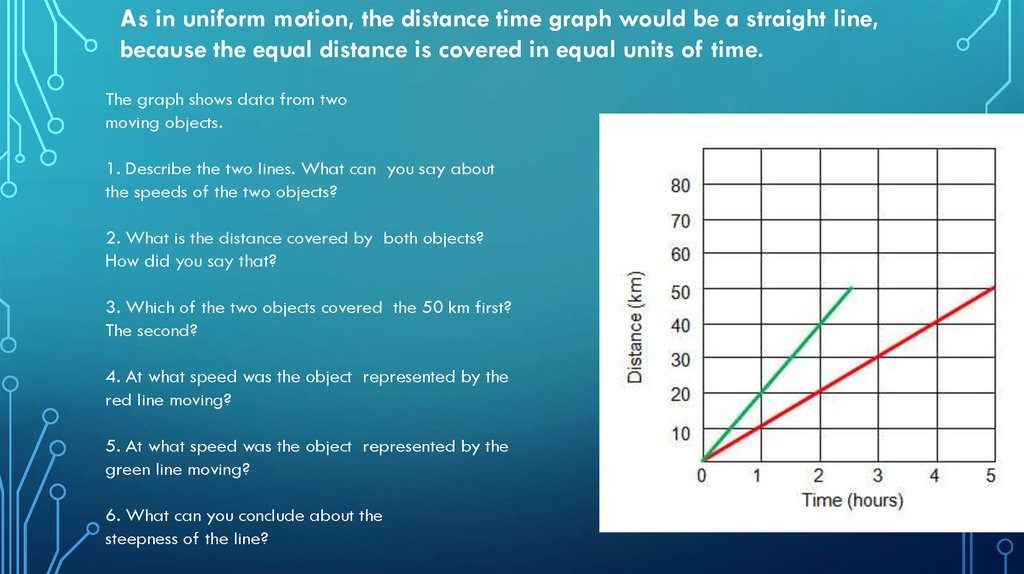
As in uniform motion, the distance time graph would be a straight line,because the equal distance is covered in equal units of time.
The graph shows data from two
moving objects.
1. Describe the two lines. What can you say about
the speeds of the two objects?
2. What is the distance covered by both objects?
How did you say that?
3. Which of the two objects covered the 50 km first?
The second?
4. At what speed was the object represented by the
red line moving?
5. At what speed was the object represented by the
green line moving?
6. What can you conclude about the
steepness of the line?
10.
As in uniform motion, the distance time graph would be astraight line, because the equal distance is covered in equal
units of time.
* You can see that there are three
bodies A, B and C, all of them are in
uniform motion then why do they have
different slopes?
** From graph in the right, what
conclusion can you make regarding the
speeds of the three bodies?
*** Which has the highest speed
(fastest) and which has the least speed
(slowest)?
11.
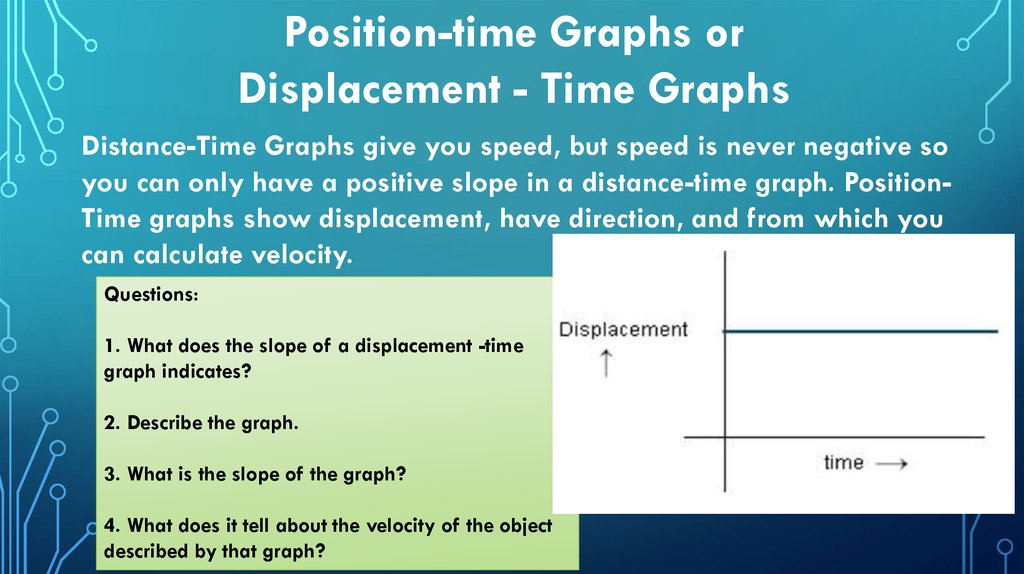
Position-time Graphs orDisplacement - Time Graphs
Distance-Time Graphs give you speed, but speed is never negative so
you can only have a positive slope in a distance-time graph. PositionTime graphs show displacement, have direction, and from which you
can calculate velocity.
Questions:
1. What does the slope of a displacement -time
graph indicates?
2. Describe the graph.
3. What is the slope of the graph?
4. What does it tell about the velocity of the object
described by that graph?
12.
Describe these graphs’:1. line
2. slope
3. velocity
13.
Some more displacement - time graphsexercises.
Displacement
(km)
1. What is the displacement
of the car travel in the first hour?
2. How far did the car travel in the
last hour?
Time (hr)
14.
1. What does displacement-time graph tells us?2. Describe the motion of the following lines:
A . green line
D. violet line
B. brown line
E. orange line
C. red line
F. light blue line
15.
Answers:1. D- t graphs tell us how far from an object has moved
with time.
2. A. fast and steady/ constant speed
B. decreasing velocity over time
C. steady/ constant velocity
D. stationary / at rest
E. returning to start with a constant velocity
F. increasing velocity over time
16.
* The velocity of an object is its speed in a particular direction. This means that two carstraveling at the same speed, but in opposite directions, have different velocities. One
velocity will be positive, and the velocity in the other direction will be negative.
* The vertical axis of a velocity-time graph is the velocity of the object and the horizontal
axis is the time taken from the start.
* When an object is moving with a constant velocity, the line on the graph is horizontal.
When an object is moving with a steadily increasing velocity, or a steadily decreasing
velocity, the line on the graph is straight, but sloped. The following diagram shows some
typical lines on a velocity-time graph..
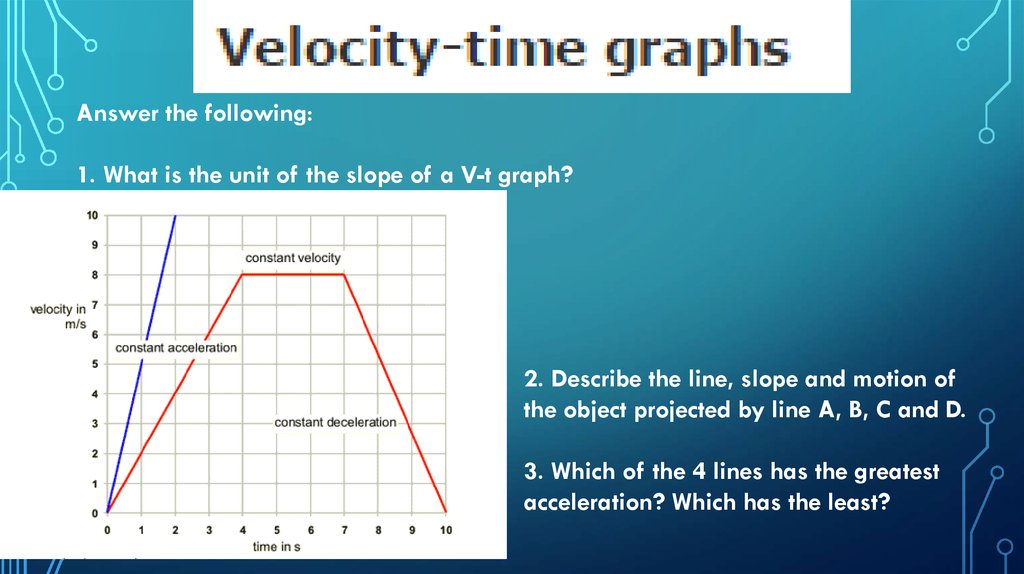
17.
Answer the following:1. What is the unit of the slope of a V-t graph?
2. Describe the line, slope and motion of
the object projected by line A, B, C and D.
3. Which of the 4 lines has the greatest
acceleration? Which has the least?
18.
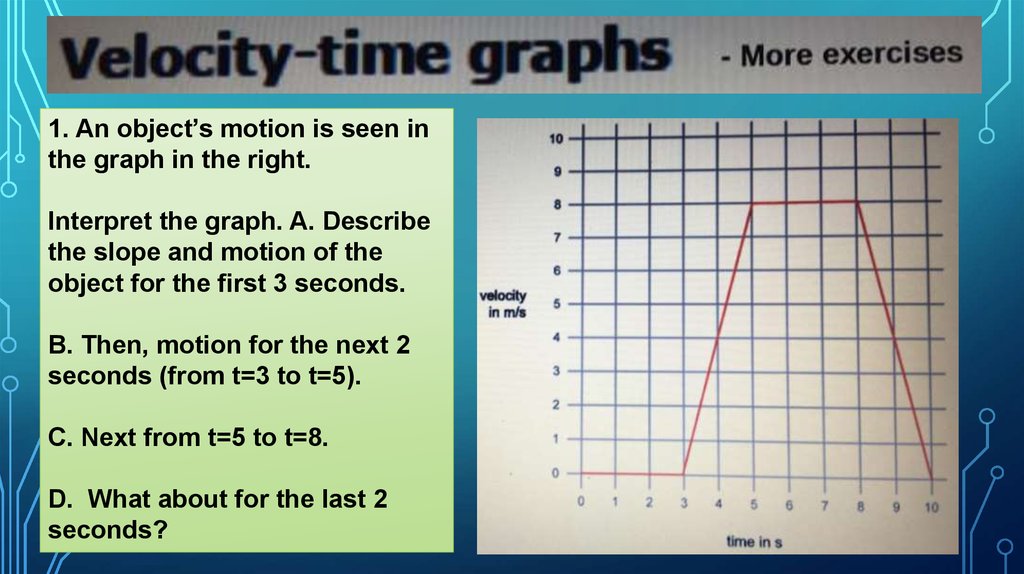
1. An object’s motion is seen inthe graph in the right.
Interpret the graph. A. Describe
the slope and motion of the
object for the first 3 seconds.
B. Then, motion for the next 2
seconds (from t=3 to t=5).
C. Next from t=5 to t=8.
D. What about for the last 2
seconds?
19.
2. Draw the velocity –time graph for this
displacement -time
graph.
20.
21.
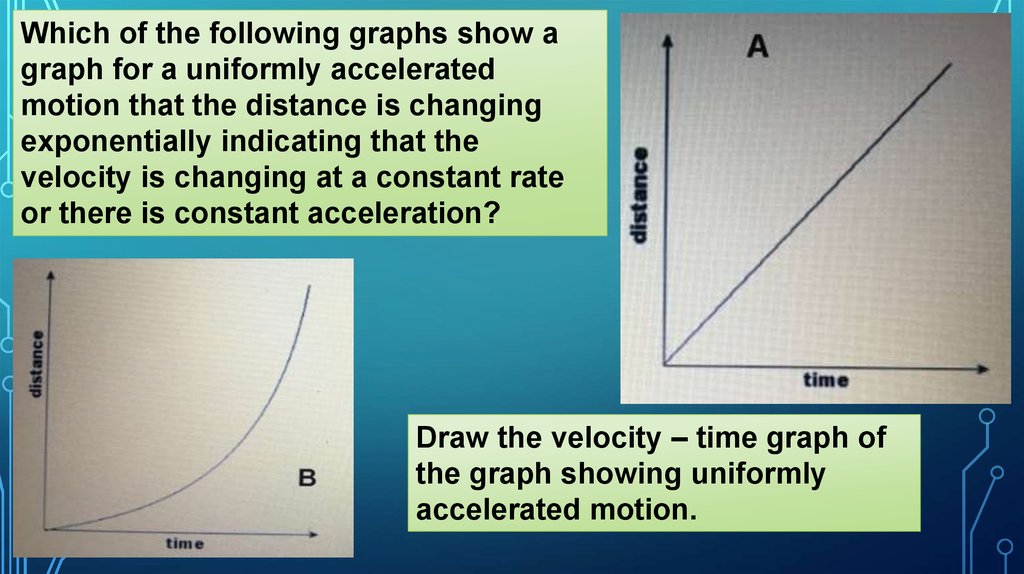
Which of the following graphs show agraph for a uniformly accelerated
motion that the distance is changing
exponentially indicating that the
velocity is changing at a constant rate
or there is constant acceleration?
Draw the velocity – time graph of
the graph showing uniformly
accelerated motion.
22.
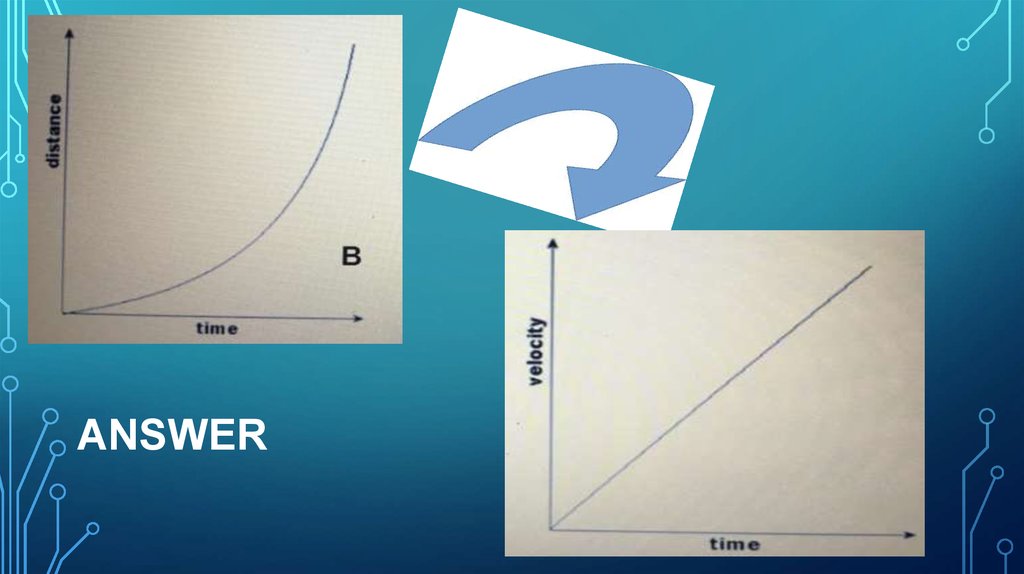
ANSWER23.
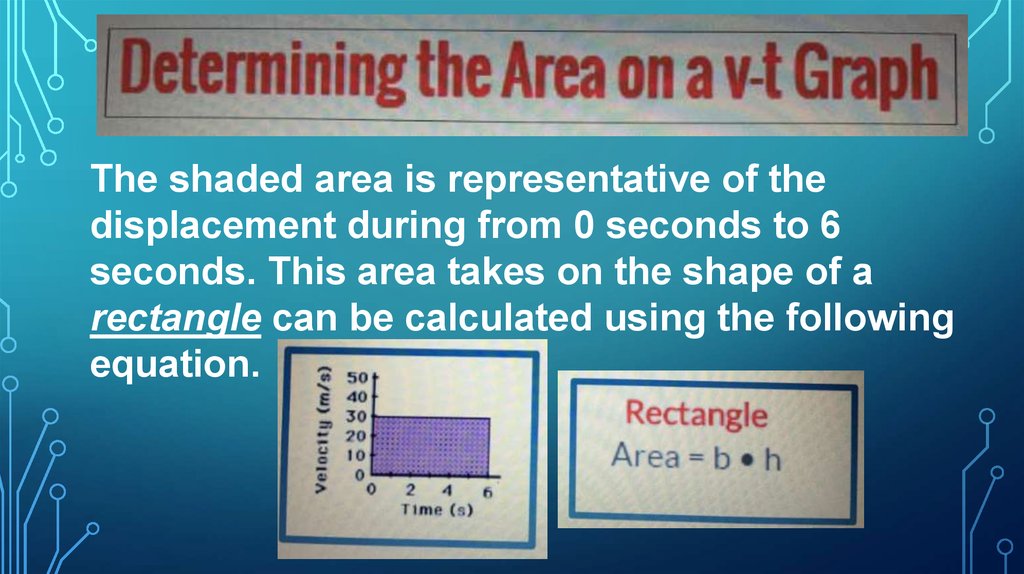
The shaded area is representative of thedisplacement during from 0 seconds to 6
seconds. This area takes on the shape of a
rectangle can be calculated using the following
equation.
24.
The shaded area is representative of thedisplacement during from 0 seconds to 4
seconds. This area takes on the shape of a
triangle can be calculated using the following
equation.
25.
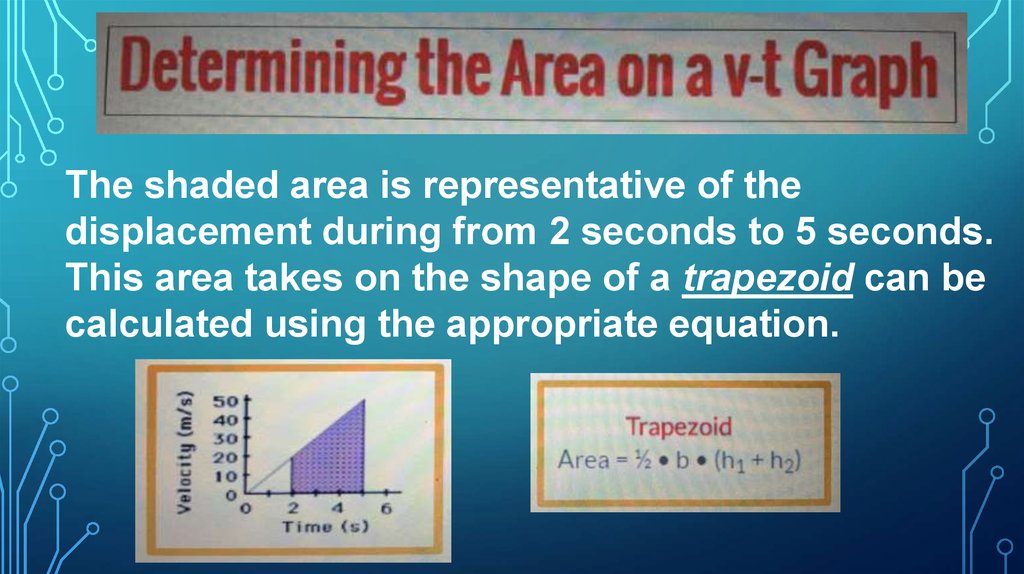
The shaded area is representative of thedisplacement during from 2 seconds to 5 seconds.
This area takes on the shape of a trapezoid can be
calculated using the appropriate equation.