


")


 Менеджмент
Похожие презентации:


. GANTT Charts")


Project Management
1. Project Management
Chapter 9Project Management
Operations Management - 5th Edition
Roberta Russell & Bernard W. Taylor, III
Copyright 2006 John Wiley & Sons, Inc.
Beni Asllani
University of Tennessee at Chattanooga
2. Lecture Outline
Project PlanningProject Scheduling
Project Control
CPM/PERT
Probabilistic Activity Times
Project Crashing and Time-Cost
Trade-off
Copyright 2006 John Wiley & Sons, Inc.
9-2
3. What is a Project?
Projectunique, one-time operational activity or effort
Examples
constructing houses, factories, shopping malls, athletic
stadiums or arenas
developing military weapons systems, aircrafts, new ships
launching satellite systems
constructing oil pipelines
developing and implementing new computer systems
planning concert, football games, or basketball tournaments
introducing new products into market
Copyright 2006 John Wiley & Sons, Inc.
9-3
4. Project Elements
ObjectiveScope
Contract requirements
Schedules
Resources
Personnel
Control
Risk and problem analysis
Copyright 2006 John Wiley & Sons, Inc.
9-4
5. Project Management Process
Project planningProject scheduling
Project control
Project team
made up of individuals from various areas and
departments within a company
Matrix organization
a team structure with members from functional areas,
depending on skills required
Project Manager
most important member of project team
Copyright 2006 John Wiley & Sons, Inc.
9-5
6. Project Scope
Scope statementa document that provides an understanding,
justification, and expected result of a project
Statement of work
written description of objectives of a project
Work breakdown structure
breaks down a project into components,
subcomponents, activities, and tasks
Copyright 2006 John Wiley & Sons, Inc.
9-6
7.
Work Breakdown Structure for Computer OrderProcessing System Project
Copyright 2006 John Wiley & Sons, Inc.
9-7
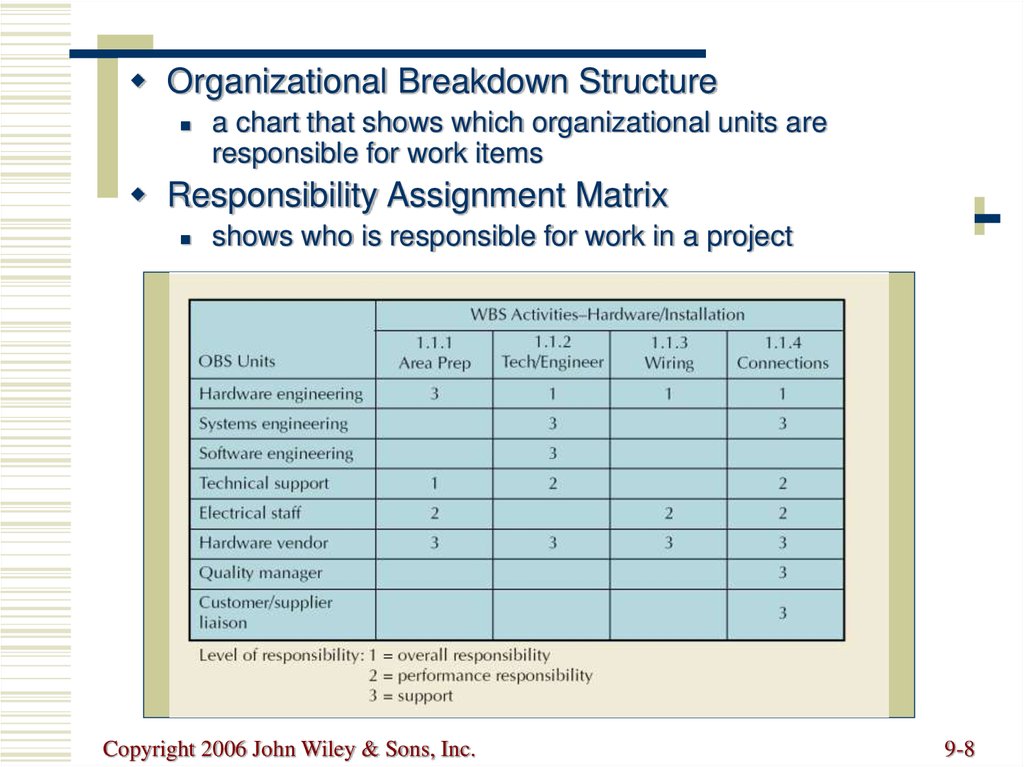
8.
Organizational Breakdown Structurea chart that shows which organizational units are
responsible for work items
Responsibility Assignment Matrix
shows who is responsible for work in a project
Copyright 2006 John Wiley & Sons, Inc.
9-8
9. Project Scheduling
StepsDefine activities
Sequence
activities
Estimate time
Develop schedule
Copyright 2006 John Wiley & Sons, Inc.
Techniques
Gantt chart
CPM
PERT
Microsoft Project
9-9
10. Gantt Chart
Graph or bar chart with a bar for eachproject activity that shows passage of
time
Provides visual display of project
schedule
Slack
amount of time an activity can be delayed
without delaying the project
Copyright 2006 John Wiley & Sons, Inc.
9-10
11. Example of Gantt Chart
0|
2
|
Month
4
|
6
|
8
|
10
Activity
Design house
and obtain
financing
Lay foundation
Order and
receive
materials
Build house
Select paint
Select carpet
Finish work
1
3
5
7
9
Month
Copyright 2006 John Wiley & Sons, Inc.
9-11
12. Project Control
Time managementCost management
Quality management
Performance management
Earned Value Analysis
a standard procedure for numerically measuring a
project’s progress, forecasting its completion date and
cost and measuring schedule and budget variation
Communication
Enterprise project management
Copyright 2006 John Wiley & Sons, Inc.
9-12
13. CPM/PERT
Critical Path Method (CPM)DuPont & Remington-Rand (1956)
Deterministic task times
Activity-on-node network construction
Project Evaluation and Review Technique
(PERT)
US Navy, Booz, Allen & Hamilton
Multiple task time estimates
Activity-on-arrow network construction
Copyright 2006 John Wiley & Sons, Inc.
9-13
14. Project Network
Activity-on-node (AON)nodes represent activities,
and arrows show
precedence relationships
Activity-on-arrow (AOA)
arrows represent activities
and nodes are events for
points in time
Event
Node
1
2
3
Branch
completion or beginning
of an activity in a project
Copyright 2006 John Wiley & Sons, Inc.
9-14
15. AOA Project Network for a House
3Lay
foundation
2
1
3
Design house
and obtain
financing
2
Dummy
Build
house
0
1
Order and
receive
materials
4
Select
paint
Finish
work
6
3
1
1
1
7
Select
carpet
5
Copyright 2006 John Wiley & Sons, Inc.
9-15
16.
Concurrent ActivitiesLay foundation
2
3
Lay
foundation
3
Order material
(a) Incorrect precedence
relationship
Copyright 2006 John Wiley & Sons, Inc.
2
Dummy
2
0
1
4
Order material
(b) Correct precedence
relationship
9-16
17. AON Network for House Building Project
Lay foundationsBuild house
4
3
2
2
Start
Finish work
7
1
1
3
Design house
and obtain
financing
3
1
Order and receive
materials
Copyright 2006 John Wiley & Sons, Inc.
5
1
6
1
Select carpet
Select paint
9-17
18.
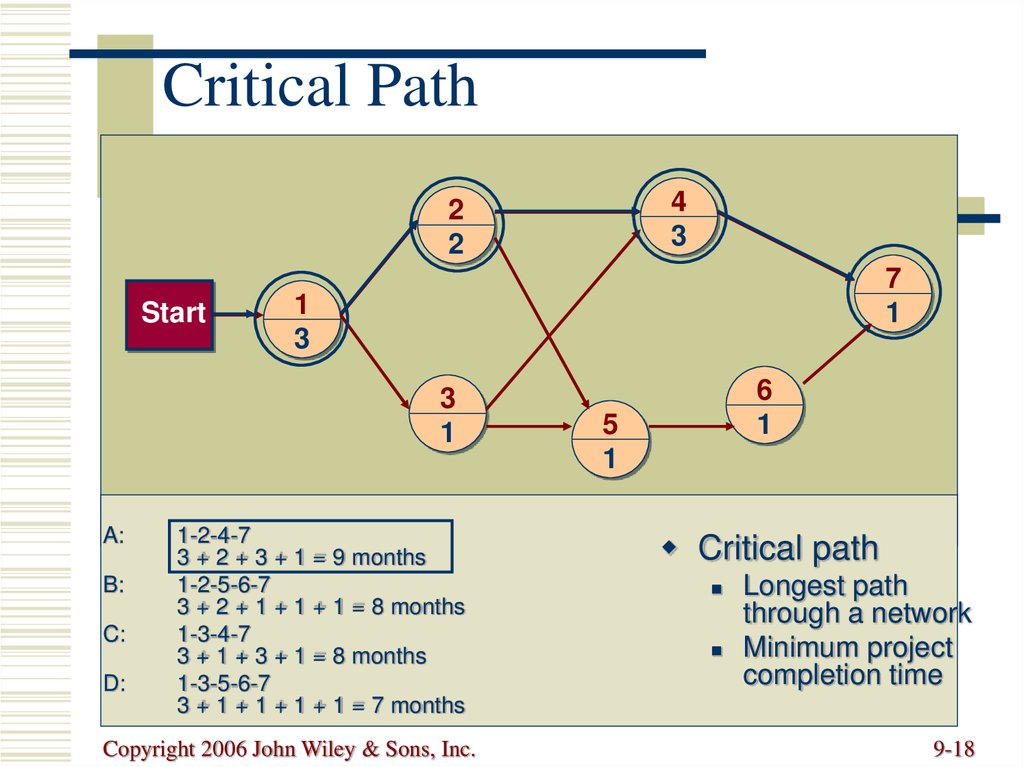
Critical Path4
3
2
2
Start
7
1
1
3
3
1
A:
B:
C:
D:
1-2-4-7
3 + 2 + 3 + 1 = 9 months
1-2-5-6-7
3 + 2 + 1 + 1 + 1 = 8 months
1-3-4-7
3 + 1 + 3 + 1 = 8 months
1-3-5-6-7
3 + 1 + 1 + 1 + 1 = 7 months
Copyright 2006 John Wiley & Sons, Inc.
6
1
5
1
Critical path
Longest path
through a network
Minimum project
completion time
9-18
19. Activity Start Times
Start at 5 months4
3
2
2
Start
Finish at 9 months
7
1
1
3
3
1
Start at 3 months
Copyright 2006 John Wiley & Sons, Inc.
5
1
Finish
6
1
Start at 6 months
9-19
20. Mode Configuration
Activity numberEarliest start
Earliest finish
1
0
3
3
0
3
Latest finish
Activity duration
Copyright 2006 John Wiley & Sons, Inc.
Latest start
9-20
21. Forward Pass
Start at the beginning of CPM/PERT network todetermine the earliest activity times
Earliest Start Time (ES)
earliest time an activity can start
ES = maximum EF of immediate predecessors
Earliest finish time (EF)
earliest time an activity can finish
earliest start time plus activity time
EF= ES + t
Copyright 2006 John Wiley & Sons, Inc.
9-21
22. Earliest Activity Start and Finish Times
Lay foundationsBuild house
2
Start
3
5
4
2
5
8
3
1
0
3
7
1
Design house
and obtain
financing
8
9
1
6
3
3
4
1
Order and receive
materials
Copyright 2006 John Wiley & Sons, Inc.
6
7
Finish work
1
5
5
6
1
Select carpet
Select pain
9-22
23. Backward Pass
Determines latest activity times by starting atthe end of CPM/PERT network and working
forward
Latest Start Time (LS)
Latest time an activity can start without delaying
critical path time
LS= LF - t
Latest finish time (LF)
latest time an activity can be completed without
delaying critical path time
LS = minimum LS of immediate predecessors
Copyright 2006 John Wiley & Sons, Inc.
9-23
24. Latest Activity Start and Finish Times
Lay foundationsBuild house
Start
2
3
5
2
3
5
4
5
8
3
5
8
1
0
3
7
8
9
1
0
3
1
8
9
Design house
and obtain
financing
3
3
4
1
4
5
Order and receive
materials
Copyright 2006 John Wiley & Sons, Inc.
5
1
5
6
6
6
7
1
7
8
Finish work
6
7
Select carpet
Select pain
9-24
25. Activity Slack
ActivityLS
ES
LF
EF
Slack S
*1
0
0
3
3
0
*2
3
3
5
5
0
3
4
3
5
4
1
*4
5
5
8
8
0
5
6
5
7
6
1
6
7
6
8
7
1
*7
8
8
9
9
0
* Critical Path
Copyright 2006 John Wiley & Sons, Inc.
9-25
26. Probabilistic Time Estimates
Beta distributiona probability distribution traditionally used in
CPM/PERT
a + 4m + b
Mean (expected time):
t=
6
Variance:
b-a
= 6
2
2
where
a = optimistic estimate
m = most likely time estimate
b = pessimistic time estimate
Copyright 2006 John Wiley & Sons, Inc.
9-26
27.
P(time)P(time)
Examples of Beta Distributions
a
m
t
b
a
t
Time
m
b
P(time)
Time
a
m=t
b
Time
Copyright 2006 John Wiley & Sons, Inc.
9-27
28. Project Network with Probabilistic Time Estimates: Example
Equipmentinstallation
1
4
6,8,10
2,4,12
System
development
Start
Equipment testing
and modification
2
3,6,9
Position
recruiting
System
training
8
Manual
testing
3,7,11
5
2,3,4
Final
debugging
10
1,4,7
Finish
11
9
Job Training
2,4,6
3
6
1,3,5
3,4,5
System
testing
1,10,13
System
changeover
Orientation
7
2,2,2
Copyright 2006 John Wiley & Sons, Inc.
9-28
29.
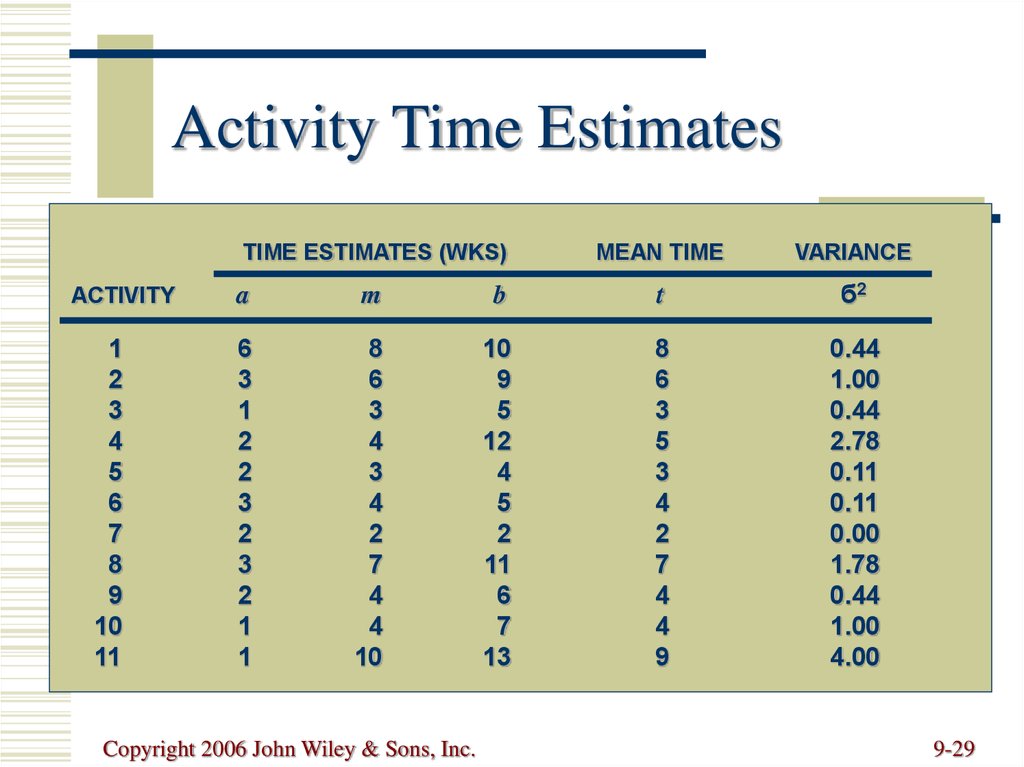
Activity Time EstimatesTIME ESTIMATES (WKS)
ACTIVITY
1
2
3
4
5
6
7
8
9
10
11
MEAN TIME
VARIANCE
a
m
b
t
б2
6
3
1
2
2
3
2
3
2
1
1
8
6
3
4
3
4
2
7
4
4
10
10
9
5
12
4
5
2
11
6
7
13
8
6
3
5
3
4
2
7
4
4
9
0.44
1.00
0.44
2.78
0.11
0.11
0.00
1.78
0.44
1.00
4.00
Copyright 2006 John Wiley & Sons, Inc.
9-29
30.
Activity Early, Late Times,and Slack
ACTIVITY
1
2
3
4
5
6
7
8
9
10
11
t
б
ES
EF
LS
LF
S
8
6
3
5
3
4
2
7
4
4
9
0.44
1.00
0.44
2.78
0.11
0.11
0.00
1.78
0.44
1.00
4.00
0
0
0
8
6
3
3
9
9
13
16
8
6
3
13
9
7
5
16
13
17
25
1
0
2
16
6
5
14
9
12
21
16
9
6
5
21
9
9
16
16
16
25
25
1
0
2
8
0
2
11
0
3
8
0
Copyright 2006 John Wiley & Sons, Inc.
9-30
31. Earliest, Latest, and Slack
1 08 1
Start
2 0
6 0
3 0
3 2
8
9
4 8
5 16 21
3
5
10 13 17
8 9
7 9
6
6
Critical Path
13
5 6
3 6
6 3
4 5
16
7
3
Finish
16
9
9
1 0
9 9 13
4 12 16
11 16 25
9 16 25
9
7 3 5
2 14 16
Copyright 2006 John Wiley & Sons, Inc.
9-31
32.
Total project variance2 = б22 + б52 + б82 + б112
= 1.00 + 0.11 + 1.78 + 4.00
= 6.89 weeks
Copyright 2006 John Wiley & Sons, Inc.
9-32
33. Probabilistic Network Analysis
Determine probability that project iscompleted within specified time
Z=
where
x-
= tp = project mean time
= project standard deviation
x = proposed project time
Z = number of standard deviations x
is from mean
Copyright 2006 John Wiley & Sons, Inc.
9-33
34. Normal Distribution Of Project Time
ProbabilityZ
= tp
Copyright 2006 John Wiley & Sons, Inc.
x
Time
9-34
35. Southern Textile Example
What is the probability that the project is completedwithin 30 weeks?
P(x 30 weeks)
= 6.89 weeks
2
=
6.89
= 2.62 weeks
Z=
=
x-
30 - 25
2.62
= 1.91
= 25 x = 30
Time (weeks)
From Table A.1, (appendix A) a Z score of 1.91 corresponds to a
probability of 0.4719. Thus P(30) = 0.4719 + 0.5000 = 0.9719
Copyright 2006 John Wiley & Sons, Inc.
9-35
36. Southern Textile Example
What is the probability that the project is completedwithin 22 weeks?
x-
2
Z=
= 6.89 weeks
P(x 22 weeks)
=
6.89
= 2.62 weeks
=
22 - 25
2.62
= -1.14
x = 22 = 25
Time
(weeks)
From Table A.1 (appendix A) a Z score of -1.14 corresponds to a
probability of 0.3729. Thus P(22) = 0.5000 - 0.3729 = 0.1271
Copyright 2006 John Wiley & Sons, Inc.
9-36
37. Project Crashing
Crashingreducing project time by expending additional
resources
Crash time
an amount of time an activity is reduced
Crash cost
cost of reducing activity time
Goal
reduce project duration at minimum cost
Copyright 2006 John Wiley & Sons, Inc.
9-37
38. Project Crashing: Example
42
8
12
7
4
1
12
3
4
Copyright 2006 John Wiley & Sons, Inc.
5
4
6
4
9-38
39. Project Crashing: Example (cont.)
$7,000 –$6,000 –
Crash cost
$5,000 –
Crashed activity
Slope = crash cost per week
$4,000 –
$3,000 –
$2,000 –
Normal activity
Normal cost
$1,000 –
Normal time
Crash time
–
0
|
2
|
4
|
6
Copyright 2006 John Wiley & Sons, Inc.
|
8
|
10
|
12
|
14
Weeks
9-39
40. Normal Activity and Crash Data
ACTIVITY1
2
3
4
5
6
7
NORMAL
TIME
(WEEKS)
CRASH
TIME
(WEEKS)
NORMAL
COST
12
8
4
12
4
4
4
7
5
3
9
1
1
3
$3,000
2,000
4,000
50,000
500
500
15,000
$5,000
3,500
7,000
71,000
1,100
1,100
22,000
$75,000
$110,700
Copyright 2006 John Wiley & Sons, Inc.
CRASH
COST
TOTAL
ALLOWABLE
CRASH TIME
(WEEKS)
5
3
1
3
3
3
1
CRASH
COST PER
WEEK
$400
500
3,000
7,000
200
200
7,000
9-40
41.
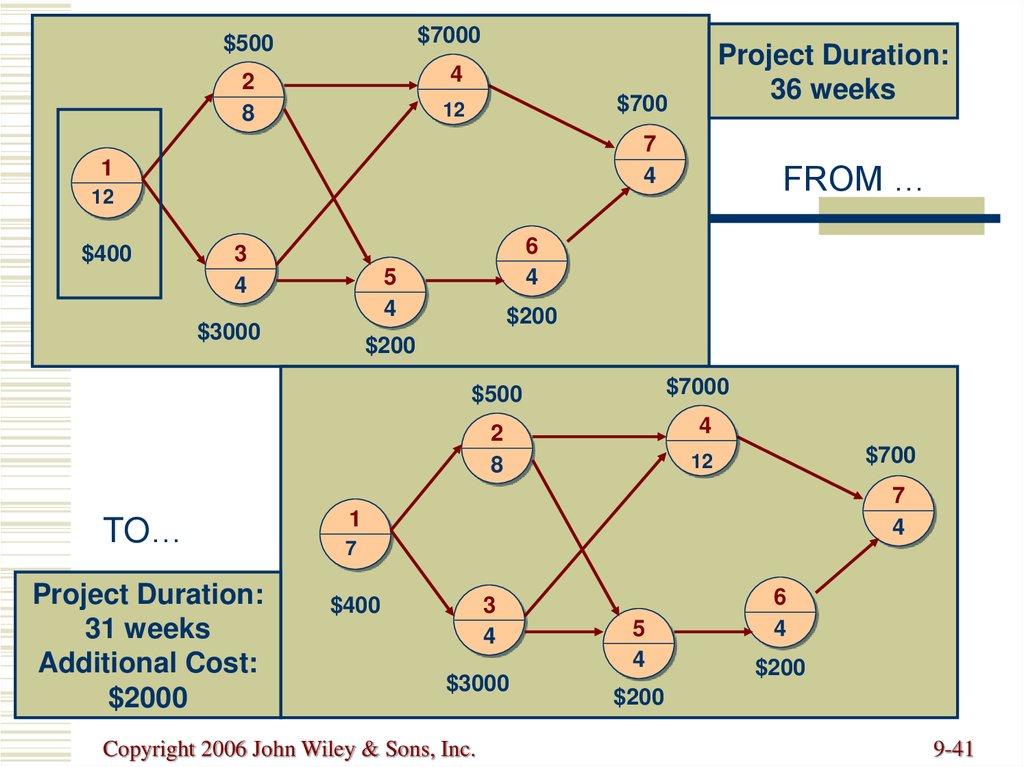
$7000$500
Project Duration:
36 weeks
4
2
8
$700
12
7
4
1
FROM …
12
$400
3
4
6
4
5
4
$3000
$200
$200
$7000
$500
4
2
8
TO…
Project Duration:
31 weeks
Additional Cost:
$2000
$700
12
7
4
1
7
$400
3
4
$3000
Copyright 2006 John Wiley & Sons, Inc.
5
4
6
4
$200
$200
9-41
42. Time-Cost Relationship
Crashing costs increase as projectduration decreases
Indirect costs increase as project
duration increases
Reduce project length as long as
crashing costs are less than indirect
costs
Copyright 2006 John Wiley & Sons, Inc.
9-42
43. Time-Cost Tradeoff
Minimum cost = optimal project timeTotal project cost
Cost ($)
Indirect cost
Direct cost
Crashing
Time
Project duration
Copyright 2006 John Wiley & Sons, Inc.
9-43
44.
Copyright 2006 John Wiley & Sons, Inc.All rights reserved. Reproduction or translation of this work beyond that
permitted in section 117 of the 1976 United States Copyright Act without
express permission of the copyright owner is unlawful. Request for further
information should be addressed to the Permission Department, John Wiley &
Sons, Inc. The purchaser may make back-up copies for his/her own use only and
not for distribution or resale. The Publisher assumes no responsibility for
errors, omissions, or damages caused by the use of these programs or from the
use of the information herein.
Copyright 2006 John Wiley & Sons, Inc.
9-44