


")
 Network Diagram for Project X")
")


")


")


 Менеджмент
Похожие презентации:


. GANTT Charts")


")


Time Management
1. Time Management
2. Learning Objectives
Understand the importance of project schedules and good projecttime management
Define activities as the basis for developing project schedules
Describe how project managers use network diagrams and
dependencies to assist in activity sequencing
Understand the relationship between estimating resources and
project schedules
Explain how various tools and techniques help project managers
perform activity duration estimating
Use a Gantt chart for planning and tracking schedule information,
find the critical path for a project, and describe how critical chain
scheduling and the Program Evaluation and Review Technique
(PERT) affect schedule development
Explain the importance of controlling schedule
3. Importance of Project Schedules
Managers often cite delivering projects on time as one of theirbiggest challenges
Time has the least amount of flexibility; it passes no matter what
happens on a project
Schedule issues are the main reason for conflicts on projects,
especially during the second half of projects
4. Individual Work Styles and Cultural Differences Cause Schedule Conflicts
One dimension of the Meyers-Briggs Type Indicator focuses onpeoples’ attitudes toward structure and deadlines
Some people prefer to follow schedules and meet deadlines
while others do not
Difference cultures and even entire countries have different
attitudes about schedules
Hours, Holidays, Religion, Work ethic
5. Overview
6. Project Time Management Processes
Plan Schedule Management: process of establishing the policies,procedures, and documentation for planning, developing, managing,
executing, and controlling the project schedule
Define activities: identifying the specific activities that the project
team members and stakeholders must perform to produce the
project deliverables
Sequence activities: identifying and documenting the relationships
between project activities
Estimate activity resources: estimating how many resources a project
team should use to perform project activities
Estimate activity durations: estimating the number of work periods
that are needed to complete individual activities
Develop schedule: analyzing activity sequences, activity resource
estimates, and activity duration estimates to create the project
schedule
Control schedule: controlling and managing changes to the project
schedule
7. Plan Schedule Management
Plan Schedule Management is the process of establishing thepolicies, procedures, and documentation for planning,
developing, managing, executing, and controlling the project
schedule
Key benefit of this process is that it provides guidance and
direction on how the project schedule will be managed
throughout the project
8. Define Activities
An activity or task is an element of work normally found on thework breakdown structure (WBS) that has an expected
duration, a cost, and resource requirements
Activity definition involves developing a more detailed WBS
and supporting explanations to understand all the work to be
done so you can develop realistic cost and duration estimates
Key benefits – a basis for estimating, scheduling, executing,
monitoring, and controlling the project work
Rolling wave planning: iterative planning technique in which
the work to be accomplished in the near term is planned in
details, while the work in the future is planned at a higher level
9. Activity Lists and Attributes
An activity list is a tabulation of activities to be included on aproject schedule that includes:
The activity name
An activity identifier or number
A brief description of the activity
Activity attributes provide more information such as
predecessors, successors, logical relationships, leads and lags,
resource requirements, constraints, imposed dates, and
assumptions related to the activity
They should be in agreement with WBS and WBS dictionary
10. Milestone List
A milestone is a significant event that normally has noduration
It often takes several activities and a lot of work to complete a
milestone
They’re useful tools for setting schedule goals and monitoring
progress
They have zero duration because milestones represent a
moment in time
Examples include obtaining customer sign-off on key
documents or completion of specific products
11. Sequence Activities
Involves reviewing activities and determining dependenciesKey benefit – defines the logical sequence of work to obtain
the greatest efficiency given all project constraints
A dependency or relationship is the sequencing of project
activities or tasks
Dependency
Parallel
Overlap
You must determine dependencies in order to use critical path
analysis
12. Network Diagrams
Network diagrams are the preferred technique for showingactivity sequencing
A network diagram is a schematic display of the logical
relationships among, or sequencing of, project activities
Two main formats are the arrow and precedence diagramming
methods
13. Arrow Diagramming Method (ADM)
Also called activity-on-arrow (AOA) network diagramsActivities are represented by arrows
Nodes or circles are the starting and ending points of activities
Can only show finish-to-start dependencies
Uses dummy activities which are represented by dotted lines
Dummy activities = no work
14. Sample Activity-on-Arrow (AOA) Network Diagram for Project X
15. Precedence Diagramming Method (PDM)
Activities are represented by boxesArrows show relationships between activities
More popular than ADM method and used by project
management software
Better at showing different types of dependencies
It’s also called Activity on Node (AON)
16. Sample PDM Network Diagram
17. Task Dependency Types
Examples:Finish-To-Start: Pour Foundation -> Build the room, Race -> Award ceremony
Start-To-Start: While clean the living room = Start painting the dinning hall
Finish-To-Finish: Coding finish -> Before testing can be completed, writing a
document -> editing a document
Start-To-Finish: Task 2 -> Task 1, Security guard shifts
18. Estimate Activity Resources
Before estimating activity durations, you must have a good ideaof the quantity and type of resources that will be assigned to
each activity; resources are people, equipment, and materials
Consider important issues in estimating resources
How difficult will it be to do specific activities on this
project?
What is the organization’s history in doing similar activities?
Are the required resources available?
19. Estimate Activity Resources
A resource breakdown structure is a hierarchical structure thatidentifies the project’s resources by category and type
20. Estimate Activity Duration
Process of estimating the number of work periods needed tocomplete individual activities with estimated resources
21. Estimates
Analogous estimating: Is a technique for estimating the duration or cost ofan activity or a project using historical data from a similar activity or
project
Parametric estimating: Uses a mathematical model as a basis of estimation
Three-point estimating (Program Evaluation and Review Technique):
Instead of providing activity estimates as a discrete number, such as
four weeks, it’s often helpful to create a three-point estimate
An estimate that includes an optimistic, most likely, and pessimistic
estimate, such as three weeks for the optimistic, four weeks for the
most likely, and five weeks for the pessimistic estimate
Three-point estimates are needed for PERT and Monte Carlo
simulations
22. Develop Schedule
Uses results of the other time management processes todetermine the start and end date of the project
Ultimate goal is to create a realistic project schedule that
provides a basis for monitoring project progress for the time
dimension of the project
Important tools and techniques include Gantt charts, critical
path analysis, and critical chain scheduling, and PERT analysis
23. Critical Path Method (CPM)
CPM is a network diagramming technique used to predict totalproject duration
A critical path for a project is the series of activities that
determines the earliest time by which the project can be
completed
The critical path is the longest path through the network
diagram and has the least amount of slack or float
Slack or float is the amount of time an activity may be delayed
without delaying a succeeding activity or the project finish
date
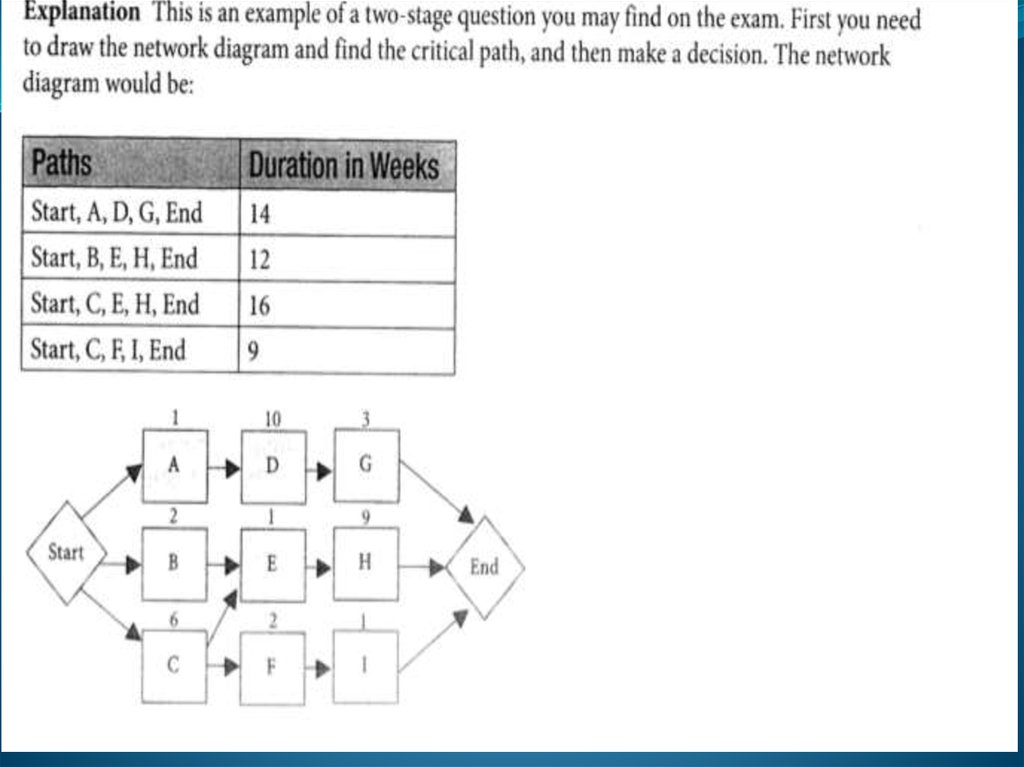
24. Calculating the Critical Path
First develop a good network diagramAdd the duration estimates for all activities on each path
through the network diagram
The longest path is the critical path
If one or more of the activities on the critical path takes longer
than planned, the whole project schedule will slip unless the
project manager takes corrective action
25. Determining the Critical Path for Project X
26.
27.
28. Using the Critical Path to Shorten a Project Schedule
Three main techniques for shortening schedulesShortening durations of critical activities/tasks by adding
more resources or changing their scope
Crashing activities by obtaining the greatest amount of
schedule compression for the least incremental cost
Fast tracking activities by doing them in parallel or
overlapping them
29. Importance of Updating Critical Path Data
It is important to update project schedule information to meettime goals for a project
The critical path may change as you enter actual start and
finish dates
If you know the project completion date will slip, negotiate
with the project sponsor
30. Multitasking Example
31. Program Evaluation and Review Technique (PERT)
PERT is a network analysis technique used to estimate projectduration when there is a high degree of uncertainty about the
individual activity duration estimates
PERT uses probabilistic time estimates
Duration estimates based on using optimistic, most likely,
and pessimistic estimates of activity durations, or a threepoint estimate
32. PERT Formula and Example
PERT weighted average =optimistic time + 4X most likely time + pessimistic time
6
Example:
PERT weighted average =
8 workdays + 4 X 10 workdays + 24 workdays
= 12 days
6
where optimistic time = 8 days
most likely time = 10 days, and
pessimistic time = 24 days
Therefore, you’d use 12 days on the network diagram instead of
10 when using PERT for the above example
33. Gantt Charts
Gantt charts provide a standard format for displaying projectschedule information by listing project activities and their
corresponding start and finish dates in a calendar format
Symbols include:
Black diamonds: milestones
Thick black bars: summary tasks
Lighter horizontal bars: durations of tasks
Arrows: dependencies between tasks
34. Gantt Chart for Project X
Note: Darker bars would be red in Project 2007 to represent critical tasks.35. Gantt Chart for Software Launch Project
36. Control Schedule
Goals are to know the status of the schedule, influence factors thatcause schedule changes, determine that the schedule has changed,
and manage changes when they occur
37. Schedule Control Suggestions
Perform reality checks on schedulesAllow for contingencies
Don’t plan for everyone to work at 100% capacity all the time
Hold progress meetings with stakeholders and be clear and
honest in communicating schedule issues
38. Reality Checks on Scheduling
First review the draft schedule or estimated completion datein the project charter
Prepare a more detailed schedule with the project team
Make sure the schedule is realistic and followed
Alert top management well in advance if there are schedule
problems
39. Working with People Issues
Strong leadership helps projects succeed more than good PERTcharts
Project managers should use:
Empowerment
Incentives
Discipline
Negotiation
40. Summary
Project time management is often cited as the main source ofconflict on projects, and most IT projects exceed time estimates
Main processes include:
Plan Schedule Management
Define activities
Sequence activities
Estimate activity resources
Estimate activity durations
Develop schedule
Control schedule