: An illustration that embodies the rule – may be a person thinking about the rule?")
: An illustration that combines the face of the unicorn and the body representing biopharma industry,")
: Map of the world showing where early biopharma manufacturers emerged")
: An illustrative label of a biopharma product from early days of the industry")
: A modern label from pharma industry – showing the kind of information included (something better than")
: Graph showing how insurance based payments took off in mid-90s.")
: Annual US revenue of biopharmaceuticals – from 1985 - 2015")
: Image of a unicorn with wings stationary, jet propulsion behind, and blockbusters in the jet stream")
: Image of unicorn with jet propulsion dying down, wings beginning to flap, but showing a lower trajectory")
: Cartoon/s showing disruption of US healthcare, all stakeholders scrambling")
")
")
: Relative industry margins declining")
: Image of a person sitting on a plane, smart pill in stomach, throwing out data such as cold, thirsty,")
")
: Image of a unicorn taking off at warp speed (star wars kind of imagery), with smart therapeutics in its")
: combination of the 80-80 rule image from figure 1 and the 4 principles for igniting growth")
: New Breed of Leaders")
 Talent Mix cartoon")
: “Embrace the need, money will follow” and “outside in first, inside out next” pointing towards new white")

: Instead of the public place, call it hybrid existence. In the middle, insert image of a body which is")
: Partnering")
 Маркетинг
Похожие презентации:


May be a person thinking about the rule
1. FIGURE 1 (page 16): An illustration that embodies the rule – may be a person thinking about the rule?
The 80-80 Rule"Being 80% confident that you will only be 80% right the first time should feel normal”
✾
If you are 100% confident, you are not looking for blind-spots. This borders on arrogance.
✾
If you wait to be 100% confident it probably means that someone else may have already capitalized
on your idea because you spent too much time in the quest for perfection.
✾
And if you are 100% right the first time, it is pure chance, not genius.
2. Figure 2 (page 20): An illustration that combines the face of the unicorn and the body representing biopharma industry,
flapping itswings to signify take off and growth
3. Figure 4 (page 23): Map of the world showing where early biopharma manufacturers emerged
SWI TZERLANDUNI TED STATES
Pfizer
BMS
Lilly
1876
1st R&D + Manufacturing
Sandoz
Roche
GERMANY
Merck
Bayer
Boehringer Ingelheim
UNI TED KI NGDOM
Beecham
1942
1st Patented Medicine
1859
1st factory dedicated to producing medicine
4. Figure 5 (page 25): An illustrative label of a biopharma product from early days of the industry
5. Figure 6 (Page 31): A modern label from pharma industry – showing the kind of information included (something better than
below)6. Figure 7 (page 36): Graph showing how insurance based payments took off in mid-90s.
7. Figure 8 (page 36): Annual US revenue of biopharmaceuticals – from 1985 - 2015
8. Figure 9 (page 38): Image of a unicorn with wings stationary, jet propulsion behind, and blockbusters in the jet stream
• Image of unicorn9. Figure 10 (page 41): Image of unicorn with jet propulsion dying down, wings beginning to flap, but showing a lower trajectory
of flight +graph below showing average
revenues per product
Source: https://www.forbes.com/sites/peterubel/2016/07/29/is-the-golden-era-ofpharmaceutical-profits-over/#494789c17207
10. Figure 11 (page 61): Cartoon/s showing disruption of US healthcare, all stakeholders scrambling
11. Figure 12 (page 72)
PRODUCTFOCUS
PRODUCT+
SERVICE
FOCUS
BREAKTHROUGH
INNOVATION
Zero Downtime for Patients
ADJACENT
Develop “Smart” Products
Monetize Core Capabilities
Fully Participate in Value Based Care
CORE
Reverse the Revenue Equation
Strengthen the Core Business Model
SAME
DIFFERENT
BUSINESS MODEL
The Y-axis displays opportunities across the three
forms of innovation described in the prior section.
The X-axis displays the evolution of a company’s
overall business model over time which
encompasses where and how it generates revenue
and the way it engages with the market through its
customer engagement or commercial model.
12. Figure 13 (page 74)
• Current: R = P x v• Future: R = p x V
• Superimposed on • Current: Image of the world with US, EU and Japan
shown as big compared to Asia, LatAm
• Future: A normal map of the world
13. Figure 14 (page 75): Relative industry margins declining
By Berndt’s estimates, pharmaceutical products releasedbetween 2005 and 2009 barely broke even:
Source: https://www.forbes.com/sites/peterubel/2016/07/29/is-the-golden-era-ofpharmaceutical-profits-over/#494789c17207
14. Figure 15 (page 76): Image of a person sitting on a plane, smart pill in stomach, throwing out data such as cold, thirsty,
hungry,sleepy – being received by airline
stewards who are bringing water,
blankets, dimming lights, bring food
in response….
15.
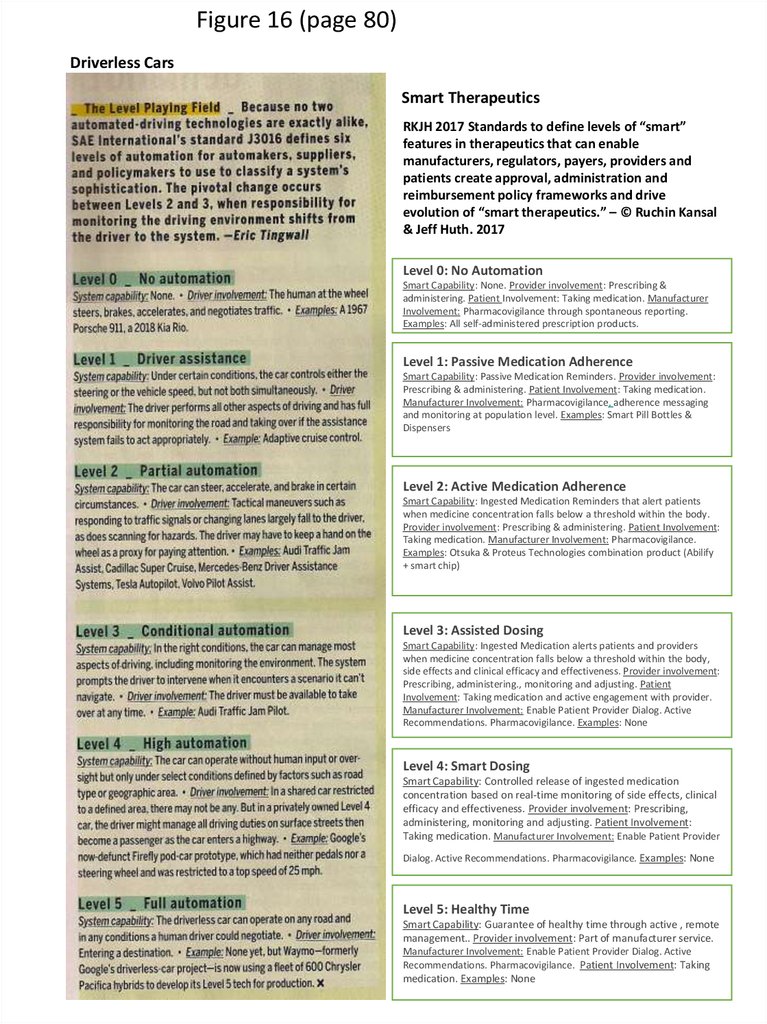
Figure 16 (page 80)Driverless Cars
Smart Therapeutics
RKJH 2017 Standards to define levels of “smart”
features in therapeutics that can enable
manufacturers, regulators, payers, providers and
patients create approval, administration and
reimbursement policy frameworks and drive
evolution of “smart therapeutics.” – © Ruchin Kansal
& Jeff Huth. 2017
Level 0: No Automation
Smart Capability: None. Provider involvement: Prescribing &
administering. Patient Involvement: Taking medication. Manufacturer
Involvement: Pharmacovigilance through spontaneous reporting.
Examples: All self-administered prescription products.
Level 1: Passive Medication Adherence
Smart Capability: Passive Medication Reminders. Provider involvement:
Prescribing & administering. Patient Involvement: Taking medication.
Manufacturer Involvement: Pharmacovigilance, adherence messaging
and monitoring at population level. Examples: Smart Pill Bottles &
Dispensers
Level 2: Active Medication Adherence
Smart Capability: Ingested Medication Reminders that alert patients
when medicine concentration falls below a threshold within the body.
Provider involvement: Prescribing & administering. Patient Involvement:
Taking medication. Manufacturer Involvement: Pharmacovigilance.
Examples: Otsuka & Proteus Technologies combination product (Abilify
+ smart chip)
Level 3: Assisted Dosing
Smart Capability: Ingested Medication alerts patients and providers
when medicine concentration falls below a threshold within the body,
side effects and clinical efficacy and effectiveness. Provider involvement:
Prescribing, administering., monitoring and adjusting. Patient
Involvement: Taking medication and active engagement with provider.
Manufacturer Involvement: Enable Patient Provider Dialog. Active
Recommendations. Pharmacovigilance. Examples: None
Level 4: Smart Dosing
Smart Capability: Controlled release of ingested medication
concentration based on real-time monitoring of side effects, clinical
efficacy and effectiveness. Provider involvement: Prescribing,
administering, monitoring and adjusting. Patient Involvement:
Taking medication. Manufacturer Involvement: Enable Patient Provider
Dialog. Active Recommendations. Pharmacovigilance. Examples: None
Level 5: Healthy Time
Smart Capability: Guarantee of healthy time through active , remote
management.. Provider involvement: Part of manufacturer service.
Manufacturer Involvement: Enable Patient Provider Dialog. Active
Recommendations. Pharmacovigilance. Patient Involvement: Taking
medication. Examples: None
16. Figure 17 (page 88)
PRODUCTFOCUS
PRODUCT+
SERVICE
FOCUS
NEW INDUSTRY
BREAKTHROUGH
INNOVATION
Zero Downtime for Patients
ADJACENT
Develop “Smart” Products
Monetize Core Capabilities
Fully Participate in Value Based Care
CORE
Reverse the Revenue Equation
Strengthen the Core Business Model
SAM
E
DIFFERENT
BUSINESS MODEL
17. Figure 18 (page 89): Image of a unicorn taking off at warp speed (star wars kind of imagery), with smart therapeutics in its
jet stream….18. Figure 19 (page 95): combination of the 80-80 rule image from figure 1 and the 4 principles for igniting growth
• Setting up for success• Finding White Spaces
• Developing New Ventures
• Becoming Adept at Partnering
19. Figure 20 (page 100): New Breed of Leaders
• People following leader vs. leader in the center andthe pack moving forward together….
20. Figure 21 (page 106) Talent Mix cartoon
• 6 roles –Innovation leader
Idea generators
Technical experts
Project managers
Innovation ambassadors
Internal sponsors
21. Figure 22 (page 110): “Embrace the need, money will follow” and “outside in first, inside out next” pointing towards new white
spaceopportunities
22. Figure 23: Page 126:Image of a TV screen with red yellow green faces
• I like the red face image style23. Figure 24 (page 130): Instead of the public place, call it hybrid existence. In the middle, insert image of a body which is
physical on the left,virtual/digital on the right
24. Figure 25 (page 133): Partnering
• Past/Current vs current/future• In past/current – show healthcare ecosystem.
comprising patient at the center, and insurance,
provider and pharmacy around it. Show biopharma
standing outside as a supplier of pills to this
ecoosystem.
• Current/Future: Show patient, pharma, insurer,
pbm, pharmacy, large tech (google/apple), start
ups, employers, hospitals, doctors, digital clinics,
all part of an integrated healthcare ecosystem,
where traditional boundaries of past/current
model disappear.