


")
")


")
 Финансы
Похожие презентации:


Structuring. Transaction Framework
1. Structuring
Joseph V. RizziAmsterdam Institute of Finance
May, 2008
Copyright © Joe Rizzi, 2008
2. Agenda
1. Overview2. Perspective
3. Creating the structure
4. Covenants
Amsterdam Institute of Finance
May, 2008
2
3.
OverviewAmsterdam Institute of Finance
May, 2008
3
4. Transaction Framework
Strategic Issues• Do I make the acquisition?
Valuation
• How much do I pay?
Tactics
• How do I make the offer?
Financing
• How do I pay?
Integration
• Implementation of acquisition
Amsterdam Institute of Finance
May, 2008
4
5. Transaction and Structuring Overview
CreditorsRights
Regulatory
and Antitrust
Contract
Business
Plan
Market
Conditions
Deal
Accounting
Transaction
Characteristics
Securities
Financial
Preferences
Corporate
Law
Tax
Competing
Bidders
Amsterdam Institute of Finance
May, 2008
5
6. Structuring Environment
Business Considerations:•Strategic Plans
•Growth Plans
•Management
•Business Risk
(Cash Flow Volatility)
Financial Preferences:
•Dilution
•Control
•Risk Tolerance
•Flexibility
•Exit Needs
What do you want?
Amsterdam Institute of Finance
May, 2008
Deal
•Maturity
•Amortization
•Seniority
•Security
•Covenants
•Prepayment
•Cost
•Liquidity
•Size
How to get what
you need!
Financial Characteristics:
•Sources and Uses
•Operating Cash Flows
•Leverage
•Liquidity
•Seasonality
•Timing
Market Conditions:
•Depth
•Pricing Requirements
•Structural Needs
•Cycle
•Liquidity
What can you get?
6
7. Different Menus
As the credit curve shifts,the menu that is available
to
Issuers / Arrangers
changes
Bull Market Menu
• Holding Company PIK
• Tranche Term Loans
• Covenant Light
• High Yield Debt
• Bridge Loans
• Second Lien
• Hybrid Preferred
• Cross Lien Facilities
• Asset Carve-outs
• OPCO/PROPCO
• Recapitalizations
Bear Market Menu
• Stretch Senior
• Seller Notes
• Senior Notes
• Private Placements
• Equity
• R/C Lite
• Mezzanine
• Smaller
Investor Friendly
Issuer Friendly
Amsterdam Institute of Finance
May, 2008
7
8. Financing Approaches
Left Hand Side FinancingBased on the cash flow of a
specific asset pool.
Some examples include:
• Asset Based Lending
• Factoring
• Leasing
• Project Finance
• Securitization
Amsterdam Institute of Finance
May, 2008
Right Hand Side Financing
Based on the cash flow of the
entire company.
Some examples include:
• Bank Debt
• Public Bonds
• Mezzanine
• Preferred Stock
• Common Stock
8
9.
PerspectiveAmsterdam Institute of Finance
May, 2008
9
10. Structuring Perspective
Capital Market Specific FactorsCredit Specific Factors
Customer Objectives
Valuation
Amsterdam Institute of Finance
May, 2008
10
11. Market Specific Factors
Acceptable leverage levels◦ Interest Rate
◦ Amortization
Acceptable tenor of senior debt
Asset coverage
Size of issue
Amsterdam Institute of Finance
May, 2008
11
12. Structuring Issues
Public Debt vs. Private Debt◦ Relative Value Analysis
Domestic vs. International Issuance
Fixed vs. Floating Rate Debt
Long vs. Short Term
Loans vs. Bonds
Amsterdam Institute of Finance
May, 2008
12
13. Credit Specific Factors
Amount of available cash flowReliability of cash flow
Credibility of projections
Amsterdam Institute of Finance
May, 2008
13
14. Issuer Objectives / Impact (1)
IssueImpact
Disclosure
Public issues require disclosure of sensitive
information
Ratings
Ratings impact of financing over existing debt
Timing
Urgency favors private relationship sources ( e.g. Banks)
Covenants
Impact operating flexibility
Seniority
Impacts intercreditor issues
Security
Consider impact on other creditors (incl. suppliers)
Currency
Match with assets
Maturity
Long-term versus short-term mix
Amsterdam Institute of Finance
May, 2008
14
15. Issuer Objectives / Impact (2)
IssueImpact
Amortization
Affects duration of debt
Callability
Flexibility
Obligor
Raises intercreditor issues
Accounting
On- or Off-balance sheet
Tax Implications
Instrument and location of interest tax shield
Diversification
Investor appetite
Fixed / Floating
Interest Rate Risk (IRR)
Liquidity
Default Risk
Amsterdam Institute of Finance
May, 2008
15
16. Critical Path & Decision Framework
Bank FinancingCredit
Rating
Determine
Capital
Structure
Acquisition
Bridge
Takedown
Hedge No Action
Financial
Flexibility
FloatingRate
Target
Credit
Rating
Advisory / Origination
Amsterdam Institute of Finance
May, 2008
Asset Carveout
Securitization \ Prop Co
Fixed-
Refinance
Bridge
Bank
Funding
Rate
Fixed Income
Equity / Near Equity
Underwriting
Product Execution
16
17.
Creating the StructureAmsterdam Institute of Finance
May, 2008
17
18. Creating the Capital Structure
Rule of Thumb Measures◦ Balance Sheet Model
◦ Cash Flow Model
Detailed Model
◦ Matching markets to the need
◦ Reverse inquiry
◦ Projections (amortization capability)
Amsterdam Institute of Finance
May, 2008
18
19. Deal Financial Arithmetic
LHS(value)
(A) Income / DCF
FOCF = NOPAT–(WCI + T + CAPEX)
WACC
Ke – Rf x 2 or CAPM
Debt = ref rate + spread
(B) Relative Value
Comps
Multiples
Trading
Transaction
(C) Breakup Value
Amsterdam Institute of Finance
May, 2008
Transaction
(A) Mechanics
Issues
Tax
Legal
Accounting
Regulation
Focus
Form
Payment
(B) Purchase Price Multiple
(C) Value Allocation
Vp = PreBid Trading + Premium
Vr = PreBid value + Synergy
NVAs = Premium - Synergy
RHS
(Claims)
(A) Concerns
Ratings targets
Market availability - menus
IRR
MDC
(B) Funded Debt Multiples (FDX)
(C) Framework
R/C – tied to BB
Senior (SDX)
TL/A (amortization tied to projections)
3 – 4X FLL
0.5 – 1X SLL
T/LB
SDX - T/LA
Other Debt
FDX - SDX
Equity
PPX – FDX
Subject to IRR constraint
19
20.
Netherlands LBOVolume by Industry
Source: April 2008 EuroStats;
www.lcdcomps.com
20
21. Financing Need As a Starting Point
Purchase Price◦ Minimum/Maximum
◦ Recapitalization Dividend
Debt Refinancing
◦ Callability
◦ Premiums
◦ Tax Issues
Expenses
Other Uses
Amsterdam Institute of Finance
May, 2008
21
22. Structuring Framework
Senior SecuredFirst Lien
Revolver
o
o
Tied to advance against current assets
Crossing liens
o
o
Macro: Ratio of 3-4x EBITDA
Micro: Amortization analysis tied to cash flow in years 1-7
o
Senior debt ratio less Term Loan A amortization
Term Loan A
Term Loan B
Second Lien
o Macro: 0.5-1x EBITDA
o Limited amortization
o Longer term
o Can also be covenant lite
Senior/Subordinated Unsecured
Other Debt
o
Total Debt/EBITDA less Senior Debt/EBITDA
Equity
o
Funding need less Total Debt/EBITDA
Amsterdam Institute of Finance
May, 2008
22
23. Sizing the Revolver
Current Asset approach◦ Use standard advance rates
Accounts Receivable
Inventory
PP&E
80%
60%
40%
◦ Consider the following factors
Seasonal Needs
Future Working Capital Growth
Unexpected Liquidity Needs
Amsterdam Institute of Finance
May, 2008
23
24. Sizing the Term Loans
Term Loans = Maximum Senior Debt - RevolverFocus is on Free Operating Cash Flow
Market conditions also dictate the maximum tenor of
the loan and the amount required to be amortized in
the first five years
Acceptable asset coverage is also a consideration in
determining the size of the term loans
Amsterdam Institute of Finance
May, 2008
24
25. Add-On Term Loans
Typical bank financings as structured as follows:Revolving Credit
Term Loan A (amortising)
Term Loans B & C (bullet/balloon)
Large unfunded revolvers are seldom used today due to the fact that it is capital
unfriendly to banks and companies don’t like to pay for unused commitments.
In the interest of keeping flexibility for the long term, additional indebtedness baskets
should be negotiated upfront. This allows companies to access either the bank or
bond markets under their existing credit agreements and saves the costs of having to
refinance.
Amsterdam Institute of Finance
May, 2008
25
26. Junior Capital
Long Term Debt = Max Total Debt - Max Senior Secured Debt◦ Senior unsecured
◦ Sub Debt
Equity:
◦ Equity = Total Uses - Max Total Debt
◦ Common
◦ Hybrids
Amsterdam Institute of Finance
May, 2008
26
27. Subordination
Senior lenders are concerned with the implications ofhaving high yield investors at the table during a
restructuring.
EURO High Yield investors to date have not been as vocal
as senior bank lenders, viewing the issue as one of pricing
rather than principle.
All other things being equal, sophisticated investors will
probably price structural subordination at 60-120 bps.
Amsterdam Institute of Finance
May, 2008
27
28. Contractual Subordination
High Yield BondsHolding Company
Subordination
Agreement
100% Equity
Interest
Issues
Intermediate
Holding Company
Operating
Company
Amsterdam Institute of Finance
May, 2008
Operating
Company
Senior Secured
Loan
Operating
Company
28
29. Structural Subordination
IssuesHolding Company
High Yield Bonds
100% Equity
Interest
Issues
Intermediate
Holding Company
Senior Secured
Loan
Support Package
Operating
Company
Amsterdam Institute of Finance
May, 2008
Operating
Company
Operating
Company
29
30. Fixing Broken Deal
RetrancheIncrease Pricing
Lower Leverage
◦ Lower Purchase Price
◦ Seller Paper
◦ Increase Equity
Senior Notes to cover Amortizing Loans
Term Loan Carve-Out
Asset Sales
Second Lien
Debt covenants
Amsterdam Institute of Finance
May, 2008
30
31.
CovenantsAmsterdam Institute of Finance
May, 2008
31
32. Covenants - Fundamentals
PURPOSE: maintain the original dealWHY
◦ Agency problem due to asymmetric information
◦ Adverse Selection
◦ Moral Hazard
FOCUS
◦ Asset Substitution
◦ Cash Control
◦ Payment and asset priority
Amsterdam Institute of Finance
May, 2008
32
33. Covenants – Categories and Approach
Categories◦ Affirmative
The maintenance, preservation and insurance of corporate
assets and the compliance of environmental, ERISA and other
laws by the company
◦ Negative
Limit or prohibit the company from undertaking certain
actions which would lower the overall credit quality or damage
a potential secondary repayment source
◦ Financial
Provide an early warning for deteriorating operating
performance
Approach
◦ Maintenance (Preserving the credit)
◦ Incurrence (Maintaining relative priority of claim)
Amsterdam Institute of Finance
May, 2008
33
34. Structuring Covenants
There are no standard covenants.They must be tailor fit for each deal and loan structure.
The steps in structuring the covenants are:
Identify the risks (Business, Financial & Structural)
Select Covenants to monitor the risks
- Need to prioritize the risks to monitor because it will be
impossible to monitor every risk
- The time and costs to monitor the covenants must be
considered (i.e. sometimes one covenant can cover
multiple risks)
Set Appropriate Levels
- Want the covenants to trigger a warning before any
principal or interest payments become delinquent. Need
to factor in any seasonal needs to the covenant levels.
Amsterdam Institute of Finance
May, 2008
34
35. First-lien leveraged loans covenant statistics: Average number and distribution Excludes covenant-lite deals
Average NumberDistribution by covenant number
6
100%
3
50%
0
19
97
19
98
19
99
20
00
20
01
20
02
20
03
20
04
20
05
20
06
20
07
4Q
07
1Q
08
4Q
07
1Q
08
20
07
20
06
20
05
20
04
20
03
20
02
20
01
20
00
19
99
19
98
19
97
0%
2 or less
3
4 or more
Copyright © 2008 Standard & Poor's, a division of The McGraw-Hill Companies, Inc. www.lcdcomps.com
Amsterdam Institute of Finance
May, 2008
35
36. Incidence of key covenants in first-lien leveraged loans Excludes covenant-lite deals
100%75%
50%
25%
0%
Capital Expenditures
1997
1998
Cash Interest
Coverage
1999
2000
Debt/EBITDA
2001
2002
Fixed Charge
Coverage
2003
2004
2005
Interest Coverage
2006
2007
Senior
Debt/EBITDA
1Q08
Copyright © 2008 Standard & Poor's, a division of The McGraw-Hill Companies, Inc. www.lcdcomps.com
Amsterdam Institute of Finance
May, 2008
36
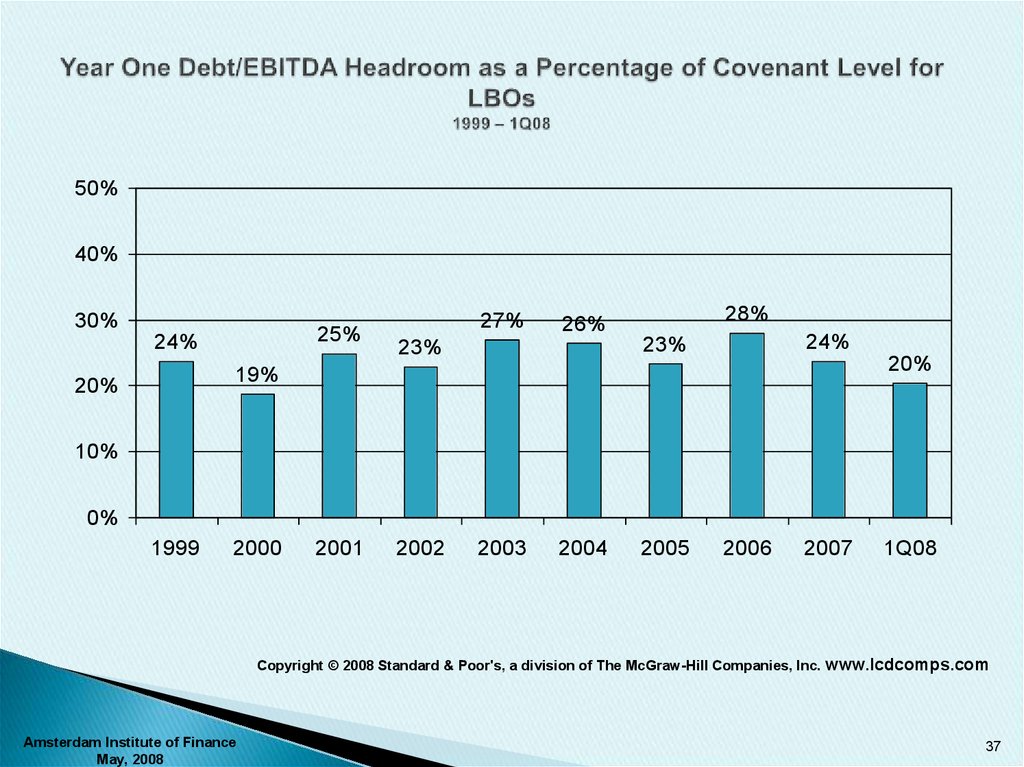
37.
50%40%
30%
25%
24%
27%
28%
26%
24%
23%
23%
20%
19%
20%
10%
0%
1999
2000
2001
2002
2003
2004
2005
2006
2007
1Q08
Copyright © 2008 Standard & Poor's, a division of The McGraw-Hill Companies, Inc. www.lcdcomps.com
Amsterdam Institute of Finance
May, 2008
37
38.
Percent of First-lien leveraged loans with one maintenance finance covenantExcludes covenant-lite deals
50%
31%
26%
25%
11%
9%
1%
1%
1%
2%
1997
1998
1999
2000
2%
2001
5%
3%
3%
2%
2002
2003
2004
0%
Amsterdam Institute of Finance
May, 2008
2005
2006
2007
4Q07
1Q08
38
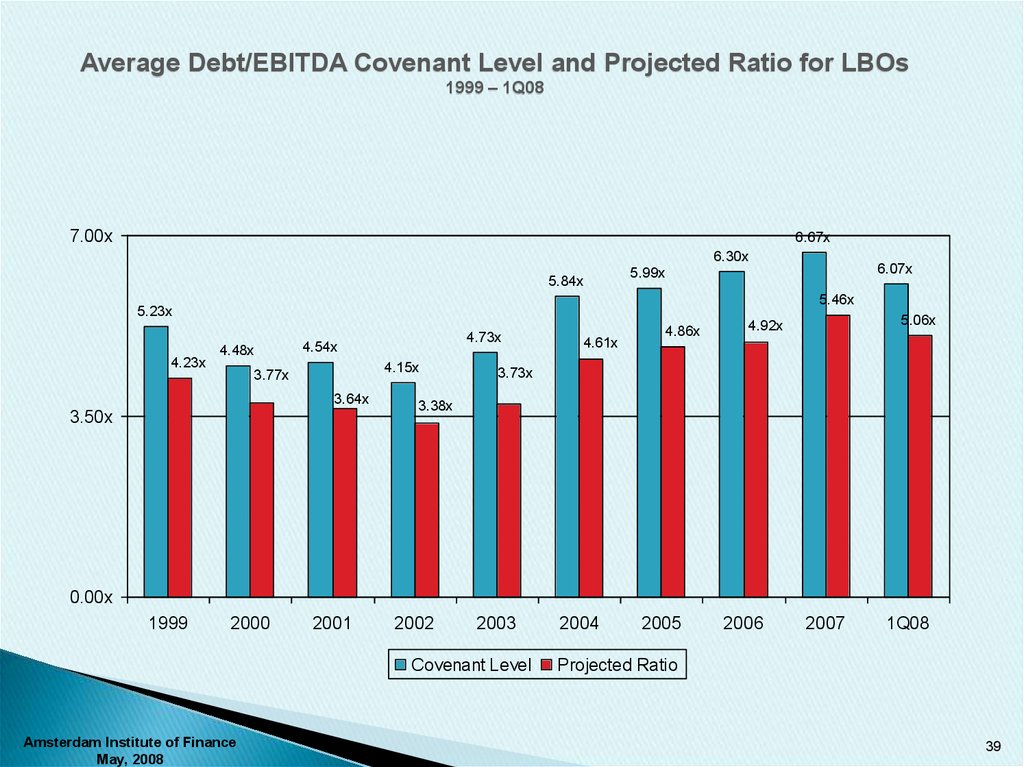
39.
Average Debt/EBITDA Covenant Level and Projected Ratio for LBOs1999 – 1Q08
7.00x
6.67x
6.30x
5.84x
5.46x
5.23x
4.23x
6.07x
5.99x
4.48x
4.73x
4.54x
4.15x
3.77x
3.64x
3.50x
4.61x
4.86x
5.06x
4.92x
3.73x
3.38x
0.00x
1999
2000
2001
2002
2003
Covenant Level
Amsterdam Institute of Finance
May, 2008
2004
2005
2006
2007
1Q08
Projected Ratio
39
40. Covenant Levels and Issues
Covenants are negotiated between the lender andborrower.
Covenant levels will affect the loan pricing (ie pricing
will increase for a “loose” covenant package).
Other covenant issues include releases, voting rights
and baskets.
Copyright © 2008 Standard & Poor's, a division of The McGraw-Hill Companies, Inc. www.lcdcomps.com
Amsterdam Institute of Finance
May, 2008
40
41.
ConclusionTranslating Capital Structure and Debt Capacity
into a Detailed Financing Structure.
Amsterdam Institute of Finance
May, 2008
41
42. Project Gear
Amsterdam Institute of FinanceMay, 2008
42
43. Project Gear - Facts
Potential deal for a company in auction.
Private automotive parts company based in Europe.
Our client, financial sponsor (RCC) looking to bid on the transaction.
May use this transaction as a platform.
Valuation range is 6x-8x EBITDA (or 63mm-84mm). A number of bidders.
The sponsor has a successful buyout fund (returns exceed 25% p.a.)
Avoidable private company expenses net of other adjustments are a
maximum of 1 mm per annum.
Contracts/Relationships with OEMs should preserve sales and markets
provide future achievable 5% growth. Could be as high as 10%.
Currently sales/assets mostly within Europe, in major economies.
Opportunities for growth through acquisition.
Amsterdam Institute of Finance
May, 2008
43
44. Project Gear - Facts
Results2003
2004
2005
2006
Sales
850.0
930.0
907.0
939.0
EBITDA
87.0
93.0
91.0
105.0
EBITDA Margins
10.24%
10.00%
10.10%
11.10%
Capex
30.0
30.0
30.0
30.0
Working Capital
16.20%
13.20%
12.30%
12.80%
Amsterdam Institute of Finance
May, 2008
44
45. Project Gear - Facts
Current Balance Sheet:Cash
9.0
Receivables
70.0
Inventory
65.0
Other Current Assets
23.0
167.0
Net PPE
201.0
Goodwill
34.0
Other Long Term
13.0
415.0
Current Liabilities
47.0
Bank Debt
92.0
Other LT Liabilities
8.0
147.0
Equity
268.0
415.0
Amsterdam Institute of Finance
May, 2008
45
46. PMD Stats
Jan-00Feb-00
Mar-00
Month Ended Month Ended
4/6/00
4/13/00
Average New-Issue Spread – by Pro Forma Debt/EBITDA
Pro Rata (Excludes Media/Telecom)
5.00x-5.99x
L+300
4.00x-4.99x
L+293
3.00x-3.99x
L+273
L+358
L+355
L+345
L+300
L+288
L+266
NA
L+288
L+263
NA
L+289
L+267
NA
L+294
L+270
L+358
L+349
L+342
NA
L+354
L+350
NA
L+356
L+350
NA
L+348
L+346
Average New-Issue Spread – by Bank Loan Rating (1)
BB/BBPro Rata
Institutional
B+/B
Pro Rata
Institutional
Feb-00
Mar-00
Month
Ended
4/13/00
CreditStats
Average Credit Statistics (excluding Media/Telecom/Retail)
Institutional (Excludes Media/Telecom)
5.00x-5.99x
4.00x-4.99x
3.00x-3.99x
Jan-00
Month
Ended
4/6/00
L+235.0
L+291.7
L+227.8
L+276.1
L+245.8
L+302.4
L+243.2
L+300.0
L+238.6
L+295.8
L+298.2
L+344.6
L+275.0
L+321.0
L+292.9
L+351.6
L+300.0
L+361.1
L+300.0
L+366.7
All Loans
Debt/EBITDA
Sr Secured Debt/EBITDA
EBITDA/Cash Interest
EBITDA-Capex/Cash Interest
4.2x
3.6x
2.9x
2.0x
4.2x
3.1x
2.7x
2.2x
4.2x
2.8x
2.9x
1.9x
4.3x
2.9x
2.7x
1.9x
4.2x
3.0x
2.7x
2.0x
Loans $500M or More
Debt/EBITDA
Sr Secured Debt/EBITDA
4.8x
3.8x
4.4x
2.4x
4.8x
2.7x
4.8x
2.9x
4.5x
2.7x
EBITDA/Cash Interest
EBITDA-Capex/Cash Interest
2.4x
1.5x
2.7x
2.1x
2.6x
1.4x
2.4x
1.3x
2.5x
1.3x
Loans $250-499M
Debt/EBITDA
Sr Secured Debt/EBITDA
EBITDA/Cash Interest
EBITDA-Capex/Cash Interest
4.0x
3.6x
2.6x
1.7x
4.1x
3.3x
2.7x
2.2x
4.5x
3.7x
2.2x
1.8x
4.7x
3.1x
2.1x
1.5x
4.1x
4.0x
2.8x
2.2x
Loans $100-249M
Debt/EBITDA
Sr Secured Debt/EBITDA
4.0x
3.6x
4.1x
3.2x
3.7x
2.7x
3.7x
2.8x
4.0x
3.1x
2.6x
2.1x
2.8x
2.2x
3.2x
2.1x
3.1x
2.3x
2.9x
2.2x
3.9x
3.4x
3.4x
2.5x
4.0x
3.4x
2.5x
2.0x
3.8x
3.2x
3.2x
3.0x
3.7x
3.1x
3.0x
2.8x
3.6x
3.0x
3.1x
2.9x
Avg New-Issue Fee For a $10M Commitment To Highly Leveraged Loans
Pro Rata Tranches
Institutional Tranches
40.6 bp
31.7 bp
30.2 bp
20.9 bp
26.2 bp
17.0 bp
25.0 bp
16.9 bp
26.2 bp
18.8 bp
42%
8%
58%
8%
44%
7%
37%
11%
38%
12%
% of Institutional TLs with
Pricing Grids
Prepayment Fees
EBITDA/Cash Interest
EBITDA-Capex/Cash Interest
Loans Less Than $100M
New-Issue Deal Flow
Volume of Loans ($ in Billions)
Pro Rata
Institutional
Total
6.98
2.99
9.97
8.47
5.36
13.83
12.36
9.42
21.77
11.98
8.24
20.22
Number of Loans
With Institutional Paper
12
28
34
34
All Loans
23
42
54
50
Leveraged loans tracked by PMD excluding amendments and existing tranches of add-ons
12.25
6.96
19.22
31
46
Debt/EBITDA
Sr Secured Debt/EBITDA
EBITDA/Cash Interest
EBITDA-Capex/Cash Interest
% of Highly Leveraged Loans with Pro Forma Debt/EBITDA of 6.00x
$250M or Higher
0%
10%
8%
$100-$249M
0%
8%
0%
Less Than $100M
0%
0%
0%
or Higher
6%
0%
0%
7%
0%
0%
NA
NA
NA
NA
NA
NA
Average Secondary Bid Levels by DLJ Loan Index (2)
Average New-Issue Spread of Leveraged Loan
Pro Rata
L+290.2
L+250.7
Weighted Avg Institutional
L+355.0
L+334.8
Source: Portfolio Management Data, except where indicated
(1) Source: Portfolio Management Data/Standard & Poor's
(2) Source: Donaldson, Lufkin & Jenrette
Amsterdam Institute of Finance
May, 2008
L+226.9
L+323.1
L+235.5
L+321.1
L+245.7
L+316.1
All Loans
Par Loans*
99.31%
Par Institutional Loans*
99.52%
% Below 90% of Par
6.78%
* Those trading at 95% of par and higher
99.23%
99.48%
6.23%
NA
NA
NA
46
47. Project Gear - Quick Analysis
Potential ValueEBITDA (105) x 7
=
735.0
Max Debt
Total
4.2x
=
441.0
Senior Drawn 3.0x
=
315.0
Implied Junior Debt/Mezz
=
126.0
(good size !)
Required Equity
(735.0 – 441)
=
294.0
(Large, tranching ?, returns ? )
CF Analysis
EBITDA
=
105
Working Capital (13%)
=
0
Capex (half discretionary)
=
(15)
Interest
=
(35)
Tax
=
(16)
=
39
(105 – 15 – 35) * 35%
FOCF/ Amortization ability
(no growth, but need liquidity)
6 year amort = 234, 7 year amort = 273, 8 year amort = 312
Max senior = 315 drawn (plus allow liquidity in a R/C)
Amsterdam Institute of Finance
May, 2008
47
48. Project Gear - Quick Analysis
Liquidity sizingReceivables 70mm x 80%
=
56
Inventory
=
33
65mm x 50%
R/C sizing
99
(say 100)
Liquidity availability 50% actual working capital = 50% x 13% x 939 = 61
Structure
R/C
(100 / min 61 undrawn)
39.0
Term Loans
A 5 years x 25
Total 315 – 39 = 276
125.0
Tenor 276/39 = 7.1 yrs
B 6 years (3x 5 + 55.0)
70.0
Heavy back end needed
C 7 years (3x 6 + 63.0)
81.0
Total Senior secured
315.0
Subordinated/Mezzanine
126.0
Total Debt
441.0
Total Equity / Preferred etc.
294.0
Capital Structure / Value
735.0
Amsterdam Institute of Finance
May, 2008
(facilities 376)(3.6x/4.8x)
(Rollover ?)
48
49. Project Gear - Base Case
Assumptions :8 % growth
Margins gradually improve to 14%
Allow 1 mln addbacks
Capex 3.0% / Working Capital 12.8% / Tax 35%
Results :
Senior Debt pays off in 5 years (Term loans quicker)
Net cash position by year 8-9
Equity returns strong (until cash builds) based on 7x exit
Room for acquisitions / growth / recapitalization
Amsterdam Institute of Finance
May, 2008
49
50. Project Gear - Base Case
Free Cash FlowSales
EBITDA Margin
EBITDA
Add-Backs
Capex
Working Capital
FOCF pre-tax
Tax pre interest
FOCF
Amortizability
Opening Debt
Senior Int
Subord Interest
Interest Income
Repayment
Closing Debt
Growth
8.0%
3.00%
12.8%
35.0%
7.50%
11.00%
4.00%
Amort
Cum Amort
2007
2008
2009
2010
2011
2012
2013
2014
2015
2016
1014.1
11.3%
114.1
1.0
(30.4)
(9.6)
75.0
29.6
45.4
1,095.2
12.0%
131.4
1.0
(32.9)
(10.4)
89.2
34.9
54.3
1,182.9
13.0%
153.8
1.0
(35.5)
(11.2)
108.1
41.8
66.3
1,277.5
14.0%
178.8
1.0
(38.3)
(12.1)
129.4
49.5
79.9
1,379.7
14.0%
193.2
1.0
(41.4)
(13.1)
139.7
53.5
86.2
1,490.1
14.0%
208.6
1.0
(44.7)
(14.1)
150.8
57.7
93.1
1,609.3
14.0%
225.3
1.0
(48.3)
(15.3)
162.8
62.3
100.5
1,738.0
14.0%
243.3
1.0
(52.1)
(16.5)
175.7
67.3
108.4
1,877.1
14.0%
262.8
1.0
(56.3)
(17.8)
189.7
72.6
117.1
2,027.2
14.0%
283.8
1.0
(60.8)
(19.2)
204.8
78.4
126.4
441.0
23.6
13.9
(45.4)
433.1
433.1
22.0
13.9
(54.3)
414.6
414.6
19.6
13.9
(66.3)
381.7
381.7
16.1
13.9
(79.9)
331.7
331.7
11.3
13.9
(86.2)
270.6
270.6
5.7
13.9
(93.1)
197.1
197.1
13.9
(0.5)
(100.5)
110.0
110.0
13.9
(4.0)
(108.4)
11.4
11.4
13.9
(4.3)
(117.1)
(96.1)
(96.1)
13.9
(4.7)
(126.4)
(213.3)
21.8
21.8
32.3
54.1
46.8
100.9
63.8
164.7
74.9
239.7
87.4
327.1
100.5
427.5
108.4
536.0
117.1
653.0
126.4
779.4
Senior Debt
Subordinated Debt
Cash on hand
Net Debt
315.0
126.0
441.0
293.2
126.0
419.2
260.9
126.0
386.9
214.1
126.0
340.1
150.3
126.0
276.3
75.3
126.0
201.3
126.0
(12.1)
113.9
126.0
(100.5)
25.5
126.0
(108.4)
17.6
126.0
(117.1)
8.9
126.0
(126.4)
(0.4)
Total Leverage (net)
Senior Leverage (net)
4.20 x
3.00 x
3.64 x
2.55 x
2.92 x
1.97 x
2.20 x
1.38 x
1.54 x
0.84 x
1.04 x
0.39 x
0.54 x
na
0.11 x
na
0.07 x
na
0.03 x
na
na
na
105
115.1
7.00 x
805.6
419.2
386.4
132.4
7.00 x
927.0
386.9
540.1
154.8
7.00 x
1,083.4
340.1
743.3
179.8
7.00 x
1,258.9
276.3
982.7
194.2
7.00 x
1,359.1
201.3
1,157.8
209.6
7.00 x
1,467.3
113.9
1,353.3
226.3
7.00 x
1,584.1
25.5
1,558.6
244.3
7.00 x
1,710.3
17.6
1,692.7
263.8
7.00 x
1,846.5
8.9
1,837.6
284.8
7.00 x
1,993.7
(0.4)
1,994.1
31.4%
35.5%
36.2%
35.2%
31.5%
29.0%
26.9%
24.5%
22.6%
21.1%
Equity returns
EBITDA
Entry multiple
Enterprise Value
Less Debt/Add Cash
Equity value
Equity Return
Amsterdam Institute of Finance
May, 2008
735.0
441.0
294.0
50
51. Project Gear - Downside
Assumptions :0% growth
Margins flat (slight decline) to 11%
Do not allow 1 mln addbacks
Capex 3.0% / Working Capital 13% / Tax 35%
Results :
Senior Debt pays off slowly but still within 7-8 years
Term loan amortization still met
Equity returns weak
Limited room for acquisitions / growth / recapitalization
Amsterdam Institute of Finance
May, 2008
51
52. Project Gear - Downside
Free Cash FlowSales
EBITDA Margin
EBITDA
Add-Backs
Capex
Working Capital
FOCF pre-tax
Tax pre interest
FOCF
Growth
Amortizability
Opening Debt
Senior Int
Subord Interest
Interest Income
Repayment
Closing Debt
0.0%
3.00%
13.0%
35.0%
7.50%
11.00%
4.00%
Amort
Cum Amort
2007
2008
2009
2010
2011
2012
2013
2014
2015
2016
939.0
11.0%
103.3
(28.2)
75.1
26.3
48.8
939.0
11.0%
103.3
(28.2)
75.1
26.3
48.8
939.0
11.0%
103.3
(28.2)
75.1
26.3
48.8
939.0
11.0%
103.3
(28.2)
75.1
26.3
48.8
939.0
11.0%
103.3
(28.2)
75.1
26.3
48.8
939.0
11.0%
103.3
(28.2)
75.1
26.3
48.8
939.0
11.0%
103.3
(28.2)
75.1
26.3
48.8
939.0
11.0%
103.3
(28.2)
75.1
26.3
48.8
939.0
11.0%
103.3
(28.2)
75.1
26.3
48.8
939.0
11.0%
103.3
(28.2)
75.1
26.3
48.8
441.0
23.6
13.9
(48.8)
429.7
429.7
21.7
13.9
(48.8)
416.4
416.4
19.7
13.9
(48.8)
401.2
401.2
17.5
13.9
(48.8)
383.7
383.7
15.2
13.9
(48.8)
363.9
363.9
12.6
13.9
(48.8)
341.6
341.6
9.9
13.9
(48.8)
316.6
316.6
7.0
13.9
(48.8)
288.6
288.6
3.9
13.9
(48.8)
257.5
257.5
0.5
13.9
(48.8)
223.1
25.2
25.2
27.1
52.3
29.1
81.4
31.3
112.7
33.7
146.4
36.2
182.6
38.9
221.5
41.8
263.3
44.9
308.2
48.3
356.5
Senior Debt
Subordinated Debt
Cash on hand
Net Debt
315.0
126.0
441.0
289.8
126.0
415.8
262.7
126.0
388.7
233.6
126.0
359.6
202.3
126.0
328.3
168.6
126.0
294.6
132.4
126.0
258.4
93.5
126.0
219.5
51.7
126.0
177.7
6.8
126.0
132.8
126.0
(41.5)
84.5
Total Leverage (net)
Senior Leverage (net)
4.20 x
3.00 x
4.03 x
2.81 x
3.76 x
2.54 x
3.48 x
2.26 x
3.18 x
1.96 x
2.85 x
1.63 x
2.50 x
1.28 x
2.13 x
0.91 x
1.72 x
0.50 x
1.29 x
0.07 x
0.82 x
na
105
103.3
7.00 x
723.0
415.8
307.2
103.3
7.00 x
723.0
388.7
334.3
103.3
7.00 x
723.0
359.6
363.5
103.3
7.00 x
723.0
328.3
394.8
103.3
7.00 x
723.0
294.6
428.4
103.3
7.00 x
723.0
258.4
464.6
103.3
7.00 x
723.0
219.5
503.5
103.3
7.00 x
723.0
177.7
545.3
103.3
7.00 x
723.0
132.8
590.3
103.3
7.00 x
723.0
84.5
638.6
4.5%
6.6%
7.3%
7.6%
7.8%
7.9%
8.0%
8.0%
8.1%
8.1%
Equity returns
EBITDA
Entry multiple
Enterprise Value
Less Debt/Add Cash
Equity value
Equity Return
Amsterdam Institute of Finance
May, 2008
735.0
441.0
294.0
52
53. Project Gear - Worst Case
Assumptons :0% growth AND LBO/other causes lead to significant lost sales in yr 1
(loss of >10% of sales in year one follow by >5% in year 2 because of
inability to respond)
Margins decline to 9% and then 8.5%
Do not allow 1 mln addbacks
Capex 4% (committed on lower sales / respond to issues)
Working Capital 13% / Tax 35%
Results :
Amsterdam Institute of Finance
May, 2008
Senior Debt (increases / no liquidity by yr 2-3)
Never in net cash position
Equity returns gone - Need for new equity !
No flexibility
53
54. Project Gear - Worst Case
Free Cash FlowSales
EBITDA Margin
EBITDA
Add-Backs
Capex
Working Capital
FOCF pre-tax
Tax pre interest
FOCF
Growth
Amortizability
Opening Debt
Senior Int
Subord Interest
Interest Income
Repayment
Closing Debt
0.0%
4.00%
13.0%
35.0%
7.50%
11.00%
4.00%
Amort
Cum Amort
2007
2008
2009
2010
2011
2012
2013
2014
2015
2016
800.0
9.0%
72.0
(32.0)
18.1
58.1
14.0
44.1
750.0
8.5%
63.8
(30.0)
6.5
40.3
11.8
28.4
750.0
8.5%
63.8
(30.0)
33.8
11.8
21.9
750.0
8.5%
63.8
(30.0)
33.8
11.8
21.9
750.0
8.5%
63.8
(30.0)
33.8
11.8
21.9
750.0
8.5%
63.8
(30.0)
33.8
11.8
21.9
750.0
8.5%
63.8
(30.0)
33.8
11.8
21.9
750.0
8.5%
63.8
(30.0)
33.8
11.8
21.9
750.0
8.5%
63.8
(30.0)
33.8
11.8
21.9
750.0
8.5%
63.8
(30.0)
33.8
11.8
21.9
441.0
23.6
13.9
(44.1)
434.4
434.4
22.1
13.9
(28.4)
441.9
441.9
21.6
13.9
(21.9)
455.5
455.5
21.6
13.9
(21.9)
469.0
469.0
21.6
13.9
(21.9)
482.5
482.5
21.5
13.9
(21.9)
495.9
495.9
21.5
13.9
(21.9)
509.4
509.4
21.5
13.9
(21.9)
522.8
522.8
21.4
13.9
(21.9)
536.1
536.1
21.4
13.9
(21.9)
549.4
20.4
20.4
6.3
26.8
0.3
27.1
0.3
27.5
0.4
27.8
0.4
28.2
0.4
28.7
0.5
29.1
0.5
29.6
0.5
30.2
Senior Debt
Subordinated Debt
Cash on hand
Net Debt
315.0
126.0
441.0
294.6
126.0
420.6
288.2
126.0
414.2
287.9
126.0
413.9
287.5
126.0
413.5
287.2
126.0
413.2
286.8
126.0
412.8
286.3
126.0
412.3
285.9
126.0
411.9
285.4
126.0
411.4
284.8
126.0
410.8
Total Leverage (net)
Senior Leverage (net)
4.20 x
3.00 x
5.84 x
4.09 x
6.50 x
4.52 x
6.49 x
4.52 x
6.49 x
4.51 x
6.48 x
4.50 x
6.47 x
4.50 x
6.47 x
4.49 x
6.46 x
4.48 x
6.45 x
4.48 x
6.44 x
4.47 x
105
72.0
7.00 x
504.0
420.6
83.4
63.8
7.00 x
446.3
414.2
32.0
63.8
7.00 x
446.3
413.9
32.4
63.8
7.00 x
446.3
413.5
32.7
63.8
7.00 x
446.3
413.2
33.1
63.8
7.00 x
446.3
412.8
33.5
63.8
7.00 x
446.3
412.3
33.9
63.8
7.00 x
446.3
411.9
34.4
63.8
7.00 x
446.3
411.4
34.9
63.8
7.00 x
446.3
410.8
35.4
Equity returns
EBITDA
Entry multiple
Enterprise Value
Less Debt/Add Cash
Equity value
Amsterdam Institute of Finance
May, 2008
735.0
441.0
294.0
54
55. Project Gear - Responses (How & When)
Year 2007 - Probably waive with revised management plansYear 2008 - Probably amend and tighten up :
◦ Refinance ?
◦ Reporting ?
◦ Asset Sales ?
◦ Inter-creditor ?
Year 2009
◦ No improvement
◦ No liquidity
WHAT NOW ?
Enterprise Value
=
7x
6x
Debt
=
446
383
???????
Amsterdam Institute of Finance
May, 2008
55
56.
This information has been prepared solely for informational purposesand is not intended to provide or should not be relied upon for
accounting, legal, tax, or investment advice. The factual statements
herein have been taken from sources believed to be reliable, but such
statements are made without any representation as to accuracy or
completeness.
Opinions expressed are current opinions as of the
date appearing in this material only. These materials are subject to
change, completion, or amendment from time to time without notice
and CapGen Financial is not under any obligation to keep you advise
of such changes. All views expressed in this presentation are those of
the presenter, and not necessarily those of CapGen Financial.
56