")


")

")


")


")


 Информатика
Похожие презентации:


")


Architecture of integrated information systems (ARIS)
1. ARCHITECTURE OF INTEGRATED INFORMATION SYSTEMS (ARIS)
12. ARIS ARCHITECTURE CONCEPT
The Architecture of integrated Information Systems (ARIS) isbased on an integration concept derived from a holistic view of
business processes.
The first step in creating the architecture is to develop a business
process model containing all basic features for describing
business processes. The result is a highly complex model, which
is broken down into individual views so that its complexity is
reduced. Due to this breakdown, it is possible to describe the
content of individual views by special methods suitable for a
specific view without having to pay attention to the numerous view
interrelationships. The relationships between the views are
incorporated in a final step and combined to form an overall
overview of process chains without any redundancies.
2
3. ARIS ARCHITECTURE CONCEPT
A second approach that also reduces complexity is adifferentiation via descriptions. Following the lifecycle concept, the
various description methods for information systems are classified
based on their proximity to information technology. This ensures a
consistent description, from business management problems
through to technical implementation.
Thus, the ARIS concept is a framework for developing and
optimizing integrated information systems and for describing their
implementation. As the emphasis lies on the technical descriptive
level, the ARIS concept serves as a model for creating, analyzing,
and evaluating business management process chains.
3
4. ARIS DESCRIPTIVE VIEWS
Product/Service view describes relationships betweenproducts/services.
Function view contains the description of the function, an
enumeration of individual subfunctions that are part of the
overall context, and the relationships that exist between the
functions.
Organization view subsumes users and organizational units, as
well as their relationships and structures.
4
5. ARIS DESCRIPTIVE VIEWS
Resource view provides general conditions for describing othercomponents that are more directly geared toward business
management. For this reason, the components of the other
views are described in terms of their proximity to the
information technology resources. Thus, resources are dealt
with at the design specification and implementation level of the
other views. The lifecycle model that is defined as a result of
the descriptive level approach replaces the resource view as an
independent object of consideration.
Control view is provided as an additional view for describing the
relationships between views. Combining these relationships in
a separate view allows for systematic and redundancy-free
recording of all relationships. The control view is an essential
5
component of ARIS which distinguishes it from other
architecture approaches.
6. DESCRIPTIONS OF AN INFORMATION SYSTEM
67. DESCRIPTION OF THE BUSINESS MANAGEMENT PROBLEM
Individual objects or areas of consideration are modeled within theARIS architecture (views and levels) based on the initial business
situation, i. e., the business management problem.
The description mentions the weak points that information
systems currently used do have in terms of the support they
provide for existing business processes and also includes the
main content of the target concept for the system to be developed.
The target concept in turn reflects the objectives pursued by using
new information systems.
The model uses for describing the business management problem
must have the ability of recording as many facts as possible from
the data, function, and organization views, including their
interrelationships.
7
8. PROCESS CHAIN DIAGRAM (PCD)
A process chain diagram represents a closed process chain.All views of a business process (organization view, data view,
function view, resource view) are expressed with their
relationships in a coherent form.
The two columns on the left represent the chronological-logical
operational sequence of the business process under
consideration. Individual functions of the procedure are listed in
the second column and linked to the events by which they are
triggered and which they generate. The connections between
functions and events define exactly which events trigger functions
and which events are generated by functions and thus regulate
the control flow between functions.
8
9. DESIGN ELEMENTS FOR PROCESS CHAIN DIAGRAM
910. PROCESS CHAIN DIAGRAM (EXAMPLE)
1011. FUNCTION VIEW
The ARIS architecture strictly separates the various areas ofconsideration. The function view covers only those means of
representation that show the interconnections between functions.
Relationships between functions and data are displayed in the
ARIS process view.
A function is a technical task or activity performed for an object to
support one or more business objectives. Mostly a noun is used
as the function name. Functions are displayed as rectangles with
rounded corners:
Check order
11
12. FUNCTION TREE
Functions can be described at different aggregation levels.Accumulations of functions in the form of business processes or
process chains form the top level of aggregation.
A business process thus represents a complex function that can
be broken down into subfunctions to reduce its complexity.
The term “function” can be used at all hierarchy levels. However,
other terms, such as procedure, process, subfunction, or
elementary function, are also used to indicate the hierarchy level.
Breaking down functions can be done across multiple hierarchy
levels.
Elementary functions represent the lowest level in semantic
function trees. Elementary functions are functions that, from the
business management point of view, cannot be broken down any
further.
12
13. EXAMPLE OF THE FUNCTION TREE
1314. GROUPING FUNCTIONS
Grouping functions within a function tree can be performedaccording to different criteria:
object-oriented – processing of the same object
process-oriented – breakdown according to process affiliation
(is recommended for function trees that represent the results
of business process modeling)
execution-oriented – means that all functions performing the
same operation for different information objects are grouped
together
14
15. GROUPING FUNCTIONS (EXAMPLES)
1516. DESIGN SPECIFICATION – APPLICATION SYSTEM TYPE DIAGRAM
The design specification of the function view contains thespecification for the application system and module types, as well
as the modular structure of the application system type, an outline
of individual transaction steps, and the definition of input and
output presentations in the form of draft lists and screen designs.
Key questions to which the design specification of the function
view provides answers are:
How can application system types, module types, or IT
functions support the functions defined in the requirements
definition?
What is the modular structure of application system types or
module types?
Which lists and screens are required to carry out a function?
16
17. DESIGN SPECIFICATION – APPLICATION SYSTEM TYPE DIAGRAM
Which lists can be created with an application system type ora module type, and which screens do application system
types and module types use?
What technology (operating system, user interface, database
management system) is an application system type
based on?
Which business objectives are pursued when a specific
application system type is used?
17
18. DESIGN SPECIFICATION – APPLICATION SYSTEM TYPE DIAGRAM
The Application system type is the key object type of the functionview's design specification. Unlike concrete application systems
that come into play only at the implementation level of the function
view and that represent specific, identifiable (e.g., by a license
number) application systems within a company, application
system types are generated as the result of typifying all
application systems that are based on precisely the same
technology.
Application system types are represented by the following graphic
symbol:
18
19. APPLICATION MODULS TYPE
As with application system types, module types typify individualmodules that are based on precisely the same technology. Module
types are components of application system types. They are
capable of autonomous operation. A module type is a component
of an application system type, which is capable of autonomous
operation. Module types typify individual modules that are based
on precisely the same technology.
19
20. MODULAR STRUCTURE OF AN APPLICATION SYSTEM TYPE
2021. APPLICATION MODULS TYPE
Application system types and module types can be arranged inany hierarchy. At the lowest level, module types can be divided
into IT function types.
An IT function type, in the sense of a transaction, is the smallest
unit of a module type. IT function types are realized as individual
program modules and must always be carried out completely to
process an individual work step. Graphical representation of an IT
function type:
21
22. ALLOCATION OF FUNCTIONS TO APPLICATION SYSTEM TYPES
The application system type diagram is also a means of definingthe functions of the requirements definition that are supported by
the specified application system types and module types. This
assignment forms the link between the requirements definition
and the design specification of the function view.
22
23. APPLICATION SYSTEM TYPE CONFIGURATION
To obtain a more detailedspecification of the technology
that application system types
and module types are based on,
it is possible to allocate to them
the types of user interfaces,
database management systems,
and operating systems under
which they can run, as well as
the programming languages that
are used to implement them.
As this concerns types and not
concrete specimens, multiple
relationships are possible.
23
24. SCREEN AND LIST ASSIGNMENTS
Processing a technical function with the support of an applicationsystem involves the use of various screens and the creation or
use of various lists provided by the corresponding application
system. For this purpose, the List and Screen objects are
available and can be assigned to either the technical function or
the application system types and module types.
24
25. IMPLEMENTATION – APPLICATION SYSTEM TYPE DIAGRAM
In the application system type diagram can be assigned specificapplication systems and modules to the application system types
and module types described in the design specification.
An application system (module) is an individual specimen of an
application system type (module type), which can be uniquely
identified, e.g., by the license number.
Application systems and modules are displayed graphically:
25
26. ASSIGNMENT OF APPLICATION SYSTEMS TO THEIR APPLICATION SYSTEM TYPES
2627. DIFFERENT MODULAR STRUCTURE OF TWO APPLICATION SYSTEMS OF THE SAME TYPE
2728. ASSIGNMENT OF APPLICATION SYSTEM TYPES, PROGRAM MODULE TYPES, AND PROGRAM MODULES
2829. DATA VIEW
The requirements definition of the data view includes a descriptionof the semantic data model of the area of consideration. In line
with the breakdown approach stipulated by ARIS, the description
covers both the objects that specify the start and end events of a
process chain and the current state of the relevant process chain
environment.
Unlike function modeling, data modeling is particularly demanding
as far as the method is concerned. In the function view, the only
object examined is the function. Furthermore, relationships
between functions simply illustrate superordination or
subordination.
29
30. ENTITY-RELATIONSHIP MODEL (ERM)
Entity-Relationship Model (ERM) is the most widely useddesigning method for semantic data models (Chen, The EntityRelationship Model, 1976). This modeling method uses a variety
of specialized terms, such as entity type, relationship type,
attribute, etc.
The base model distinguishes between entities, attributes, and
relationships. Basically, a difference is made between type level
and occurrence level.
30
31. ENTITIES
Entities are real or abstract objects that are relevant for thebusiness management tasks being examined. For example, an
object of consideration may be a business process.
Entities are described in more detail by means of specific
attributes (properties). For example, a customer can be specified
more precisely by his name, first name, and address. If similar
entities are grouped into sets, these are referred to as entity
types, the individual occurrences of which are the entities.
Entities of a similar type can be described by the same attributes.
Entity types are displayed as rectangles.
31
32. ATTRIBUTES
Attributes are properties describing entity types. Attributeoccurrences are specific values of attributes of individual entities.
For example, the customer can be described by attribute
occurrences such as Miller, Peter, and Munich. The relevant
attributes are Name, First name, and City.
Attributes are usually represented by an oval or a circle.
32
33. RELATIONSHIPS
A relationship is a logical link between entities. Therefore, theexistence of relationships directly depends on the existence of
entities. If similar relationships are grouped into sets, these are
referred to as relationship types. In an ERM, relationship types are
displayed as diamonds and are linked with entity types via
connections.
33
34. CARDINALITIES OF RELATIONSHIPS BETWEEN TWO ENTITY TYPES
Four different types of relationships (cardinalities) can be pointedout:
1:1 relationship – each entity of the first set is assigned to
exactly one entity of the second set
1:n relationship – each entity of the first set is assigned to
exactly one entity of the second set, but each entity of the
second set may be connected with various entities of the first
set
n:1 relationship – means the same, but in reverse order
n:m relationship – multiple entities of the second set are
assigned to each entity of the first set and vice versa
34
35. CARDINALITIES OF RELATIONSHIPS BETWEEN TWO ENTITY TYPES
3536.
REPRESENTATION OFCARDINALITIES IN THE ERM
36
37.
REPRESENTATION OFCARDINALITIES IN THE ERM
Due to the fact that relationships between entities of one entity
type are allowed, two parallel connections may exist between an
entity type and a relationship type. These connections may be
distinguished by assigning role names.
37
38.
REPRESENTATION OFCARDINALITIES IN THE ERM
38
39. eERM EXTENSIONS
For extending ERM modeling, four basic design operators havebecome accepted:
Classification
Generalization
Aggregation
Grouping
39
40. CLASSIFICATION
Through classification, objects (entities) of the same type areidentified and assigned to a term (entity type). Two objects are
identical if the same properties (attributes) are used to describe
them. Classification thus results in the previously described
identification of entity types.
40
41. GENERALIZATION / SPECIALIZATION
Generalization means that similar object types are grouped undera superior object type.
Properties (described by attributes) that both source objects share
are transferred to the generalized object type. Thus, only those
attributes in which the source object types differ are left to be
described. The formation of the new entity type is graphically
represented by a triangle, also called an ”is a” relationship.
Specialization is the breakdown of a generic term into subterms.
Specialization is the reverse of generalization. The specialized
objects inherit the properties of the generalized object. Apart from
these inherited attributes, the specialized object types may have
their own attributes. Graphically, specialization and generalization
are represented in the same way. For this reason, the links are not
drawn as arrows indicating a direction.
41
42. GENERALIZATION / SPECIALIZATION
4243. AGGREGATION
Aggregation is the formation of new object types by combiningexisting object types. The new object type can be carrier of new
properties.
In the ERM, aggregation is expressed by the formation of
relationship types.
The aggregation operator can also be applied to relationships. An
existing relationship type is then treated as an entity type and can
thus become the starting point for creating new relationships.
43
44. DATA CLUSTER
In an ERM, a complex structural context is split into a transparentstructure. As the relation to the overall structure might become
obscured, complex objects in the form of data clusters are
introduced.
A data cluster is the logical view of multiple entity types and
relationship types of a data model that are required for describing
a complex object.
Besides entity types and relationship types, data clusters
themselves can be part of a data cluster, too. Unlike entity and
relationship types, data clusters can be arranged in any hierarchy
and thus mainly support a top-down procedure in the process of
creating data models. However, forming data clusters may also be
very helpful when combining and consolidating submodels during
a bottom-up approach.
44
45. DATA CLUSTER VIEW OF MULTIPLE OBJECTS
4546. GROUPING
Grouping forms groups from the elements of an entity set.For example, all Operating resources are combined into an
Operating resources group. The operating resources group is an
independent object which can be described more precisely by
additional attributes (name of the operating resources group,
number of operating resources) not contained in the individual
operating resources.
46
47. EXTENSION OF CARDINALITIES
When specifying cardinalities, so far only the upper limit for theadmitted number of relationship occurrences was indicated.
For example, the cardinalities indicate that a project can be
assigned a maximum number (m) of employees and one
employee can participate in a maximum number (n) of projects.
47
48. EXTENSION OF CARDINALITIES
The upper limit, the lower limit specifying the minimum number ofrelationship occurrences may also be of interest.
For this purpose, the cardinalities can be expressed as a letter
pair (a, b). The letter pair (a1, b1) in the following figure indicates
that every project can participate in at least a1 and at most b1
relationship occurrences of the works in type, which means that
every project can be assigned at least a1 and at most b1
employees. The other letter pair (a2, b2) indicates that one
employee can participate in at least a2 and in at most b2 projects.
48
49. EXTENSION OF CARDINALITIES
Every relationship is defined by two degrees of complexity(minimum, maximum). The lower limit often has the values 0 and
1, whereas the value range for the upper limit is defined as
1 <= max <= * (where * is “any number”).
A lower limit of min = 0 means that an entity may participate in a
relationship, but does not necessarily have to.
A lower limit of min = 1 indicates that an entity must participate in
at least one relationship.
49
50. EXTENSION OF CARDINALITIES
In the example, the lower limits indicate that an employee mayparticipate in a relationship, but does not necessarily have to
(min = 0), while a project has to participate in at least one
relationship (min = 1). What is expressed here is that there can be
employees who are not assigned to a project. In turn, however,
every project must be assigned at least one employee.
50
51. TECHNICAL TERMS MODEL
Technical terms model can be used to manage the various termsin the form of synonym management for data objects, or to specify
the relationships that exist between the objects of data models
(entity type, relationship type, etc.) and the technical terms used
within the company.
Technical terms can be interrelated and may be arranged in a
hierarchy.
51
52. TECHNICAL TERMS MODEL
5253. eERM ATTRIBUTE ALLOCATION DIAGRAM
eERM attribute allocation diagramsenable to assign ERM attribute
allocations to every entity type and
relationship type in a separate
model. The object type of the
eERM (entity type or relationship
type) can be included in this model
as an occurrence copy, and the
relationships to the ERM attributes
can be modeled. It is possible to
distinguish whether the linked ERM
attribute is a key attribute, a foreign
key, or a descriptive attribute.
53
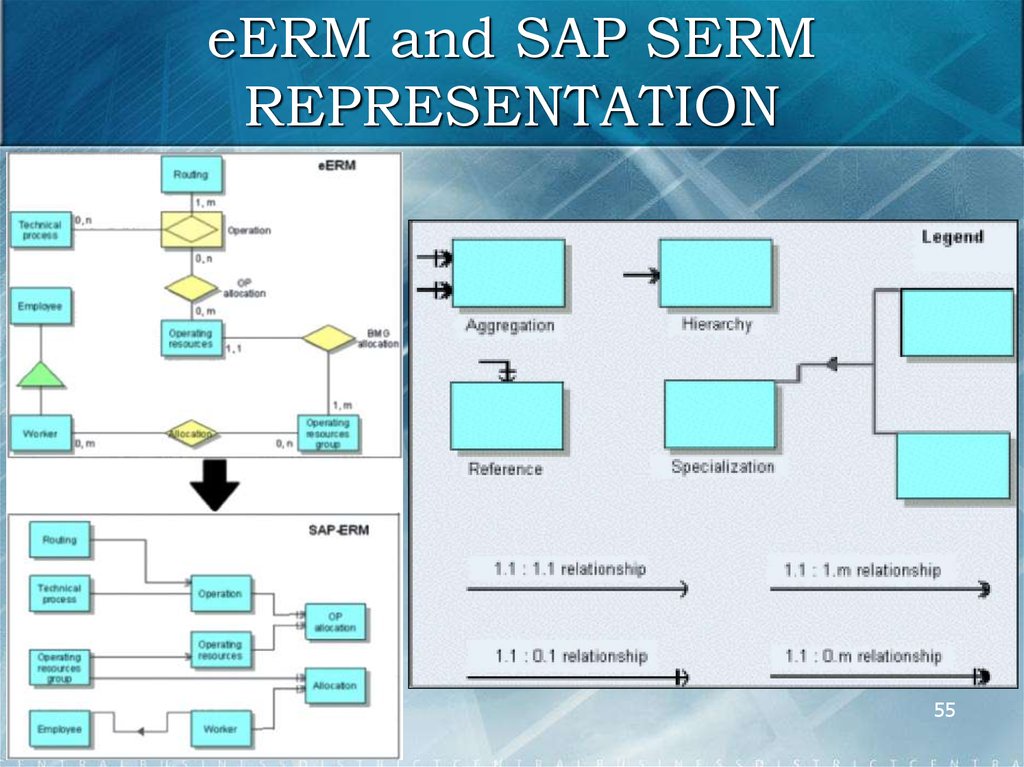
54. SAP SERM
The modeling technique developed by SAP AG. In this context, nographic distinction is made between entity types and relationship
types during object formation. The dependencies between
information objects are expressed by the relationship complexity
of the arrow representations. A distinction is made between
hierarchical, aggregating, and referential relationships:
Hierarchical relationships define a unilateral existence
dependency between information objects. Aggregating
relationships correspond to the formation of relationship types
based on the eERM approach.
Referential relationships describe logical dependencies
between reinterpreted entity types and original entity types
based on the eERM approach.
Specialization is represented in analogy to the ERM
54
approach.
55.
eERM and SAP SERMREPRESENTATION
55
56.
eERM: TERMS AND FORMSREPRESENTATION
56
57.
eERM: TERMS AND FORMSREPRESENTATION
57
58. DOCUMENT TYPE DEFINITION
A model of the DTD (Document Type Definition) type describesthe rules according to which an XML document of a specific type
must be structured. The description is provided in the form of
element type declarations.
A DTD can be used to define the general structure of a document
type. A valid document of a document type defined in the DTD can
be created as an XML document. This has the advantage that the
document can be processed by various programs based on the
corresponding DTD.
58
59. MATERIAL FLOW MODELING – MATERIAL DIAGRAM
To illustrate the material flow in process models material types areallocated to individual functions of the business process in the
form of function input or output.
In the material diagram, can be defined material types, arranged
them in a hierarchy, and assigned them to material classes.
A material type typifies individual materials with identical material
properties.
Similar material types can be combined to form a material class.
The similarity can be based on different classification criteria.
Thus, a material type can be assigned to multiple material
classes. Material types can be assigned to packaging material
types. This indicates that certain material types can only be
transported in specific packaging material types.
59
60. MATERIAL FLOW MODELING – MATERIAL DIAGRAM
Packaging material types can also be arranged in hierarchies andclassified. This enables the structure and restrictions of complex
bulk packaging to be illustrated.
A packaging material type typifies individual packaging materials
with identical properties (e. g., material properties).
Similar packaging material types can be combined to form a
packaging material class. The similarity can be based on different
classification criteria. Thus, a packaging material type can be
assigned to multiple packaging material classes.
60
61. EXAMPLE OF A MATERIAL DIAGRAM
6162. MODELING THE DATA WAREHOUSE STRUCTURE
The Data Warehouse structure diagram describes the structure ofa Data Warehouse. Primarily, the diagram is a static description,
i.e., it illustrates the interrelation of data as well as their locations.
In the ARIS architecture this type of description is realized in the
data view. The focus lies on the interrelation and arrangement of
information. The data dimensions are described by the info cube.
The interplay of the dimensions is represented by the star schema
(see the following figure). A dimension can serve as a key for
connecting other dimensions. The objects of individual dimensions
can have specific values, which are cataloged in fact tables and
are exactly defined by KPIs. Dependencies are described in
dimension tables listing their key attributes and characteristics.
The hierarchical interrelations of the features are described by
tree structures. Finally, dimensions can be allocated to master62
data tables using the structure diagram.
63. DATA WAREHOUSE IN THE STAR SCHEMA
6364. AUTHORIZATION HIERARCHY
The authorization hierarchy diagram is used in role modeling andorganizational modeling. It illustrates the relationships of
authorizations that were defined in the role diagram. Superior and
subordinate authorizations are defined to ensure a logical
structure and avoid authorization conflicts.
The authorization hierarchy diagram is closely associated with the
role diagram. The authorizations listed are used in the role
description to define the requirements profile. The structure
corresponds to that of a function tree.
64
65. AUTHORIZATION HIERARCHY
6566. COST DRIVER DIAGRAM
The CD diagram (cost driver diagram) is used in process costmanagement (e. g., with ARIS Business Optimizer).
The CD diagram represents the cost driver hierarchy.
A cost driver is an informative indicator or reference value for
estimating the costs of a specific process. The reference value
should be an operational value that can be easily derived from
available information sources and is proportional to accruing
costs.
66
67. COST DRIVER DIAGRAM
Cost drivers can be defined only for performance amount-variableor performance amount-induced processes.
The hierarchy of cost drivers is represented in the CD diagram by
directed connections of the determines volume of type.
The CD ratio numerator and CD ratio denominator attributes must
be specified for these connections.
If CD ratio denominator is not specified, a value of 1 is assumed.
The quotient of these two attributes determines the quantity ratio
between the two cost drivers for process calculation.
67
68. COST DRIVER DIAGRAM
6869. COST CATEGORY DIAGRAM
The cost category diagram is used in process cost management,e.g., with ARIS Business Optimizer. They illustrate the hierarchy of
cost categories.
Cost categories serve to systematically structure all costs that
arise from the creation and utilization of cost objects.
The question is: What costs have been incurred?
The hierarchy of cost categories is illustrated in the cost category
diagram by directed connections of the is superior type.
An important attribute for cost categories is performance scale. It
describes the unit in which cost category performance is
measured (e.g., hours for wages and square meters for
occupancy costs).
69
70. COST CATEGORY DIAGRAM
7071. RELATIONS DIAGRAM
In the design specification, the logical data structures designed inthe requirements definition are transformed into a form of
description that concrete database systems can be based on.
ARIS provides the relations diagram for this purpose.
The relations diagram and the attribute allocation diagram are
available to define existing relations and attributes including their
relationships to the information objects introduced in the
requirements definition.
71
72. RELATIONS DIAGRAM
In a first step, the required relations are defined in the relationsdiagram.
A relation describes an entity type through its attributes. A relation
is a subset of possible value range combinations of individual
attributes.
Every eERM entity type now constitutes a relation in the relations
diagram. When realizing relationship types of an eERM, the
cardinality is a very important factor in deciding whether or not to
create a separate relation for the relationship type.
Unlike 1:n relations, n:m relations must be represented in
72
separate relations.
73. RELATIONS DIAGRAM
In a second step, the relations diagram can indicate for eachrelation which entity type or relationship type of the eERM it
represents.
A relation can be specified in more detail by listing its attributes.
Whether the corresponding attribute serves as a key attribute,
foreign key attribute, or descriptive attribute may be defined by
specifying the relevant connection when linking the relation and
the attribute. Also, the relationship of every single attribute to the
ERM attribute of the requirements definition it illustrates can be
established.
73
74. ALLOCATION OF THE REQUIREMENTS DEFINITION ATTRIBUTES AND DATA OBJECTS
7475. ATTRIBUTE ALLOCATION DIAGRAM
To reduce representation complexity, the attributes of everyrelation can be defined in an attribute allocation diagram that is
linked to the relation.
75
76. LOGICAL VIEW OF MULTIPLE RELATIONS
The data clusters of the requirementsdefinition are realized in the design
specification by a separate object type
called “View”.
Based on the definition of data clusters,
“View” is defined as: A “View” is the
logical view of multiple relations.
76
77. SYSTEM ATTRIBUTES MODEL
The System attributes model type is primarily designed to performdata export-oriented tasks in ARIS Business Architect. This model
type enables you to arrange entity types, events, technical terms,
functions, information carriers, organizational units, and persons
in a hierarchy, and specify them uniquely and comprehensively
according to their data processing requirements. This data can be
typified based on the usual database requirements as primary and
foreign keys, as well as descriptive and mandatory fields.
To determine the domain types of these data objects, you can
assign the System attribute domain model type.
In contrast to ERM attributes, the main feature of system attributes
is the representation and management of interface-oriented data.
To ensure high flexibility in terms of the contents to be exported,
the system attribute objects contain two value fields that can be
77
filled with relevant information.
78. EXAMPLE OF A “SYSTEM ATTRIBUTES” MODEL
7879. SYSTEM ATTRIBUTE DOMAIN
The System attribute domain model type is used to define thesystem attribute objects based on the data type; it specifies the
domain type (char, int, date, etc.) and field length, for example. It
is mainly used to provide information when data is exported to
external systems.
79
80. TABLE DIAGRAM
The table diagram is used to describe the tables and fields of adatabase system.
The individual fields assigned to this table can be shown for each
table. For further specification, a sorting index and the domain can
be assigned to each field.
80
81. FIELD ALLOCATIONS
8182. ALLOCATION OF REQUIREMENTS DEFINITION AND DESIGN SPECIFICATION OBJECTS
As relations of a relations diagram are not necessarily convertedinto tables and fields on a 1:1 basis (e. g., for reasons of database
performance), multilateral relationships between tables and
relations or entity types may occur. These relationships can be
illustrated in the table diagram by selecting the relevant
connections. The data clusters defined in the requirements
definition or the views defined in the relations diagram are
represented in the table diagram by the View (physical) object.
82
83.
ALLOCATION OFREQUIREMENTS DEFINITION AND
DESIGN SPECIFICATION OBJECTS
Due to the fact that converting or documenting database tables
and fields used in a company does not necessarily require the
definition of a relational schema, both the realization relationships
between relations (or attributes) and tables (or fields) and
between entity types (or ERM attributes) and tables (or fields) can
be represented.
The representation may focus either on the relations and
attributes realized by the tables and fields, or – leaving out the
relational definitions – on the entity types, relationship types, and
ERM attributes illustrated by the tables and fields.
83
84.
ALLOCATION OFREQUIREMENTS DEFINITION AND
DESIGN SPECIFICATION OBJECTS
84
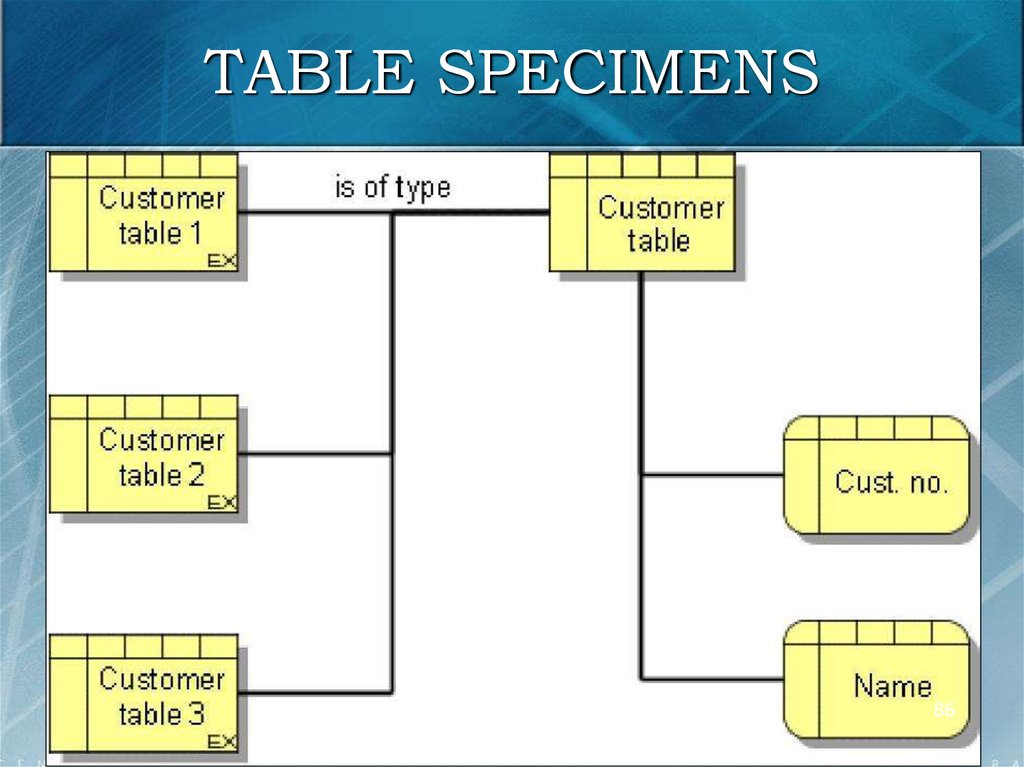
85.
TABLE SPECIMENSTo be able to define the exact location of specific tables and fields
in a company, it must be possible to define every single specimen
of a table. The same applies when the privileges for accessing
tables and fields are to be specified for organizational units.
The Table object type introduced earlier determines the logical
structure of a physical table and its fields at the Type level.
However, multiple specimens of every table thus defined may
exist on different media or at different locations in a company. This
fact can be represented using the Table (specimen) and Field
(specimen) object types.
With the help of these objects, the specimen count of a table or
a field can be determined exactly.
85
86.
TABLE SPECIMENS86
87.
ORGANIZATION VIEWCompanies are complex social structures that are divided into
manageable units. To deal with the given complexity, patterns are
defined and rules established. The result of this process is called
organization.
In a company's organizational design, a distinction can be made
between the organizational structure and the process
organization.
The organizational structure encompasses the rules by which the
company is statically structured. The process organization
contains the rules relating to the tasks to be performed by the
company. This task-related structure in the sense of distributing
functions to task performers is dealt with in the control view of the
ARIS house. The organization view basically looks at a company's
organizational structure.
87
88.
ORGANIZATION VIEWThe design of an ideal company organization with the aim of
reducing coordination efforts to a minimum depends on the
company's business environment and objectives. Therefore, it is
not possible to define universally valid ideal organizational
structures that may serve as reference structures.
Both the design and use of information systems had their focus on
this functional breakdown of companies for a long time. However,
looking at integrated process chains in the sense of cohesive
processing of similar data objects makes it difficult to establish
interrelationships between individual functions for such a
structural design.
88
89.
ORGANIZATION CHARTA typical way of representing organizational structures is the
organizational chart. In this chart, organizational units (as task
performers) and their interrelationships are represented according
to the structuring criteria selected.
Organizational units are the performers of the tasks that must be
carried out in order to achieve the business objectives.
Organizational units are linked via relationships.
89
90.
ORGANIZATIONAL CHART WITHPOSITION AND PERSON ASSIGNMENT
The Position object type is provided to represent individual
positions within the company, for example, positions for which
descriptions exist. This object type is illustrated in the following
figure. Multiple positions can be assigned to an organizational
unit. The meaning of the connections corresponds to the
interaction between organizational units.
Individual persons in the company can be assigned to the
positions and organizational units. ARIS offers separate objects
for persons. The assignment of an individual person to an
organizational unit shows that this person is assigned as an
employee to this organizational unit, whereas the assignment to
an individual position defines the current staffing in the company.
90
91.
ORGANIZATIONAL CHART WITHPOSITION AND PERSON ASSIGNMENT
91
92.
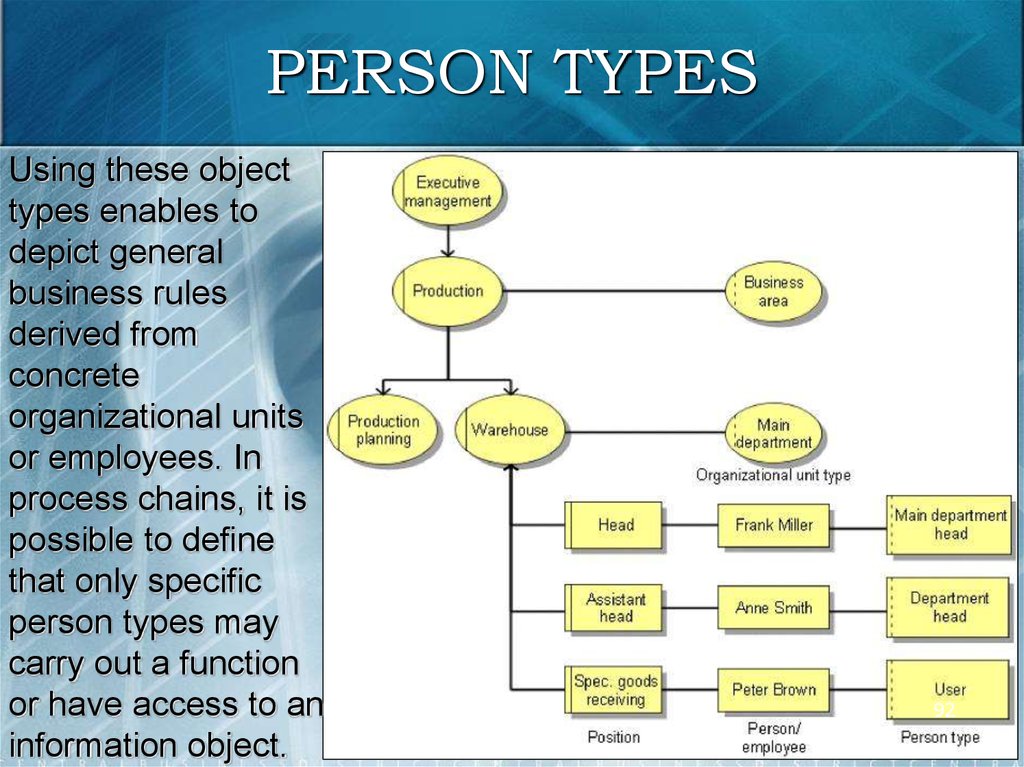
PERSON TYPESUsing these object
types enables to
depict general
business rules
derived from
concrete
organizational units
or employees. In
process chains, it is
possible to define
that only specific
person types may
carry out a function
or have access to an
information object.
92
93.
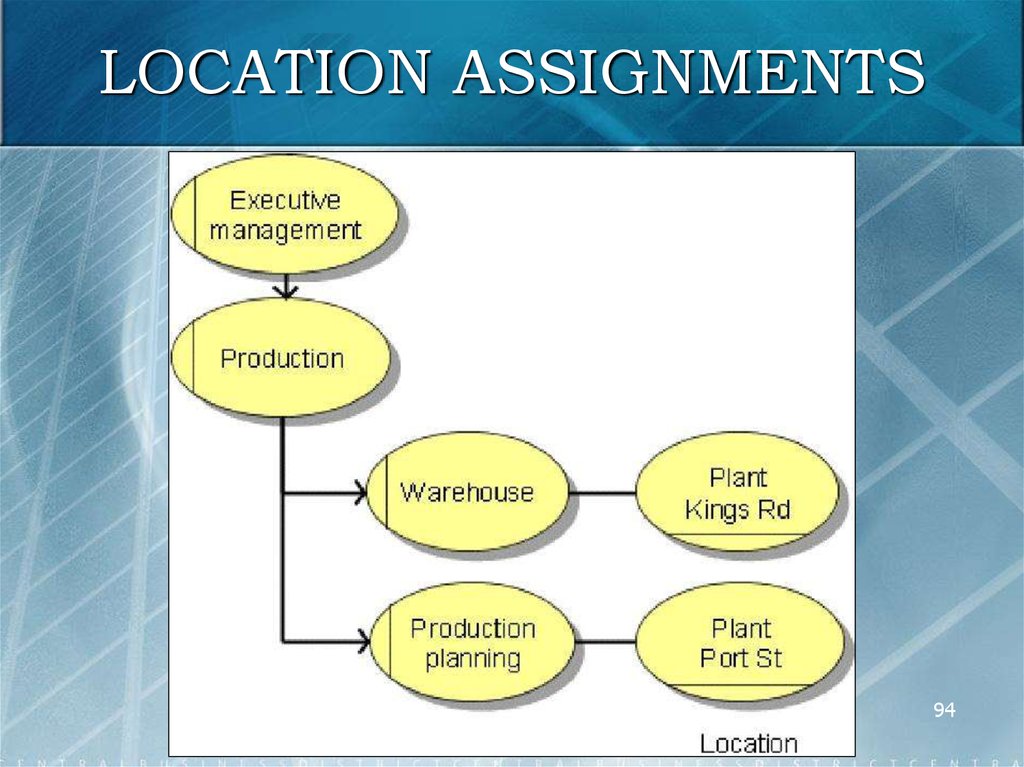
LOCATION ASSIGNMENTSThe modeling of the organizational structure of the company is the
starting point for the network topologies to be defined at the
design specification level, which are to support this organizational
structure as best as possible. Included in the definition of the
network topology are network connections and network nodes,
which may be found at particular locations of the company.
The location of an organizational unit is the most important link
between requirements definition and design specification of the
organization view. Thus, the location of every organizational unit is
already defined in the requirements definition.
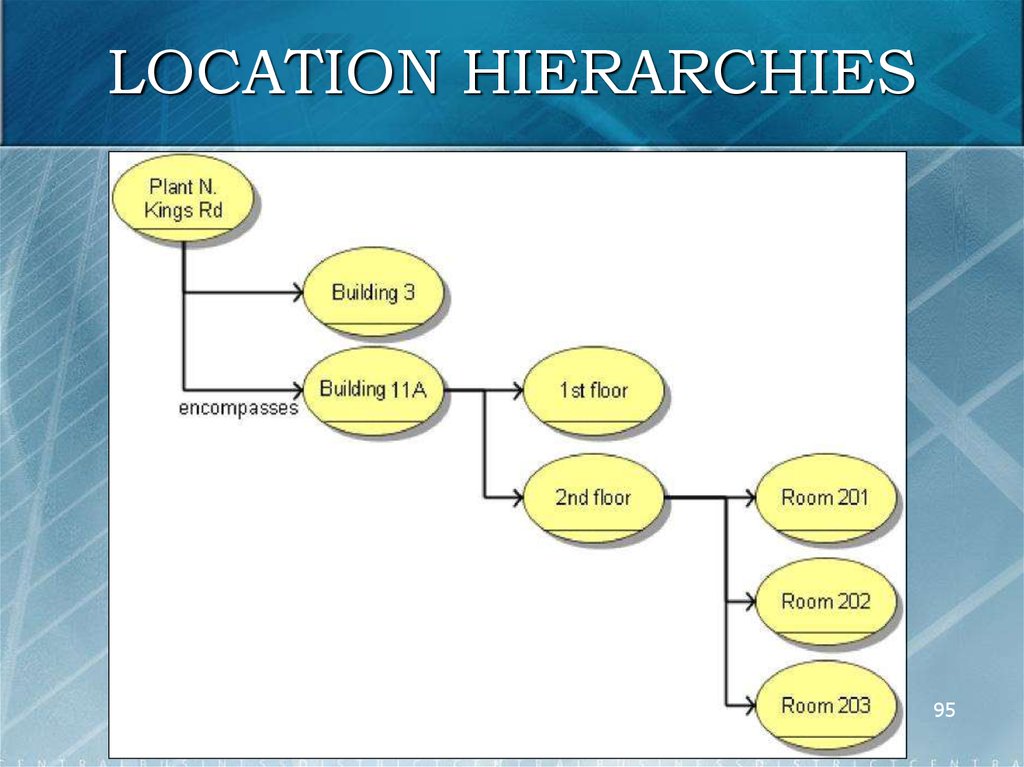
Locations may be arranged in any required hierarchy. A location
can be an entire plant, a building or, for a more detailed
examination, an office through to an individual workstation in a
room.
93
94.
LOCATION ASSIGNMENTS94
95.
LOCATION HIERARCHIES95
96.
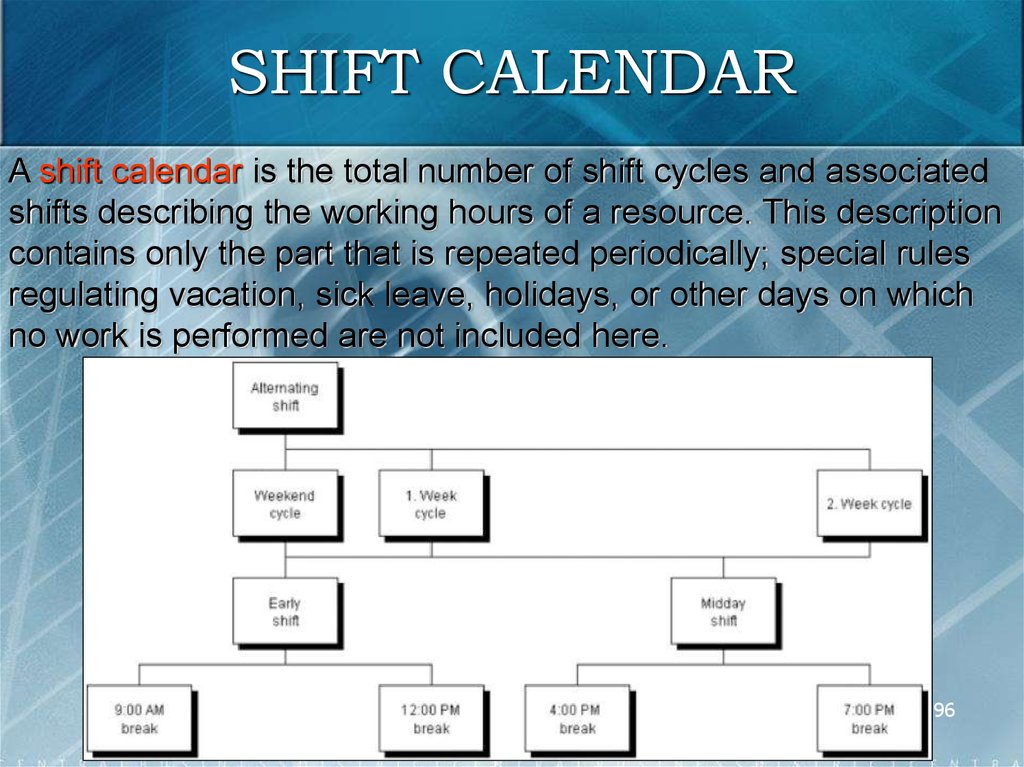
SHIFT CALENDARA shift calendar is the total number of shift cycles and associated
shifts describing the working hours of a resource. This description
contains only the part that is repeated periodically; special rules
regulating vacation, sick leave, holidays, or other days on which
no work is performed are not included here.
96
97.
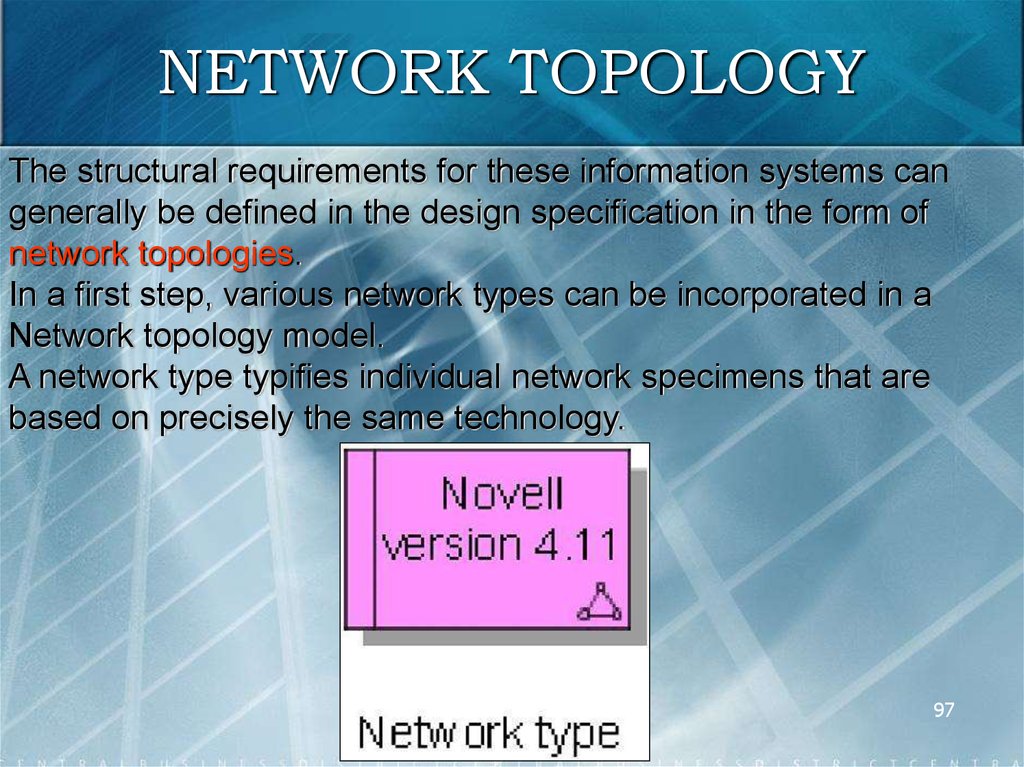
NETWORK TOPOLOGYThe structural requirements for these information systems can
generally be defined in the design specification in the form of
network topologies.
In a first step, various network types can be incorporated in a
Network topology model.
A network type typifies individual network specimens that are
based on precisely the same technology.
97
98.
NETWORK TOPOLOGYThe link between network topology and the objects of the
requirements definition is established via two approaches:
1. For every single hardware component type the organizational
unit or position responsible for it can be specified.
2. It is possible to define for each network type, network node
type, network connection type, and hardware component type
at which location within the company they may be found.
Thus, the location is the central link between the requirements
definition and the design specification of the organization
view.
98
99.
NETWORK TOPOLOGY99
100.
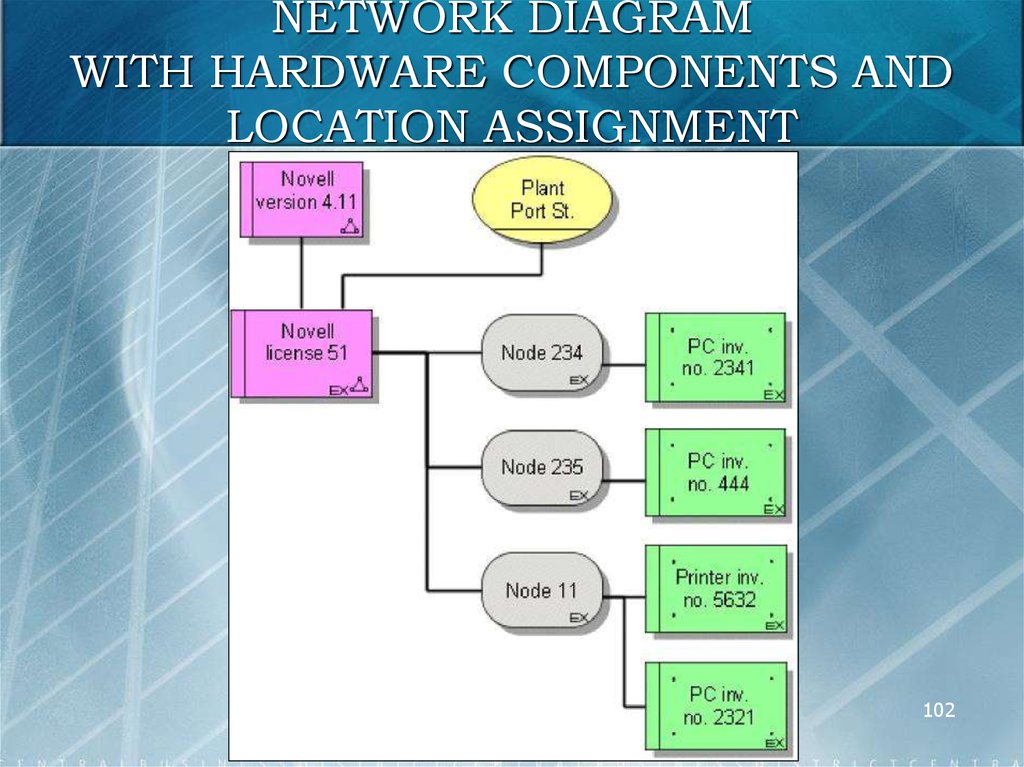
NETWORK DIAGRAMThe network diagram illustrates the realization of the network
topology defined in the design specification.
The networks that exist in the company are recorded by means of
the Network object. It is possible to specify for each network the
network nodes and network connections it consists of. The exact
location of every network, network node, and network connection
within the company can be indicated. A location can be an entire
plant, a specific building, a complex of buildings, an office, or an
individual workstation.
100
101.
NETWORK DIAGRAM WITHLOCATION ASSIGNMENT
101
102.
NETWORK DIAGRAMWITH HARDWARE COMPONENTS AND
LOCATION ASSIGNMENT
102
103.
MATERIAL FLOW MODELING –TECHNICAL RESOURCES
To illustrate the material flow in process models material types are
allocated to individual functions of the business process in the
form of function input or output. Similar to the allocation of
information objects to functions (representation of information
transformation by functions), this allocation represents the
transformation of input material types to output material types.
Additionally, the technical resources required for transforming
materials can be recorded in the process chains. In this context, a
distinction is made between operating resources, warehouse
equipment, transport systems, and technical operating supplies.
103
104.
MATERIAL FLOW MODELING –TECHNICAL RESOURCES
In the Technical resources model type you can arrange technical
resources in a hierarchy, assign a type to them, and classify them.
The following object types are available for this purpose:
Operating resource. Operating resources are specimens of
various operating resource types that are available for a
company to perform its tasks. Operating resources are often
identified by inventory numbers (e.g., number of a production
plant).
Operating resource type. An operating resource type typifies
individual operating resources that are based on precisely the
same technology.
104
105.
MATERIAL FLOW MODELING –TECHNICAL RESOURCES
Operating resource class. Similar operating resource types
can be combined to form an operating resource class. The
similarity can be based on different classification criteria.
Thus, an operating resource type can be assigned to multiple
operating resource classes.
Warehouse equipment. Warehouse equipment items are
specimens of various warehouse equipment types that are
available for a company to perform its tasks. Warehouse
equipment items are often identified by inventory numbers.
Warehouse equipment type. A warehouse equipment type
typifies individual warehouse equipment items that are based
on precisely the same technology.
105
106.
MATERIAL FLOW MODELING –TECHNICAL RESOURCES
Warehouse equipment class. Similar warehouse equipment
types can be combined to form a warehouse equipment class.
The similarity can be based on different classification criteria.
Thus, a warehouse equipment type can be assigned to
multiple warehouse equipment classes.
Technical operating supply. A technical operating supply is an
individual specimen of a technical operating supply type. In
general, it can be identified by means of an inventory number.
Technical operating supply type. A technical operating supply
type typifies individual technical operating supply items that
are based on precisely the same technology.
106
107.
MATERIAL FLOW MODELING –TECHNICAL RESOURCES
Technical operating supply class. Similar technical operating
supply types can be combined to form a technical operating
supply class. The similarity can be based on different
classification criteria. Thus, a technical operating supply type
can be assigned to multiple technical operating supply
classes.
Transport system. A transport system is an individual
specimen of a transport system type. In general, it can be
identified by means of an inventory number or a plant number.
Transport system type. A transport system type typifies
individual transport systems that are based on precisely the
same technology.
107
108.
MATERIAL FLOW MODELING –TECHNICAL RESOURCES
Transport system class. Similar transport system types can be
combined to form a transport system class. The similarity can
be based on different classification criteria. Thus, a transport
system type can be assigned to multiple transport system
classes.
108
109.
EXAMPLE OF A “TECHNICALRESOURCES” MODEL
109
110.
PROCESS VIEW / CONTROL VIEWThe relationships between the objects of the data, organization,
and function views are analyzed in the control/process view. The
relationships to be analyzed result from the connections between
the views.
First, the relationships between two views are examined, then
diagrams are introduced, illustrating the relationships between all
three views.
110
111.
LINKING FUNCTIONS WITHORGANIZATION
Linking the function view with the organization view serves to
allocate the functions defined in the function tree to the task
performers (organizational units) of the organizational chart.
This allocation defines an organizational unit's responsibility and
decision-making power with regard to its allocated functions.
Looking at how these organizational allocations are realized in a
process chain (business processes) enables to identify the degree
of functional integration, i.e., the number of business process
functions that are to be processed by an organizational unit.
111
112.
ALLOCATION OF ORGANIZATIONALELEMENTS TO FUNCTIONS
112
113.
EVENT-DRIVEN PROCESSCHAIN (EPC)
Linking the function view with the organization view serves to
allocate the functions defined in the function tree to the task
performers (organizational units) of the organizational chart.
This allocation defines an organizational unit's responsibility and
decision-making power with regard to its allocated functions.
Looking at how these organizational allocations are realized in a
process chain (business processes) enables to identify the degree
of functional integration, i.e., the number of business process
functions that are to be processed by an organizational unit.
113
114.
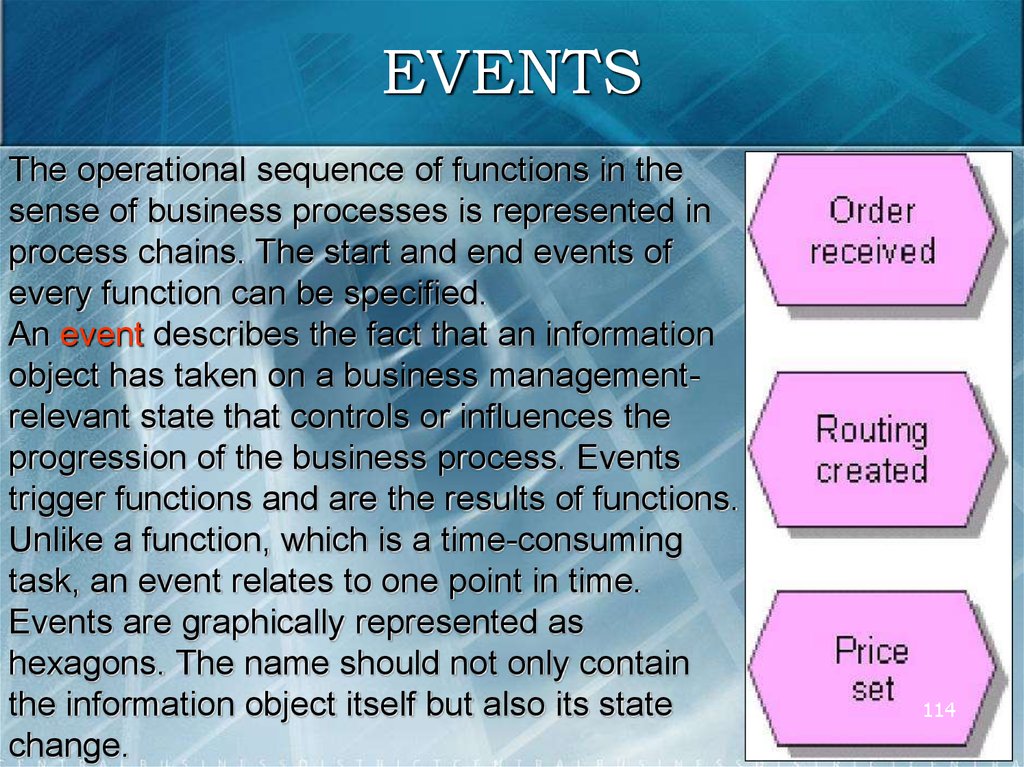
EVENTSThe operational sequence of functions in the
sense of business processes is represented in
process chains. The start and end events of
every function can be specified.
An event describes the fact that an information
object has taken on a business managementrelevant state that controls or influences the
progression of the business process. Events
trigger functions and are the results of functions.
Unlike a function, which is a time-consuming
task, an event relates to one point in time.
Events are graphically represented as
hexagons. The name should not only contain
the information object itself but also its state
change.
114
115.
EVENT-DRIVEN PROCESSCHAIN (EPC)
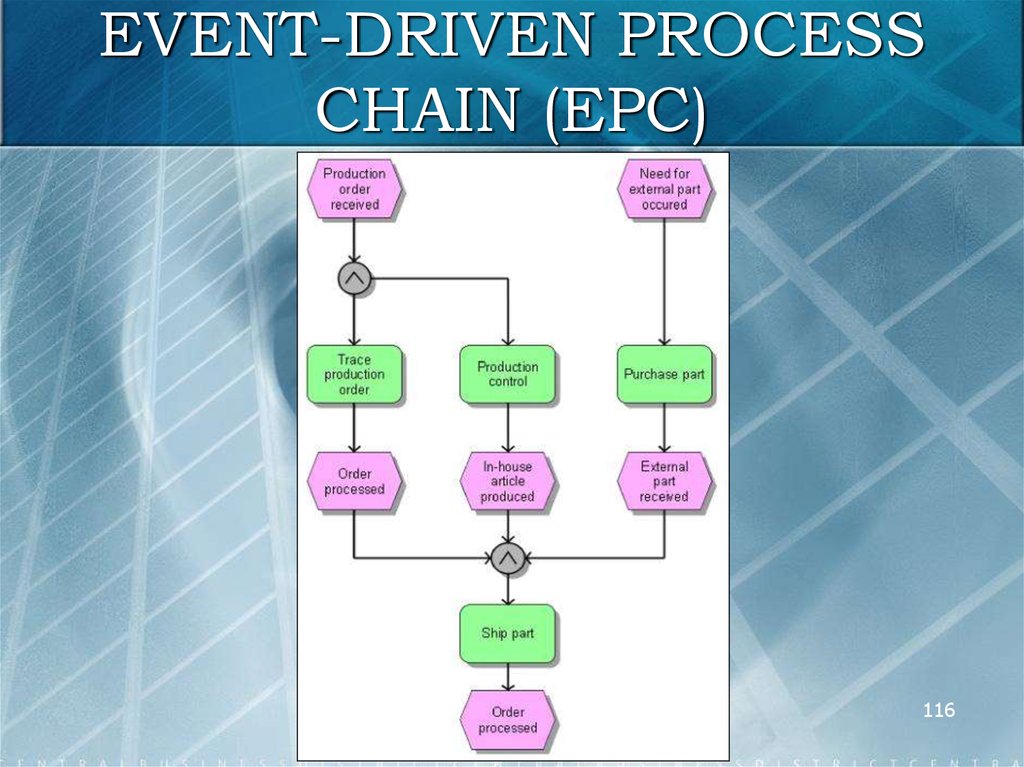
Events trigger functions and are the results of functions. By
arranging events and functions in a sequence, Event-driven
process chains (EPCs) are created.
An event-driven process chain (EPC) shows the chronologicallogical operational sequence of a business process.
Since events determine which state or condition will trigger a
function and which state will define the end of a function, the start
and end nodes of such an EPC are always events. Multiple
functions can originate from one event simultaneously, and a
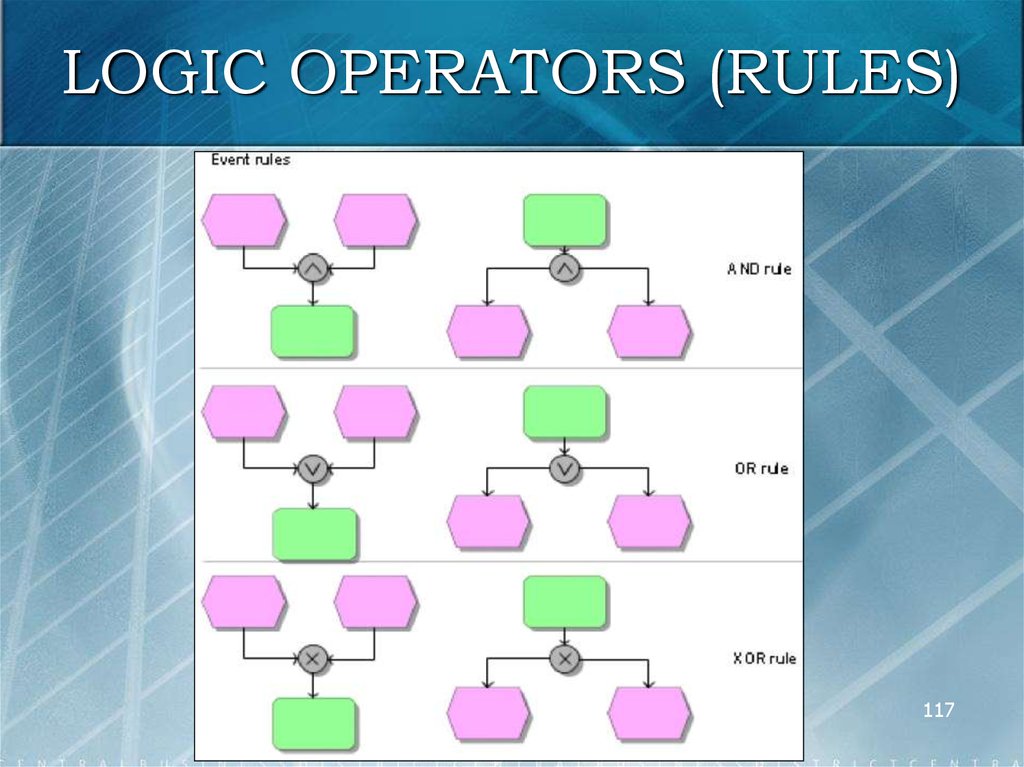
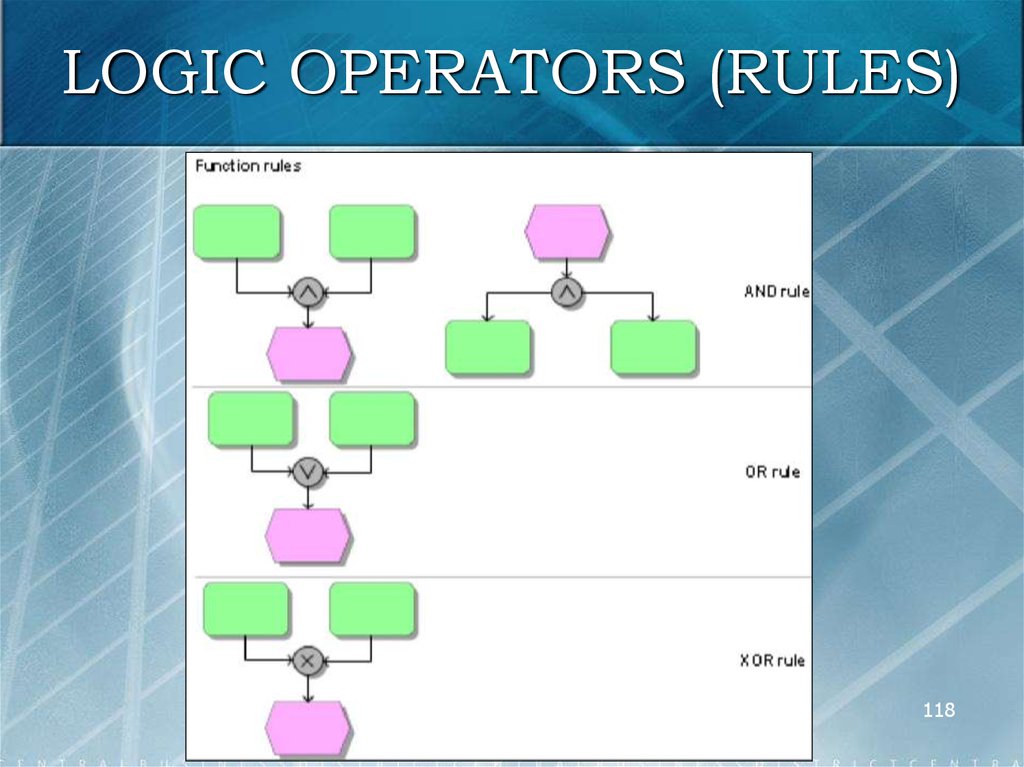
function can have multiple events as its result. A rule that is
represented by a circle is used to illustrate branches and
processing loops in an EPC. However, these connections do not
only serve as graphic operators, but define the logical links
between the objects they connect.
115
116.
EVENT-DRIVEN PROCESSCHAIN (EPC)
116
117.
LOGIC OPERATORS (RULES)117
118.
LOGIC OPERATORS (RULES)118
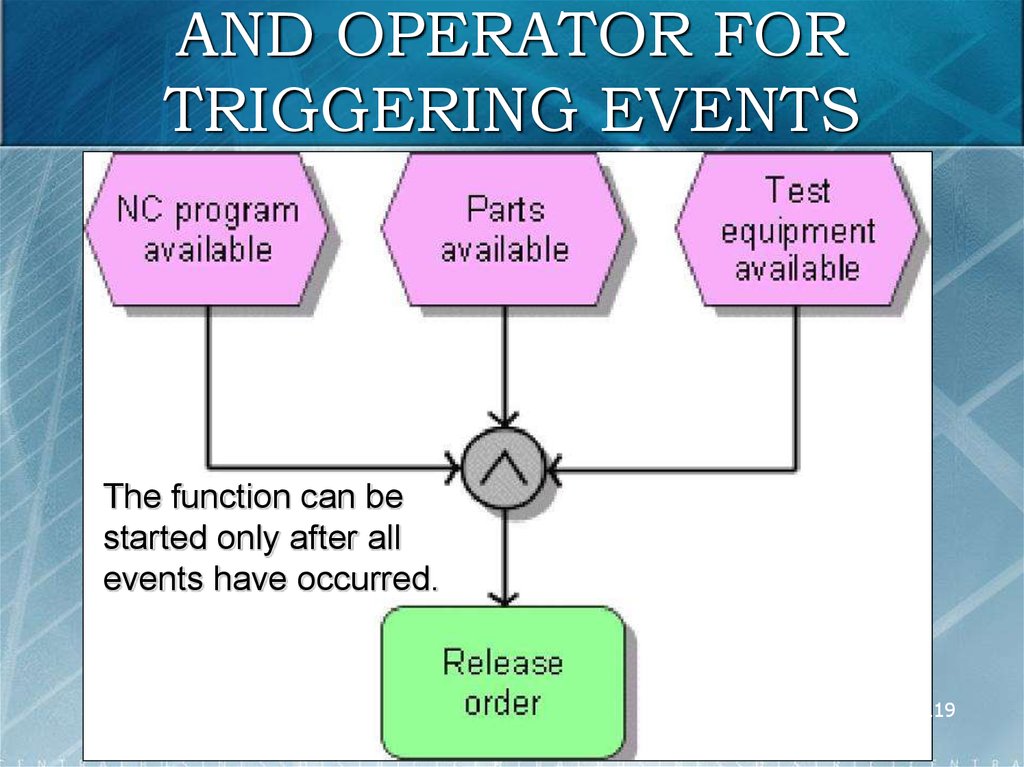
119.
AND OPERATOR FORTRIGGERING EVENTS
The function can be
started only after all
events have occurred.
119
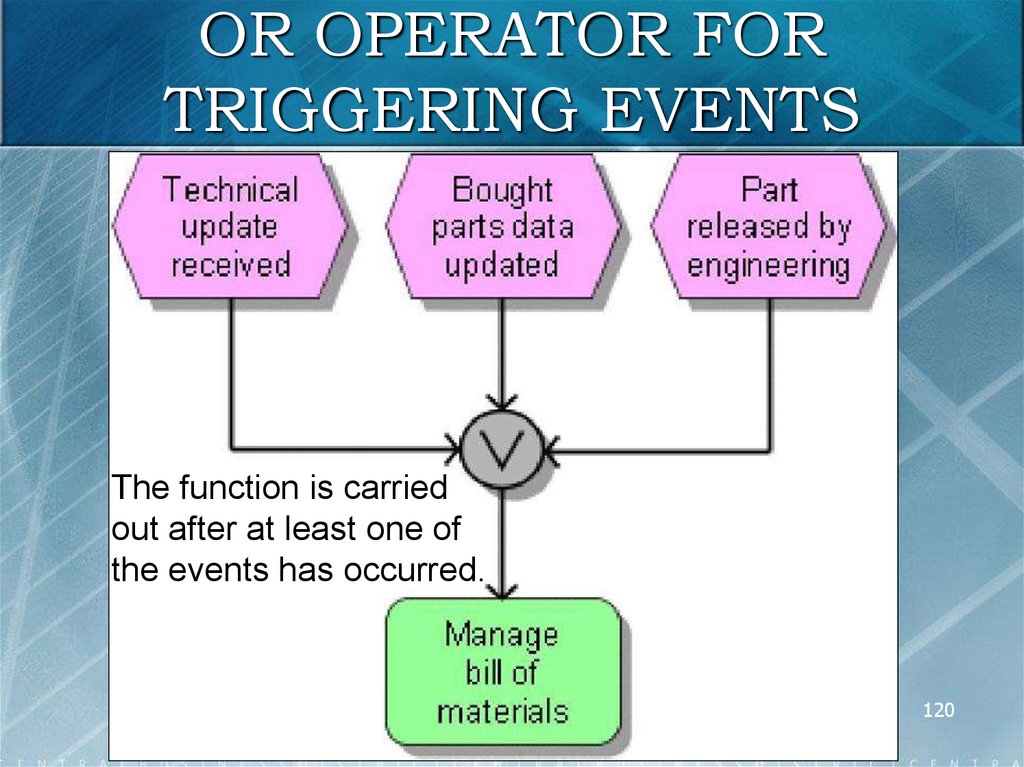
120.
OR OPERATOR FORTRIGGERING EVENTS
The function is carried
out after at least one of
the events has occurred.
120
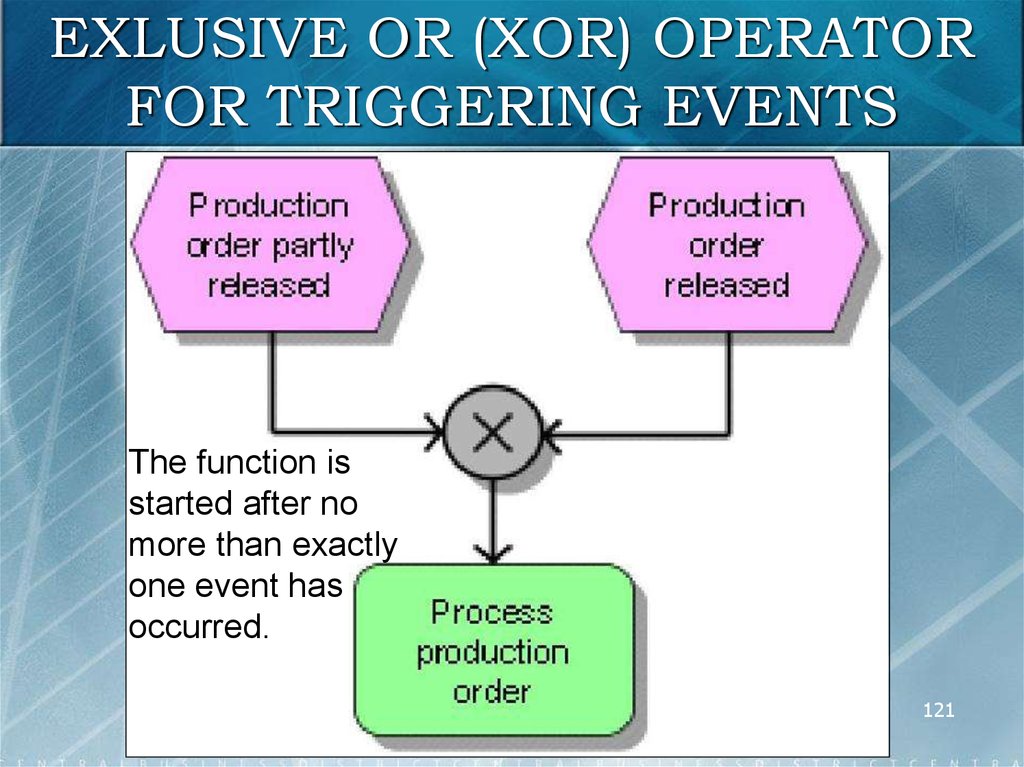
121.
EXLUSIVE OR (XOR) OPERATORFOR TRIGGERING EVENTS
The function is
started after no
more than exactly
one event has
occurred.
121
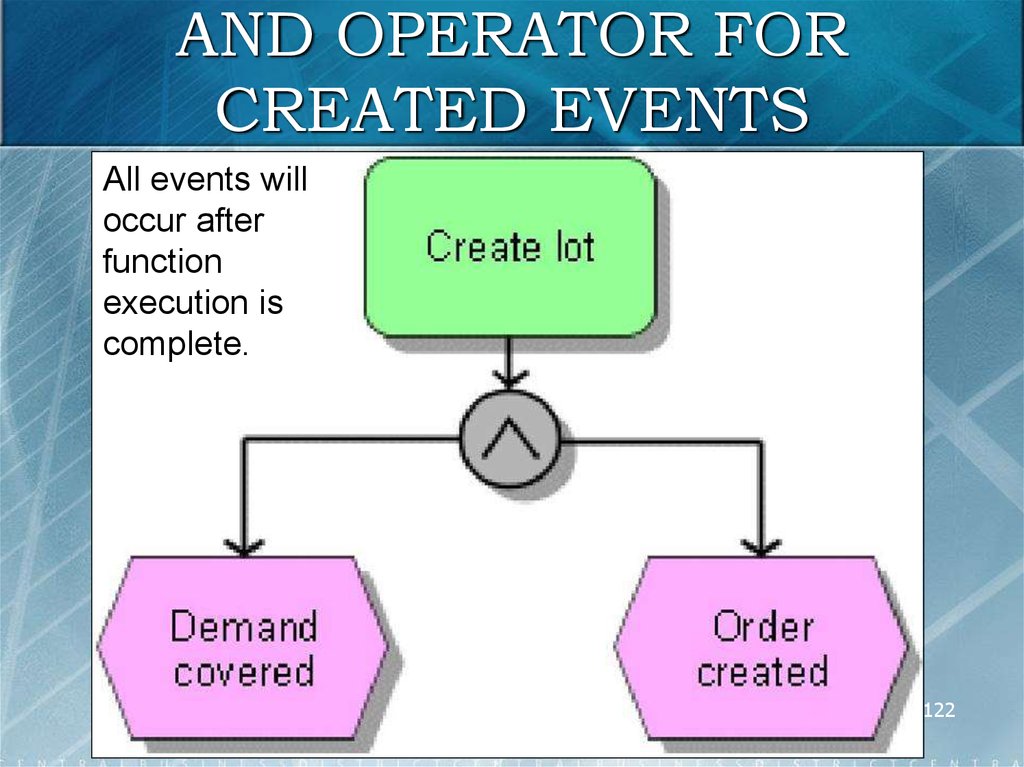
122.
AND OPERATOR FORCREATED EVENTS
All events will
occur after
function
execution is
complete.
122
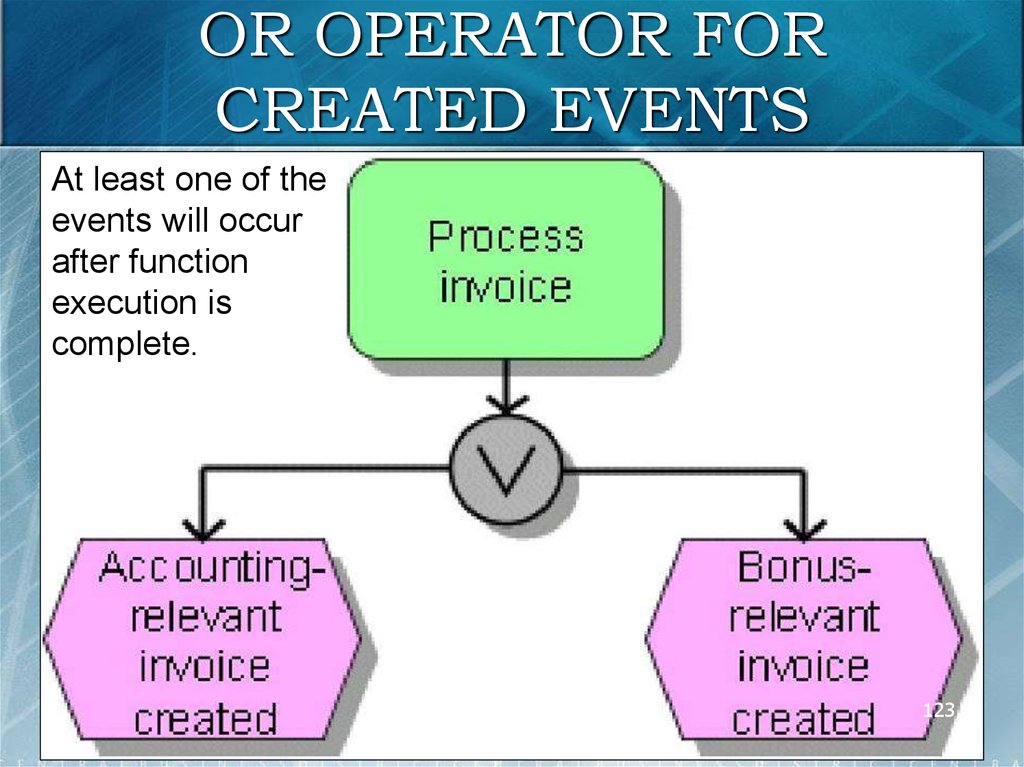
123.
OR OPERATOR FORCREATED EVENTS
At least one of the
events will occur
after function
execution is
complete.
123
124.
EXLUSIVE OR (XOR) OPERATORFOR CREATED EVENTS
No more than one
event will occur after
function execution is
complete.
124
125.
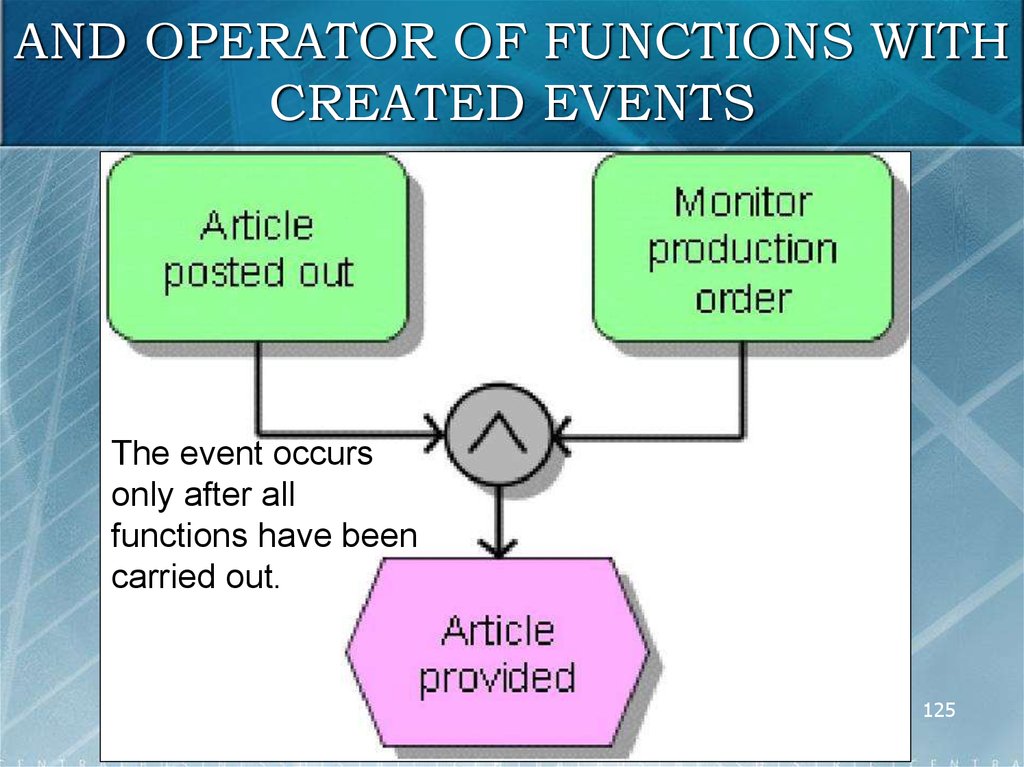
AND OPERATOR OF FUNCTIONS WITHCREATED EVENTS
The event occurs
only after all
functions have been
carried out.
125
126.
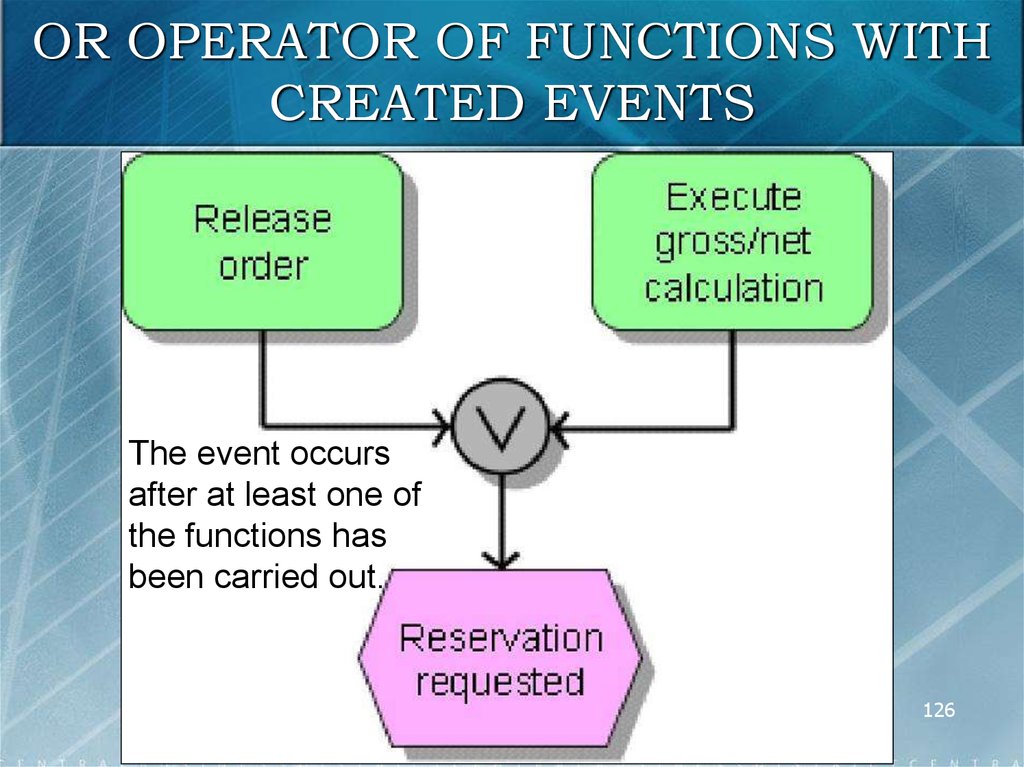
OR OPERATOR OF FUNCTIONS WITHCREATED EVENTS
The event occurs
after at least one of
the functions has
been carried out.
126
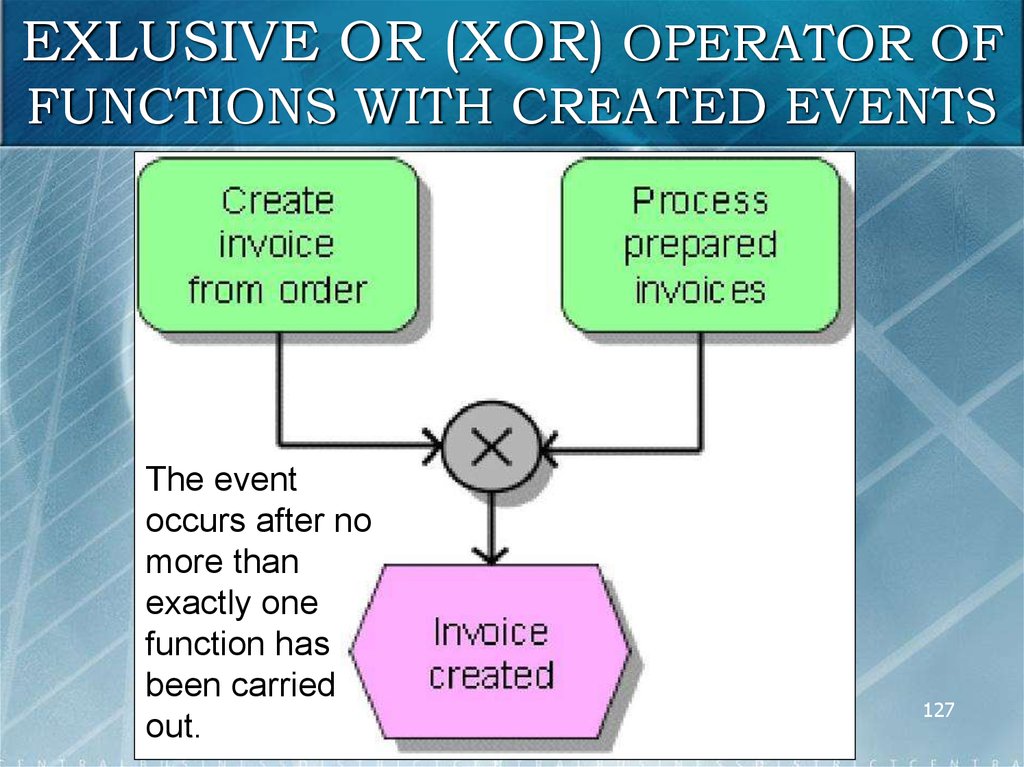
127.
EXLUSIVE OR (XOR) OPERATOR OFFUNCTIONS WITH CREATED EVENTS
The event
occurs after no
more than
exactly one
function has
been carried
out.
127
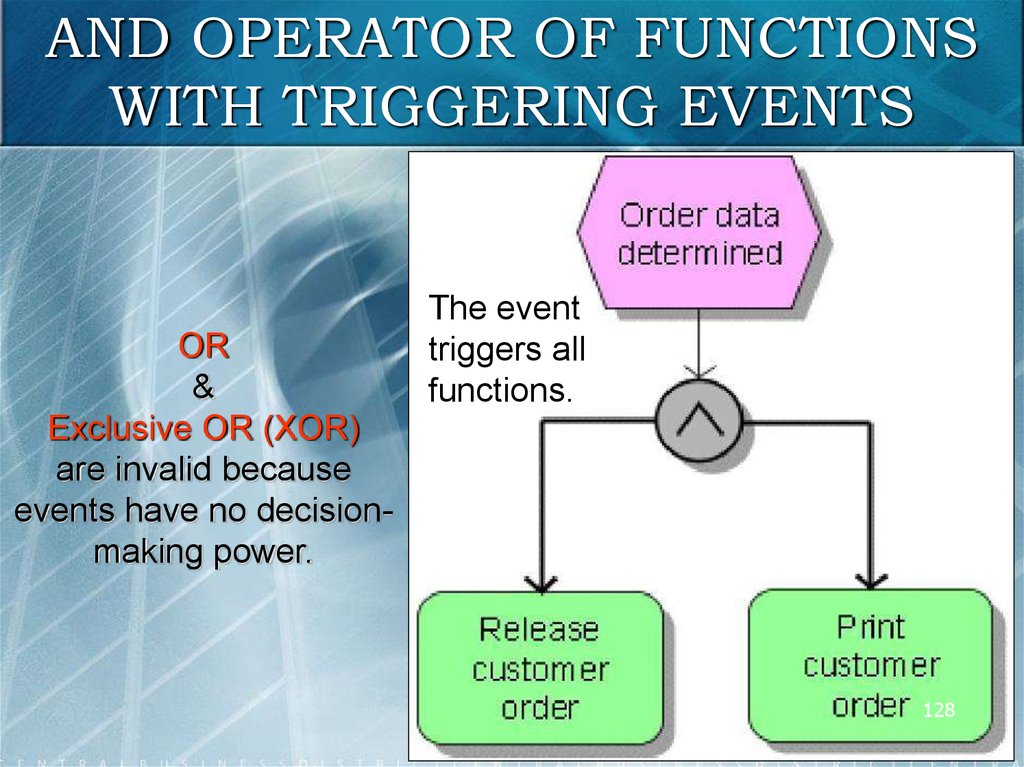
128.
AND OPERATOR OF FUNCTIONSWITH TRIGGERING EVENTS
OR
&
Exclusive OR (XOR)
are invalid because
events have no decisionmaking power.
The event
triggers all
functions.
128
129.
FUNCTION ALLOCATIONDIAGRAM (I/O)
In addition to the event control representation the transformation
of input data into output data and the representation of data flows
between functions also form a link between the data view and the
function view in the ARIS concept. The transformation of input
data into output data can be illustrated in Function allocation
diagrams (I/O) which basically correspond to pure input/output
diagrams used in other methods.
A function allocation diagram (I/O) consists of functions of the
function view and information objects of the data view. The arrows
determine whether an information object is used only as input
data, output data, or as input/output data. More detailed
specifications are possible, indicating, for example, that the
function has created or deleted an information object. Depending
on the degree of detail, information objects can be data clusters,
129
entity or relationship types, or attributes of the data view.
130.
EXAMPLE OF FUNCTIONALLOCATION DIAGRAM (I/O)
130
131.
FUNCTION ALLOCATIONDIAGRAM (I/O)
Besides a function's input/output data, events and all other objects
that can be allocated to the functions in an EPC are available.
Thus, the user is able to restrict the modeling of process chains in
EPC diagrams to events and functions, and to assign each
function a function allocation diagram (I/O) containing all
additional relationships the function has. This allows for much
clearer representations of business processes and also explains
the use of a new name for this model type. The following figure
illustrates an example of this more detailed representation in a
function allocation diagram.
131
132.
DETAILED REPRESENTATION OF THEFUNCTION ALLOCATION DIAGRAM
132
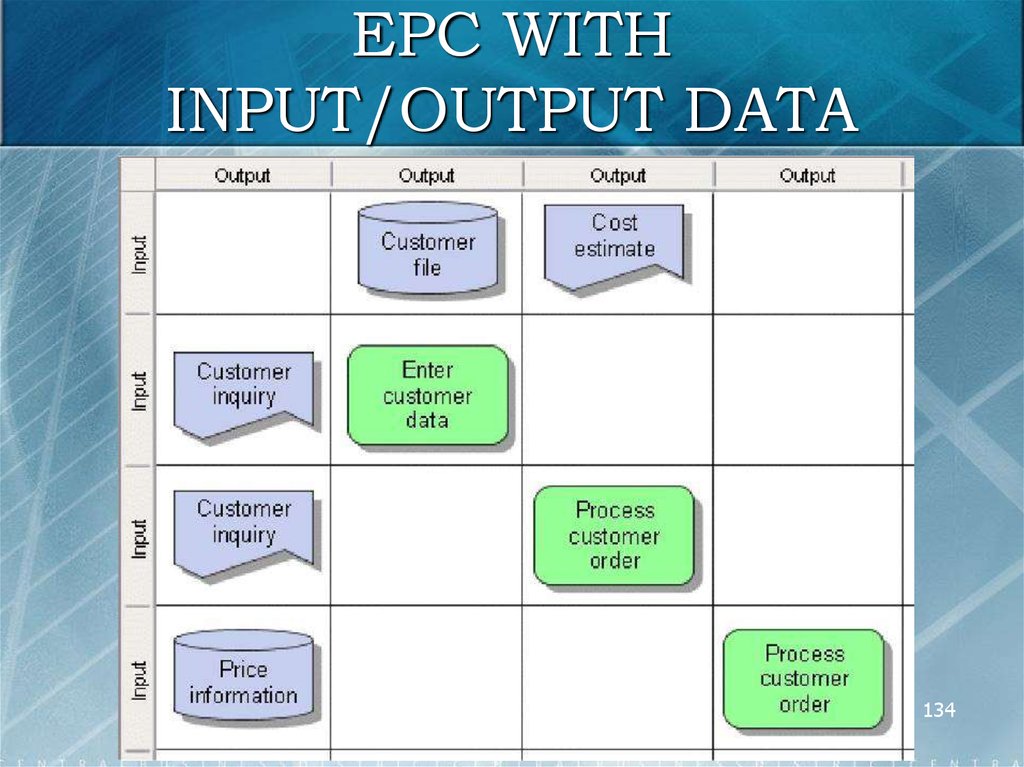
133.
EPC WITHINPUT/OUTPUT DATA
Besides this method of representing data transformation in the
form of function allocation diagrams (I/O), it is also possible to
include this information in an EPC. The following figure illustrates
an example. In this case, the links between functions and
information objects play the same role as in function allocation
diagrams (I/O). However, including them in a process chain
having numerous branches may result in a very complex
representation.
133
134.
EPC WITHINPUT/OUTPUT DATA
134
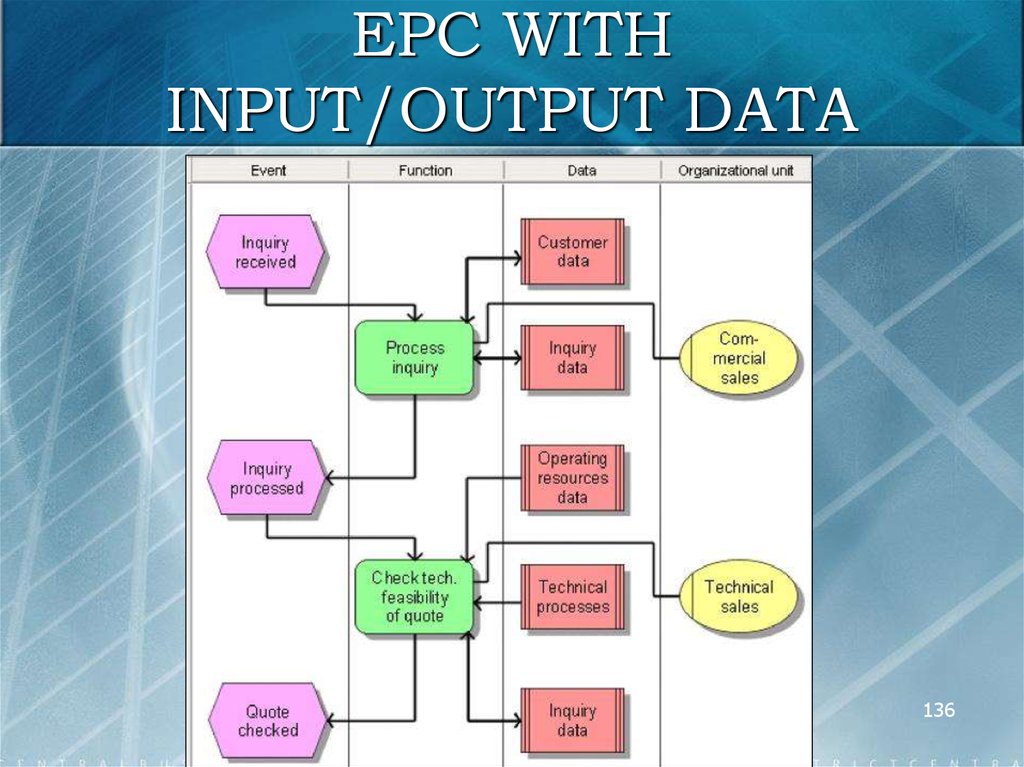
135.
EPC WITHINPUT/OUTPUT DATA
In the PCD (process chain diagram), objects have to be arranged
according to the column description. The EPC representation
permits free object arrangement. However, adding input/output
data may result in complex and thus confusing models.
135
136.
EPC WITHINPUT/OUTPUT DATA
136
137.
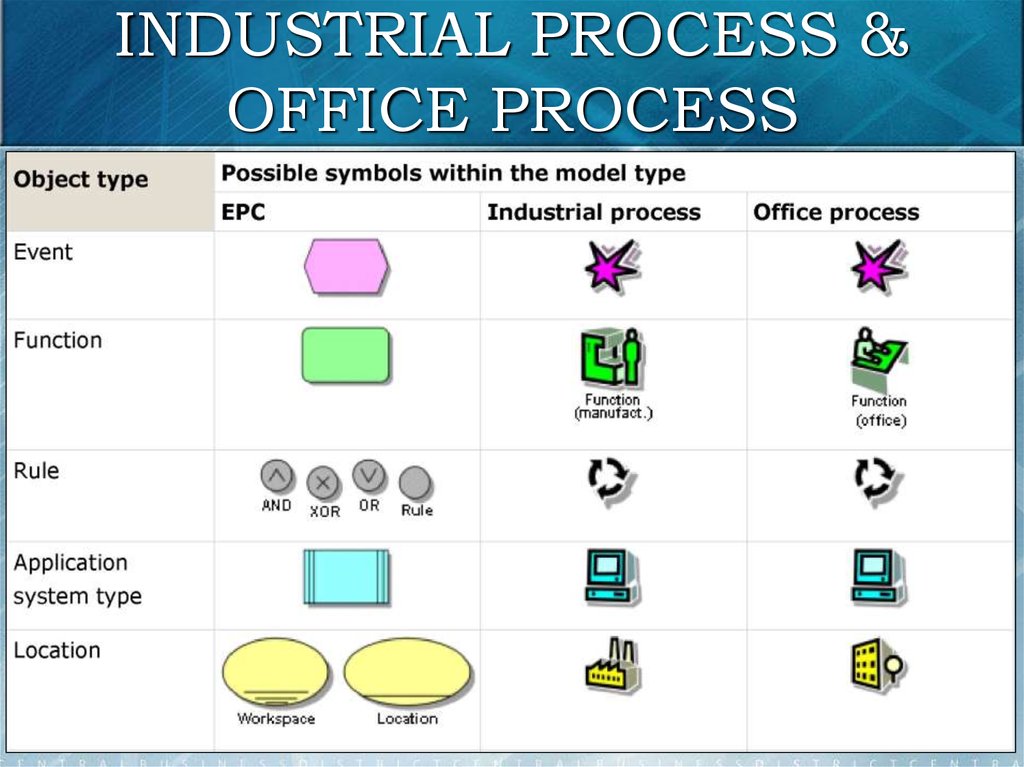
INDUSTRIAL PROCESS &OFFICE PROCESS
The Industrial process and Office process model types essentially
represent the same facts as the EPC model type, with the
difference that they provide only a limited selection of objects and
the symbols are represented in graphical form.
This kind of graphical representation has the advantage that
employees in the operating departments can understand the
models without training and are able to adjust and develop them
themselves. For instance, it is easy for every user to see that a
symbol showing three persons represents a group, whereas this is
not as obvious in the abstract EPC symbolism (oval with double
frame). Therefore, the goal of these two model types is to
establish process modeling, process optimization, and process
utilization in the operating departments.
137
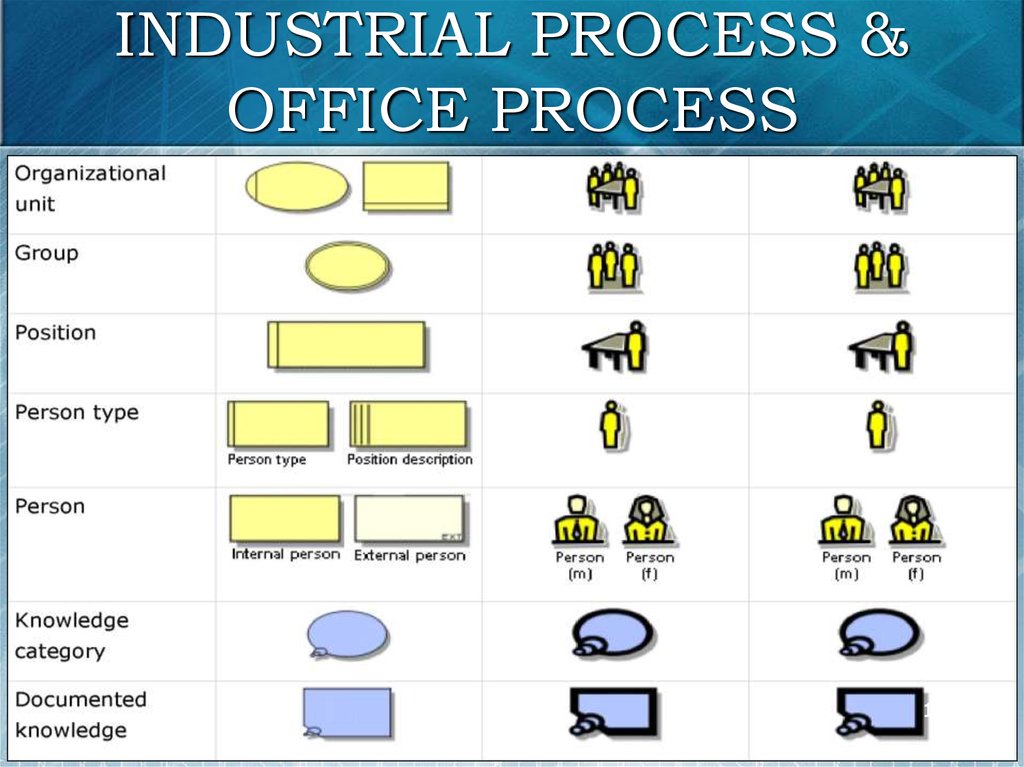
138.
INDUSTRIAL PROCESS &OFFICE PROCESS
To maximize the identification with symbols, two process types
(model types) are provided:
the “Industrial process” illustrates production processes
(which create material goods/products)
the “Office process” illustrates office processes
(which create intangible goods/services).
138
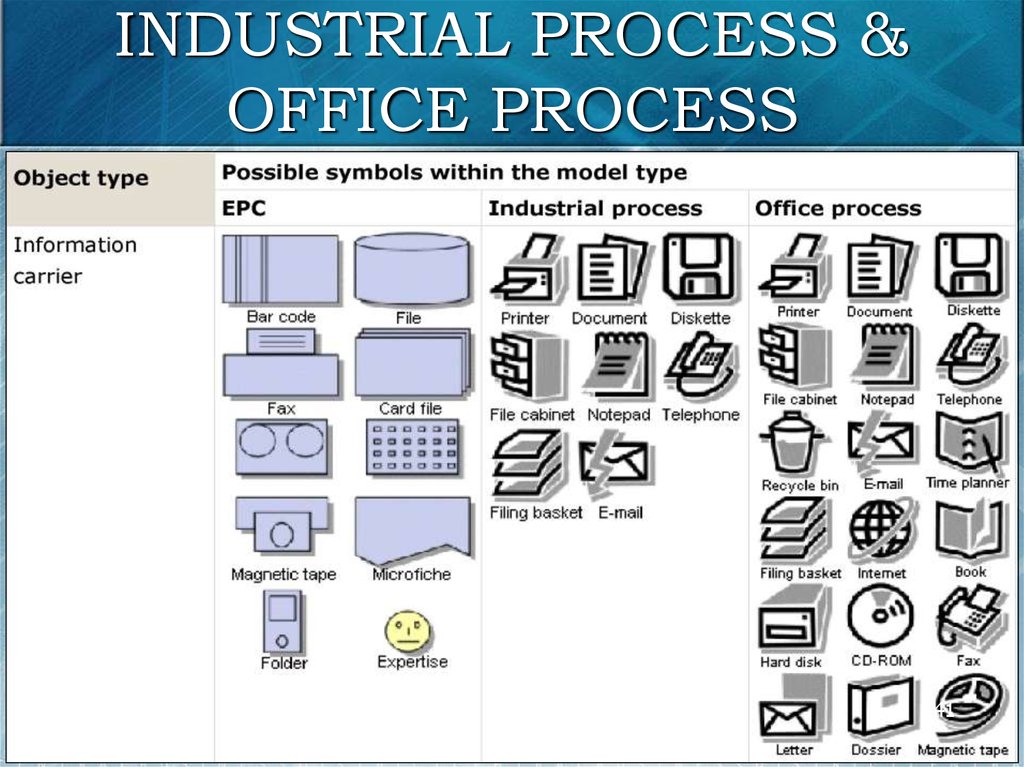
139.
INDUSTRIAL PROCESS &OFFICE PROCESS
139
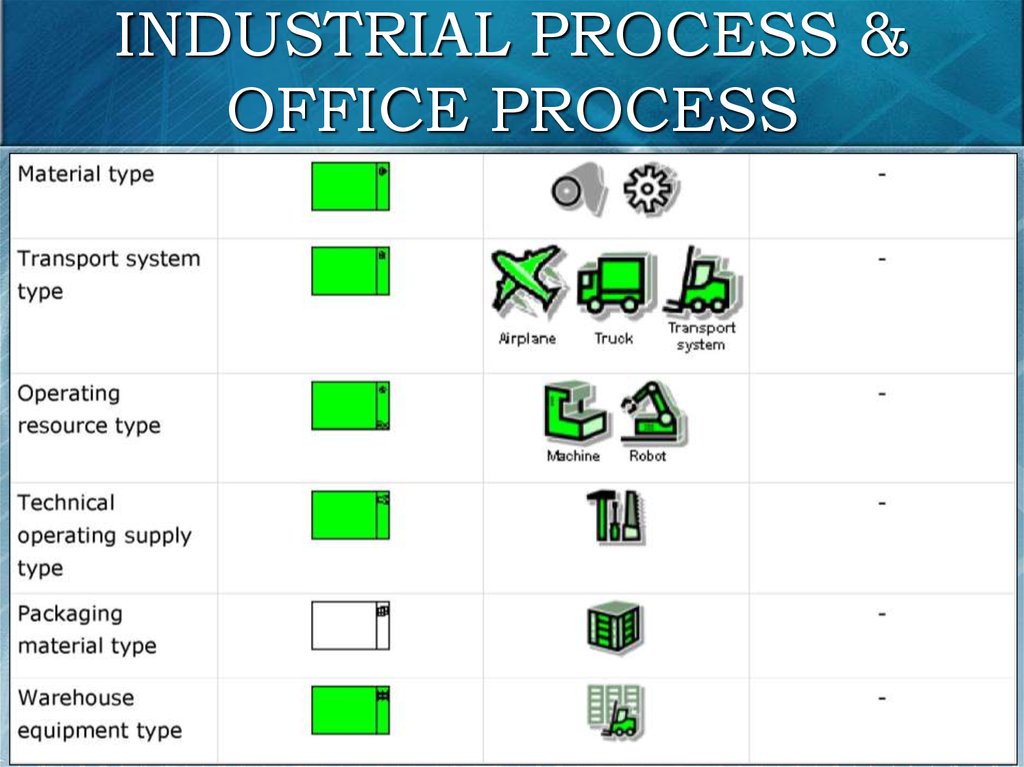
140.
INDUSTRIAL PROCESS &OFFICE PROCESS
140
141.
INDUSTRIAL PROCESS &OFFICE PROCESS
141
142.
INDUSTRIAL PROCESS &OFFICE PROCESS
142
143.
EXAMPLES OF EPC, INDUSTRIALPROCESS & OFFICE PROCESS
143