Похожие презентации:
The Space Environment
1. The Space Environment
Samara UniversityMay 23-24, 2018
Dr. Jordi L. Gutiérrez
Department of Physics
Universitat Politècnica de Catalunya
2. Effects of the Space Environment
There are several phenomena that have a significantimpact on Space Systems Architecture
• Microgravity
• Van Allen belts
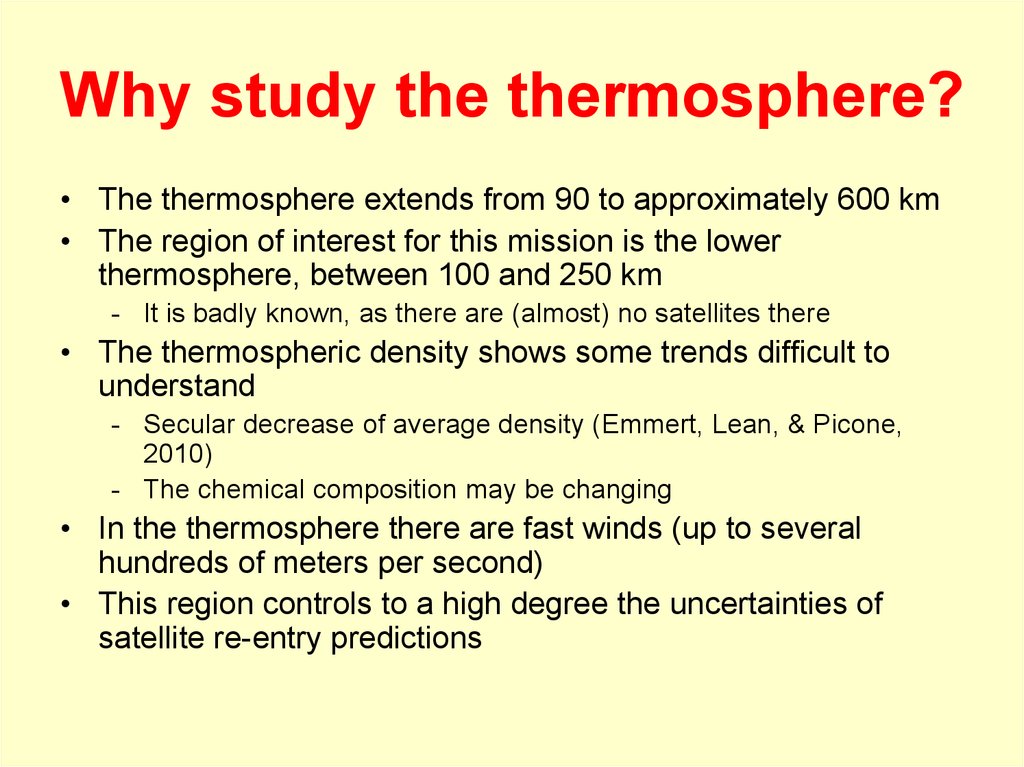
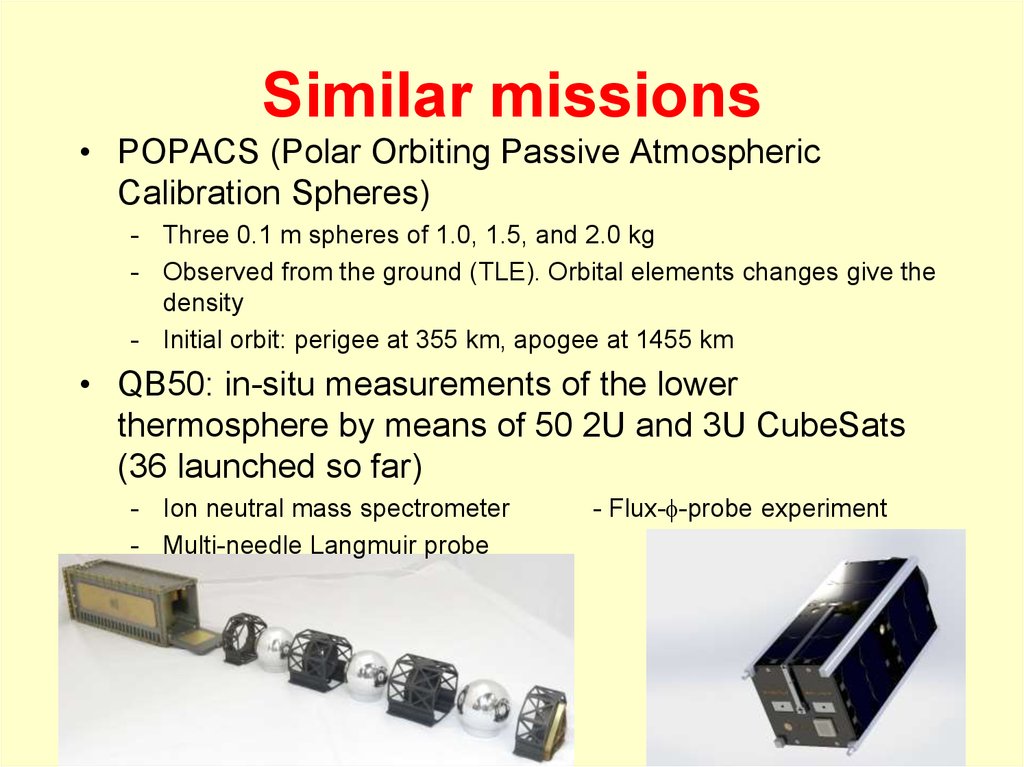
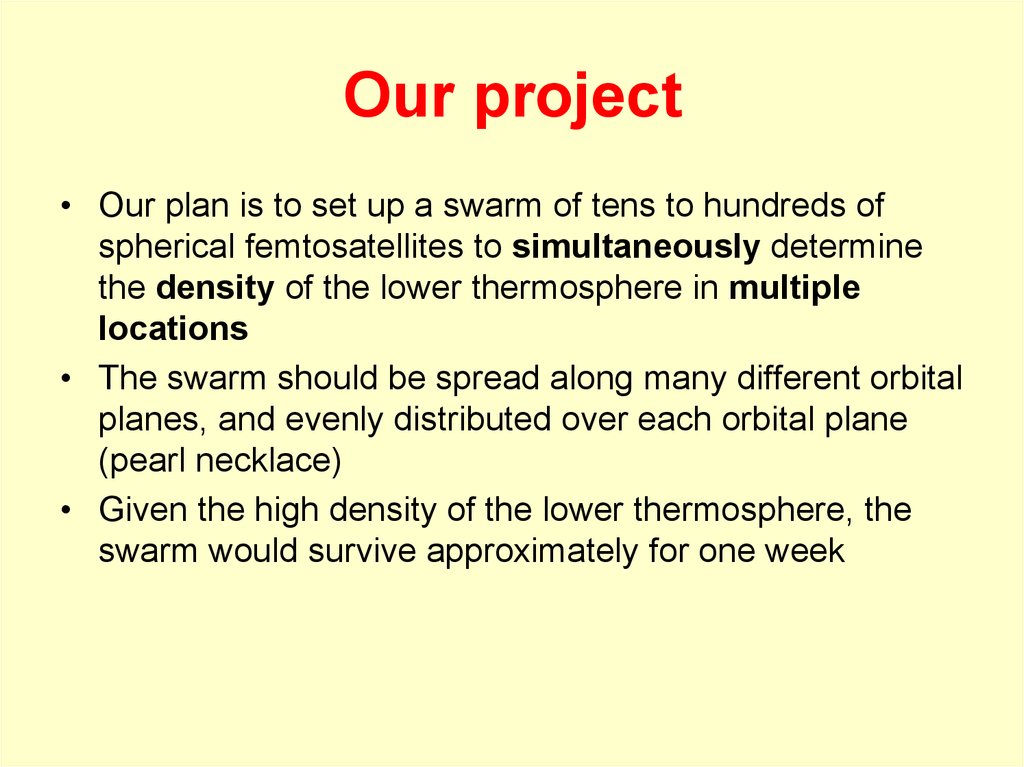
• High altitude atmosphere
• High vacuum
• Solar radiation (thermal control subsystem)
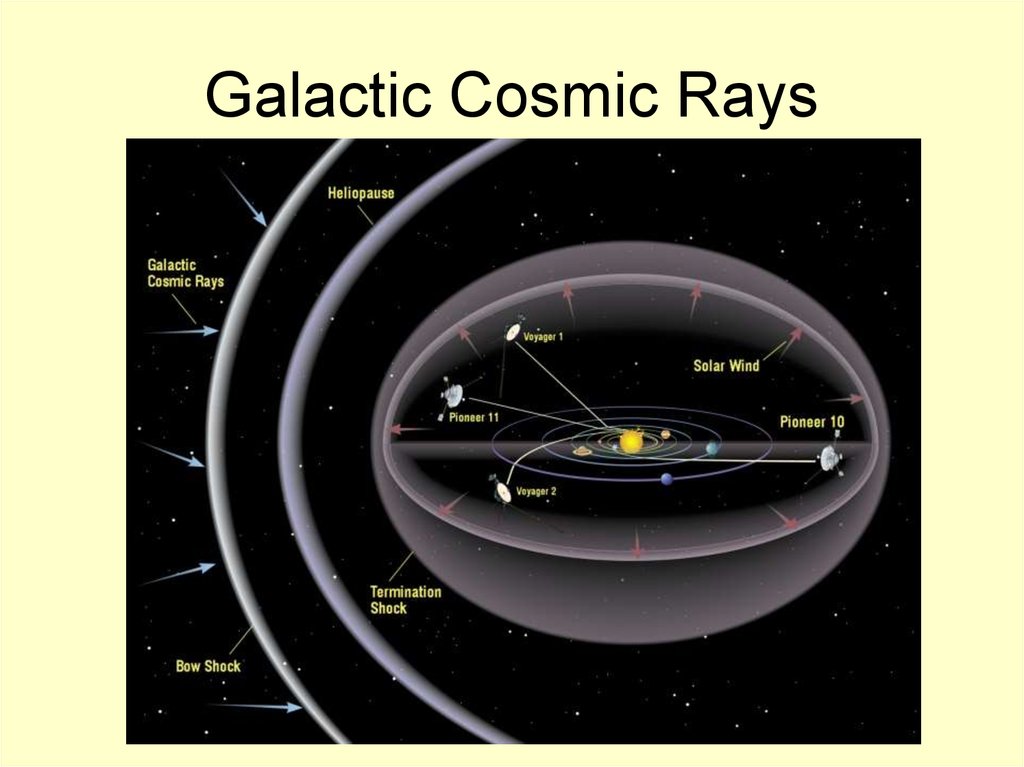
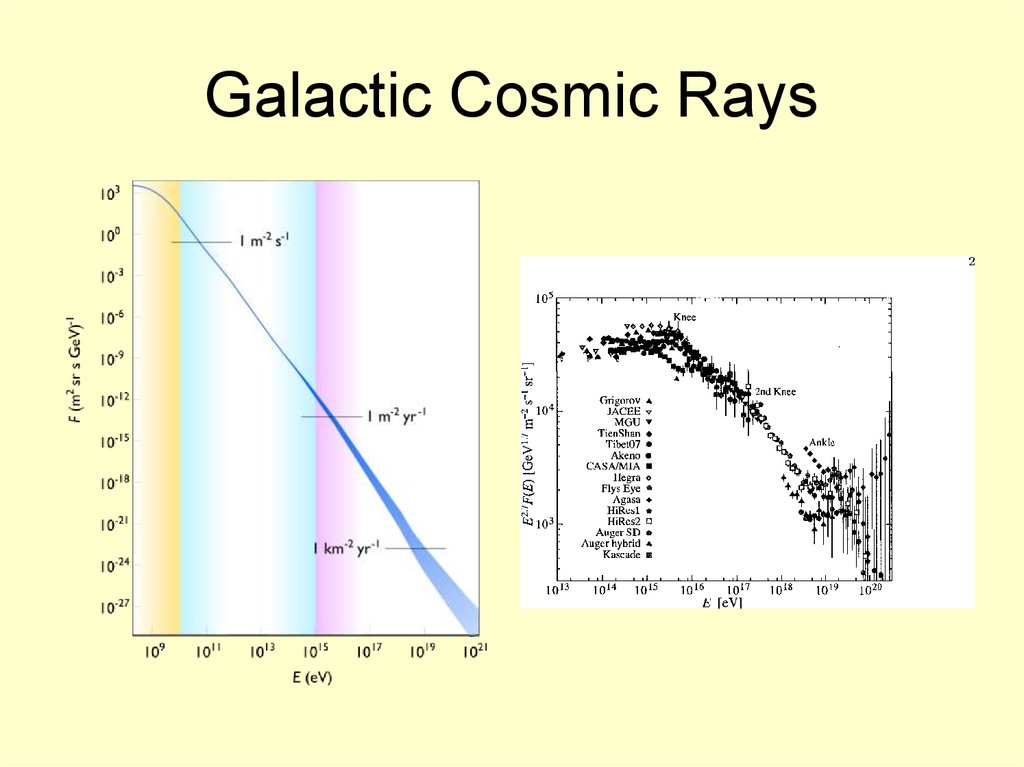
• Ionizing radiation
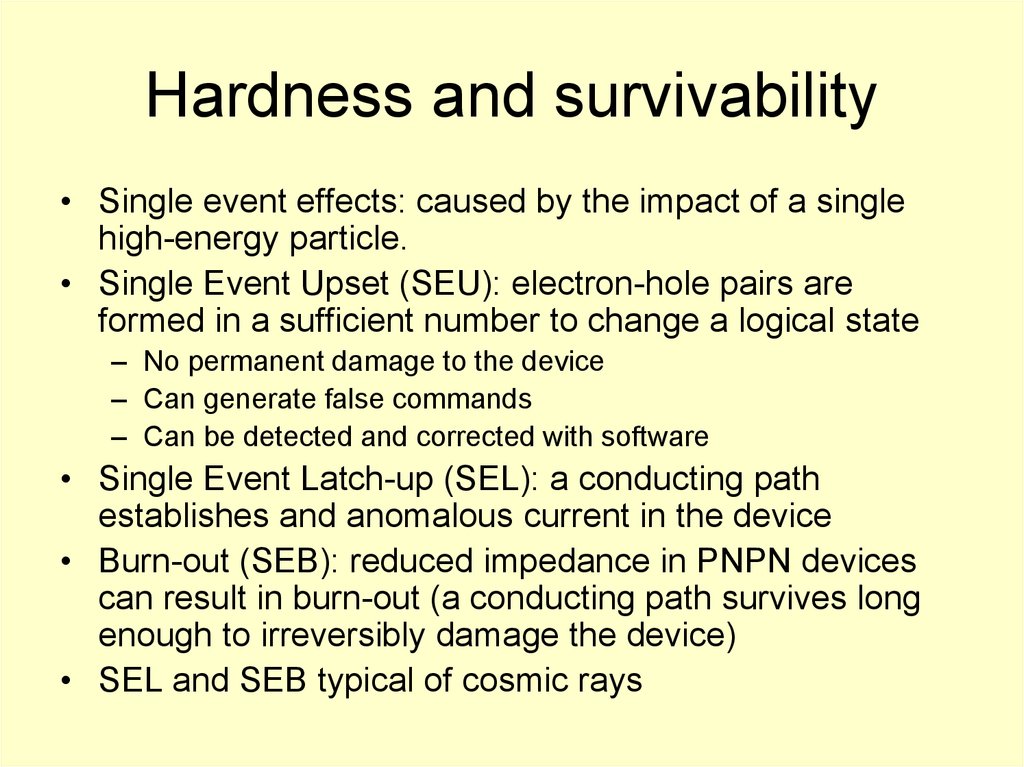
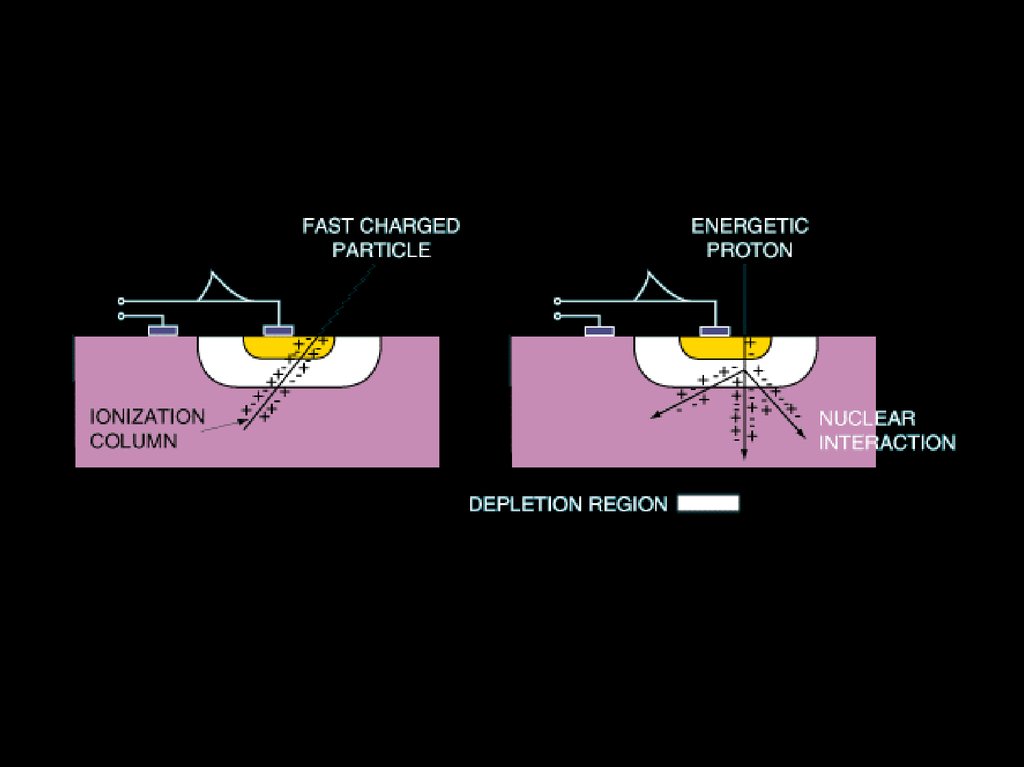
A single energetic particle can produce a single event
phenomenon that seriously affects electronics
3.
4. The gravitational field
• Obviously, all satellites in orbit around the Earth (or anyother object) are experiencing an intense gravitational
field
• The reason for them being n microgravity conditions is
that they are in free-fall (equivalence principle), as was
noted by Newton
5.
6. Simulating microgravity
• Then, it is possible to simulate microgravity by letting fallan object (better in a reduced density atmosphere):
– Drop towers
– Parabolic flights
– Small rockets
• This is always an approximation, and the duration of
these tests is rather limited (from seconds to minutes)
7.
8.
Interior of the Bremen testtower
9.
10.
11.
ESA’s REXUS rocket12.
13. Gravitational field
14.
15.
16.
Other celestial bodies have, obviously, different gravitational fields17. The magnetosphere and radiation belts
• The Earth is surrounded by radiation belts of energeticparticles trapped inside the magnetosphere
–
–
–
–
The magnetic field of the Earth is roughly a magnetic dipole
Magnetic L shells defined by R L cos2l
Inner belt populated by high energy protons and electrons
Outer belts populated only by high energy electrons
• The origin of these energetic particles is the Sun
• Its particle density and spectrum are highly dependent
on the Solar Cycle
• Also contributions by cosmic rays (rarer, but with very
hard energetic spectrum)
18.
19.
20. IGRF12
21.
22.
23.
24.
25.
26.
27.
28.
Geometry and physical explanation oftrapped radiation belts
29.
30.
31. Models for radiation belts
• Proton models:– Solar minimum: AP8MIN
– Solar Maximum: AP8MAX
• Electron models
– Solar minimum: AE8MIN
– Solar maximum: AE8MAX
http://nssdcftp.gsfc.nasa.gov/models/radiation_belt/radbelt/
http://www.spenvis.oma.be (requires free registration)
32. The third van Allen belt
• Recently, the van Allen probes have discovered a third(transient) van Allen belt
33.
34.
35. The South Atlantic Anomaly
• The South Atlantic Anomaly is due to a lack ofhomogeneity in the proton belt
– The magnetic field of the Earth is off-center (by about 500 km)
– The magnetic axis is tilted 11 deg with respect to the rotation
axis of the Earth
36. Radiation Effects
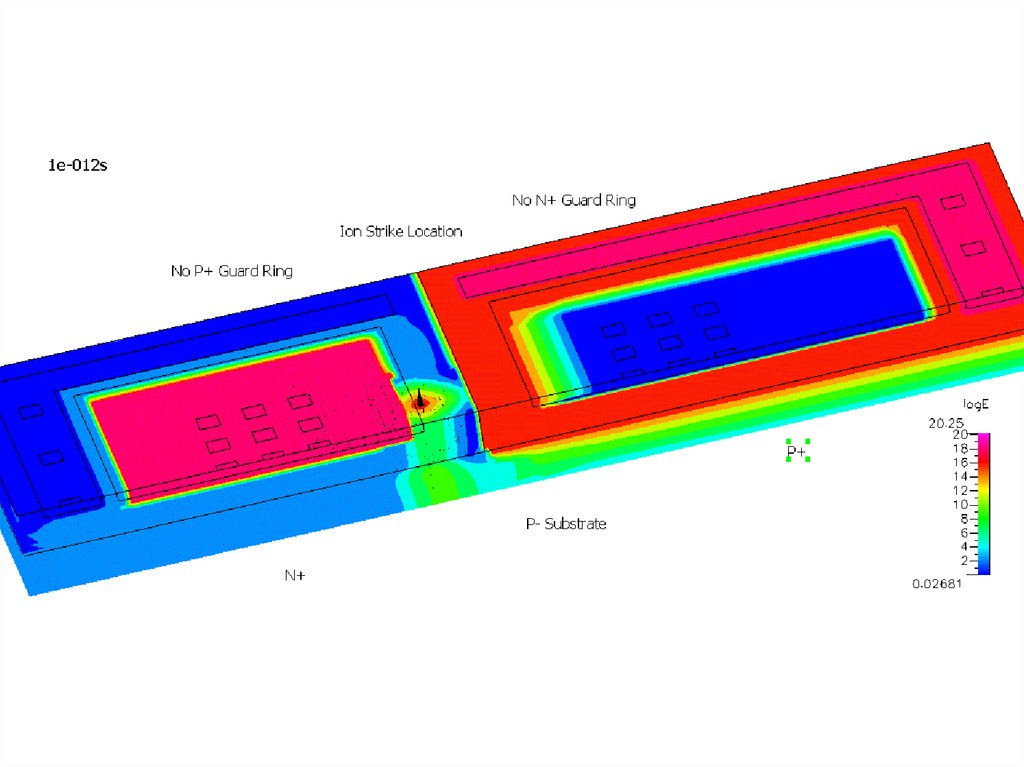
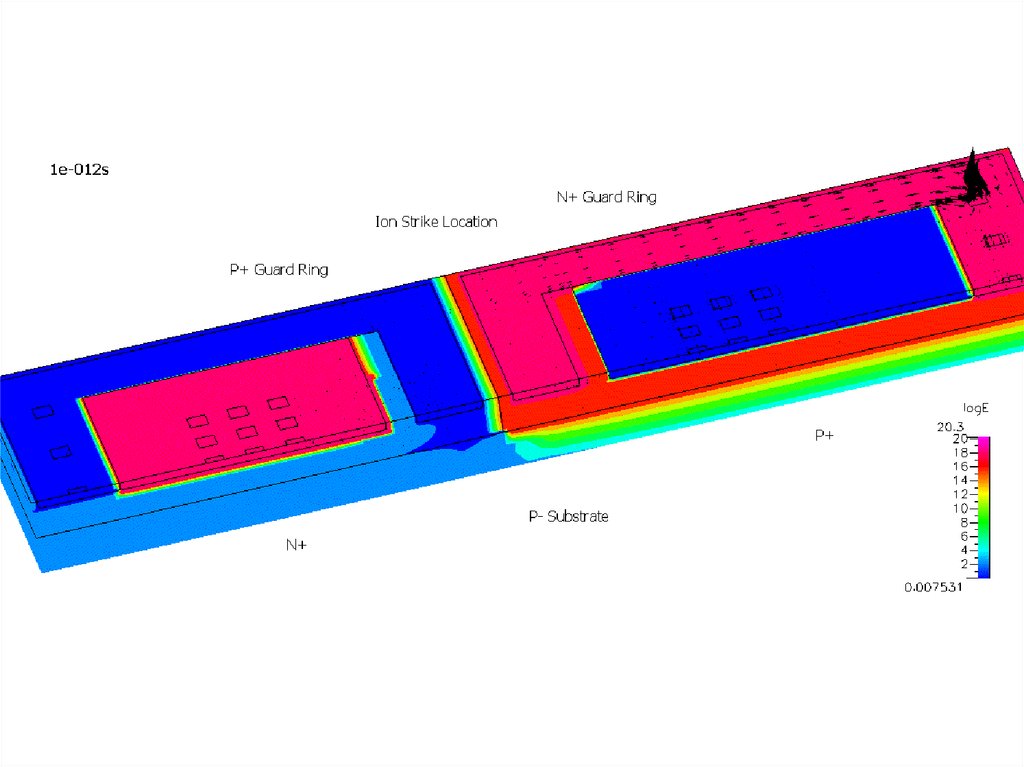
• There are several kinds of SEEs– Single event upsets (SEU): a change of a bit (or more) in a
memory or register produced by the action of an impacting ion.
They do not harm the device, but degrade its operation
– Single event latchup (SEL): a PNPN device becomes shorted
until it is power-cycled. The part may fail if the anomalous
current is going on for a sufficiently long time
– Single event transient (SET): the charge produced in an
ionization event is collected and travels along the circuit
– Single event burnout (SEB): the ionization and anomalous
currents are intense enough to cause a permanent damage
37.
Images of theSouth Atlantic
Anomaly
38. The effects of SAA
• The South Atlantic Anomaly is due to a lack ofhomogeneity in the proton belt
– The magnetic field of the Earth is off-center
– The magnetic axis is tilted with respect to the rotation axis of the
Earth
• The SAA is specially relevant for satellites in low orbit
with inclination between 35º and 60º
• No way to avoid the SAA
• Increased number of p have important effect of radiation
doses
39.
40. The Solar Cycle
• The Sun experiences substantial changes in its activitywith a period of 11.2 years:
– Increased number of sunspots
– Increased number of energetic particle ejection
– Increase in the mean energy of particles
• The activity is measured through the radiation intensity
measured at a wavelength of 10.7 cm
41.
42.
43.
Variation of the F10.7 index throughout the last 60 years44.
The structure of theF10.7 peaks is highly
variable and difficult
to predict
45.
46.
47. The Upper Atmosphere
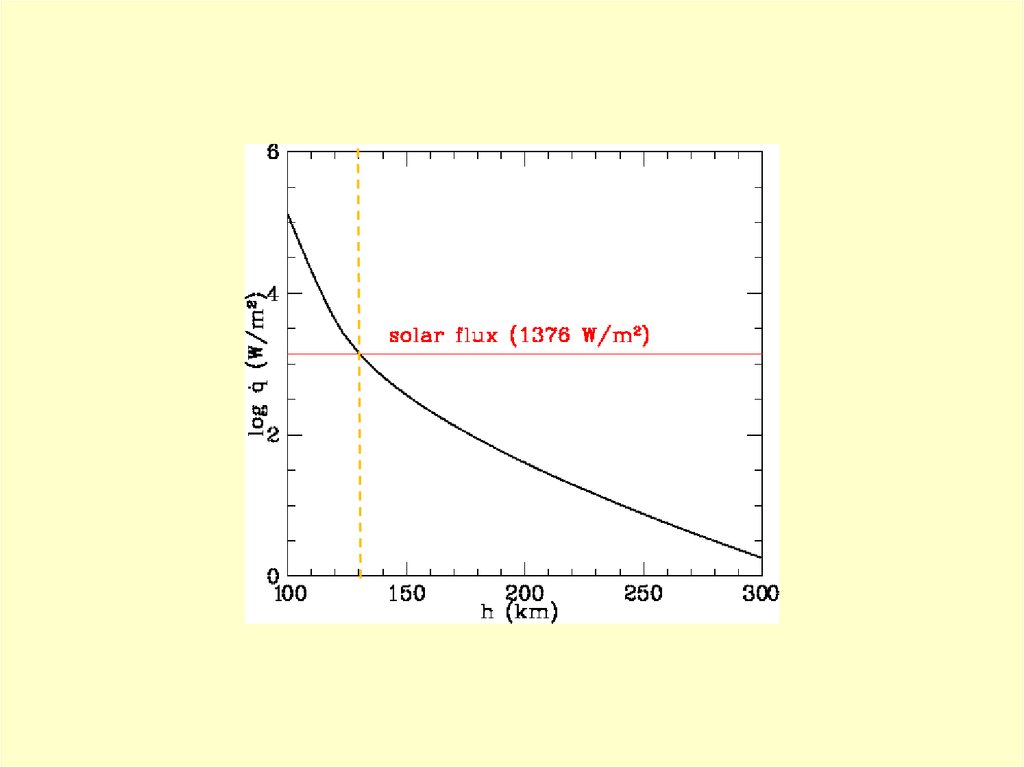
• The atmosphere has no clear limits in height (butlegally ends at 100 km above Earth’s surface)
• Chemical species varies with height and solar
activity
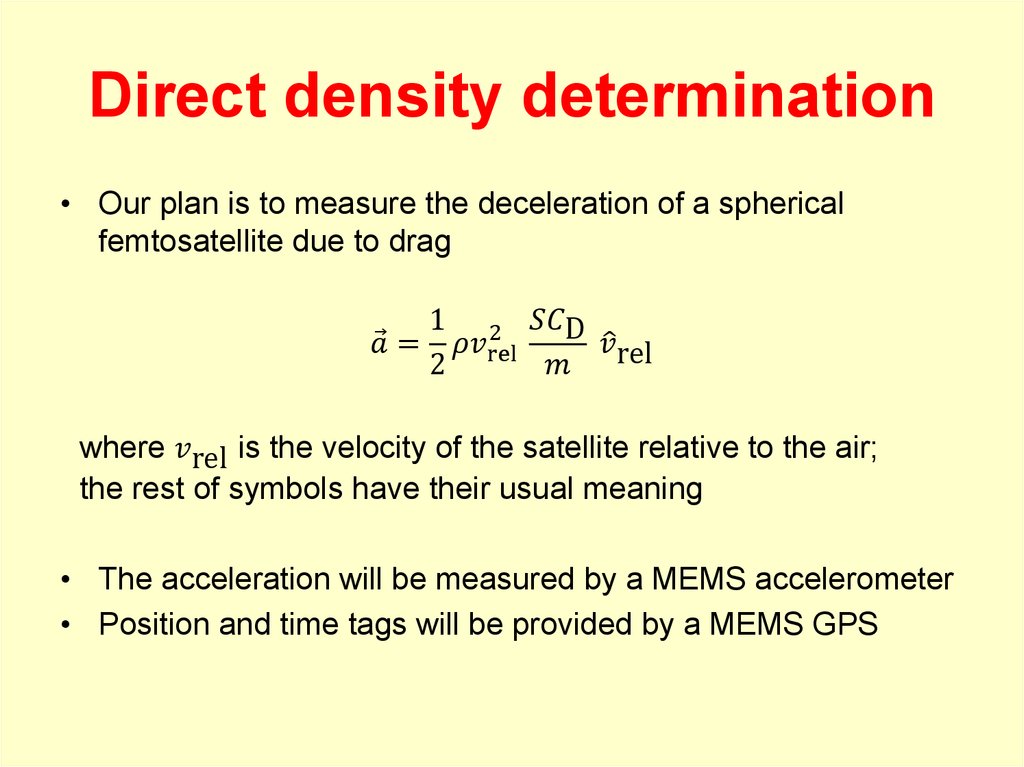
• Satellites decay by atmospheric drag if initial orbit is
less than 1000 km at perigee
CD A 2
a 0.5
v
m
• One of the most popular models is MSISE90
48. The Upper Atmosphere
• For most satellites CD 1.90 – 2.60• The presence of solar panels induce a lateral drag
due to the thermal movement of the atmospheric
constituents
Vorb
49. Maxwell-Boltzmann Distribution
50. Maxwell-Boltzmann Distribution
• Then, the probable, mean, and rms velocities are2






 Астрономия
 Английский язык


