Похожие презентации:
Culture and business
1.
Lecture 1Culture and Business
2. Background
GlobalizationOrganization
Culture
3.
The economic interconnections among countries increaseddramatically with the advance of free trade areas in the
1990s.
The number of multinational corporations rose from 7 000
till 65 000 since 1990.
People come across with specific problems
4. Globalization
First of all whether we like it or not, globalization ishere…to stay.
Many employees and managers deal with people from
other cultures on a constant basis
4
5. International business
Successful international corporations are those that recognizethe diversity of the world marketplace, and are able to cope
with the uncertainties of doing business in continually
changing market environments.
Implementing strategies across world markets requires in-
depth understandings of national cultures and international
trends.
International business managers must know not only what is
going on but why. They must be able to interpret international
events and assess their significance in wider national, regional,
or worldwide contexts.
6. Globalization
We do not understand people from other cultures asreadily and intuitively as people from our own culture =>
Cross-cultural psychology of organizational behavior
helps organization members to gain better
understanding of other cultures, of their culture and of
the consequences of people from different cultures
working together
6
7. Organizational Behavior
Organizational Behavior (OB) is "the study of humanbehavior in organizational settings, the interface between
human behavior and the organization, and the
organization itself." [1] OB can be divided into three levels:
the study of (a) individuals in organizations (micro-level),
(b) work groups (meso-level), and (c) how organizations
behave (macro-level) [2]
1. Moorhead, G., & Griffin, R. W. (1995). Organizational behavior: Managing
people and organizations (5th edition). Boston. Houghton Mifflin.
2. Wagner, J. A., & Hollenbeck, J. R. (2010). Organizational behavior: Securing
competitive advantage. New York: Routledge
8. Subject
The field of cross-cultural psychology of organizationalbehavior (CCPOB) research includes international and
intercultural comparative research about aspects of
management and intercultural research into multinational
organizations.
9.
CCPOB is a fairly new field that is based on theories andresearch from:
Cross-cultural management
Cross Cultural Psychology
Social Psychology
Human Resources
Anthropology
9
10. Goals
Cross-cultural psychology of organizational behaviorseeks:
to understand how national cultures affect management
practices;
to identify the similarities and differences across
cultures in various management practices and
organizational contexts;
to increase effectiveness in global management.
10
11.
The central focus of this discipline concerns culture,so we begin by reviewing some key issues faced by
researchers into CCPOB.
12. D. Matsumoto:
«In my view, culture is the product of the interactionbetween universal biological needs and functions,
universal social problems created to address those
needs, and the contexts in which people live. Culture is
created as people adapt to their environments in order
to survive, and it results from the process of
individuals’ attempts to adapt to their contexts in
addressing the universal social problems and
biological needs».
13. D. Matsumoto:
«I define culture as a shared system of sociallytransmitted behavior that describes, defines, and
guides people’s ways of life, communicated from one
generation to the next generation».
14.
Culture is always evolving and changing“It is not the strongest who
survive, or the fastest.
It is the ones who can change the
quickest.”
- Charles Darwin
15.
Surface CulturePersonal Space
Holidays
Religion
Gender Roles
Formality
Language
Dress
Art & Music
Food
Gestures
Time
Values
Relationships
Communication & Learning Styles
Methods of Decision Making
Attitudes
Work Ethic
Negotiating Styles
Deep Culture
16. Hofstede:
Culture:It is the collective programming of the mind which
distinguishes the members of one group or category of
people from another.
17. The ‘onion diagram’: Manifestations of culture at different levels of depth
18. Cultural differences manifest themselves in several ways - symbols, heroes, rituals, and values.
Cultural differences manifest themselves in several ways symbols, heroes, rituals, and values.Symbols are words, gestures, pictures or objects that carry a
particular meaning which is only recognized by those who share
the culture.
The words in a language or jargon belong to this category, as do
dress, hairstyles, flags. New symbols are easily developed and old
ones disappear.
19. The ‘onion diagram’: Manifestations of culture at different levels of depth
20. Cultural differences manifest themselves in several ways - symbols, heroes, rituals, and values.
Cultural differences manifest themselves in several ways symbols, heroes, rituals, and values.Heroes are persons, alive or dead, real or imaginary, who possess
characteristics which are highly prized in a culture, and who thus
serve as models for behavior.
who is heroes in your culture?
21. The ‘onion diagram’: Manifestations of culture at different levels of depth
22. Cultural differences manifest themselves in several ways - symbols, heroes, rituals, and values.
Cultural differences manifest themselves in several ways symbols, heroes, rituals, and values.Rituals are collective activities, technically superfluous in reaching
desired ends, but which, within a culture, are considered as socially
essential: they are therefore carried out for their own sake. Ways of
greeting and paying respect to others, social and religious
ceremonies are examples (weddings, funerals, initiation to the
church).
Symbols, heroes, rituals can be subsumed under the term
practices.
23. The ‘onion diagram’: Manifestations of culture at different levels of depth
24.
The core of culture is formed by values.Values are broad tendencies to prefer certain states of
affairs over others.
25. Why are basic values important?
motivate choice of behavior--what we dojustify past behavior--why we do it
standards to evaluate people & events--
who and what we like, underlie our
attitudes
direct attention and perception--what we
notice
can serve as social indicators—reflect
fundamental societal change
26.
Values are feelings with an arrow to it: they have a plus and aminus side.
evil vs. good
ugly vs. beautiful
unnatural vs. natural
abnormal vs. normal
paradoxical vs. logical
irrational vs. rational
27. Hofstede
- survey data about the values of people in over 50 countriesaround the world. These people worked in the local branches
of one large multinational corporation – IBM.
28. Hofstede
A statistical analysis of the answers on questions about thevalues of similar IBM employees in different countries
revealed common problems, but with solutions differing
from country to country, in the following areas:
1. Social inequality, including the relationship with authority;
2. The relationship between the individual and the group;
3. Concepts of masculinity and femininity: the social
implications of having been born as a boy or a girl;
4. Ways of dealing with uncertainty, relating to the control of
aggression and the expression of emotions.
29.
The four basic problem areas represent dimensions of cultures. A dimensionis an aspect of a culture that can be measured relative to other cultures.
The basic problem areas correspond to dimensions which Hofstede named as:
power distance (from small to large ),
collectivism versus individualism,
femininity versus masculinity, and
uncertainty avoidance (from weak to strong).
More recently, a fifth dimension of differences among national cultures was
identified, opposing a long-term orientation in life to a short-term
orientation or Confucian dynamism
30. Dimensions of national cultures
1. Power distance (PDI) This dimension deals with the fact thatall individuals in societies are not equal – it expresses the
attitude of the culture towards these inequalities amongst us.
Power distance is defined as the extent to which the less powerful
members of institutions and organizations within a country
expect and accept that power is distributed unequally.
31. Key differences in the relationship among people in organisations placed in small and large power distance societies
Small power distanceLarge power distance
Inequalities among people should be
minimized
Inequalities among people are both
expected and desired
Decentralization is popular
Centralization is popular
Narrow salary range between top and
bottom of organization
Wide salary range between top and
bottom of organization
Subordinates expect to be consulted
Subordinates expect to be told what to
do
The ideal boss is a resourceful democrat
The ideal boss is a benevolent autocrat or
good father
Privileges and status symbols are frowned
upon
Privileges and status symbols for managers
are both expected and popular
Native management theories focus on role
of employees
Native management theories focus on role
of managers
Countries?
Countries?
32. Dimensions of national cultures
2. Individualism / Collectivism (IDV): The fundamental issueaddressed by this dimension is the degree of
interdependence a society maintains among its
members. It has to do with whether people´s self-image is
defined in terms of “I” or “We”.
In Individualist societies people are supposed to look after
themselves and their direct family only. In Collectivist societies
people belong to ‘ingroups’ that take care of them in exchange
for loyalty.
33. Key differences in the relationship among people in organisations placed in collectivist and individualist societies.
CollectivistIndividualist
Identity is based in the social network Identity is based in the individual
to which one belongs
Collective interests prevail over
individual interests
Individual interests prevail over
collective interests
Relationship employer-employee is Relationship employer-employee is a
perceived in moral terms, like a family contract supposed to be based on
link
mutual advantage
Relationship prevails over task
Task prevails over relationship
Countries?
Countries?
34. Dimensions of national cultures
3. Masculinity / Femininity (MAS):A high score (masculine) on this dimension indicates that the
society will be driven by competition, achievement and success,
with success being defined by the winner / best in field – a value
system that starts in school and continues throughout
organisational behaviour.
A low score (feminine) on the dimension means that the
dominant values in society are caring for others and quality
of life. A feminine society is one where quality of life is the sign of
success and standing out from the crowd is not admirable. The
fundamental issue here is what motivates people, wanting
to be the best (masculine) or liking what you do (feminine).
35. Dimensions of national cultures
Masculinity belongs to societies in which social gender roles areclearly distinct: men are supposed to be assertive, tough, and
focused on material success whereas women are supposed to be
more modest, tender, and concerned with the quality of life.
Femininity belongs to societies in which social gender roles overlap
i.e., both men and women are supposed to be modest, tender, and
concerned with the quality of life.
36. Key differences in the relationship among people in organisations placed in feminine and masculine societies.
FeminineMasculine
People and warm relationships are
important
Money and things are important
Everybody is supposed to be modest
Men are supposed to be assertive,
ambitious, and tough
Work in order to live
Live in order to work
Managers use intuition and strive for
consensus
Managers expected to be decisive and
assertive
Resolution of conflicts by compromise Resolution of conflicts by fighting
and negotiation
them out
Countries?
Countries?
37. Dimensions of national cultures
4. Uncertainty avoidance (UAI). The dimension UncertaintyAvoidance has to do with the way that a society deals with the
fact that the future can never be known: should we try to
control the future or just let it happen?
This ambiguity brings with it anxiety and different cultures
have learnt to deal with this anxiety in different ways. The
extent to which the members of a culture feel threatened
by ambiguous or unknown situations and have created
beliefs and institutions that try to avoid these is reflected
in the UAI score.
38. Dimensions of national cultures
Uncertainty avoidance can be defined as the extent to which themembers of a culture feel threatened by uncertain or unknown
situations and try to avoid such situations. This feeling is, among
other things, expressed through nervous stress and in a need for
predictability: a need for written and unwritten rules.
39. Key differences in the relationship among people in organisations placed in weak and strong uncertainty avoidance societies
Weak uncertainty avoidanceStrong uncertainty avoidance
Uncertainty is a normal feature of life The uncertainty inherent in life is felt
and each day is accepted as it comes
as a continuous threat which must be
fought
Aggression and emotions should not
be shown
Aggression and emotions may be
shown
What is different, is curious
What is different, is dangerous
Tolerance of deviant and innovative
ideas and behavior
Suppression of deviant ideas and
behavior; resistance to innovation
Countries?
Countries?
40. RUSSIA AND CHINA CULTURES IN THE HOFSTEDE’S “WORLD OF CULTURES”
Source: http://geert-hofstede.com/russia.html41. CHINA AND USA CULTURES IN THE HOFSTEDE’S “WORLD OF CULTURES”
Source: http://geert-hofstede.com/russia.html42.
43.
http://geert-hofstede.com44. Basic Values
Beliefs about the importance ofabstract goals as guiding principles
in life
45.
Dependability46. Attitudes and Values
(Values-Attitudes-Behviour)47. Some Correlates of Value Priorities
choose to study econ., businessPO/AC vs BE
adopting technological
ST/SD vs SE/TR/CO
innovations
authoritarianism & nationalism PO/SE/CO vs SD/UN
egalitarian gender atts
SD/UN vs CO/TR
SD
UN
ST
BE
HE
TR
CO
AC
PO
SE
48.
49.
The higher the Self-Direction (Action) value, the morepositive is the attitude toward starting a new business.
The higher the Self-Direction (Action) value, the
higher the perceived behavioural control.
The higher the Security (Personal) value, the more
negative is the attitude toward starting a new business.
50.
51. 89 Nations in the WVS 1980-2015
World Values SurveyIn WVS
In WVS(89)
Not
(99)
52. The WVS has over the years demonstrated that people’s beliefs play a key role in economic development.
The WVS has over the years demonstrated that people’sbeliefs play a key role in economic development.
53.
Analysis of WVS data made by political scientists RonaldInglehart and Christian Welzel asserts that there are two
major dimensions of cross cultural variation in the world:
Traditional values versus Secular-rational values and
Survival values versus Self-expression values.
The global cultural map (below) shows how scores of
societies are located on these two dimensions. Moving
upward on this map reflects the shift from Traditional
values to Secular-rational and moving rightward reflects
the shift from Survival values to Self–expression values.
54.
Inglehart: Traditional values versus Secular-rationalvalues
Traditional values emphasize the importance of religion,
parent-child ties, deference to authority and traditional
family values. People who embrace these values also reject
divorce, abortion, euthanasia and suicide. These societies
have high levels of national pride and a nationalistic
outlook.
Secular-rational values have the opposite preferences to the
traditional values. These societies place less emphasis on
religion, traditional family values and authority. Divorce,
abortion, euthanasia and suicide are seen as relatively
acceptable. (Suicide is not necessarily more common.)
55.
Inglehart: Survival values versus Self-expression valuesSurvival values place emphasis on economic and physical
security. It is linked with a relatively ethnocentric outlook
and low levels of trust and tolerance.
Self-expression values give high priority to environmental
protection, growing tolerance of foreigners, gender
equality, and rising demands for participation in decisionmaking in economic and political life.
56. Comparing cultures (Ronald F. Inglehart)
57. Table 3. Correlations of Inglehart’s cultural measurements with the objective indices of development and subjective indicators
of well-being58.
59.
So,1) values are related to the economy
2) values create social environment for business
60. A cross-cultural research on social axioms: Implications for socio-economic behavior
61. Social axioms
Generalized beliefs about people, social groups,social institutions, the physical environment, or
the spiritual world as well as about categories of
events and phenomena in the social world
These generalized beliefs are encoded in the
form of an assertion about the relationship
between two entities or concepts.
(Leung and Bond, 2009)
62. social axioms and values
A typical axiom has the structure "A is related to B“Competition leads to progress
Health leads to success in work
Powerful people tend to exploit others.
Hard working people will achieve more in the end.
Values
Competition (good – bad)
health (important – unimportant)
Axioms reflect worldviews, whereas personality and
values are mostly self-referencing
63. The social axioms survey
Five common factors has been identified:Social cynicism
A negative view of human nature and social events
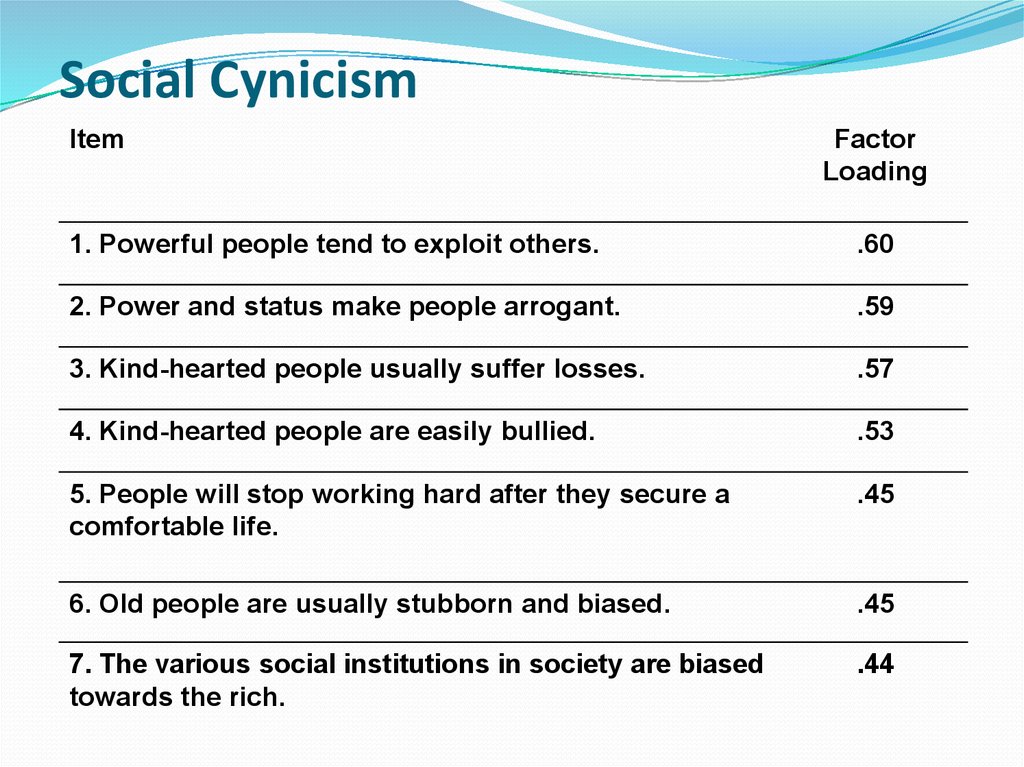
64. Social Cynicism
ItemFactor
Loading
1. Powerful people tend to exploit others.
.60
2. Power and status make people arrogant.
.59
3. Kind-hearted people usually suffer losses.
.57
4. Kind-hearted people are easily bullied.
.53
5. People will stop working hard after they secure a
comfortable life.
.45
6. Old people are usually stubborn and biased.
.45
7. The various social institutions in society are biased
towards the rich.
.44
65. The social axioms survey Leung, Bond, et al., Journal of Cross-Cultural Psychology
Five common factors has been identified:Reward for application
The belief that effort will lead to positive outcomes
66. Reward for Application
ItemFactor
Loading
1. One will succeed if he/she really tries.
.63
2. Hard working people will achieve more in the
end.
.59
3. Adversity can be overcome by effort.
.56
4. Every problem has a solution.
.50
5. Knowledge is necessary for success.
.49
6. One who does not know how to plan his or her
future will eventually fail.
.45
67.
Social complexityMultiple solutions to problems and the uncertainty of
events
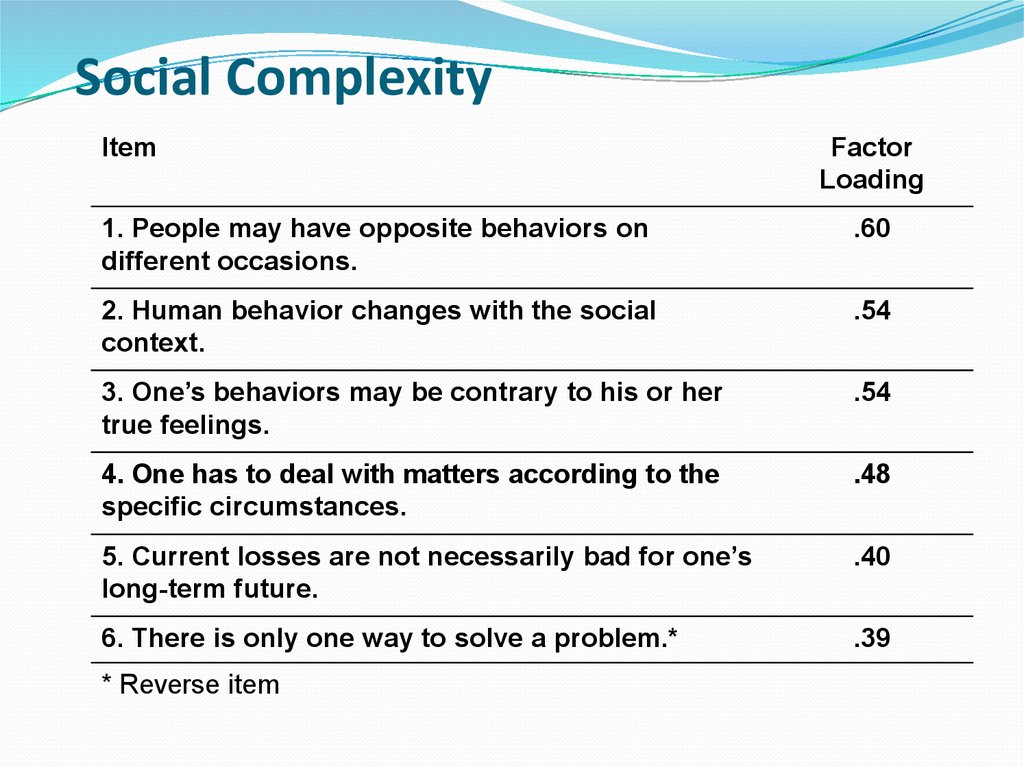
68. Social Complexity
ItemFactor
Loading
1. People may have opposite behaviors on
different occasions.
.60
2. Human behavior changes with the social
context.
.54
3. One’s behaviors may be contrary to his or her
true feelings.
.54
4. One has to deal with matters according to the
specific circumstances.
.48
5. Current losses are not necessarily bad for one’s
long-term future.
.40
6. There is only one way to solve a problem.*
.39
* Reverse item
69.
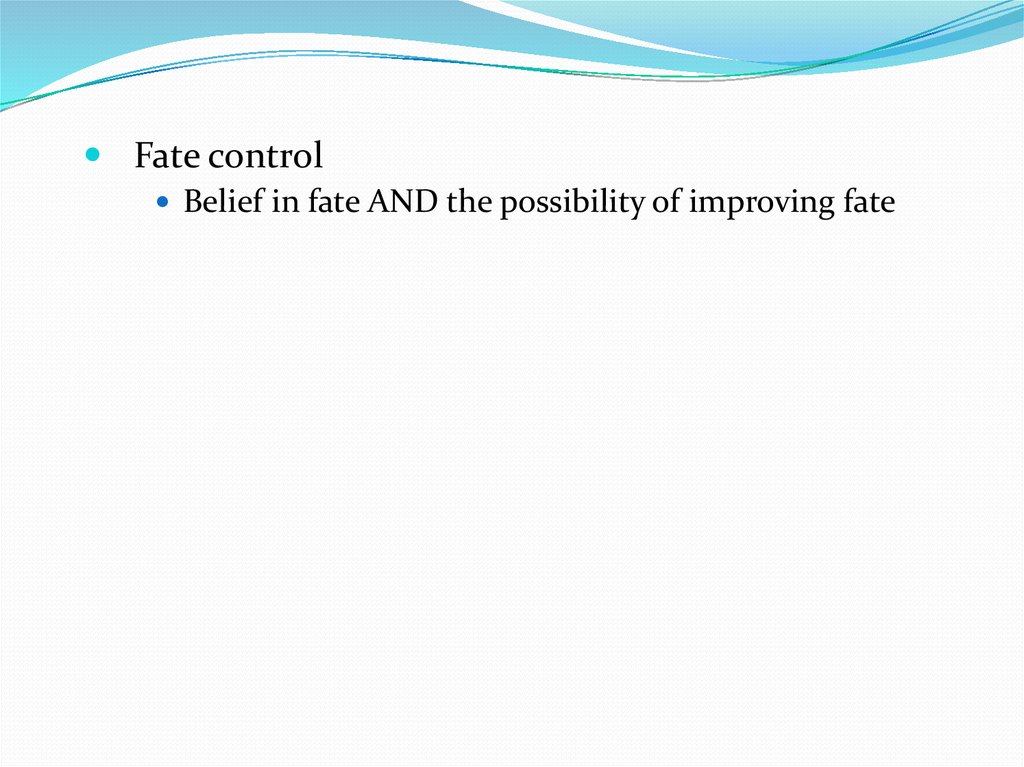
Fate controlBelief in fate AND the possibility of improving fate
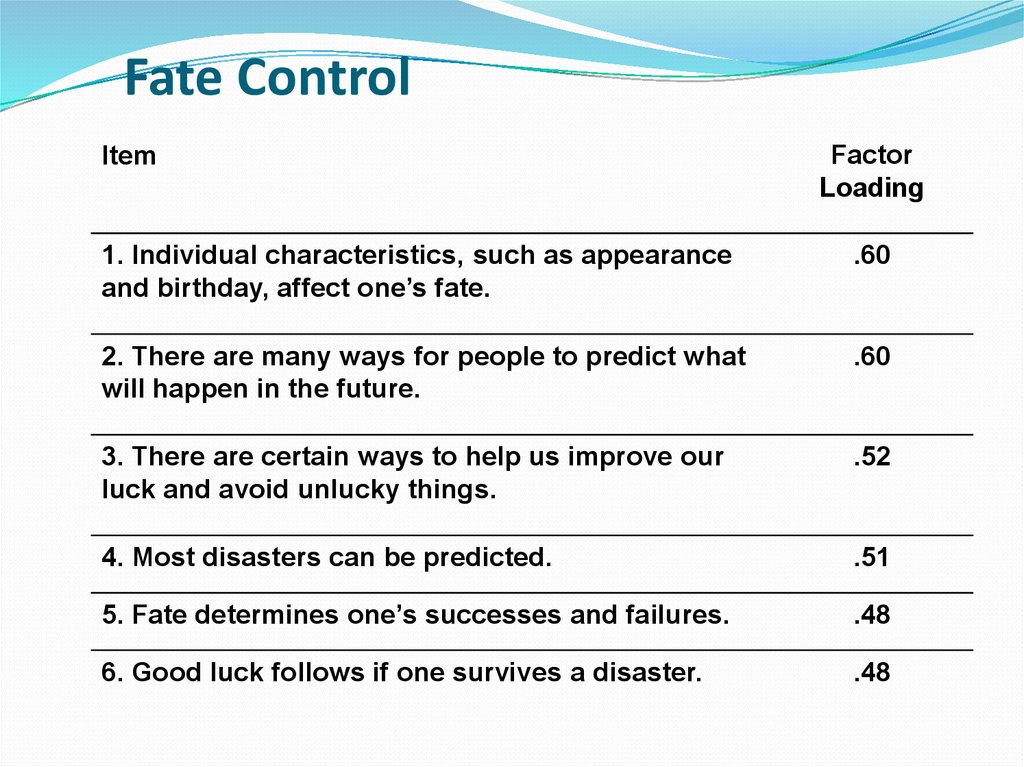
70. Fate Control
ItemFactor
Loading
1. Individual characteristics, such as appearance
and birthday, affect one’s fate.
.60
2. There are many ways for people to predict what
will happen in the future.
.60
3. There are certain ways to help us improve our
luck and avoid unlucky things.
.52
4. Most disasters can be predicted.
.51
5. Fate determines one’s successes and failures.
.48
6. Good luck follows if one survives a disaster.
.48
71.
ReligiosityThe existence of a supreme being and positive
consequences of religious belief
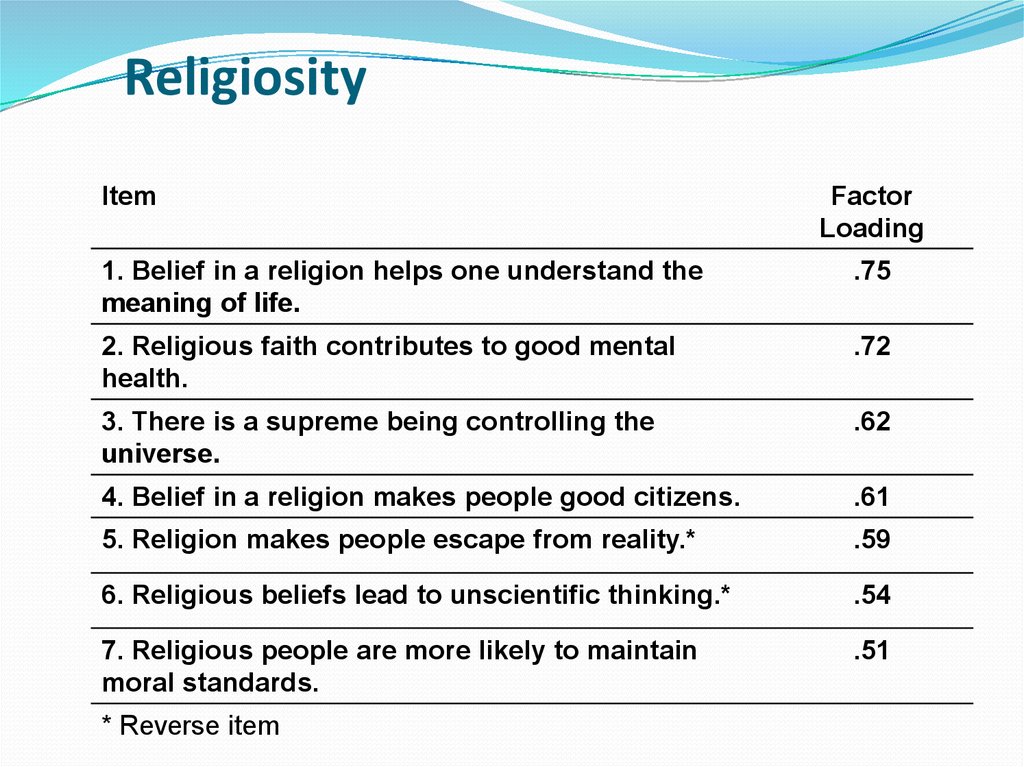
72. Religiosity
ItemFactor
Loading
1. Belief in a religion helps one understand the
meaning of life.
.75
2. Religious faith contributes to good mental
health.
.72
3. There is a supreme being controlling the
universe.
.62
4. Belief in a religion makes people good citizens.
.61
5. Religion makes people escape from reality.*
.59
6. Religious beliefs lead to unscientific thinking.*
.54
7. Religious people are more likely to maintain
moral standards.
.51
* Reverse item
73.
CitizenAmerican
Belgian
Brazilian
British
Canadian
Chinese
Czech
Dutchman
Estonian
Filipino
Finn
French
Georgian
German
Greek
Hong Kong Chinese
Hungarian
Indian
Indonesian
Iranian
Israeli
Italian
Japanese
Social
Cynicism
2.65
2.97
2.81
2.75
2.63
3.03
2.77
2.62
3.16
2.84
2.76
3.05
3.37
3.32
3.32
3.13
2.96
3.04
2.72
2.89
2.76
2.74
3.16
Social
Complexity
4.10
4.03
3.98
4.11
4.20
4.08
4.10
4.18
4.11
4.09
4.08
4.08
3.88
4.33
4.02
4.08
4.13
3.92
3.96
3.79
4.16
4.01
4.04
Reward for
Application
3.66
3.36
3.54
3.46
3.74
3.74
3.29
3.18
3.81
4.03
3.59
3.56
3.69
3.76
3.73
3.70
3.40
4.19
4.14
4.12
3.60
3.28
3.50
Religiosity
3.18
2.58
3.39
2.81
3.10
2.92
3.10
2.73
2.70
3.52
3.07
2.60
3.65
2.93
3.13
3.44
2.99
3.37
4.22
4.15
2.60
2.72
2.65
Fate
Control
2.46
2.58
2.49
2.35
2.43
2.90
2.62
2.56
2.81
2.60
2.54
2.62
3.00
2.77
2.37
2.69
2.67
2.97
2.91
2.85
2.53
2.29
2.59
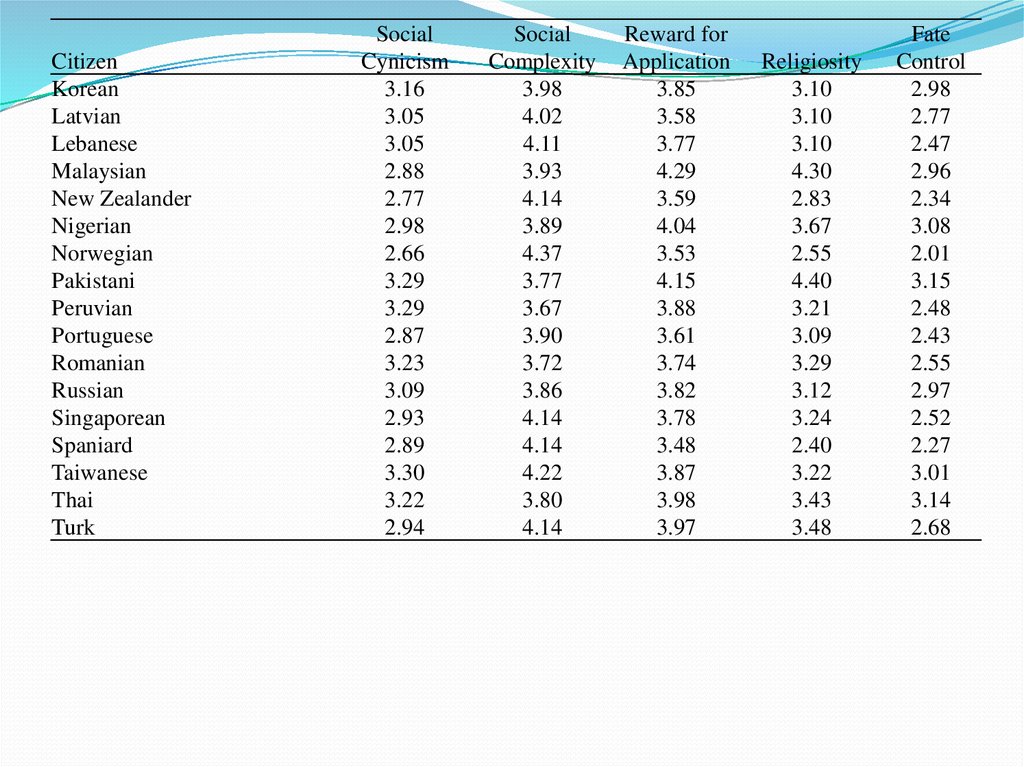
74.
CitizenKorean
Latvian
Lebanese
Malaysian
New Zealander
Nigerian
Norwegian
Pakistani
Peruvian
Portuguese
Romanian
Russian
Singaporean
Spaniard
Taiwanese
Thai
Turk
Social
Cynicism
3.16
3.05
3.05
2.88
2.77
2.98
2.66
3.29
3.29
2.87
3.23
3.09
2.93
2.89
3.30
3.22
2.94
Social
Complexity
3.98
4.02
4.11
3.93
4.14
3.89
4.37
3.77
3.67
3.90
3.72
3.86
4.14
4.14
4.22
3.80
4.14
Reward for
Application
3.85
3.58
3.77
4.29
3.59
4.04
3.53
4.15
3.88
3.61
3.74
3.82
3.78
3.48
3.87
3.98
3.97
Religiosity
3.10
3.10
3.10
4.30
2.83
3.67
2.55
4.40
3.21
3.09
3.29
3.12
3.24
2.40
3.22
3.43
3.48
Fate
Control
2.98
2.77
2.47
2.96
2.34
3.08
2.01
3.15
2.48
2.43
2.55
2.97
2.52
2.27
3.01
3.14
2.68
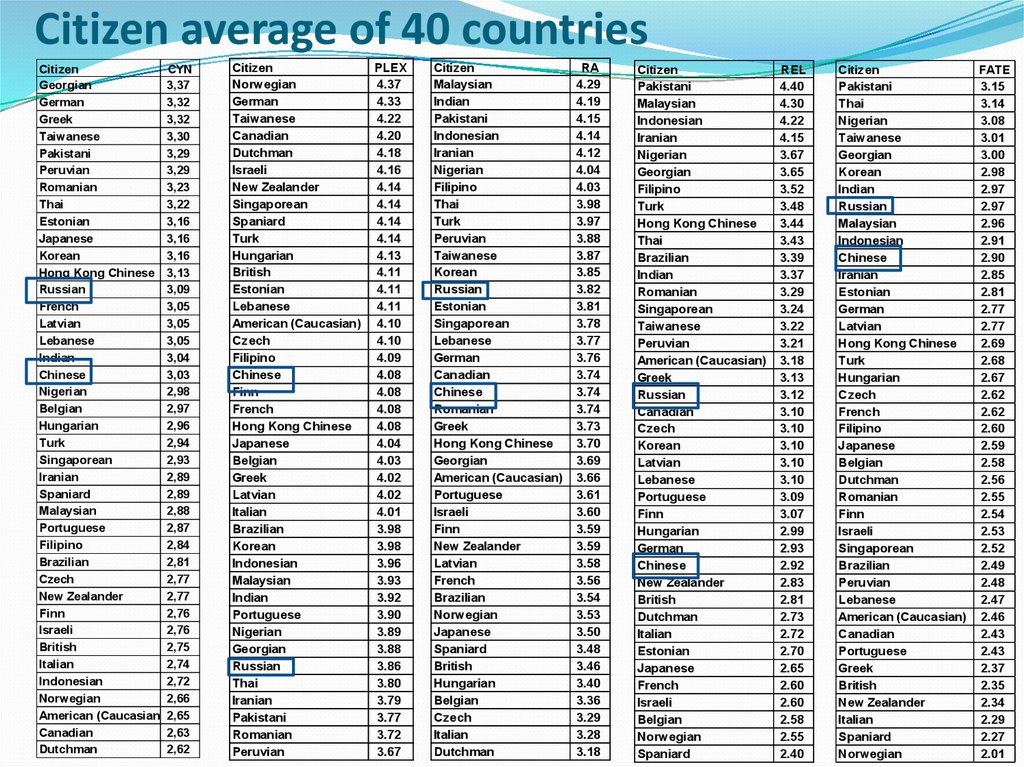
75. Citizen average of 40 countries
CitizenCYN
Georgian
3,37
German
3,32
Greek
3,32
Taiwanese
3,30
Pakistani
3,29
Peruvian
3,29
Romanian
3,23
Thai
3,22
Estonian
3,16
Japanese
3,16
Korean
3,16
Hong Kong Chinese 3,13
Russian
3,09
French
3,05
Latvian
3,05
Lebanese
3,05
Indian
3,04
Chinese
3,03
Nigerian
2,98
Belgian
2,97
Hungarian
2,96
Turk
2,94
Singaporean
2,93
Iranian
2,89
Spaniard
2,89
Malaysian
2,88
Portuguese
2,87
Filipino
2,84
Brazilian
2,81
Czech
2,77
New Zealander
2,77
Finn
2,76
Israeli
2,76
British
2,75
Italian
2,74
Indonesian
2,72
Norwegian
2,66
American (Caucasian) 2,65
Canadian
2,63
Dutchman
2,62
Citizen
Norwegian
German
Taiwanese
Canadian
Dutchman
Israeli
New Zealander
Singaporean
Spaniard
Turk
Hungarian
British
Estonian
Lebanese
American (Caucasian)
Czech
Filipino
Chinese
Finn
French
Hong Kong Chinese
Japanese
Belgian
Greek
Latvian
Italian
Brazilian
Korean
Indonesian
Malaysian
Indian
Portuguese
Nigerian
Georgian
Russian
Thai
Iranian
Pakistani
Romanian
Peruvian
PLEX
4.37
4.33
4.22
4.20
4.18
4.16
4.14
4.14
4.14
4.14
4.13
4.11
4.11
4.11
4.10
4.10
4.09
4.08
4.08
4.08
4.08
4.04
4.03
4.02
4.02
4.01
3.98
3.98
3.96
3.93
3.92
3.90
3.89
3.88
3.86
3.80
3.79
3.77
3.72
3.67
Citizen
Malaysian
Indian
Pakistani
Indonesian
Iranian
Nigerian
Filipino
Thai
Turk
Peruvian
Taiwanese
Korean
Russian
Estonian
Singaporean
Lebanese
German
Canadian
Chinese
Romanian
Greek
Hong Kong Chinese
Georgian
American (Caucasian)
Portuguese
Israeli
Finn
New Zealander
Latvian
French
Brazilian
Norwegian
Japanese
Spaniard
British
Hungarian
Belgian
Czech
Italian
Dutchman
RA
4.29
4.19
4.15
4.14
4.12
4.04
4.03
3.98
3.97
3.88
3.87
3.85
3.82
3.81
3.78
3.77
3.76
3.74
3.74
3.74
3.73
3.70
3.69
3.66
3.61
3.60
3.59
3.59
3.58
3.56
3.54
3.53
3.50
3.48
3.46
3.40
3.36
3.29
3.28
3.18
Citizen
Pakistani
Malaysian
Indonesian
Iranian
Nigerian
Georgian
Filipino
Turk
Hong Kong Chinese
Thai
Brazilian
Indian
Romanian
Singaporean
Taiwanese
Peruvian
American (Caucasian)
Greek
Russian
Canadian
Czech
Korean
Latvian
Lebanese
Portuguese
Finn
Hungarian
German
Chinese
New Zealander
British
Dutchman
Italian
Estonian
Japanese
French
Israeli
Belgian
Norwegian
Spaniard
REL
4.40
4.30
4.22
4.15
3.67
3.65
3.52
3.48
3.44
3.43
3.39
3.37
3.29
3.24
3.22
3.21
3.18
3.13
3.12
3.10
3.10
3.10
3.10
3.10
3.09
3.07
2.99
2.93
2.92
2.83
2.81
2.73
2.72
2.70
2.65
2.60
2.60
2.58
2.55
2.40
Citizen
FATE
Pakistani
3.15
Thai
3.14
Nigerian
3.08
Taiwanese
3.01
Georgian
3.00
Korean
2.98
Indian
2.97
Russian
2.97
Malaysian
2.96
Indonesian
2.91
Chinese
2.90
Iranian
2.85
Estonian
2.81
German
2.77
Latvian
2.77
Hong Kong Chinese
2.69
Turk
2.68
Hungarian
2.67
Czech
2.62
French
2.62
Filipino
2.60
Japanese
2.59
Belgian
2.58
Dutchman
2.56
Romanian
2.55
Finn
2.54
Israeli
2.53
Singaporean
2.52
Brazilian
2.49
Peruvian
2.48
Lebanese
2.47
American (Caucasian) 2.46
Canadian
2.43
Portuguese
2.43
Greek
2.37
British
2.35
New Zealander
2.34
Italian
2.29
Spaniard
2.27
Norwegian
2.01
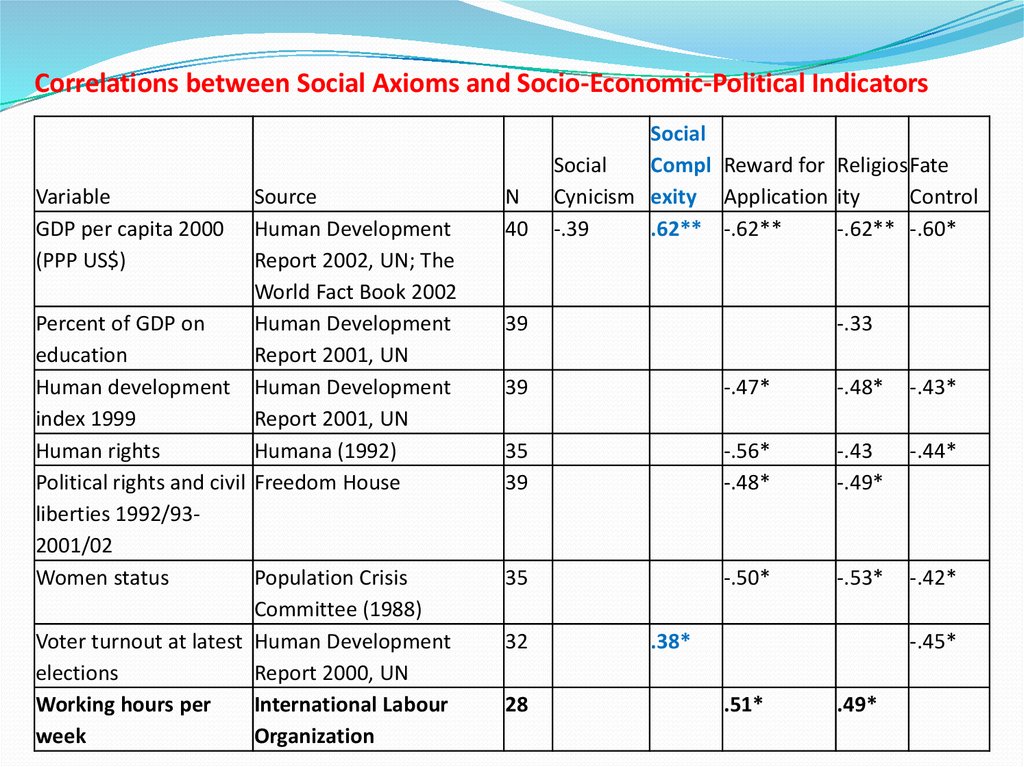
76. Correlations between Social Axioms and Socio-Economic-Political Indicators
VariableGDP per capita 2000
(PPP US$)
Source
Human Development
Report 2002, UN; The
World Fact Book 2002
Percent of GDP on
Human Development
education
Report 2001, UN
Human development Human Development
index 1999
Report 2001, UN
Human rights
Humana (1992)
Political rights and civil Freedom House
liberties 1992/932001/02
Women status
Population Crisis
Committee (1988)
Voter turnout at latest Human Development
elections
Report 2000, UN
Working hours per
International Labour
week
Organization
N
40
Social
Social
Compl Reward for Religios Fate
Cynicism exity Application ity
Control
-.39
.62** -.62**
-.62** -.60*
39
-.33
39
-.47*
-.48*
-.43*
35
39
-.56*
-.48*
-.43
-.49*
-.44*
35
-.50*
-.53*
-.42*
32
28
.38*
-.45*
.51*
.49*







 Бизнес
 Культурология


