


")
 and Spain (higher), smaller changes elsewhere")


 Экономика
Похожие презентации:


")

World economics: Modern Factors of Economic Growth and Economic Development
1. World economics: Modern Factors of Economic Growth and Economic Development
WORLDECONOMICS:
MODERN FACTORS OF
ECONOMIC GROWTH AND
Prof. Zharova Liubov
ECONOMIC
DEVELOPMENT
Zharova_l@ua.fm
2. Factors That Affect Economic Growth
FACTORS THAT AFFECTECONOMIC GROWTH
1. Natural Resources. The discovery of more natural resources like oil, or mineral
deposits may boost economic growth as this shifts or increases the country’s
Production Possibility Curve. Other resources include land, water, forests and
natural gas. Realistically, it is difcult, if not impossible, to increase the number of
natural resources in a country. Countries must take care to balance the supply
and demand of scarce natural resources to avoid depleting them. Improved land
management may improve the quality of land and contribute to economic growth.
2. Physical Capital or Infrastructure. Increased investment in physical capital
such as factories, machinery, and roads will lower the cost of economic activity.
Better factories and machinery are more productive than physical labor. This
higher productivity can increase output. For example, having a robust highway
system can reduce inefciencies in moving raw materials or goods across the
country which can increase its GDP.
3. Population or Labor. A growing population means there is an increase in the
availability of workers or employees, which means a higher workforce. One
downside of having a large population is that it could lead to high unemployment.
3. Factors That Affect Economic Growth
FACTORS THAT AFFECTECONOMIC GROWTH
4. Human Capital. An increase in investment in human capital can
improve the quality of the labor force. This would result in an
improvement of skills, abilities, and training. A skilled labor force has
a signifcant efect on growth since skilled workers are more productive.
5. Technology. Another infuential factor is the improvement of
technology. Technology could increase productivity with the same levels
of labor, thus accelerating growth and development. This means
factories can be more productive at lower costs. Technology is most likely
to lead to sustained long-run growth.
6. Law. An institutional framework which regulates economic activity such
as rules and laws. There is no specifc set of institutions that promote
growth.
4. Factors that Limit Economic Growth
FACTORS THAT LIMITECONOMIC GROWTH
1. Poor health and low levels of education. People who don’t have access to healthcare or
education have lower levels of productivity. This means the labor force is not as productive
as it could be. Therefore, the economy does not reach the productivity it could otherwise.
2. Lack of necessary infrastructure. Developing nations often sufer from inadequate
infrastructures such as roads, schools, and hospitals. This lack of infrastructure makes
transportation more expensive and slows the overall efciency of the country.
3. Flight of Capital. If the country is not delivering the returns expected from investors, then
investors will pull out their money. Money often fows out the country to seek higher rates of
returns.
4. Political Instability. Similarly, political instability in the government scares investors and
hinders investment. For example, Zimbabwe has been plagued with political uncertainty and
laws favoring indigenous ownership. This has scared of many investors who prefer smaller
but surer returns elsewhere.
5. Institutional Framework. Often local laws don’t adequately protect rights. Lack of an
institutional framework can severely impact progress and investment.
5. Factors of economic growth
FACTORS OF ECONOMICGROWTH
Boom and Bust Business Cycles. If economic growth is high-speed and
infationary, then the level of growth will become unsustainable. This could lead
to a recession like the Great Recession in 2008. However, this type of growth is
typical of a business cycle.
Export-led. The Japanese and Chinese economy have experienced export-led
growth thanks to a high current account surplus. This is because they have
signifcantly more exports than imports.
Consumer. The US economy is dependent on consumer spending for economic
growth. As a result, they also have a higher current account defcit.
Commodity exports. These economies are dependent on their natural resources
like oil or iron ore. For example, Saudi Arabia has a had a very prosperous
economy thanks to their oil exports. However, this can cause a problem when
commodity prices fall, and there aren’t other industries to balance things out.
6. hofstede-insights
1. Power Distance is defned as the extent towhich the less powerful members of
institutions and organizations within a country
expect and accept that power is distributed
unequally.
2. The fundamental issue addressed by this
dimension is the degree of interdependence a
society maintains among its members.
3. The fundamental issue here is what motivates
people, wanting to be the best (Masculine) or
liking what you do (Feminine).
4. The extent to which the members of a culture
feel threatened by ambiguous or unknown
situations and have created beliefs and
institutions that try to avoid these is refected
in the score on Uncertainty Avoidance.
5. This dimension describes how every society
has to maintain some links with its own past
while dealing with the challenges of the
present and future, and societies prioritise
these two existential goals diferently.
6. This dimension is defned as the extent to
which people try to control their desires and
impulses, based on the way they were raised.
HOFSTEDE-INSIGHTS
7. Path dependency
PATH DEPENDENCYPath dependency is an idea that tries to explain the continued use of a
product or practice based on historical preference or use. This holds true
even if newer, more efcient products or practices are available due to the
previous commitment made. Path dependency occurs because it is often
easier or more cost efective to simply continue along an already set path
than to create an entirely new one.
An example of path dependency would be a town that is built around a factory. It
makes more sense for a factory to be located a distance away from residential
areas for various reasons. However, it is often the case that the factory was built
frst, and the workers needed homes and amenities built close by for them. It
would be far too costly to move the factory once it has already been established,
even though it would better serve the community from the outskirts of town.
8. Middle class
MIDDLE CLASSDiferent, partly overlapping concepts of ‘class’
Statistical partitioning of distribution in discrete, partly arbitrary, groups
Sociological perspective (position in division of labour, occupations, education)
Political (capacity to forge identities and articulate common demands)
'Middle Class'
Middle class is a description given to individuals and households who fall between
the working class and the upper class within a societal hierarchy. In Western
cultures, persons in the middle class tend to have a higher proportion of college
degrees than those in the working class, have more income available for
consumption and may own property. Those in the middle class often are employed
as professionals, managers and civil servants.
9. Middle class
MIDDLE CLASSno single OECD defnition of the ‘middle-class’ analogue that what we use
for income poverty (40, 50, 60% of median household disposable income),
i.e. various OECD studies used diferent defnitions
general defnition of the middle class used here: people in 5th to 9th decile
of the distribution (Palma ratio). At this stage, not much evidence that
alternative defnitions would lead to similar conclusions
10. middle class depends on earnings as main income source
MIDDLE CLASS DEPENDS ON EARNINGS ASMAIN INCOME SOURCE
11. Increasingly dual-earnings households
INCREASINGLY DUAL-EARNINGS HOUSEHOLDS12. Predominantly prime-aged (with children)
PREDOMINANTLY PRIME-AGED (WITHCHILDREN)
13. Significantly changes in the US (lower) and Spain (higher), smaller changes elsewhere
SIGNIFICANTLY CHANGES IN THE US (LOWER)AND SPAIN (HIGHER), SMALLER CHANGES
ELSEWHERE
14.
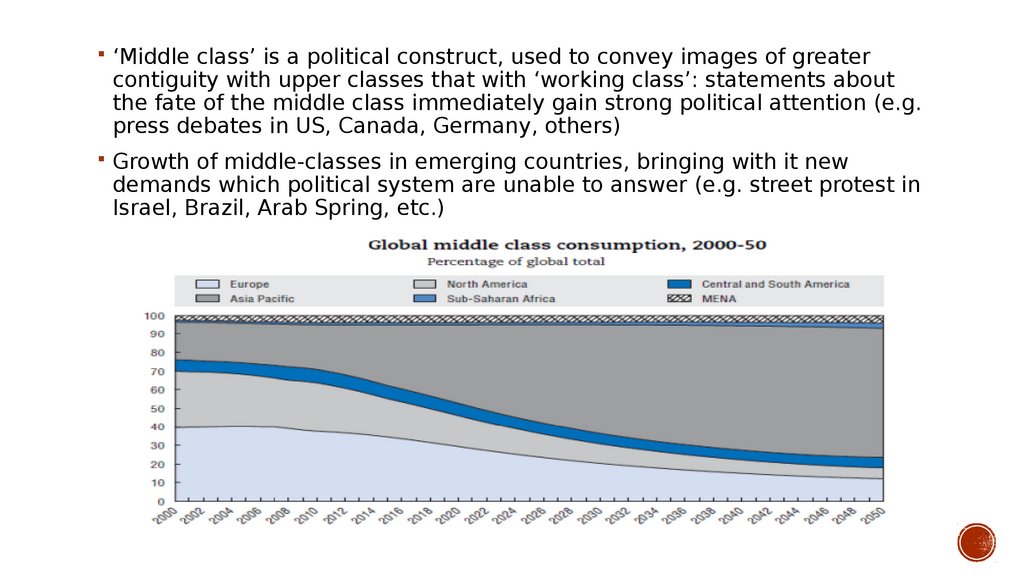
‘Middle class’ is a political construct, used to convey images of greatercontiguity with upper classes that with ‘working class’: statements about
the fate of the middle class immediately gain strong political attention (e.g.
press debates in US, Canada, Germany, others)
Growth of middle-classes in emerging countries, bringing with it new
demands which political system are unable to answer (e.g. street protest in
Israel, Brazil, Arab Spring, etc.)
15. Financial crises
FINANCIAL CRISESThe amount of subprime mortgage debt, which was guaranteed by Freddie
Mac and Fannie Mae, continued to expand into the early 2000s, about the
time the Federal Reserve Board began to cut interest rates drastically to
fend of a recession. The combination of loose credit requirements and
cheap money spurred a housing boom, which drove speculation, which in
turn drove up housing prices.
16. The Great Recession
THE GREAT RECESSIONThe Great Recession is a term that represents the sharp
decline in economic activity during the late 2000s, which is
generally considered the largest downturn since the Great
Depression.
The term Great Recession is a play on the term Great
Depression
Great Recession applies to both the U.S. recession, ofcially
lasting from December 2007 to June 2009, and the
ensuing global recession in 2009. The economic slump began
when the U.S. housing market went from boom to bust and
large amounts of mortgage-backed
securities and derivatives lost signifcant value.
17. Before Great Recession
BEFORE GREAT RECESSIONThe investment banks, looking for easy profts in the wake of the
dotcom bust and 2001 recession, created collateralized debt
obligations (CDOs) out of mortgages purchased on the secondary
market.
Because subprime mortgages were bundled with prime mortgages,
there was no way for investors to understand the risks associated with
the product.
Around the time when the market for CDOs was heating up, the
housing bubble that had been building up for several years was
beginning to burst.
As housing prices fell, subprime borrowers began to default on loans
that were worth more than their homes, accelerating the decline in
prices.
When investors realized the CDOs were becoming worthless due to
the toxic debt they represented, they tried to unload them, but there
was no market for them.
This caused a cascade of subprime lender failures, which created a
liquidity contagion that worked its way to the upper tiers of the
banking system.
Two major investment banks, Lehman Brothers and Bear Stearns,
18. Dotcom bubble
DOTCOM BUBBLEThe dotcom bubble occurred in the late 1990s and was
characterized by a rapid rise in equity markets fueled by
investments in Internet-based companies. During
the dotcom bubble, the value of equity markets grew
exponentially, with the technology-dominated NASDAQ index
rising from under 1,000 to more than 5,000 between 1995 and
2000.
The dotcom bubble grew out of a combination of the presence
of speculative or fad-based investing, the abundance of
venture capital funding for startups and the failure of dotcoms
to turn a proft. Investors poured money into Internet startups
during the 1990s in the hope that those companies would one
day become proftable, and many investors and venture
capitalists abandoned a cautious approach for fear of not being
able to cash in on the growing use of the Internet.
The 1990s was a period of rapid technological advancement in
many areas, but it was the commercialization of the Internet that
led to the greatest expansion of capital growth the country had
ever seen. Although high-tech standard bearers, such as Intel,
Cisco, and Oracle were driving the organic growth in the technology
sector, it was the upstart dotcom companies that fueled the stock
19. Lessons
From IMFLESSONS
Originators need to be "incentivized" to make loans to high-quality
borrowers and to monitor loan performance more carefully.
The governance structure of the risk management system needs to be
improved in fnancial frms in which the incentives are biased toward
returns rather than the risks involved in attaining them.
The incentives to use credit rating agencies and the incentive structures
within credit rating agencies themselves need to be reexamined
Investors need to perform their own due diligence and ask the right
questions about the riskiness of the securities they are purchasing
20. EIU global forecast - Higher interest rates are coming
EIU GLOBAL FORECAST HIGHER INTEREST RATESARE COMING
The US economy will continue to motor along; the euro area will absorb
more of labour market slack; the Chinese government will manage its
economic slowdown carefully; and Japan's economy will grow by 1.5%.
Higher commodity prices will prove a fllip for emerging-market exporters,
as will strong external demand from developed markets.
However, 2018 will also be characterised by tightening monetary policy
and credit conditions. On balance, the global economy is forecast to
expand by 3% in 2018 and 2.9% in 2019, from an estimated 3% in 2017.
21. Developed world
DEVELOPED WORLDThe US economy is in good shape, and we have revised up economic growth in 2018 to
2.5%, from 2.3% previously. Wage growth is showing signs of accelerating, and the
unemployment rate is at its lowest level since 2000.
Expects the US economy to show signs of overheating in the next two years, as a result
of which the Fed will quicken the pace of monetary tightening, especially given the
recent tax changes. Unable to cope with this, the economy will face a downturn in early
2020.
The recent revival of the euro zone economy is likely to be sustained, but political risk
will remain high. EU leaders are currently boosting the region's resilience to shocks, in
part by renewing their push for further integration of the economic and monetary union.
A decision on reform proposals will be made at the EU summit in June 2018. Following
the renewed landslide secured by the ruling Liberal Democratic Party (LDP) in Japan,
Shinzo Abe is in a strong position to secure another term as LDP leader when the party
votes in late 2018. This comes in the context of the country's mild economic recovery
under the prime minister's recovery plan.
22. Emerging markets
EMERGING MARKETSConditions for emerging markets to become more challenging in the frst half of the
forecast period as US interest rates continue to rise. India will be Asia's fastest-growing
large economy in 2018‑22, expanding at an average annual rate of 7.9%. Growth will
also remain on track in the Association of South-East Asian Nations (ASEAN) member
states, with an average annual expansion of 4.8%. Vietnam, Cambodia and Myanmar,
in particular, will continue to record growth rates above 6%, owing to relatively low
wage costs and advantageous geographic locations.
the Chinese economy to slowly slightly in 2018, to 6.4%, from an estimated 6.9% in
2017. The government's long-held target of doubling real GDP between 2010 and 2020
is within its grasp; it requires annual average GDP growth of 6.3% in 2018‑20. We
believe that it will meet this target without requiring signifcant economic stimulus. We
expect China to move away from GDP targeting in the next decade. This is
ideologically consistent with the call of the president, Xi Jinping, for more inclusive
growth in his landmark speech at the party congress at the end of 2017. As such, we
expect growth to continue to slow steadily in the forecast period, reaching 5.2% in
2022.
23. Emerging markets
EMERGING MARKETSThe ongoing economic recovery in Latin America is forecast to gather momentum in 2018‑19, after several
years dominated by macroeconomic policy adjustments to the end of the commodities boom of the previous
decade. Sustained Chinese growth will continue to provide a favourable external environment for the region,
particularly for commodity exporters such as Brazil and Argentina. This, combined with a rise in global risk
appetite, as refected in lower sovereign credit default swap rates (except for Venezuela, which defaulted on
some external debt obligations in late 2017, taking the country further into economic and fnancial crisis), has
generated strong growth in local stockmarkets.
At present, seven countries in the Middle East that collectively account for a quarter of the regional population
are either torn by civil war or destabilised by Shia-Sunni rivalry. Geopolitical risk has also risen rapidly within
the Gulf Co‑operation Council (GCC). We expect the boycott of Qatar by some of the GCC countries and Egypt
to continue until at least 2021. In this period divisions will harden between Qatar, Turkey and Iran on one side,
and Saudi Arabia, the UAE and Egypt on the other. The long-term rivalry between Saudi Arabia and Iran is
likely to destabilise a group of other countries in the Middle East, including Iraq, Syria, Lebanon and Yemen.
Tensions are likely to increase rather than diminish in the region in the coming months.
Following a dismal performance in Sub-Saharan Africa over 2016‑17, we expect a lacklustre recovery to take
hold from 2018. This will be driven by a favourable external environment as export prices strengthen and
trade gathers pace. However, policy mismanagement, unsupportive political dynamics and gradual tightening
of credit conditions in developed economies will weigh on future prospects. On balance, the region is forecast
to grow by 3.3% a year in 2018‑22.
24. Exchange rates
COMMODITIESThe price of crude oil is likely to remain range-bound, at US$60‑70/barrel in
2018‑19 for dated Brent Blend, despite the eforts of OPEC and its partners,
notably Russia, to constrain global supply by extending the existing
production-cut deal until the end of 2018. These eforts will be largely
ofset by US shale, which will provide both a price ceiling and a foor.
Industrial raw materials prices are set to rise for a second successive year
in 2018 on the back of strong growth in China and strict environmental
controls restricting supply. We expect marginal growth in food, feedstufs
and beverages prices, refecting rising population, incomes and rapid
urbanisation.
25. Commodities
WORLDECONO
MY:
FORECA
ST
SUMMA
RY