


 Финансы
Похожие презентации:

")


The Hershey Company SEC
1.
SEC 10-K Report:The Hershey Company
Fiscal Year Ended December 31,
2017
Professor Lazurus
Acct 221 7983
Principles of Accounting (2188)
2. The Hershey Company…a bit of History
The Hershey Company was founded in 1894 by Milton S. Hershey and is one of thelargest chocolate manufacturers in the world
Hershey was also known as
Hershey Chocolate Factory
Hershey Chocolate Corporation
Hershey Foods Corporation
Hershey sells and distributes products in more than 80 countries
Many popular name brands, just to name a couple
Jolly Rancher
Reese’s
Kit Kat
Kisses
Hershey is headquartered in Hershey, Pennsylvania
Employees 15,360 Full-time; 1,550 part-time
Trades on NYSE, symbol “HSY”
Ranked 379 on Fortune 500
3.
Hershey: Income Statement – RevenueHershey has had steady Revenue growth since 2015
Net Sales grew .73% in 2016 and 1.01% in 2017
Hershey spent less on trade promotional spending
Cost of Sales increased in 2016 by $278M but then decreased by $211M in
2017.
Reduction was due to lower commodity costs
Gross profit decrease in 2016 was a result of the increased cost of sales that
year.
Net Sales (revenue)
Cost of Goods Sold
Gross Profit
$
$
$
2017
7,515,426 $
(4,070,907) $
3,444,519 $
2016
7,440,181 $
(4,282,290) $
3,157,891 $
2015
7,386,626
(4,003,951)
3,382,675
4.
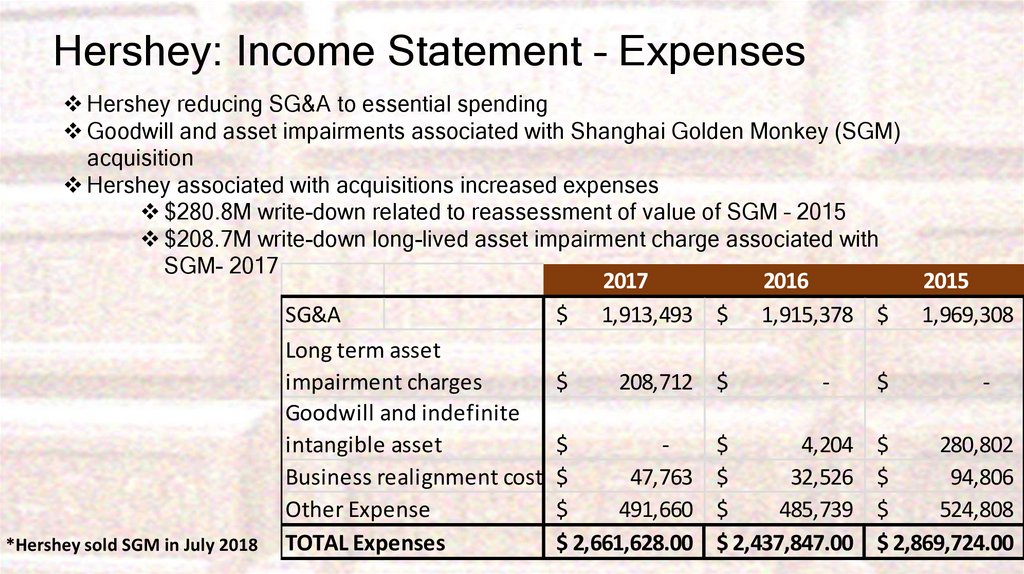
Hershey: Income Statement – ExpensesHershey reducing SG&A to essential spending
Goodwill and asset impairments associated with Shanghai Golden Monkey (SGM)
acquisition
Hershey associated with acquisitions increased expenses
$280.8M write-down related to reassessment of value of SGM – 2015
$208.7M write-down long-lived asset impairment charge associated with
SGM- 2017
*Hershey sold SGM in July 2018
SG&A
Long term asset
impairment charges
Goodwill and indefinite
intangible asset
Business realignment cost
Other Expense
TOTAL Expenses
$
2017
1,913,493 $
$
208,712 $
$
$
47,763
$
491,660
$ 2,661,628.00
2016
1,915,378 $
-
$
4,204
$
32,526
$
485,739
$ 2,437,847.00
$
2015
1,969,308
-
$
280,802
$
94,806
$
524,808
$ 2,869,724.00
5.
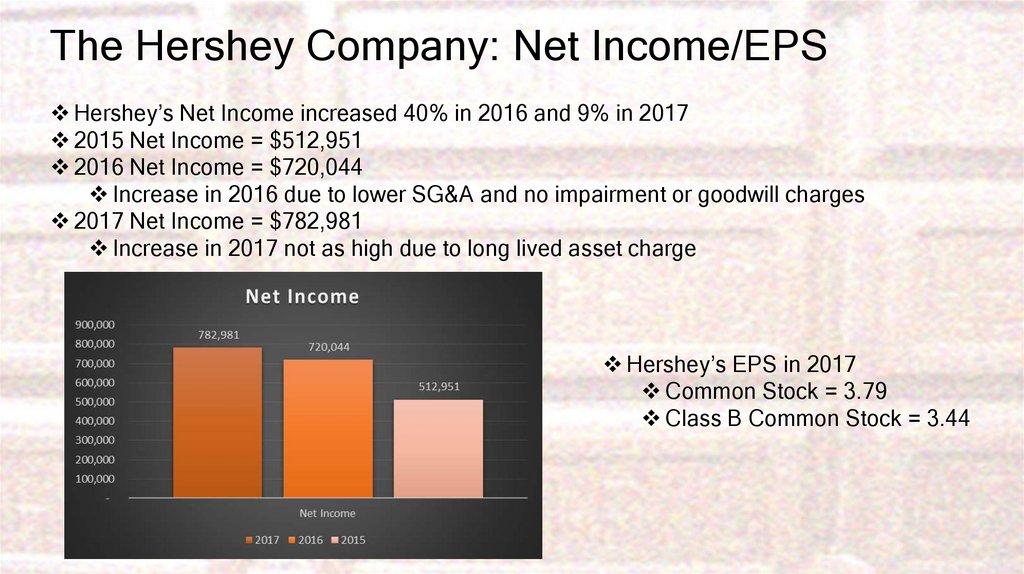
The Hershey Company: Net Income/EPSHershey’s Net Income increased 40% in 2016 and 9% in 2017
2015 Net Income = $512,951
2016 Net Income = $720,044
Increase in 2016 due to lower SG&A and no impairment or goodwill charges
2017 Net Income = $782,981
Increase in 2017 not as high due to long lived asset charge
Hershey’s EPS in 2017
Common Stock = 3.79
Class B Common Stock = 3.44
6.
Hershey: Balance Sheet AnalysisAssets:
Hershey’s PPE represents the largest
asset at 38% of total assets.
Goodwill is 15% of total assets and
increased in 2017 due to $128M
acquisition of Ripple Brand Collective,
Inc.
Liabilities:
Liabilities decreased $74M from 2016
Accrued liabilities decreased along
with short-term debt in 2017
Stockholder’s Equity:
Stockholder’s Equity increased $103M in
2017
Hershey has 149,040,927 of treasury
common stock as of 2017.
Curent Assets
PPE
Goodwill
Other Assets
Total Assets
2017
$ 2,001,910
$ 2,106,697
$ 821,061
$ 624,058
$ 5,553,726
2016
1,816,778
2,177,238
812,344
717,963
5,524,323
$
$
$
$
$
Current Liabilities
Long-Term Debt
Other long-term Liabilities
Total Liabilities
$ 2,076,543
$ 2,061,023
$ 484,595
$ 4,622,161
$ 1,909,443
$ 2,347,455
$ 632,714
$ 4,696,646
Total Stockholders equity
$ 931,565 $
827,687
Working Capital = Current Assets-Current Liabilities
2,001,910-2,076,543=(74,633)
Hershey can’t pay it’s current assets right now with the
current liabilities available
7.
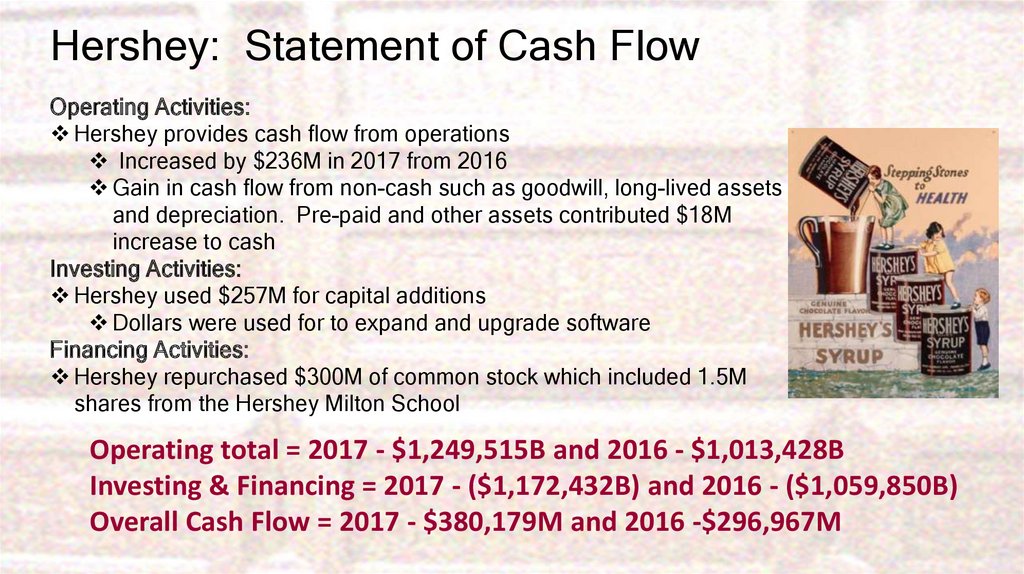
Hershey: Statement of Cash FlowOperating Activities:
Hershey provides cash flow from operations
Increased by $236M in 2017 from 2016
Gain in cash flow from non-cash such as goodwill, long-lived assets
and depreciation. Pre-paid and other assets contributed $18M
increase to cash
Investing Activities:
Hershey used $257M for capital additions
Dollars were used for to expand and upgrade software
Financing Activities:
Hershey repurchased $300M of common stock which included 1.5M
shares from the Hershey Milton School
Operating total = 2017 - $1,249,515B and 2016 - $1,013,428B
Investing & Financing = 2017 - ($1,172,432B) and 2016 - ($1,059,850B)
Overall Cash Flow = 2017 - $380,179M and 2016 -$296,967M
8.
Hershey: Ratio Analysis - 2017Current Ratio: Hershey has $.96 for every $1 of assets to pay liabilities
Current ratio = current assets/current liabilities
2,001,910/2,076,543=.96
Return on Equity: 84% is a very enticing number for an investor for the ROE
Return on Equity=Net Income/shareholder’s equity
782,981/931,565=84%
Debt Ratio: This is a fairly high ratio for Hershey at 83.2% - Hershey is pretty dependent on
borrowed money
Debt Ratio=Total Liabilities/Total Assets
4,622,161/5,553,726=83.2%
Earning Per Share-Common Stock: Stockholders receive $3.79 per share as of FY 2017,
this has increased every year for the past 3 years
Earning Per Share=Net Income-preferred dividends/weighted average shares outstanding
(574,164-0)/151,625=$3.79
9.
Hershey: Vertical Analysis – Income StatementIncome Statement
Net Sales
(a) Cost of Sales
(b) Net Income
2017
7,515,426
4,070,907
782,981
% of Total Sales
100%
(4,070,907/7,515,426)*100 = 54%
(782,981/7,515,426) * 100 = 10%
The cost of sales (a) is 54% of the net sales for 2017.
Decrease in the cost from 2016 by 4%. However the cost of sales (a)
is at 54% while the overall net income (b) is only 10%. The Net
Profit Margin (b) at 10% is actually low compared to the industry standard
of 14.33% in 2017 according to csimarket.com
10.
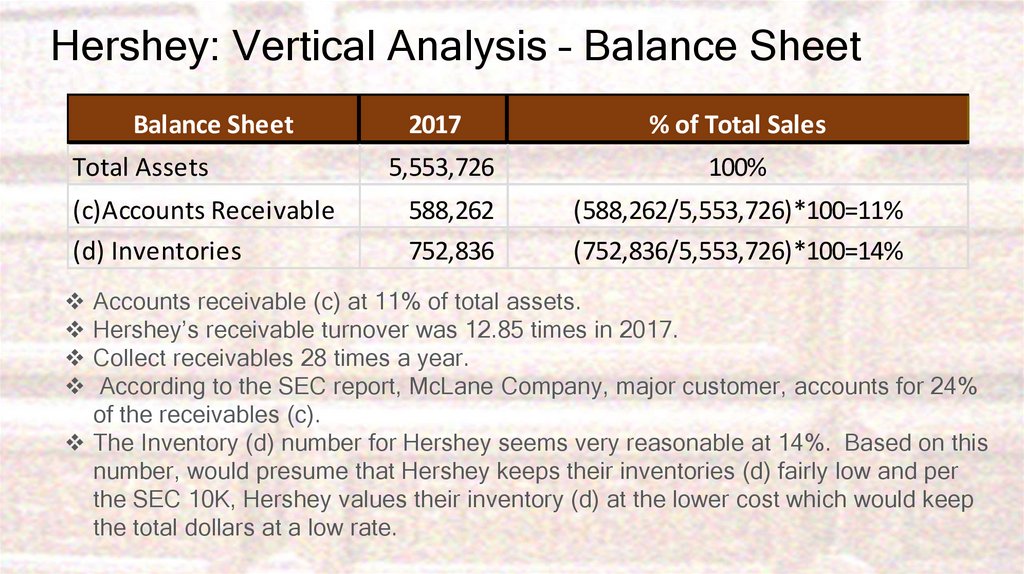
Hershey: Vertical Analysis – Balance SheetBalance Sheet
Total Assets
(c)Accounts Receivable
(d) Inventories
2017
% of Total Sales
5,553,726
100%
588,262
752,836
(588,262/5,553,726)*100=11%
(752,836/5,553,726)*100=14%
Accounts receivable (c) at 11% of total assets.
Hershey’s receivable turnover was 12.85 times in 2017.
Collect receivables 28 times a year.
According to the SEC report, McLane Company, major customer, accounts for 24%
of the receivables (c).
The Inventory (d) number for Hershey seems very reasonable at 14%. Based on this
number, would presume that Hershey keeps their inventories (d) fairly low and per
the SEC 10K, Hershey values their inventory (d) at the lower cost which would keep
the total dollars at a low rate.
11.
Hershey: Horizontal Analysis – Income StatementIncrease (Decrease)
Income Statement
2017
2016
$
%
SM&A Expense
1,913,403
1,915,378
1,975
0.10%
Selling, Marketing, and Adminstrative expenses are used to support the business for
advertising and consumer marketing. Hershey continues to find ways to save on these dollars
to support the increase of Net Income
Business Realignment Activities
47,763
32,526
(15,237)
-31.90%
Realignment of a business helps to support effeciencies in the business in order to grow the
business. Since 2015, Hershey has been pursuing effeciencies and spent $15M in 2017 to
support the effort.
12.
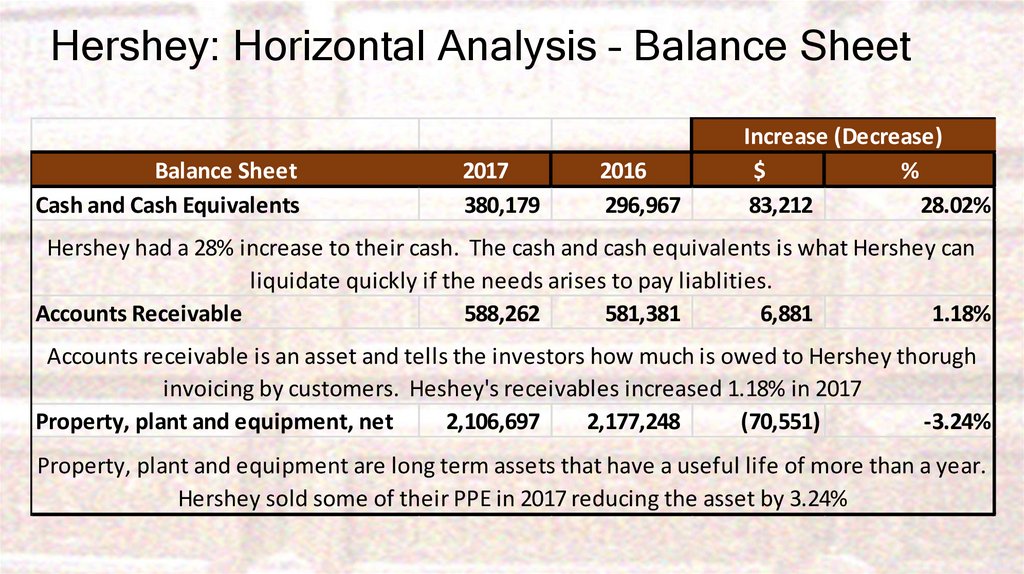
Hershey: Horizontal Analysis – Balance SheetBalance Sheet
Cash and Cash Equivalents
2017
380,179
2016
296,967
Increase (Decrease)
$
%
83,212
28.02%
Hershey had a 28% increase to their cash. The cash and cash equivalents is what Hershey can
liquidate quickly if the needs arises to pay liablities.
Accounts Receivable
588,262
581,381
6,881
1.18%
Accounts receivable is an asset and tells the investors how much is owed to Hershey thorugh
invoicing by customers. Heshey's receivables increased 1.18% in 2017
Property, plant and equipment, net
2,106,697
2,177,248
(70,551)
-3.24%
Property, plant and equipment are long term assets that have a useful life of more than a year.
Hershey sold some of their PPE in 2017 reducing the asset by 3.24%