


 Менеджмент
Похожие презентации:


, known also by names: Stockless Production (HP), Zero Inventories, Kanban")
. Chapter 14")


Scheduling and lot sizing
1.
4.2 SCHEDULING and LOT SIZINGThis chapter deals with:
•the importance of scheduling to the performance of a firm,
•the performance measures that are important in selecting a schedule
and
•schedules for single and multiple workstations.
•Lot sizing and EPQ
•Previously we have had training about scheduling/timing forward
and backwards in chapter 1.3.
JAP
1
2.
Scheduling means the allocation of resources overtime to accomplish specific tasks.
Workforce scheduling determines when employees
work.
Operations scheduling assigns jobs to machines or
workers to jobs.
Operations schedules are short-term plans
designed to implement the master production
schedule (MPS).
JAP
2
3.
The two basic manufacturing environments are:A JOB SHOP (Process focused system) is a process
focused production system which specializes in lowto medium-volume production utilizing job or batch
processes ( tasks in this type of flexible flow
environment are difficult to schedule because the
variability in job routings and the continual
introduction of new jobs to be processed) and
A FLOW JOB (Product focused system) specializes in
medium- or high-volume production and utilizes line
or continuous processes (tasks are easier to
schedule because in flow facility the jobs have a
common flow pattern through the system).
JAP
3
4.
Single Processor Scheduling (no alternative routing)In some cases an entire plant can be viewed as a single processor
(for example paper machine, car manufacturing production line).
Sometimes a single processor is a bottleneck (machine or cell) that
controls the output of the plant because its limited capacity. Try to
maximize the utilization of a bottleneck to raise the capacity.
Decide the work priority according
1. to the importance of customers,
2. tardiness (minimize the lateness or earliness)
JAP
4
5.
Allocate your customers to ABC-classesA class –strategic customers / most profitable (or
other vice important) customers which you serve
the best way
B-class ok but the service level may vary
C-class – one might try to get rid of these
especially if the are not highly profitable (their
purchases are very small compared to total sales)
Try always to keep your promises, but if you
cannot do that prefer your A-class customer’s
service level
JAP
5
6.
Typically scheduling is divided to:Rough planning - > Master Production Schedule MPS
(months and weeks of factory load and biddings)
and
Fine Scheduling -> weeks, days, and hours on
operation level including routing
-> Work orders start implementation and controlling
phase
JAP
6
7.
Rough planning – MPSWhat are the main objectives,
reasoning and steps of it?
JAP
7
8.
TASK 1:Estimating realistic
delivery times
Specially needed for sales –
for customer promises
JAP
8
9.
TASK 2:Ensuring the
resources needed
Specially needed to keep the
delivery time promises given to
customer
JAP
9
10.
TASK 3:Controlling /
managing the work
load
Specially needed for
production planning in order to
react to changes and at the
same time keep the customer
promises and the costs low or
at least reasonable
JAP
10
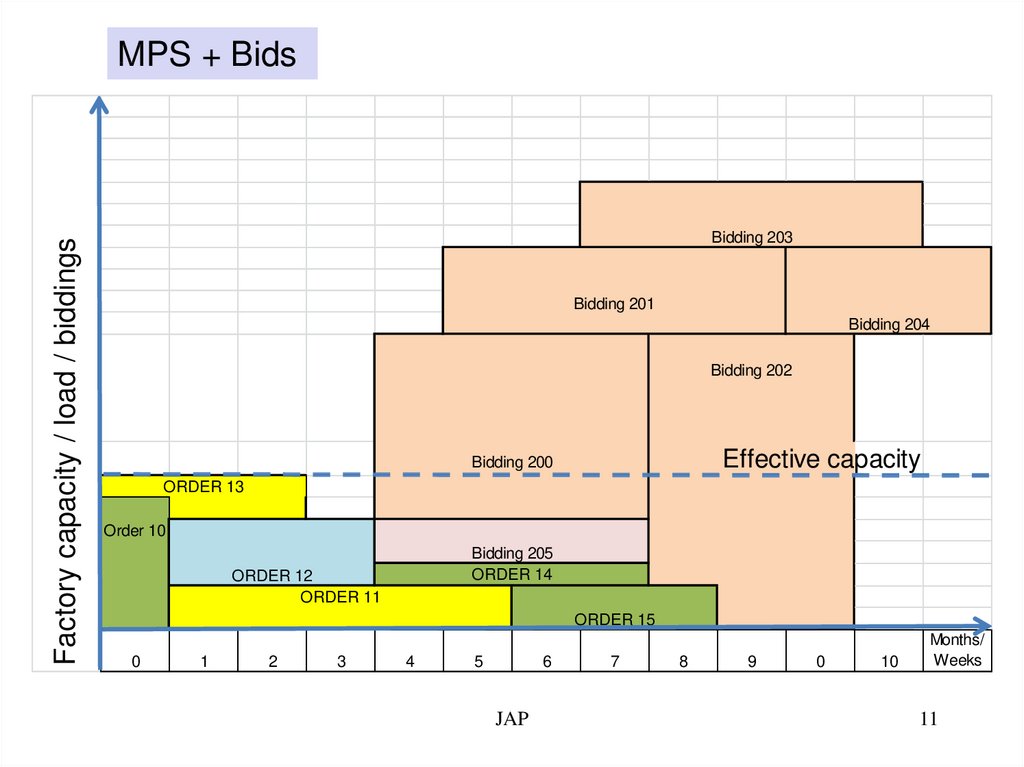
11.
Factory capacity / load / biddingsMPS + Bids
Bidding 203
Bidding 201
Bidding 204
Bidding 202
Effective capacity
Bidding 200
ORDER 13
Order 10
Bidding 205
ORDER 14
ORDER 12
ORDER 11
ORDER 15
0
1
2
3
4
5
6
JAP
7
8
9
0
10
Months/
Weeks
11
12.
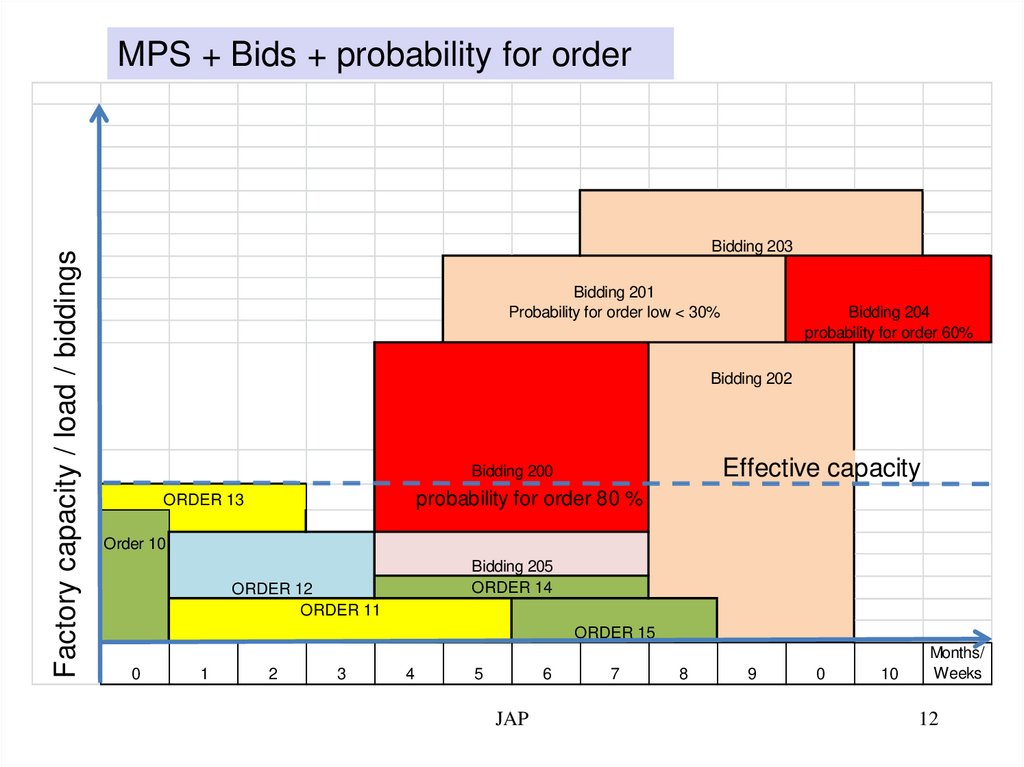
Factory capacity / load / biddingsMPS + Bids + probability for order
Bidding 203
Bidding 201
Probability for order low < 30%
Bidding 204
probability for order 60%
Bidding 202
Effective capacity
Bidding 200
probability for order 80 %
ORDER 13
Order 10
Bidding 205
ORDER 14
ORDER 12
ORDER 11
ORDER 15
0
1
2
3
4
6
5
JAP
7
8
9
0
10
Months/
Weeks
12
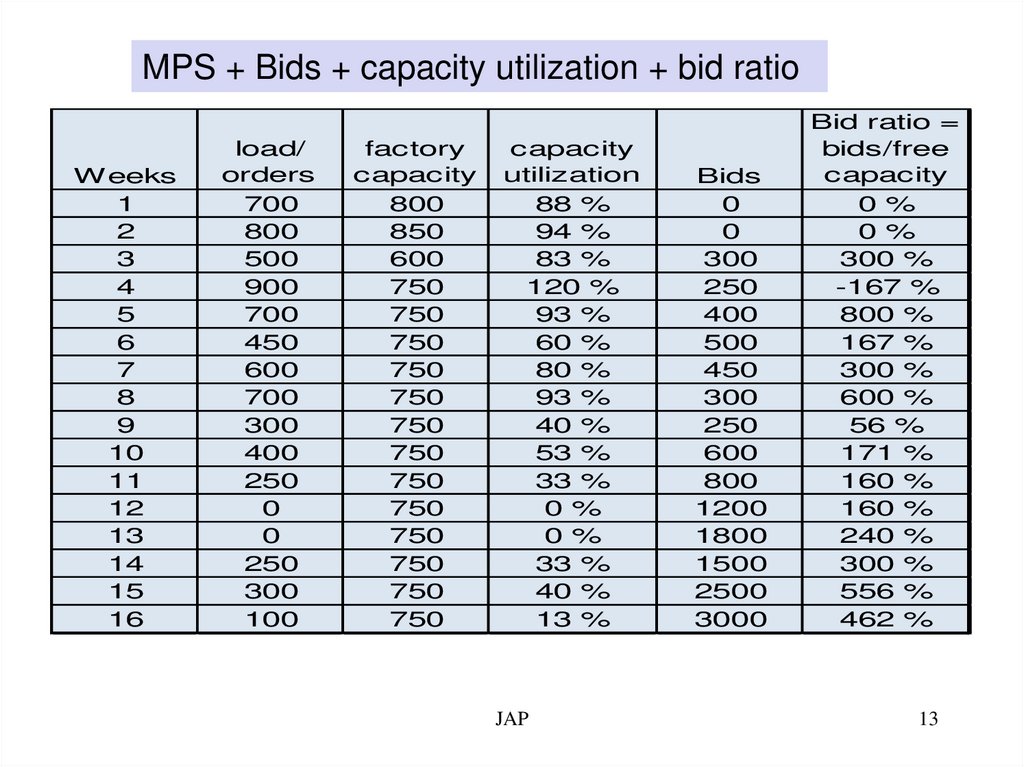
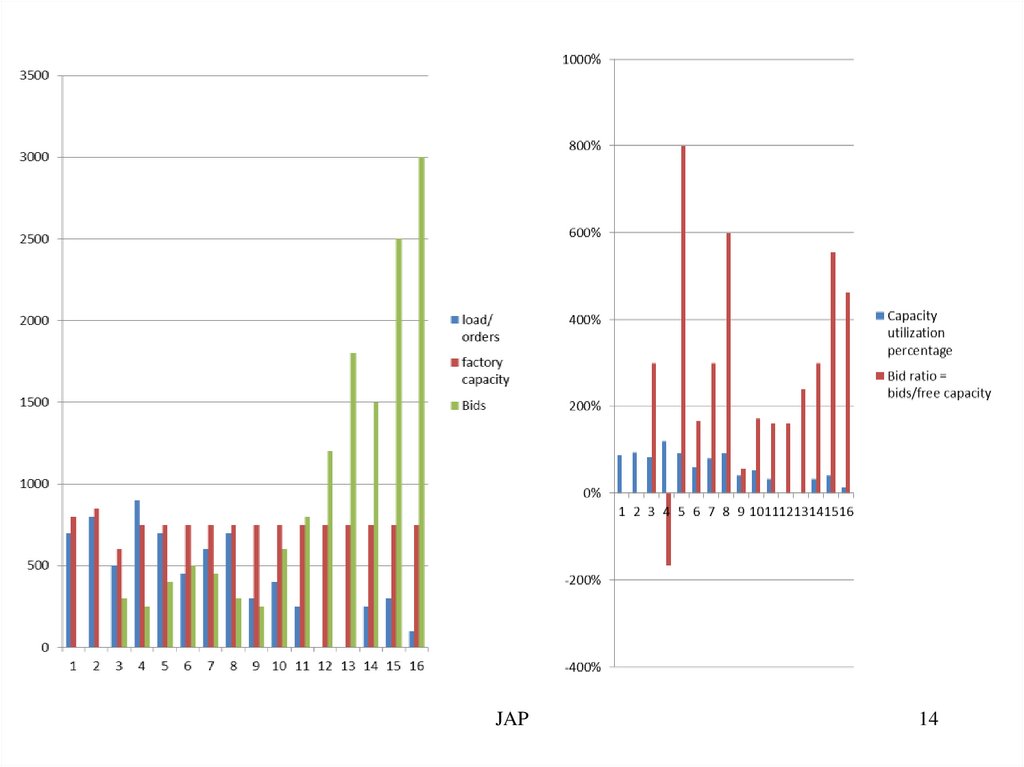
13.
MPS + Bids + capacity utilization + bid ratioWeeks
1
2
3
4
5
6
7
8
9
10
11
12
13
14
15
16
load/
orders
700
800
500
900
700
450
600
700
300
400
250
0
0
250
300
100
factory
capacity
800
850
600
750
750
750
750
750
750
750
750
750
750
750
750
750
capacity
utilization
88 %
94 %
83 %
120 %
93 %
60 %
80 %
93 %
40 %
53 %
33 %
0 %
0 %
33 %
40 %
13 %
JAP
Bids
0
0
300
250
400
500
450
300
250
600
800
1200
1800
1500
2500
3000
Bid ratio =
bids/free
capacity
0 %
0 %
300 %
-167 %
800 %
167 %
300 %
600 %
56 %
171 %
160 %
160 %
240 %
300 %
556 %
462 %
13
14.
JAP14
15.
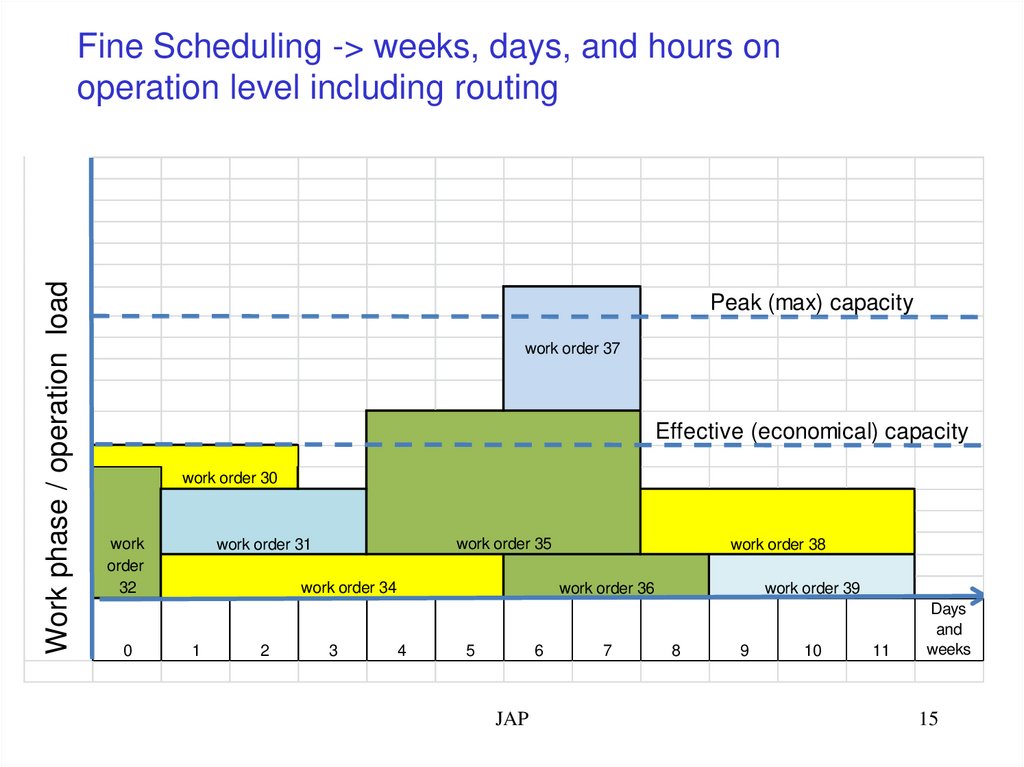
Work phase / operation loadFine Scheduling -> weeks, days, and hours on
operation level including routing
Peak (max) capacity
work order 37
Effective (economical) capacity
work order 30
work
order
32
0
work order 35
work order 31
work order 34
1
2
3
work order 38
work order 36
4
5
6
JAP
7
work order 39
8
9
10
11
Days
and
weeks
15
16.
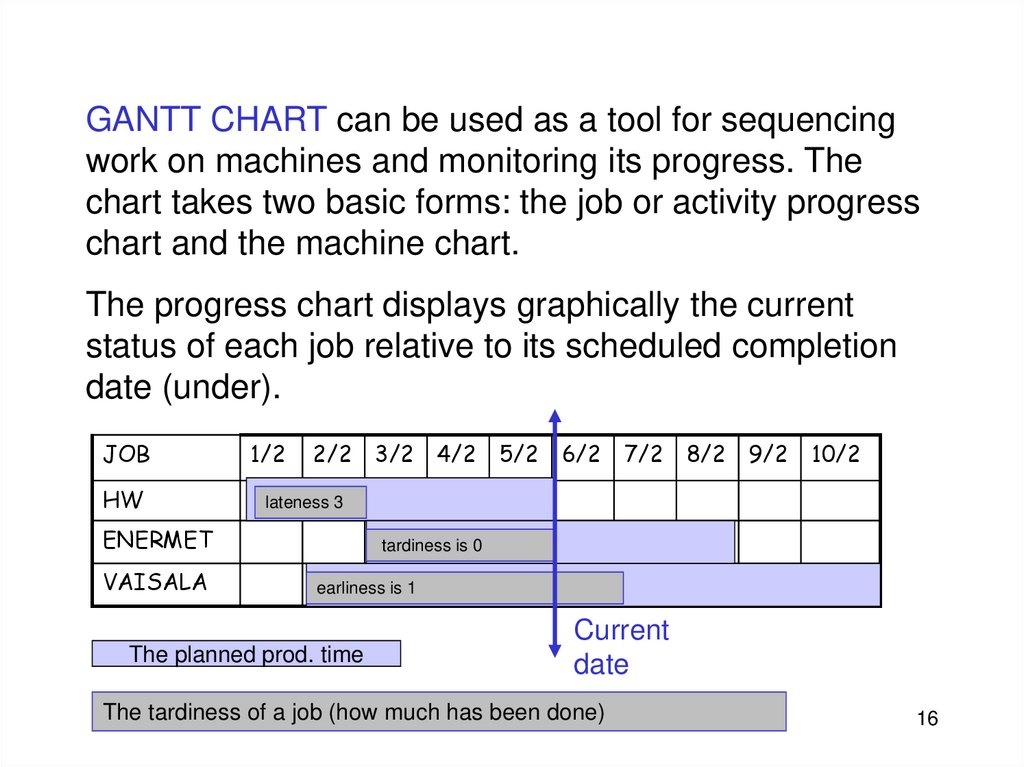
GANTT CHART can be used as a tool for sequencingwork on machines and monitoring its progress. The
chart takes two basic forms: the job or activity progress
chart and the machine chart.
The progress chart displays graphically the current
status of each job relative to its scheduled completion
date (under).
JOB
HW
1/2
2/2
4/2
5/2
6/2
7/2
8/2
9/2
10/2
lateness 3
ENERMET
VAISALA
3/2
tardiness is 0
earliness is 1
The planned prod. time
Current
date
The tardiness of a job (how much has been
JAP done)
16
17.
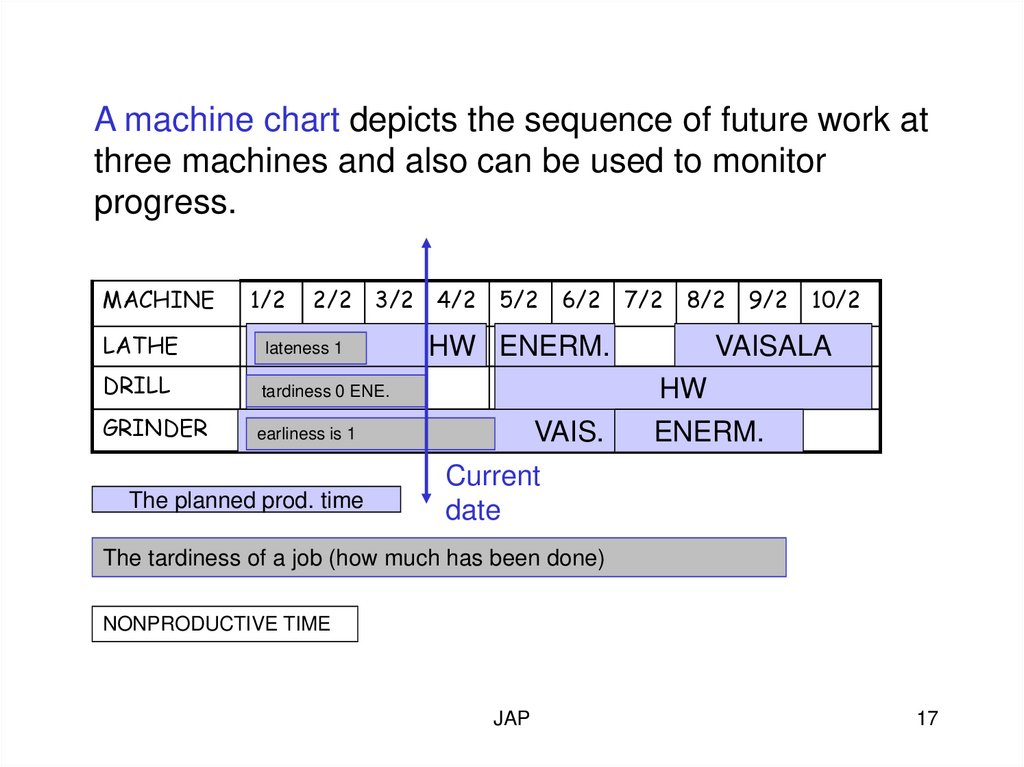
A machine chart depicts the sequence of future work atthree machines and also can be used to monitor
progress.
MACHINE
1/2
2/2
3/2
LATHE
lateness 1
DRILL
tardiness 0 ENE.
GRINDER
earliness is 1
The planned prod. time
4/2
5/2
6/2
HW ENERM.
VAIS.
7/2
8/2
9/2
10/2
VAISALA
HW
ENERM.
Current
date
The tardiness of a job (how much has been done)
NONPRODUCTIVE TIME
JAP
17
18.
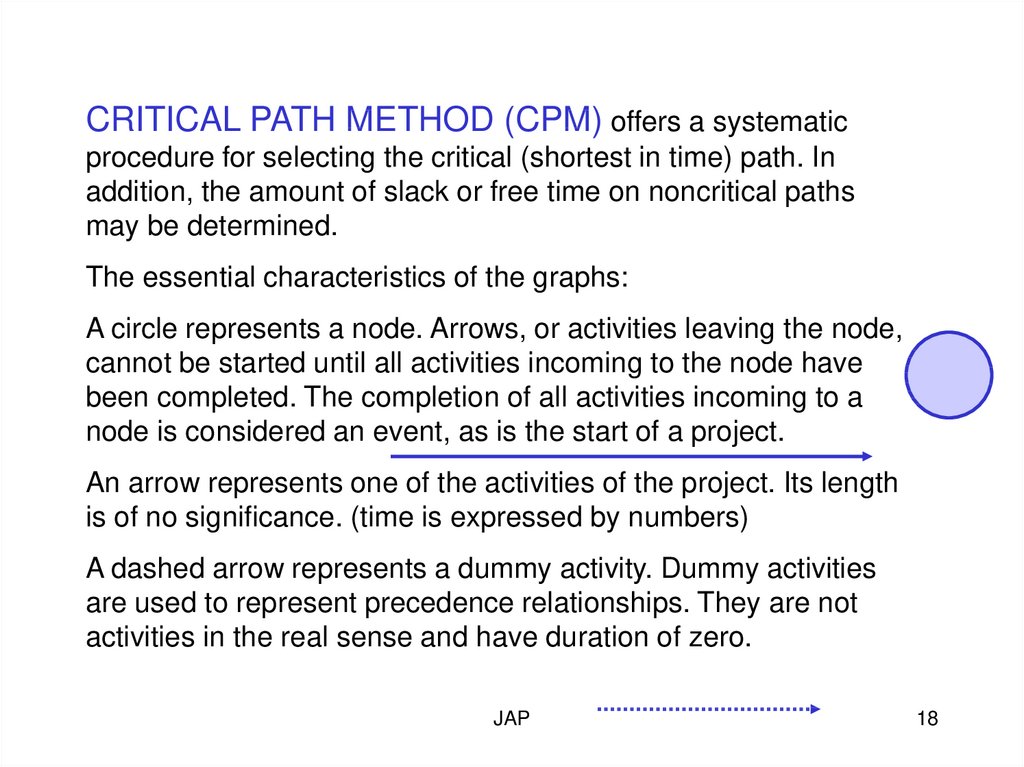
CRITICAL PATH METHOD (CPM) offers a systematicprocedure for selecting the critical (shortest in time) path. In
addition, the amount of slack or free time on noncritical paths
may be determined.
The essential characteristics of the graphs:
A circle represents a node. Arrows, or activities leaving the node,
cannot be started until all activities incoming to the node have
been completed. The completion of all activities incoming to a
node is considered an event, as is the start of a project.
An arrow represents one of the activities of the project. Its length
is of no significance. (time is expressed by numbers)
A dashed arrow represents a dummy activity. Dummy activities
are used to represent precedence relationships. They are not
activities in the real sense and have duration of zero.
JAP
18
19.
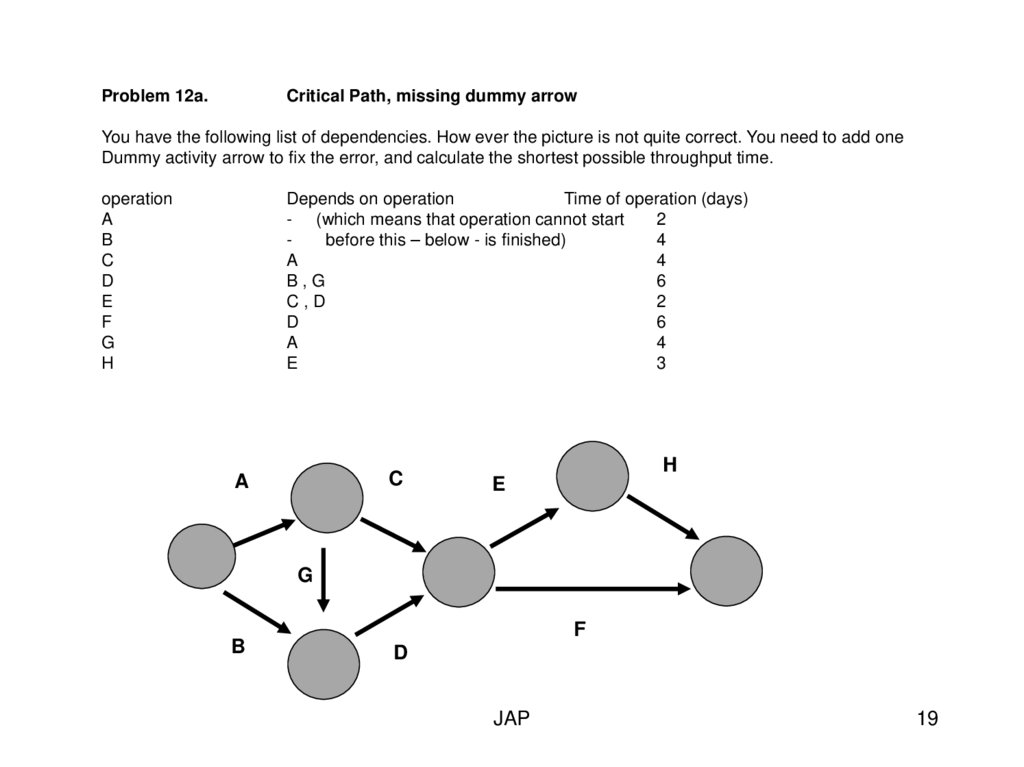
Problem 12a.Critical Path, missing dummy arrow
You have the following list of dependencies. How ever the picture is not quite correct. You need to add one
Dummy activity arrow to fix the error, and calculate the shortest possible throughput time.
operation
A
B
C
D
E
F
G
H
Depends on operation
Time of operation (days)
- (which means that operation cannot start
2
before this – below - is finished)
4
A
4
B,G
6
C,D
2
D
6
A
4
E
3
C
A
H
E
G
B
F
D
JAP
19
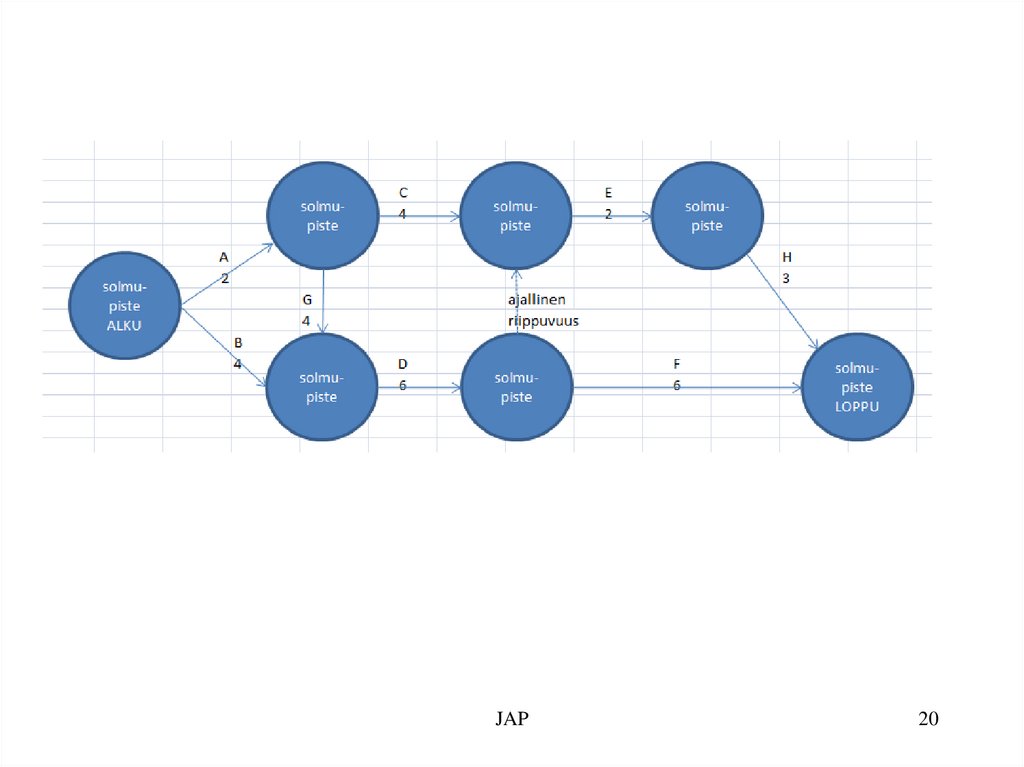
20.
JAP20
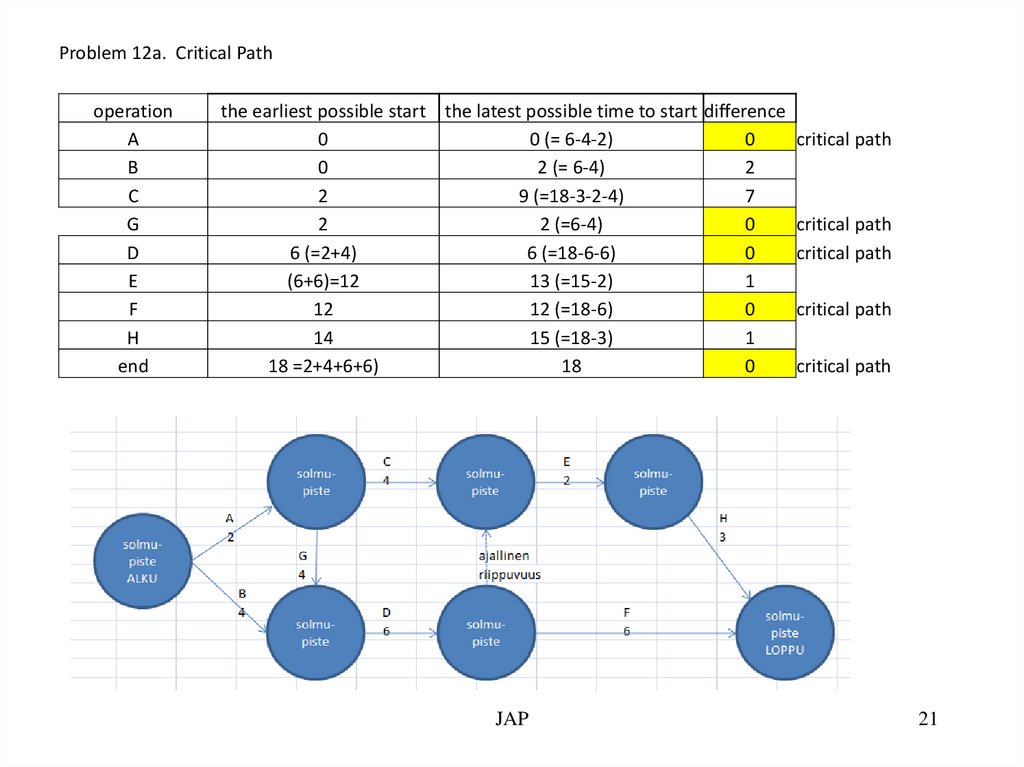
21.
Problem 12a. Critical Pathoperation
A
B
C
G
D
E
F
H
end
the earliest possible start the latest possible time to start difference
0
0 (= 6-4-2)
0
0
2 (= 6-4)
2
2
9 (=18-3-2-4)
7
2
2 (=6-4)
0
6 (=2+4)
6 (=18-6-6)
0
(6+6)=12
13 (=15-2)
1
12
12 (=18-6)
0
14
15 (=18-3)
1
18 =2+4+6+6)
18
0
JAP
critical path
critical path
critical path
critical path
critical path
21
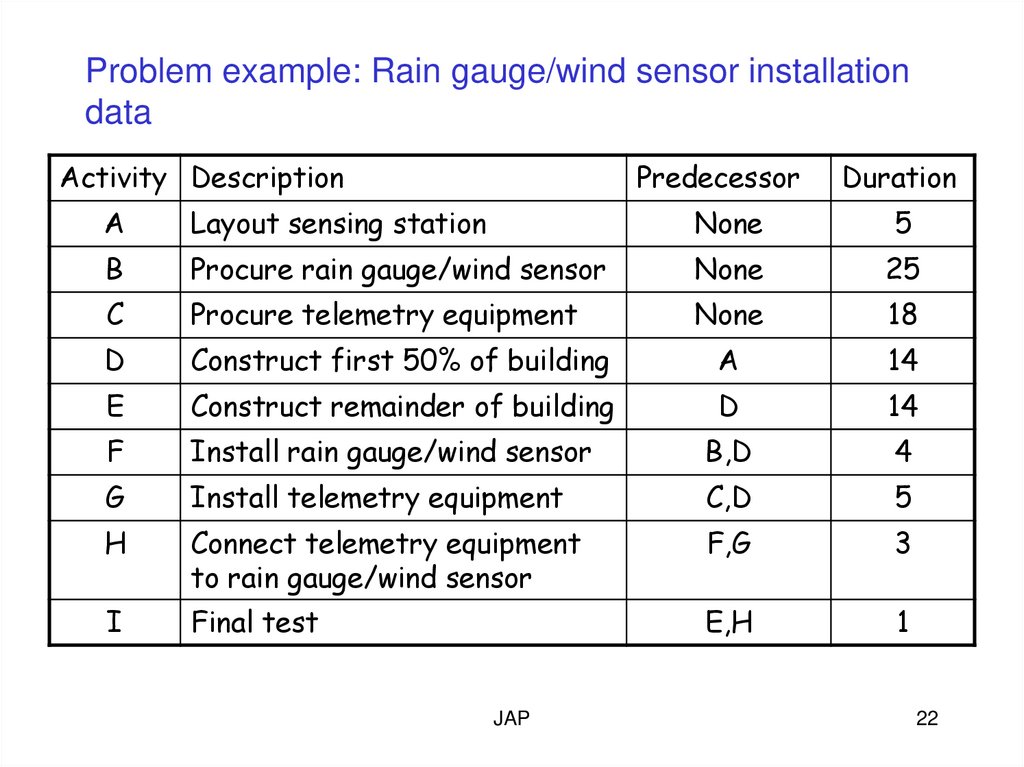
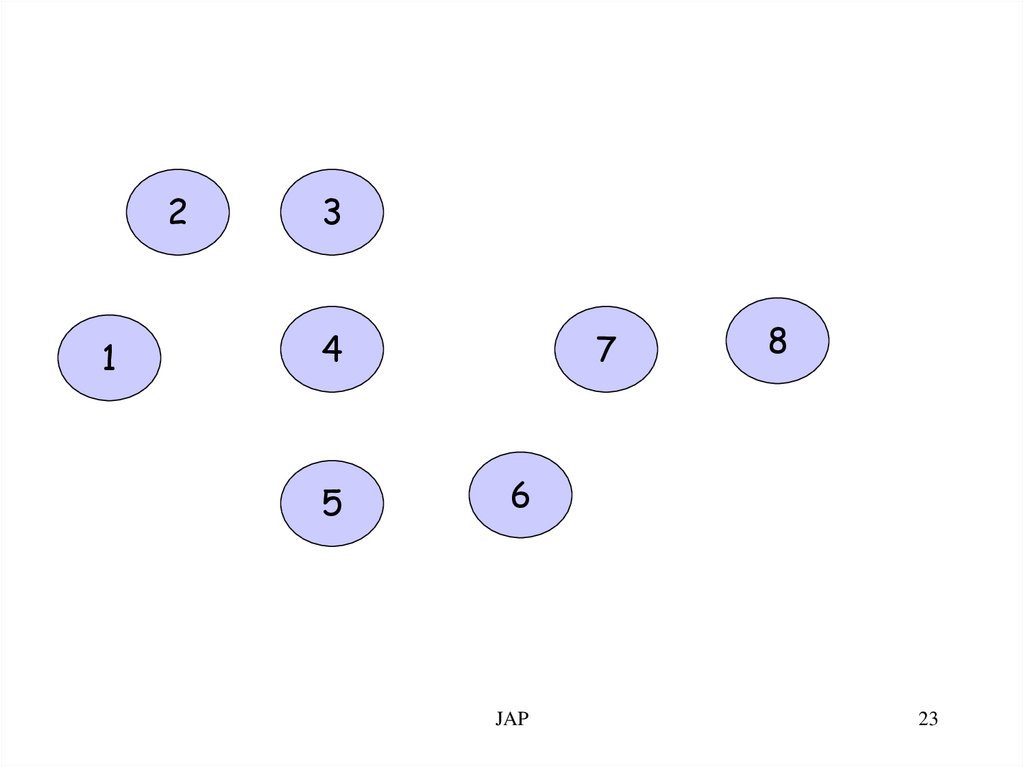
22.
Problem example: Rain gauge/wind sensor installationdata
Activity Description
Predecessor
Duration
A
Layout sensing station
None
5
B
Procure rain gauge/wind sensor
None
25
C
Procure telemetry equipment
None
18
D
Construct first 50% of building
A
14
E
Construct remainder of building
D
14
F
Install rain gauge/wind sensor
B,D
4
G
Install telemetry equipment
C,D
5
H
Connect telemetry equipment
to rain gauge/wind sensor
F,G
3
I
Final test
E,H
1
JAP
22
23.
21
3
4
5
7
8
6
JAP
23
24.
21
3
7
4
5
8
6
JAP
24
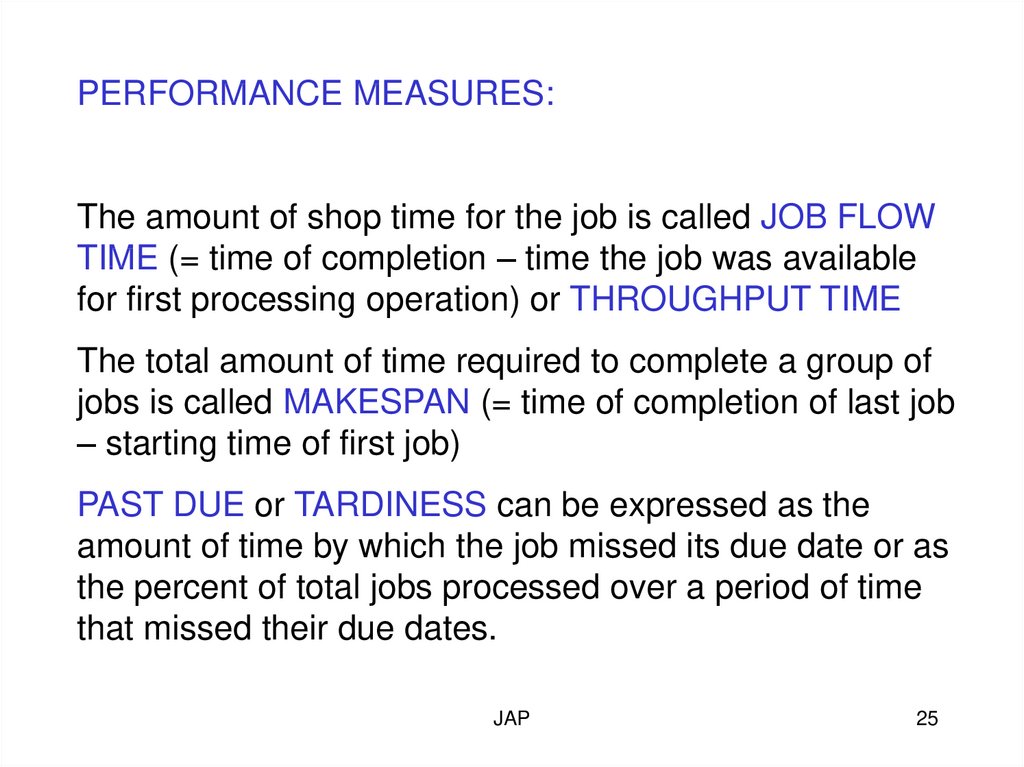
25.
PERFORMANCE MEASURES:The amount of shop time for the job is called JOB FLOW
TIME (= time of completion – time the job was available
for first processing operation) or THROUGHPUT TIME
The total amount of time required to complete a group of
jobs is called MAKESPAN (= time of completion of last job
– starting time of first job)
PAST DUE or TARDINESS can be expressed as the
amount of time by which the job missed its due date or as
the percent of total jobs processed over a period of time
that missed their due dates.
JAP
25
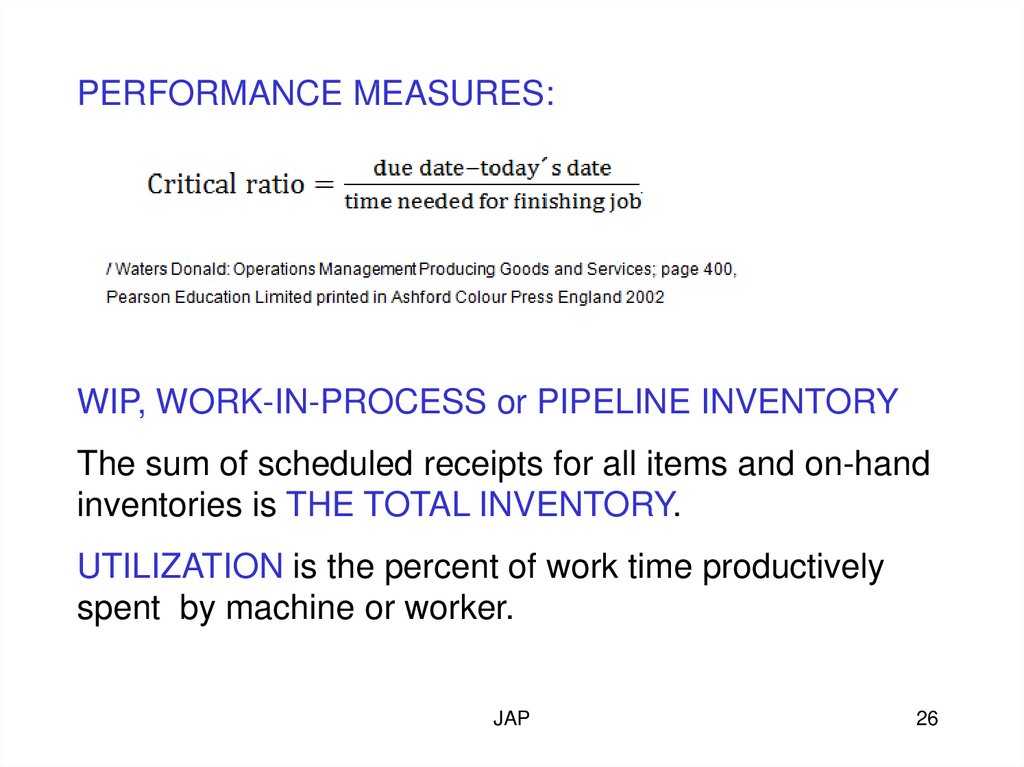
26.
PERFORMANCE MEASURES:WIP, WORK-IN-PROCESS or PIPELINE INVENTORY
The sum of scheduled receipts for all items and on-hand
inventories is THE TOTAL INVENTORY.
UTILIZATION is the percent of work time productively
spent by machine or worker.
JAP
26
27.
Problem of Economic batch quantity?If you consider a factory that needs to produce an output of 1000
units per year, you might think that this could be achieved by
producing one batch of l 000, two batches of 500, five batches of
200, and so on, the quantity in the batch defining the frequency
with which a batch of products needs to be produced. The number
of batches made and the quantities in the batch will have
implications for the company in terms of storage requirements,
both in-progress and in the store area. It will also have
implications for the amount of control required over the particular
work areas, suppliers and subcontractors, and for the costs
involved. A method that is used to optimise these parameters is
called economic batch quantity (EBQ).
JAP
27
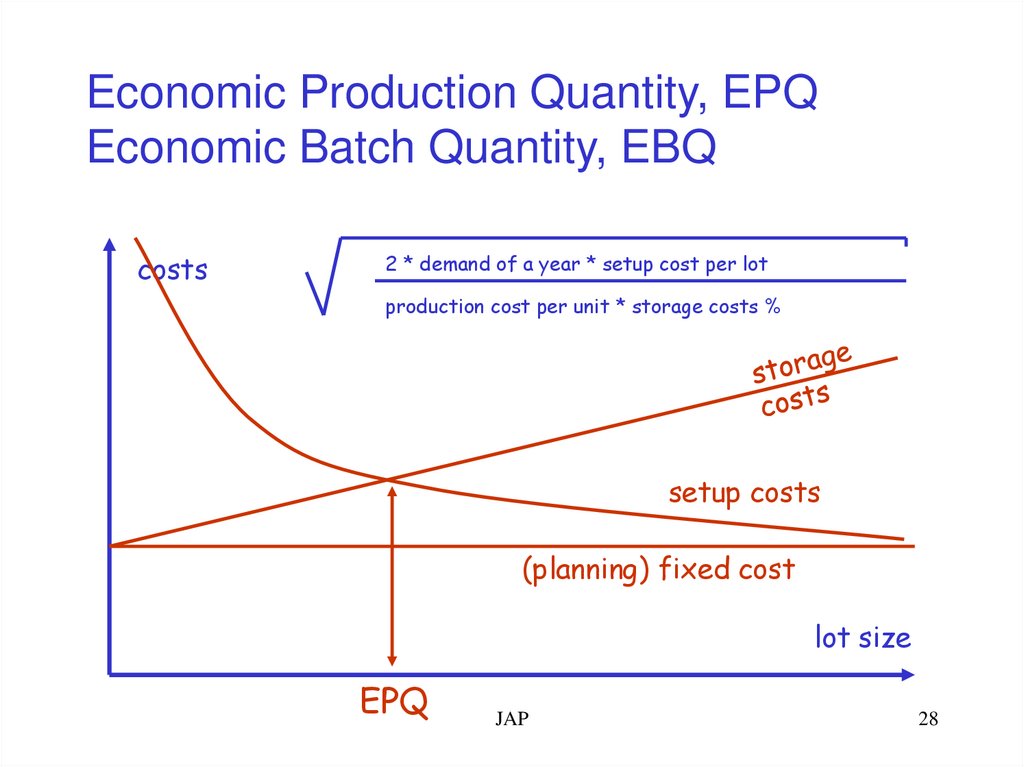
28.
Economic Production Quantity, EPQEconomic Batch Quantity, EBQ
costs
2 * demand of a year * setup cost per lot
production cost per unit * storage costs %
setup costs
(planning) fixed cost
lot size
EPQ
JAP
28
29.
The costs associated with batch production can be categorized asdirect and ancillary. Direct costs are those that are associated
directly with the production of the product and would include parts
costs and process costs. The ancillary costs are those that exist
independently of the numbers of product. These will include the
costs of equipment maintenance and set-up costs for internally
supplied goods, and the purchasing costs for those goods
provided by external suppliers. It is usual to divide the ancillary
costs for a batch evenly over the number in the batch.
Consequently, because of the stability of the ancillary cost the
proportion allocated to each product is lower, the larger the
number of products in a batch. However, the problem of producing
goods in large batches is that they require you to have a large
stockholding, the cost of which increases with the number of units
in the batch.
JAP
29
30.
The use of the EBQ method is designed to analyse these problemsand provide an optimum solution. The EBQ can be shown graphically
and it can be calculated according to the formula:
EBQ = SQR(2SD/IC)
S= ancillary (set up) cost per batch
D = annual usage (units)
I= annual holding cost as a fraction of the stock value
C= unit cost of the item
The main advantage of using the EBQ is that it gives a value which is optimized for a
certain data set. There are, however, a number of problems associated with its use that
have to be considered. The main problems relate to the assumptions that have to be
made, i.e. that unit price and ancillary cost remain constant throughout the year. There
is also the problem that the ancillary costs, and more particularly the stockholding costs
per batch, can be very difficult to assess. Finally, the EBQ will not often produce a
number that is consistent with supply systems.
JAP
30
31.
EXAMPLE of EPQ / EBQA company makes telephone booths, for a stable
market where the demand is 450 units per month.
The booths are made in batches, with all the units in
each batch being completed at the same time. Given
the following information, calculate the economic
batch quantity: Machine set-up cost per batch 150 €,
Stockholding cost = 10% of stock value per annum,
Unit cost = 37.50 €
EPQ = EBQ = SQR((2 * 450 * 150)/(10% * 37,50)) =
JAP
31
32.
Problem 28.ECONOMIC BATCH SIZE / REPETITIVE
ORDER QUANTITIES
Replacement parts are supplied from an inventory by a
manufacturer of industrial tools. For a particular part, the annual
demand is expected to be 750 units. Machine setup costs are
$50, carrying costs are 25 % per year, and the part is valued in
inventory at $35 each.
a) What is the economic order quantity placed on production?
b) What is the ROP (reorder point quantity) if it takes 1,5 weeks to
set up production and make the parts ?
c) The production rate for these parts is 50 units per week. What
is the production run quantity?
JAP
32
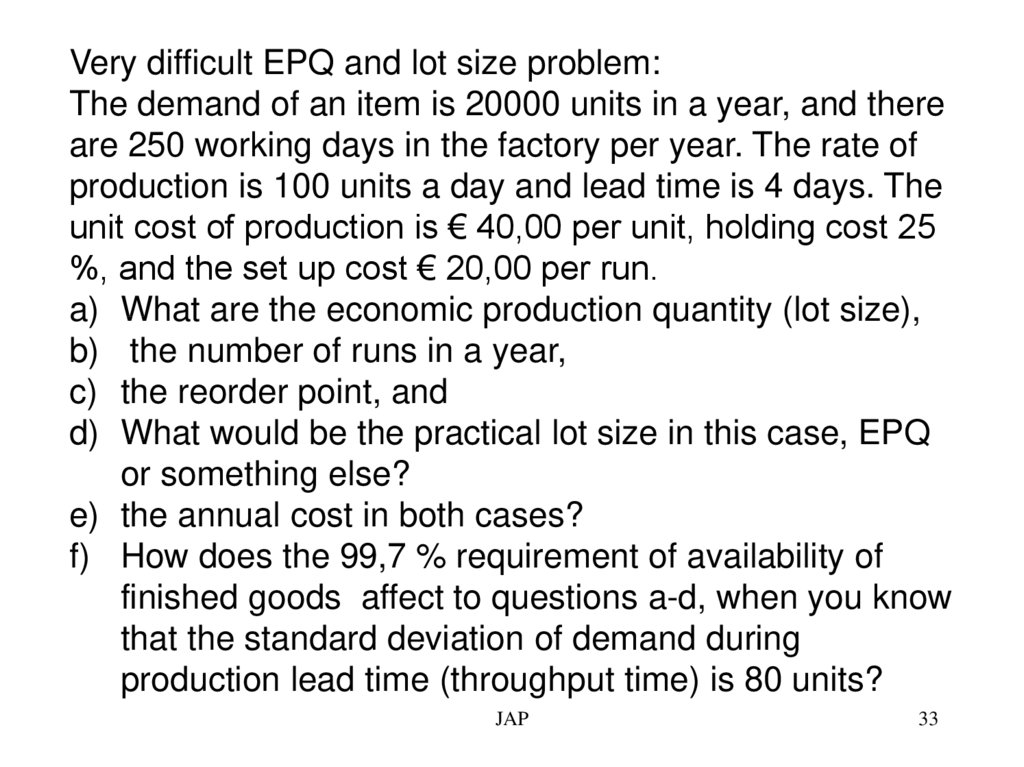
33.
Very difficult EPQ and lot size problem:The demand of an item is 20000 units in a year, and there
are 250 working days in the factory per year. The rate of
production is 100 units a day and lead time is 4 days. The
unit cost of production is € 40,00 per unit, holding cost 25
%, and the set up cost € 20,00 per run.
a) What are the economic production quantity (lot size),
b) the number of runs in a year,
c) the reorder point, and
d) What would be the practical lot size in this case, EPQ
or something else?
e) the annual cost in both cases?
f) How does the 99,7 % requirement of availability of
finished goods affect to questions a-d, when you know
that the standard deviation of demand during
production lead time (throughput time) is 80 units?
JAP
33
34.
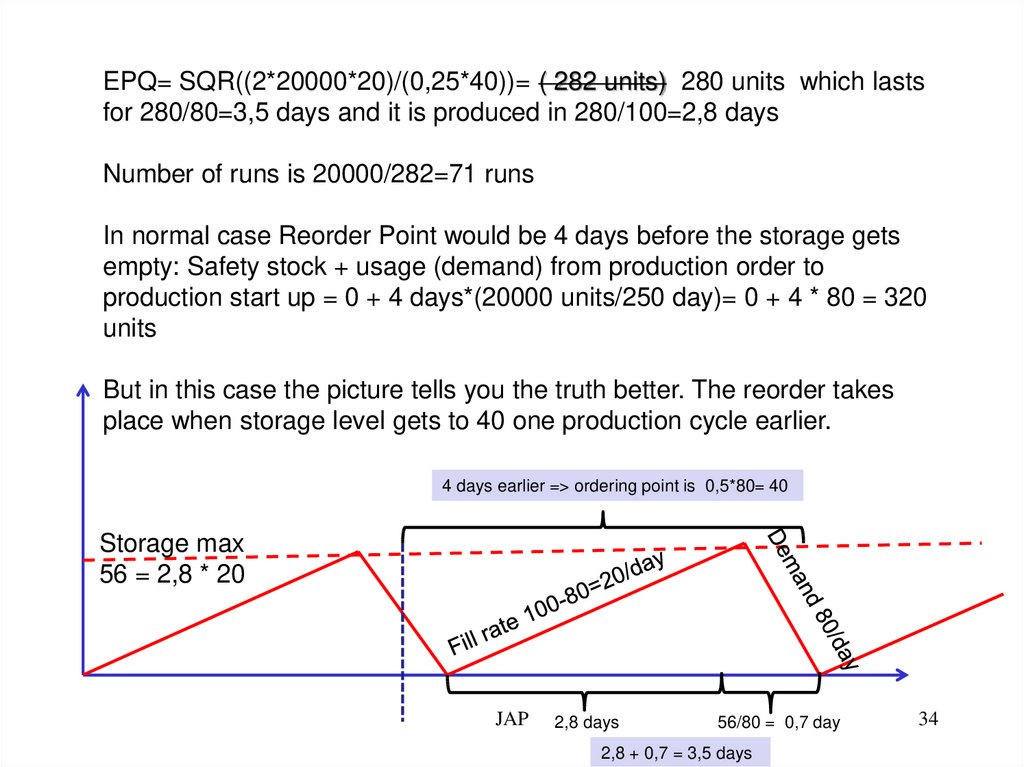
EPQ= SQR((2*20000*20)/(0,25*40))= ( 282 units) 280 units which lastsfor 280/80=3,5 days and it is produced in 280/100=2,8 days
Number of runs is 20000/282=71 runs
In normal case Reorder Point would be 4 days before the storage gets
empty: Safety stock + usage (demand) from production order to
production start up = 0 + 4 days*(20000 units/250 day)= 0 + 4 * 80 = 320
units
But in this case the picture tells you the truth better. The reorder takes
place when storage level gets to 40 one production cycle earlier.
4 days earlier => ordering point is 0,5*80= 40
Storage max
56 = 2,8 * 20
JAP
2,8 days
56/80 = 0,7 day
2,8 + 0,7 = 3,5 days
34
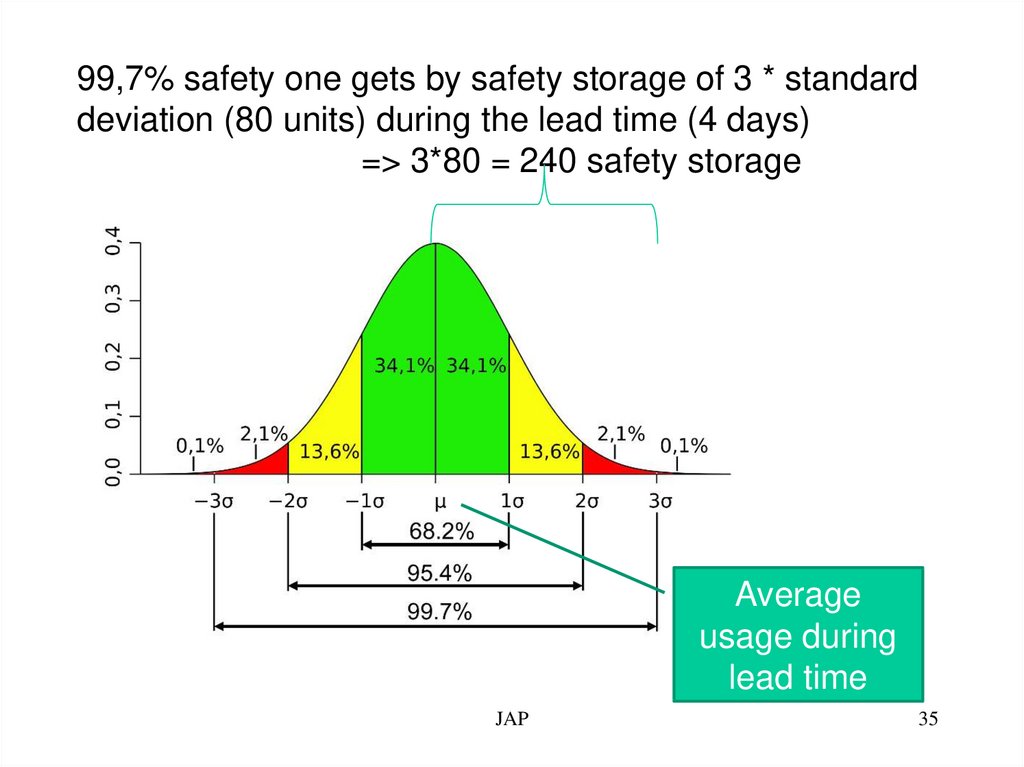
35.
99,7% safety one gets by safety storage of 3 * standarddeviation (80 units) during the lead time (4 days)
=> 3*80 = 240 safety storage
Average
usage during
lead time
JAP
35
36.
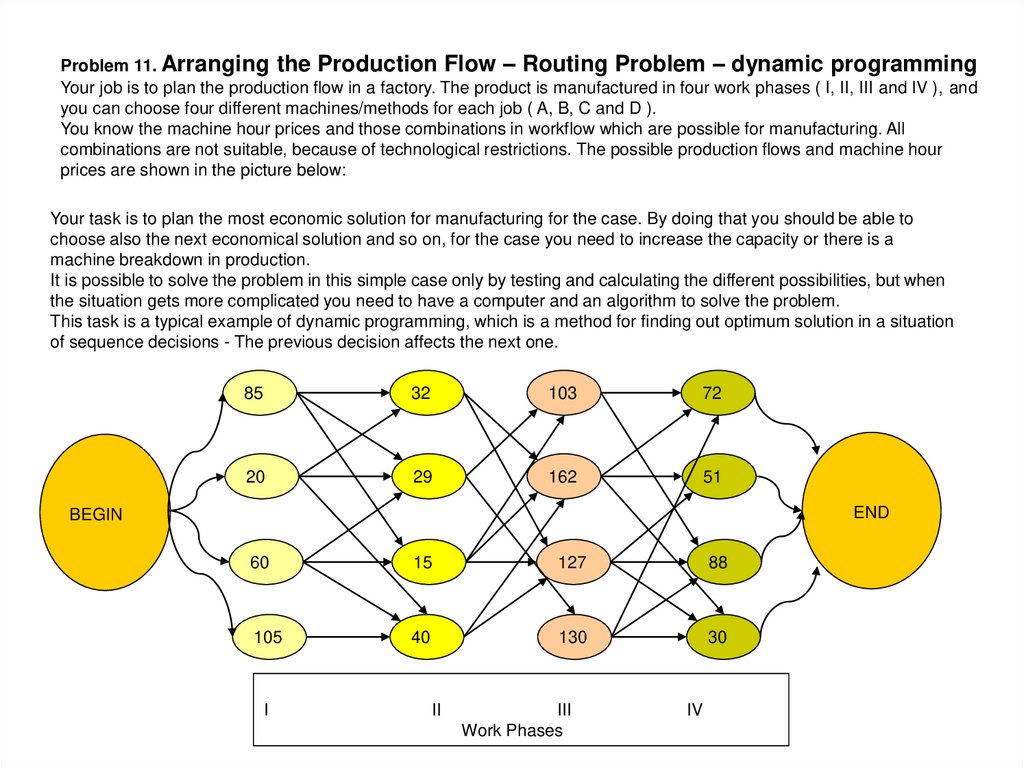
Problem 11. Arranging the Production Flow – Routing Problem – dynamic programmingYour job is to plan the production flow in a factory. The product is manufactured in four work phases ( I, II, III and IV ), and
you can choose four different machines/methods for each job ( A, B, C and D ).
You know the machine hour prices and those combinations in workflow which are possible for manufacturing. All
combinations are not suitable, because of technological restrictions. The possible production flows and machine hour
prices are shown in the picture below:
Your task is to plan the most economic solution for manufacturing for the case. By doing that you should be able to
choose also the next economical solution and so on, for the case you need to increase the capacity or there is a
machine breakdown in production.
It is possible to solve the problem in this simple case only by testing and calculating the different possibilities, but when
the situation gets more complicated you need to have a computer and an algorithm to solve the problem.
This task is a typical example of dynamic programming, which is a method for finding out optimum solution in a situation
of sequence decisions - The previous decision affects the next one.
85
32
103
72
20
29
162
51
END
BEGIN
60
15
127
88
105
40
130
30
I
II
III
Work Phases
IV
37.
The idea behind dynamic programming is that to solve a given problem, we needto solve different parts of the problem (subproblems), then combine the solutions
of the subproblems to reach an overall solution. Often when using a more naive
method, many of the subproblems are generated and solved many times. The
dynamic programming approach seeks to solve each subproblem only once,
thus reducing the number of computations: once the solution to a given
subproblem has been computed, it is stored: the next time the same solution is
needed, it is simply looked up. This approach is especially useful when the
number of repeating subproblems grows exponentially as a function of the size
of the input.
Dynamic programming algorithms are used for optimization (for example, finding
the shortest path between two points, or the fastest way to multiply many
matrices). A dynamic programming algorithm will examine all possible ways to
solve the problem and will pick the best solution. Therefore, we can roughly think
of dynamic programming as an intelligent, brute-force method that enables us to
go through all possible solutions to pick the best one. If the scope of the problem
is such that going through all possible solutions is possible and fast enough,
dynamic programming guarantees finding the optimal solution
JAP
37