


")


 Математика
Похожие презентации:


. Week 8")


Linear Regression. Regression model evaluation metrics. Lecture 5
1. Lecture5. Linear Regression. Regression model evaluation metrics
2.
3. Linear Regression with Multiple Variables
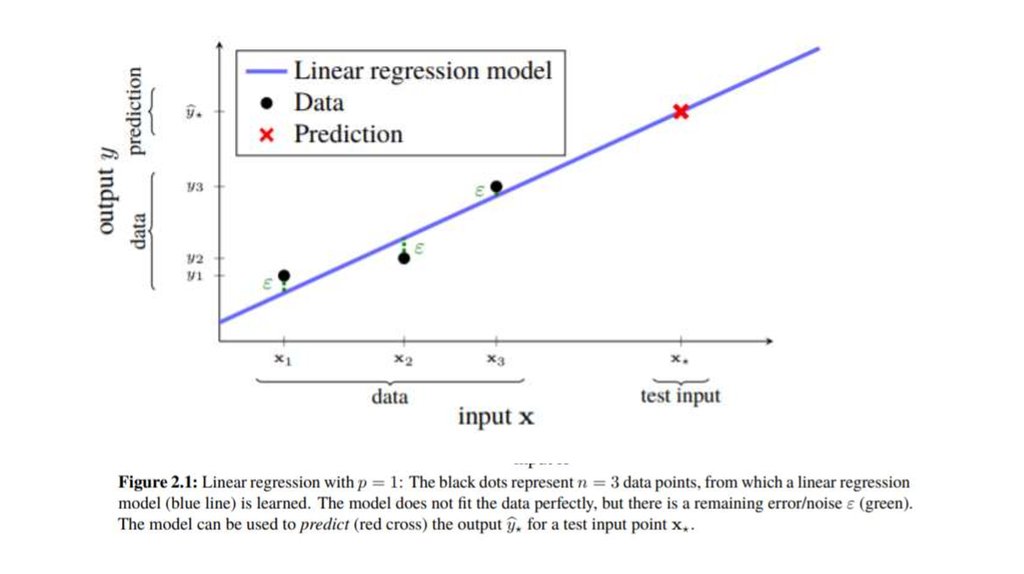
• The linear regression model describes the output variable y (a scalar) as an affinecombination of the input variables x1, x2, . . . , xp (each a scalar) plus a noise term
ε,
(1)
• We refer to the coefficients β0, β1, . . . βp as the parameters in the model, and
we sometimes refer to β0 specifically as the intercept term. The noise term ε
accounts for non-systematic, i.e., random, errors between the data and the
model. The noise is assumed to have mean zero and to be independent of x.
Machine learning is about training, or learning, models from data.
• Regression to predict future outputs for inputs that we have not yet seen.
4. Predicting future outputs — machine learning
• In machine learning, the emphasis is rather on predicting some (not yetseen) output y*? for some new input x* = [x*1 x*2 . . . x*p ] T. To make a
prediction for a test input x* , we insert it into the model (1). Since ε (by
assumption) has mean value zero, we take the prediction as
• We use the symbol ^ on y * to indicate that it is a prediction, our best
guess. If we were able to somehow observe the actual output from x *, we
would denote it by y * (without a hat).
5.
6.
• https://www.coursera.org/lecture/machine-learning/multiplefeatures-6Nj1q• https://www.youtube.com/watch?v=zITIFTsivN8
7. Deciding an Evaluation Metric for a Regression Model
• Evaluating the model accuracy is an essential part of the process increating machine learning models to describe how well the model is
performing in its predictions. Evaluation metrics change according to
the problem type.
• The errors represent how much the model is making mistakes in its
prediction. The basic concept of accuracy evaluation is to compare
the original target with the predicted one according to certain
metrics.
8. Rule of evaluation metrics (loss value)
• A Smaller Loss ValueIf the total difference between the predicted values and the actual
ones is relatively small, the total error/loss will be smaller value and
thus, signify a good model.
• A Larger Loss Value
If the difference between the actual and predicted values is large, the
total error/value of loss function will be relatively larger as well to
imply that the model is not trained well.
9. Loss Function
LossFunction
• The Goal of Training
a Regression Model
The goal of training a
Regression Model is
to find those values
of weights against
which loss function
can be minimized i. e
difference between
the predicted values
and the true labels is
minimized as much
as possible.
10. R-squared
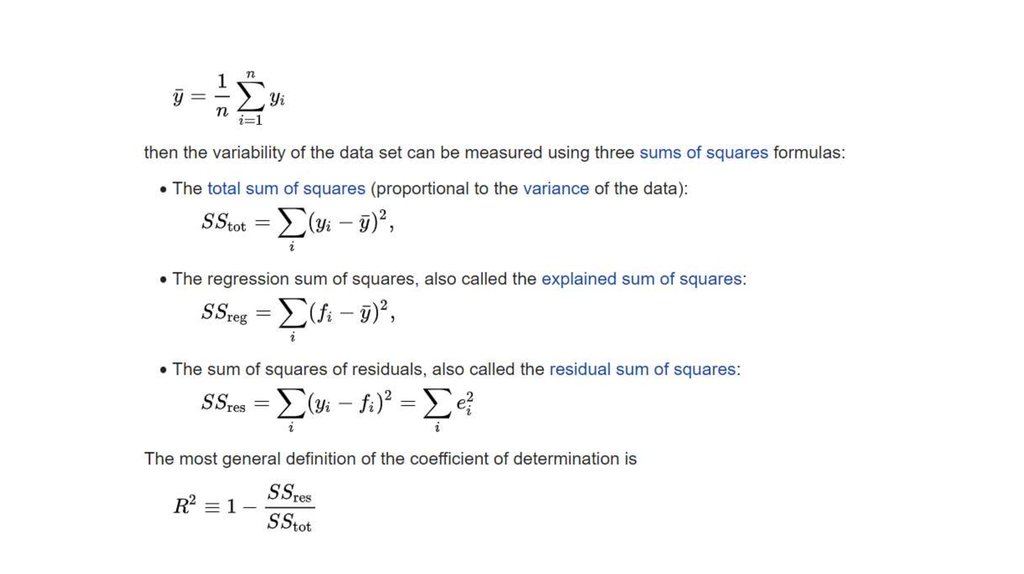
• R-squared is a statistical measure of how close the data are to the fittedregression line. It is also known as the coefficient of determination, or the
coefficient of multiple determination for multiple regression.
• The definition of R-squared is fairly straight-forward; it is the percentage of the
response variable variation that is explained by a linear model. Or:
• R-squared = Explained variation / Total variation
• R-squared is always between 0 and 100%:
• 0% indicates that the model explains none of the variability of the response data
around its mean.
• 100% indicates that the model explains all the variability of the response data
around its mean.
• In general, the higher the R-squared, the better the model fits your data.
11.
12.
• The regression model on the left accounts for 38.0% of the variancewhile the one on the right accounts for 87.4%. The more variance that
is accounted for by the regression model the closer the data points
will fall to the fitted regression line. Theoretically, if a model could
explain 100% of the variance, the fitted values would always equal
the observed values and, therefore, all the data points would fall on
the fitted regression line.