 Английский язык
Похожие презентации:


A short report giving key information about charts, maps or diagrams
1.
IELTS WRITING TASK 1A SHORT REPORT GIVING KEY
INFORMATION ABOUT CHARTS,
MAPS OR DIAGRAMS
2.
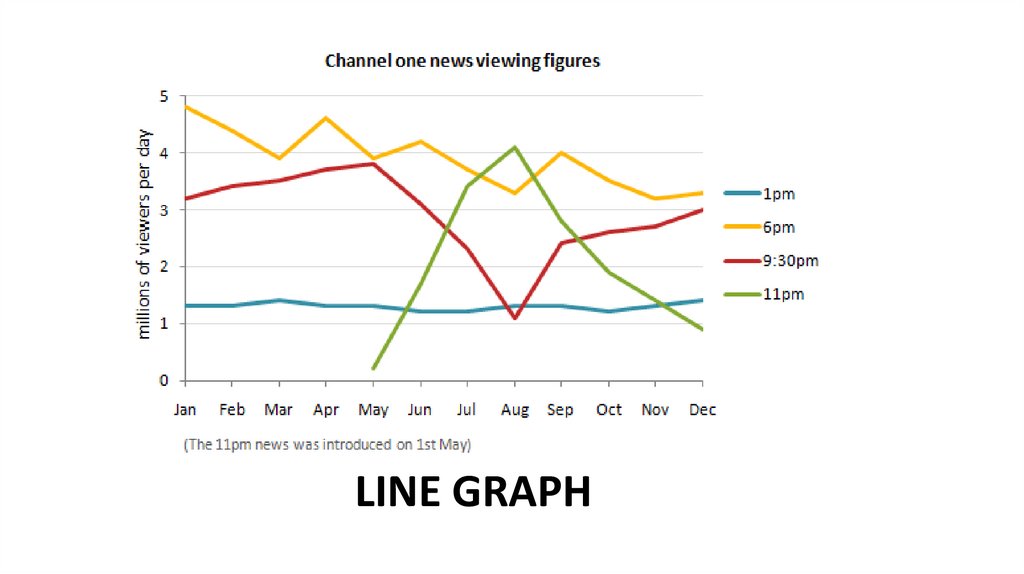
LINE GRAPH3.
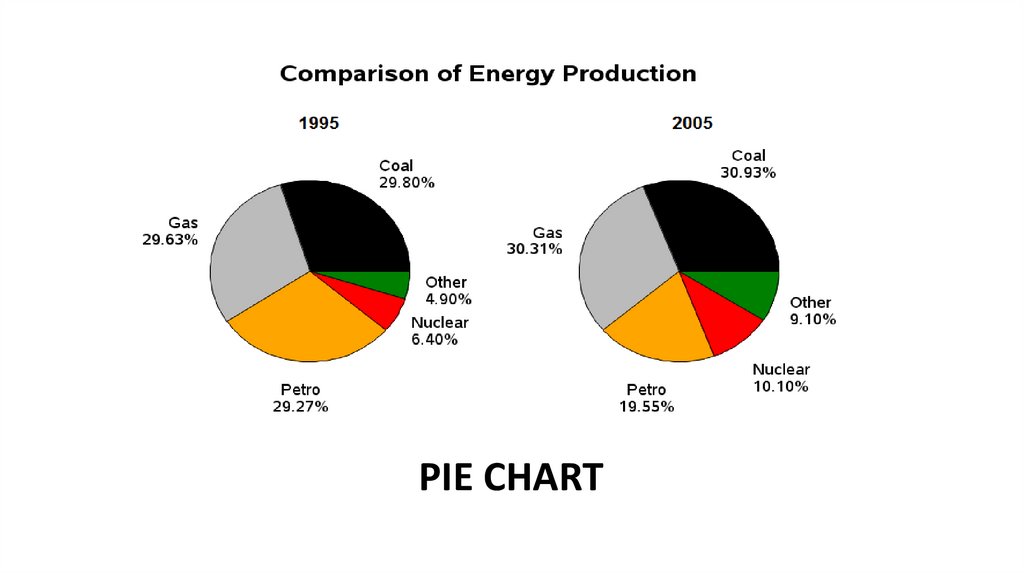
PIE CHART4.
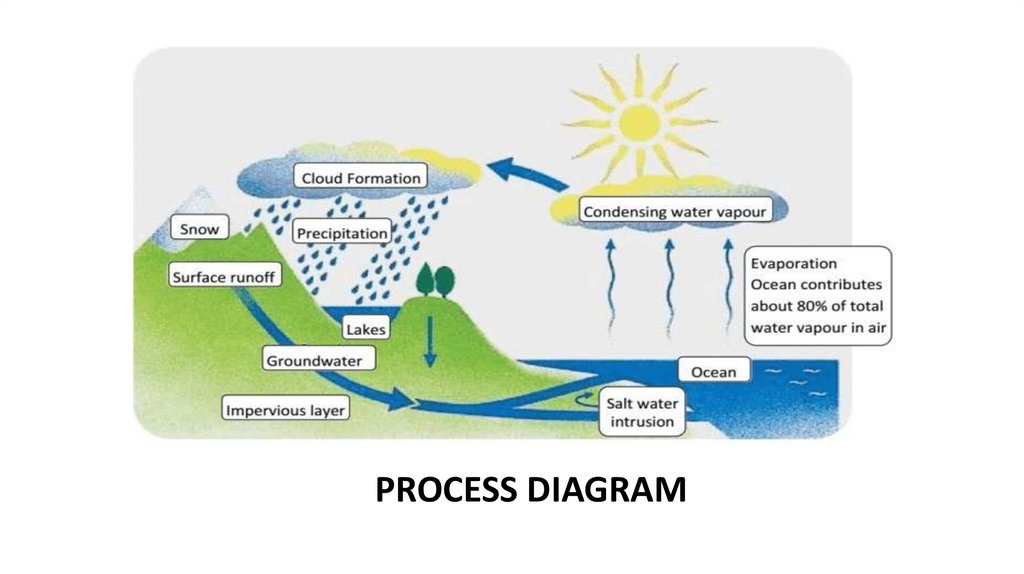
PROCESS DIAGRAM5.
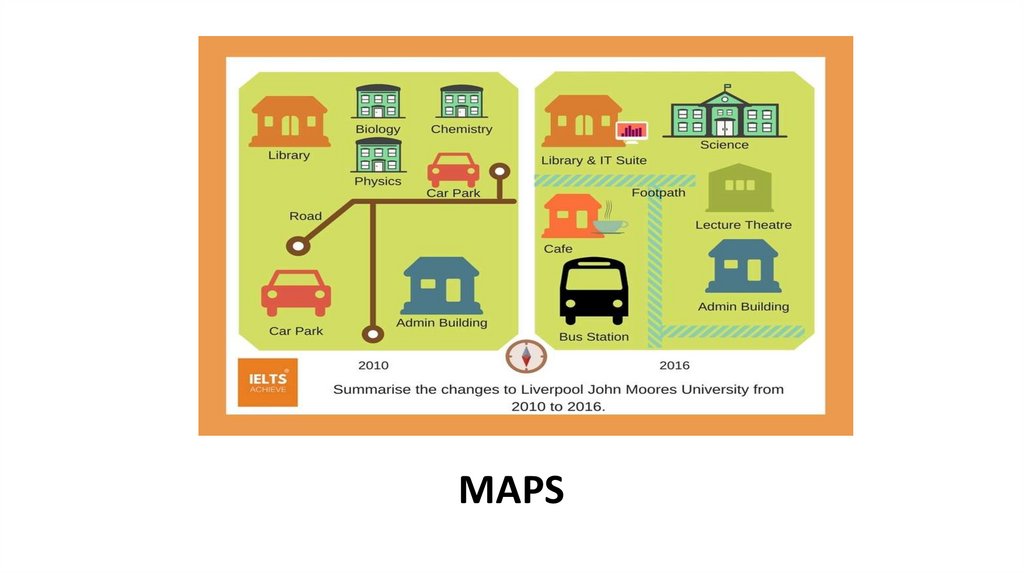
MAPS6.
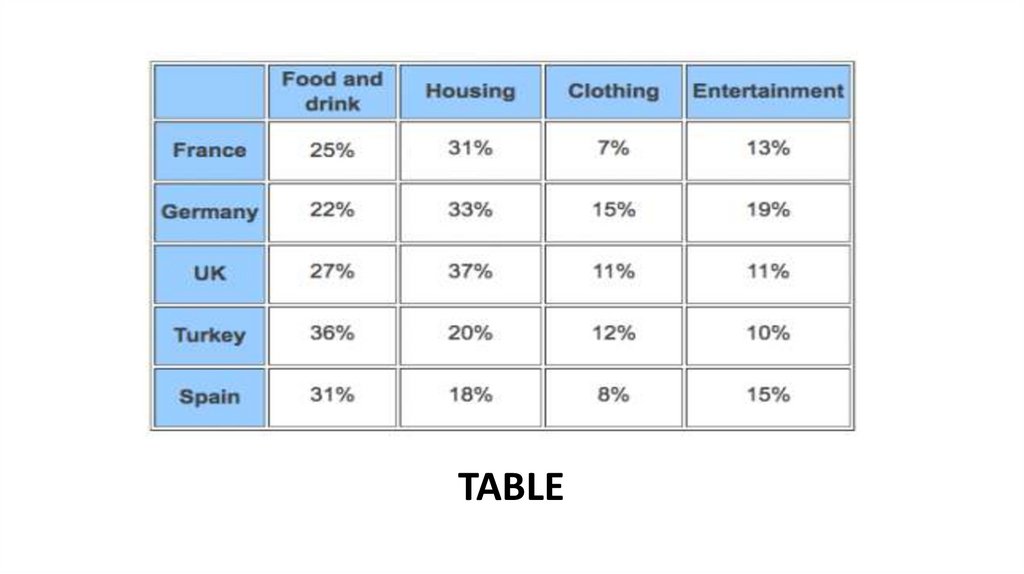
TABLE7.
YOU SHOULD:WRITE MORE THAN 150 WORDS
SPEND 20 MINUTES
1/3 OF YOUR MARKS
DESCRIBE VISUAL INFORMATION
8.
HOW AM I GOING TO BE SCORED?TASK
ACHIEVEMENT
HOW WELL YOU ANSWERED THE QUESTION
1.To give full detailed answer
2.Include an overview
3.Highlight the key features
4.Report must be accurate and all facts correct
5.150 + words
9.
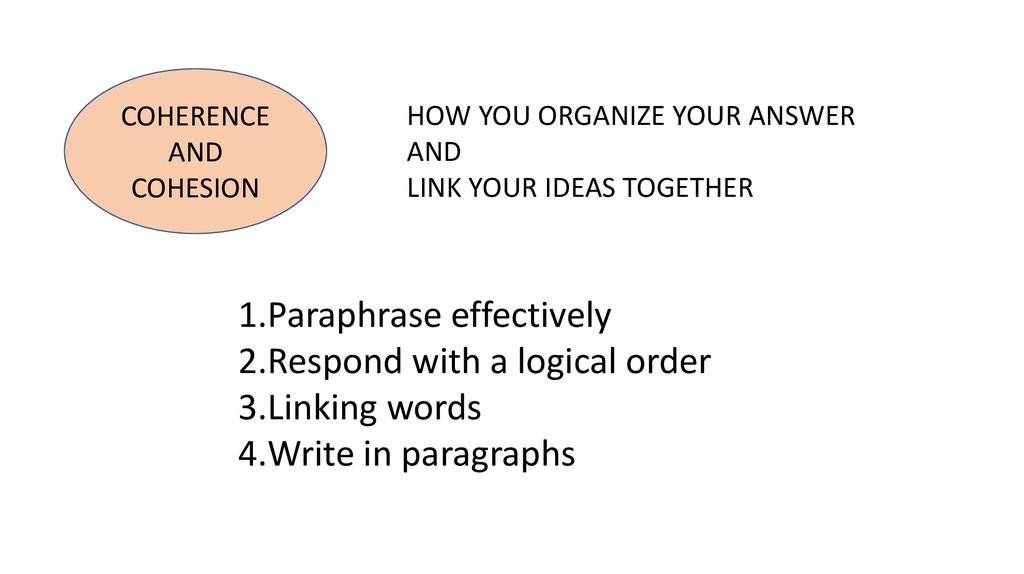
COHERENCEAND
COHESION
HOW YOU ORGANIZE YOUR ANSWER
AND
LINK YOUR IDEAS TOGETHER
1.Paraphrase effectively
2.Respond with a logical order
3.Linking words
4.Write in paragraphs
10.
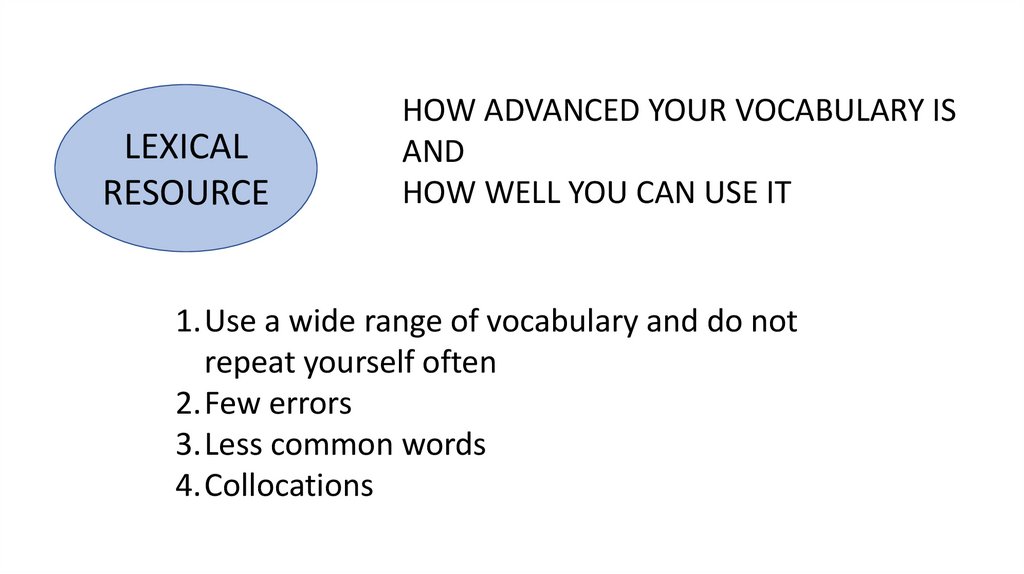
LEXICALRESOURCE
HOW ADVANCED YOUR VOCABULARY IS
AND
HOW WELL YOU CAN USE IT
1.Use a wide range of vocabulary and do not
repeat yourself often
2.Few errors
3.Less common words
4.Collocations
11.
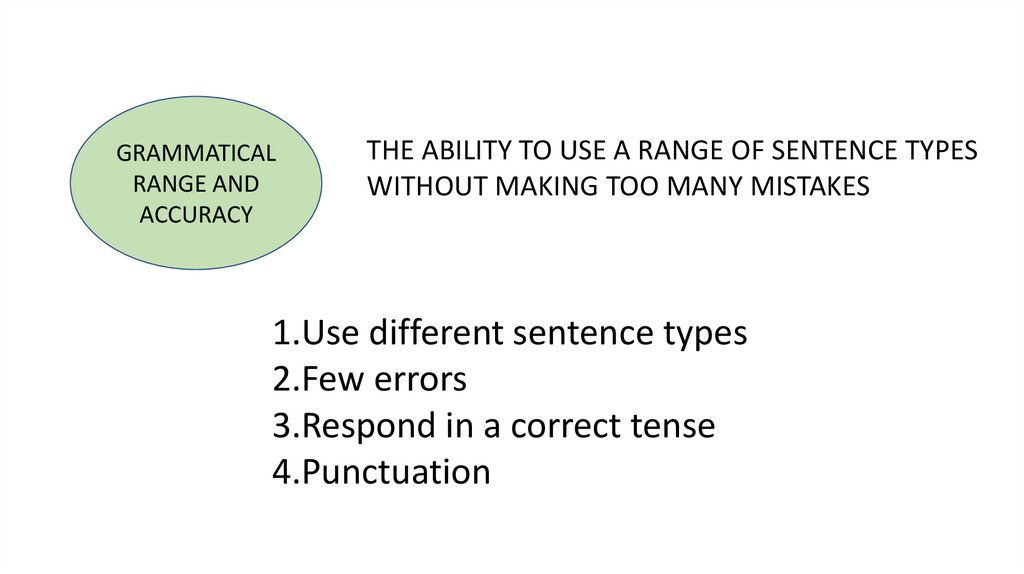
GRAMMATICALRANGE AND
ACCURACY
THE ABILITY TO USE A RANGE OF SENTENCE TYPES
WITHOUT MAKING TOO MANY MISTAKES
1.Use different sentence types
2.Few errors
3.Respond in a correct tense
4.Punctuation
12.
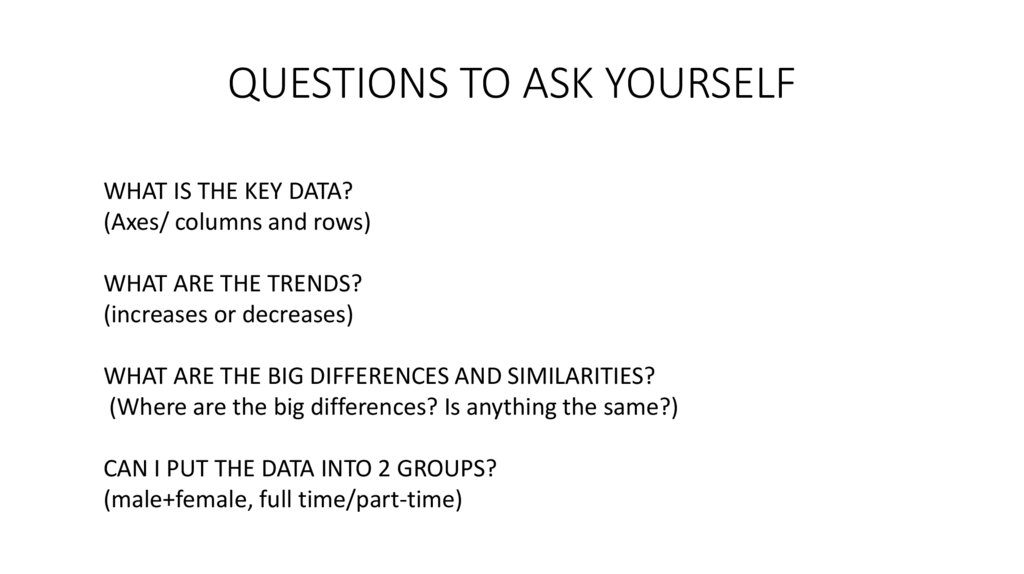
QUESTIONS TO ASK YOURSELFWHAT IS THE KEY DATA?
(Axes/ columns and rows)
WHAT ARE THE TRENDS?
(increases or decreases)
WHAT ARE THE BIG DIFFERENCES AND SIMILARITIES?
(Where are the big differences? Is anything the same?)
CAN I PUT THE DATA INTO 2 GROUPS?
(male+female, full time/part-time)
13.
STRUCTURE1.INTRODUCTION (1 SENTENCE)
2.OVERVIEW (2 SENTENCES)
3.DETAIL PARAGRAPH 1
4.DETAIL PARAGRAPH 2
14.
STRUCTUREPARAPHRASE YOUR QUESTION (REWRITE THE
QUESTION IN YOUR OWN WORDS)
SHOWS
INTRODUCTION
ILLUSTRATES
GIVES INFORMATION
DEPICTS
REPRESENTS
COMPARES
15.
PRESENT A CLEAR OVERVIEW OF MAIN TRENDS,DIFFERENCES OR STAGES
OVERVIEW
• It should not contain a lot of details and
specific information (numbers, figures)
• Should report the main trends, differences,
similarities
• Big picture of the graph
16.
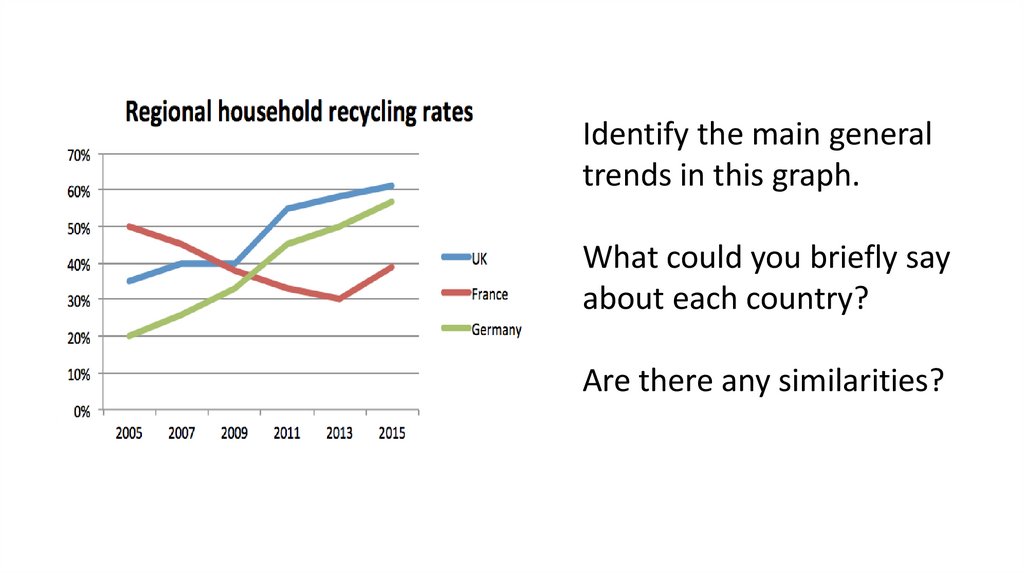
Identify the main generaltrends in this graph.
What could you briefly say
about each country?
Are there any similarities?
17.
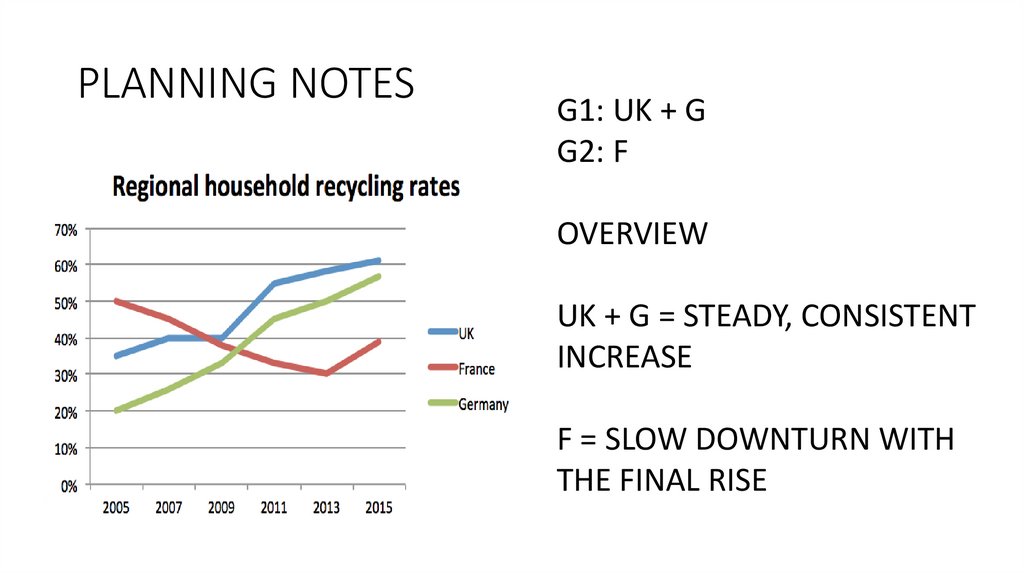
PLANNING NOTESG1: UK + G
G2: F
OVERVIEW
UK + G = STEADY, CONSISTENT
INCREASE
F = SLOW DOWNTURN WITH
THE FINAL RISE
18.
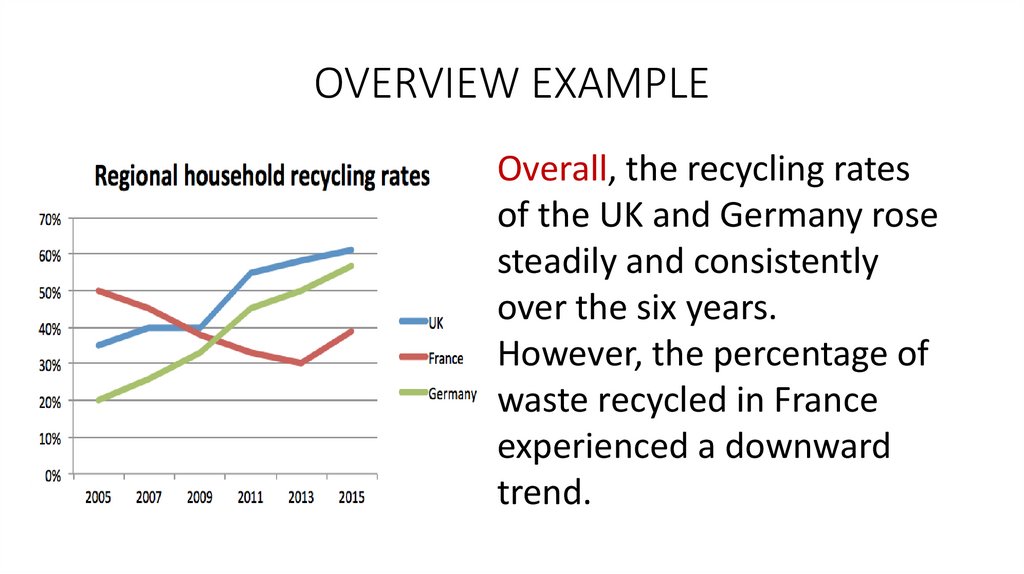
OVERVIEW EXAMPLEOverall, the recycling rates
of the UK and Germany rose
steadily and consistently
over the six years.
However, the percentage of
waste recycled in France
experienced a downward
trend.
19.
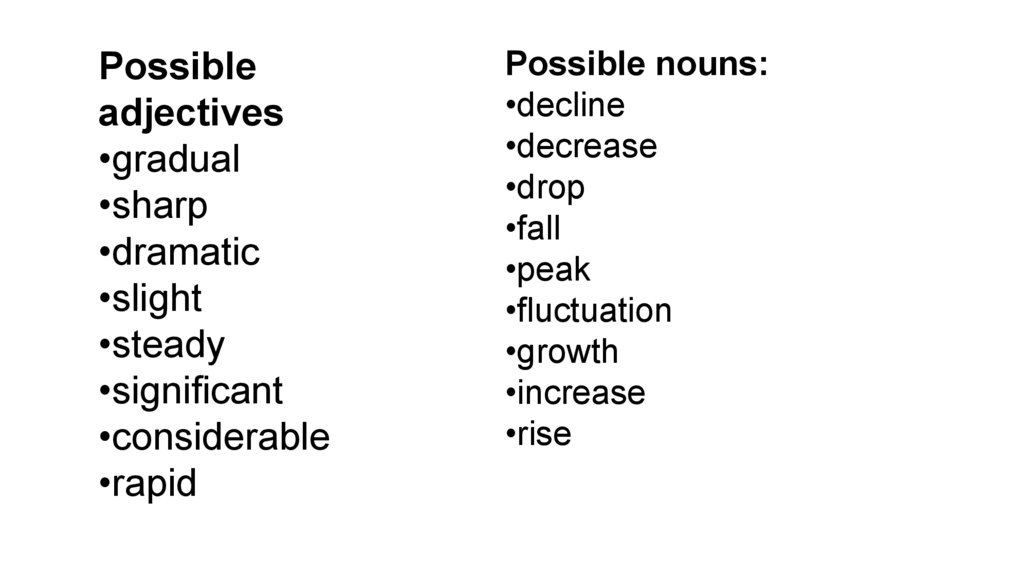
Possibleadjectives
•gradual
•sharp
•dramatic
•slight
•steady
•significant
•considerable
•rapid
Possible nouns:
•decline
•decrease
•drop
•fall
•peak
•fluctuation
•growth
•increase
•rise
20.
21.
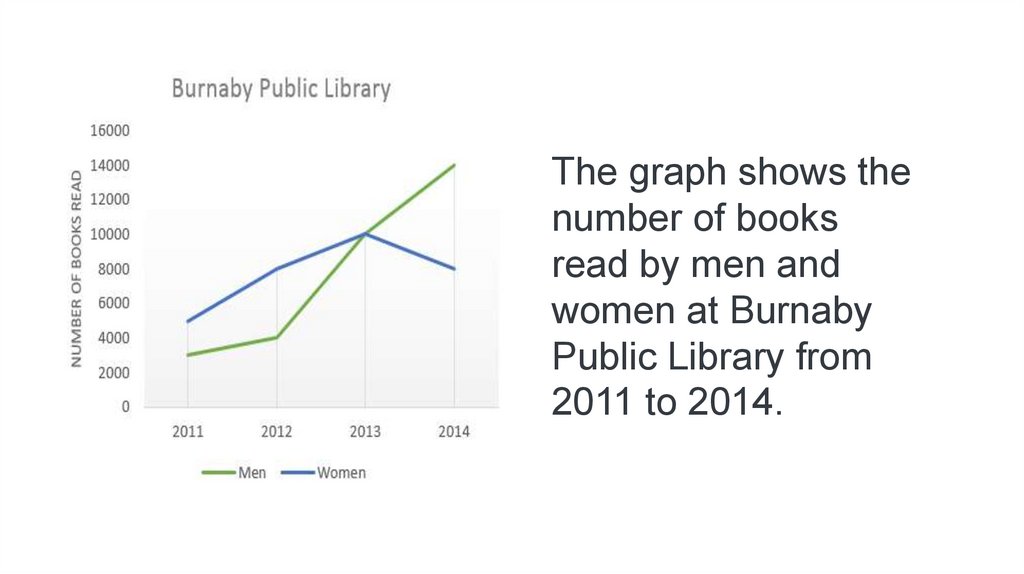
The graph shows thenumber of books
read by men and
women at Burnaby
Public Library from
2011 to 2014.