
 Финансы
Похожие презентации:


")


Financial market fragility
1. Part A: Financial market fragility
2.
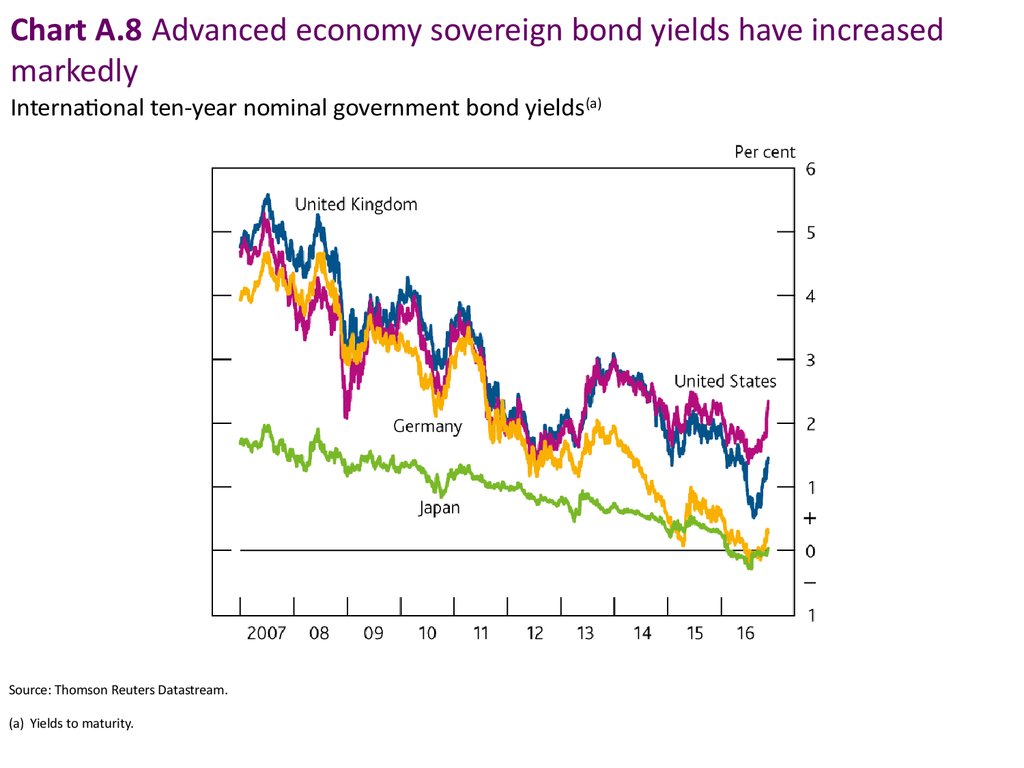
Chart A.8 Advanced economy sovereign bond yields have increasedmarkedly
International ten-year nominal government bond yields(a)
Source: Thomson Reuters Datastream.
(a) Yields to maturity.
3.
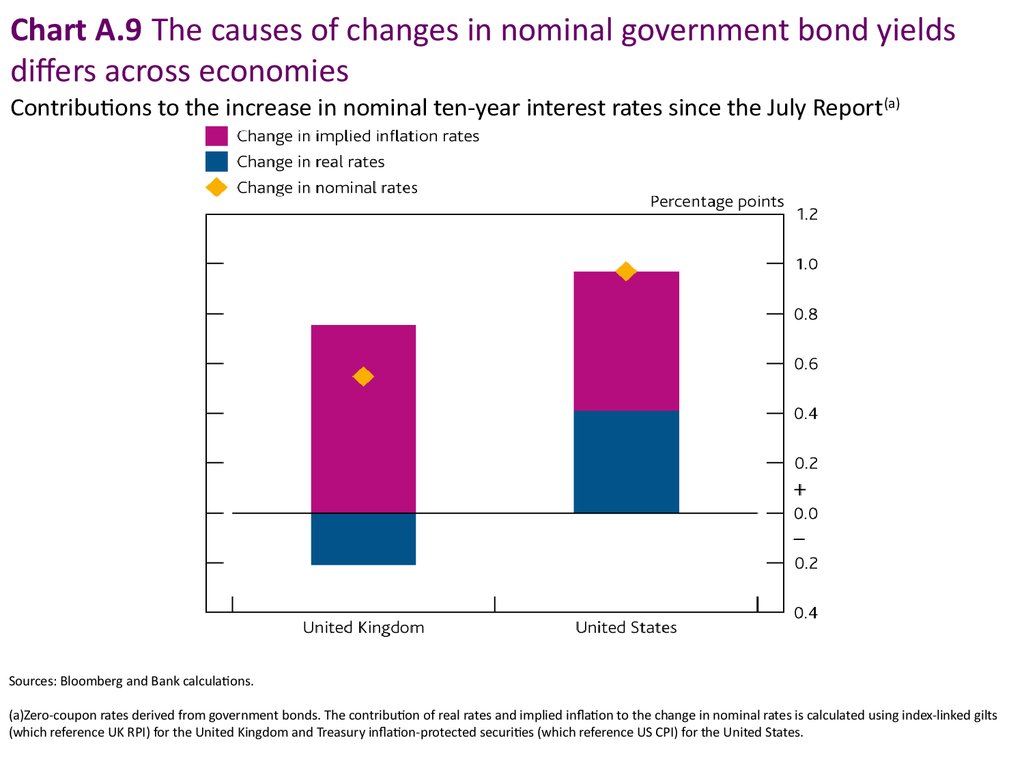
Chart A.9 The causes of changes in nominal government bond yieldsdiffers across economies
Contributions to the increase in nominal ten-year interest rates since the July Report (a)
Sources: Bloomberg and Bank calculations.
(a)Zero-coupon rates derived from government bonds. The contribution of real rates and implied inflation to the change in nominal rates is calculated using index-linked gilts
(which reference UK RPI) for the United Kingdom and Treasury inflation-protected securities (which reference US CPI) for the United States.
4.
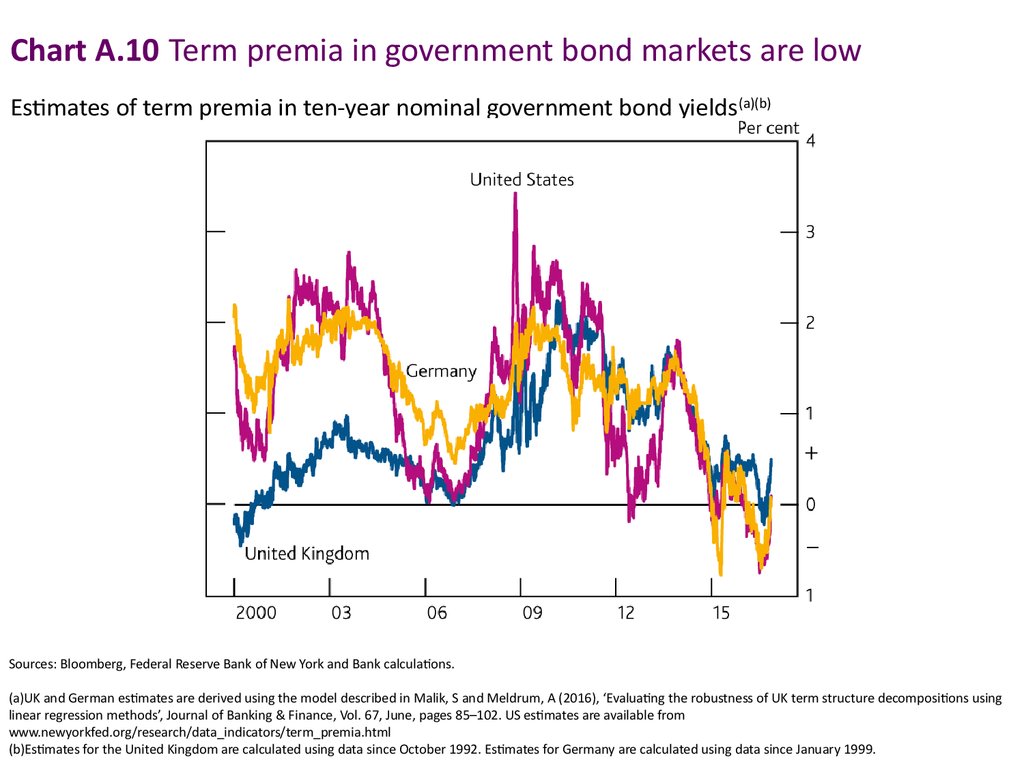
Chart A.10 Term premia in government bond markets are lowEstimates of term premia in ten-year nominal government bond yields (a)(b)
Sources: Bloomberg, Federal Reserve Bank of New York and Bank calculations.
(a)UK and German estimates are derived using the model described in Malik, S and Meldrum, A (2016), ‘Evaluating the robustness of UK term structure decompositions using
linear regression methods’, Journal of Banking & Finance, Vol. 67, June, pages 85–102. US estimates are available from
www.newyorkfed.org/research/data_indicators/term_premia.html
(b)Estimates for the United Kingdom are calculated using data since October 1992. Estimates for Germany are calculated using data since January 1999.
5.
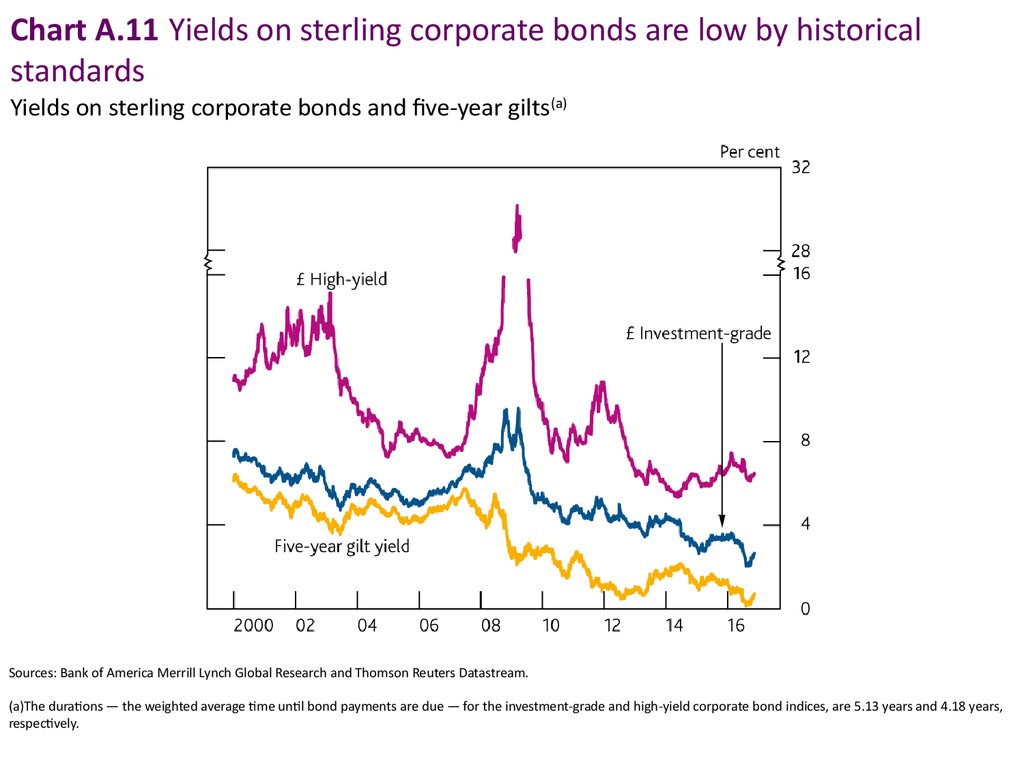
Chart A.11 Yields on sterling corporate bonds are low by historicalstandards
Yields on sterling corporate bonds and five-year gilts(a)
Sources: Bank of America Merrill Lynch Global Research and Thomson Reuters Datastream.
(a)The durations — the weighted average time until bond payments are due — for the investment-grade and high-yield corporate bond indices, are 5.13 years and 4.18 years,
respectively.
6.
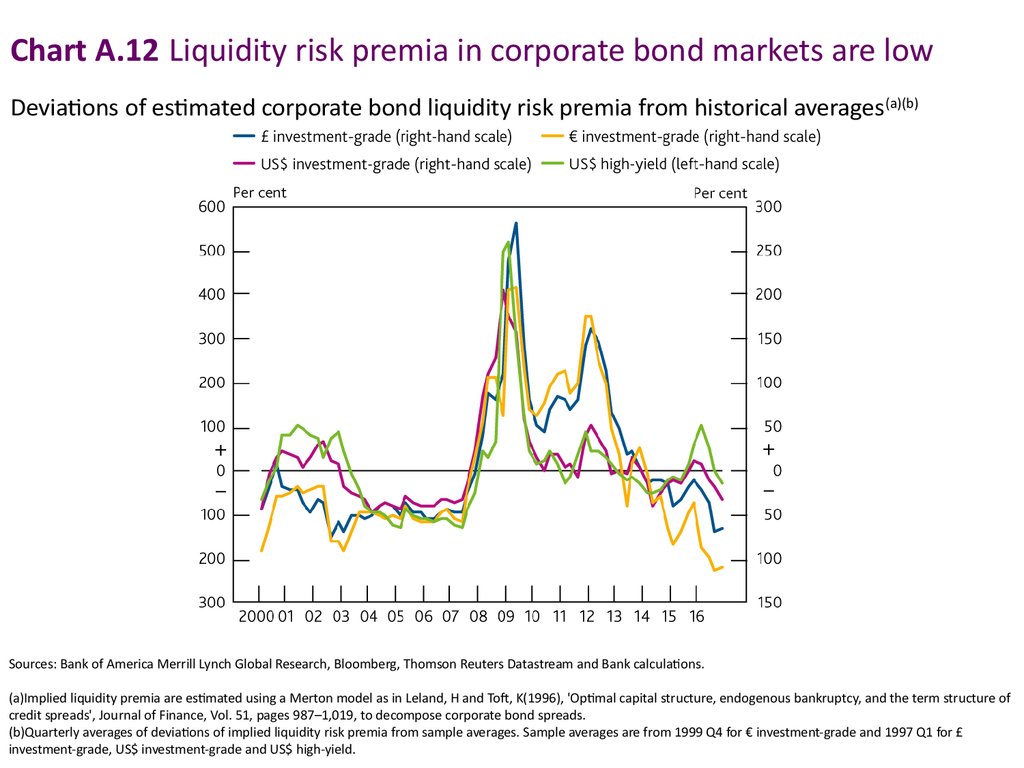
Chart A.12 Liquidity risk premia in corporate bond markets are lowDeviations of estimated corporate bond liquidity risk premia from historical averages (a)(b)
Sources: Bank of America Merrill Lynch Global Research, Bloomberg, Thomson Reuters Datastream and Bank calculations.
(a)Implied liquidity premia are estimated using a Merton model as in Leland, H and Toft, K(1996), 'Optimal capital structure, endogenous bankruptcy, and the term structure of
credit spreads', Journal of Finance, Vol. 51, pages 987–1,019, to decompose corporate bond spreads.
(b)Quarterly averages of deviations of implied liquidity risk premia from sample averages. Sample averages are from 1999 Q4 for € investment-grade and 1997 Q1 for £
investment-grade, US$ investment-grade and US$ high-yield.