


")

 Медицина
Похожие презентации:


Kim’s analysis
1. KIM’S ANALYSIS
2.
3.
4.
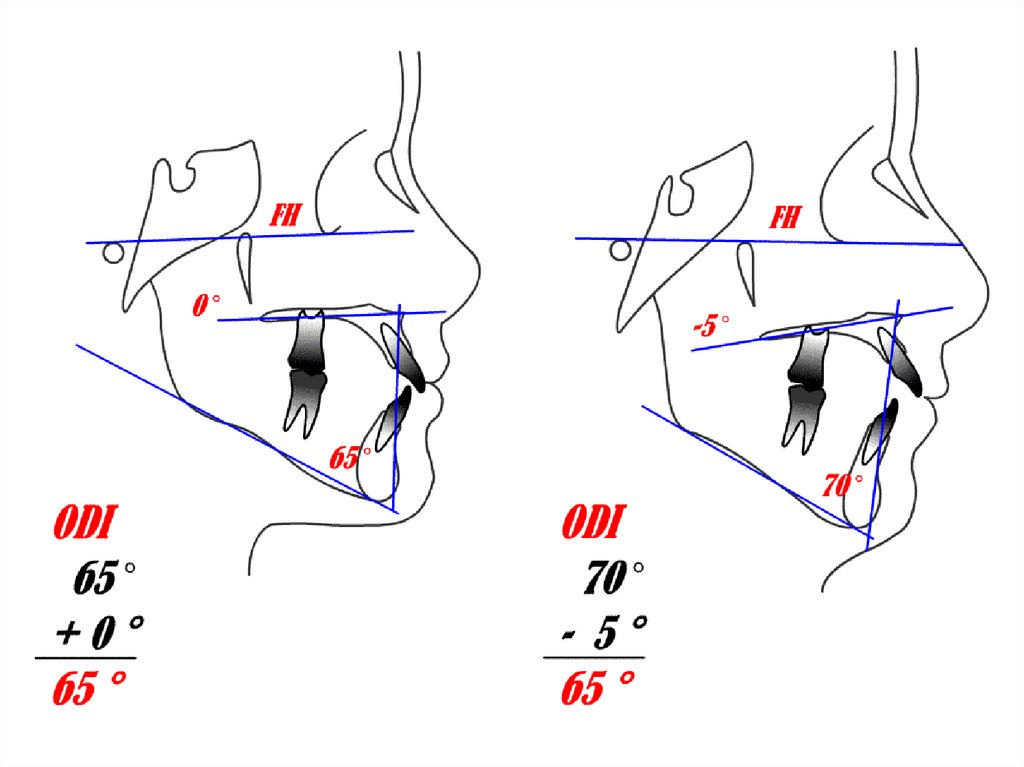
5. ODI
OverbiteDepth
Indicator
6. Overbite Depth Indicator with particular reference to open-bite
Young H. KimAm. J. Orthod. 65:585-611, 1974
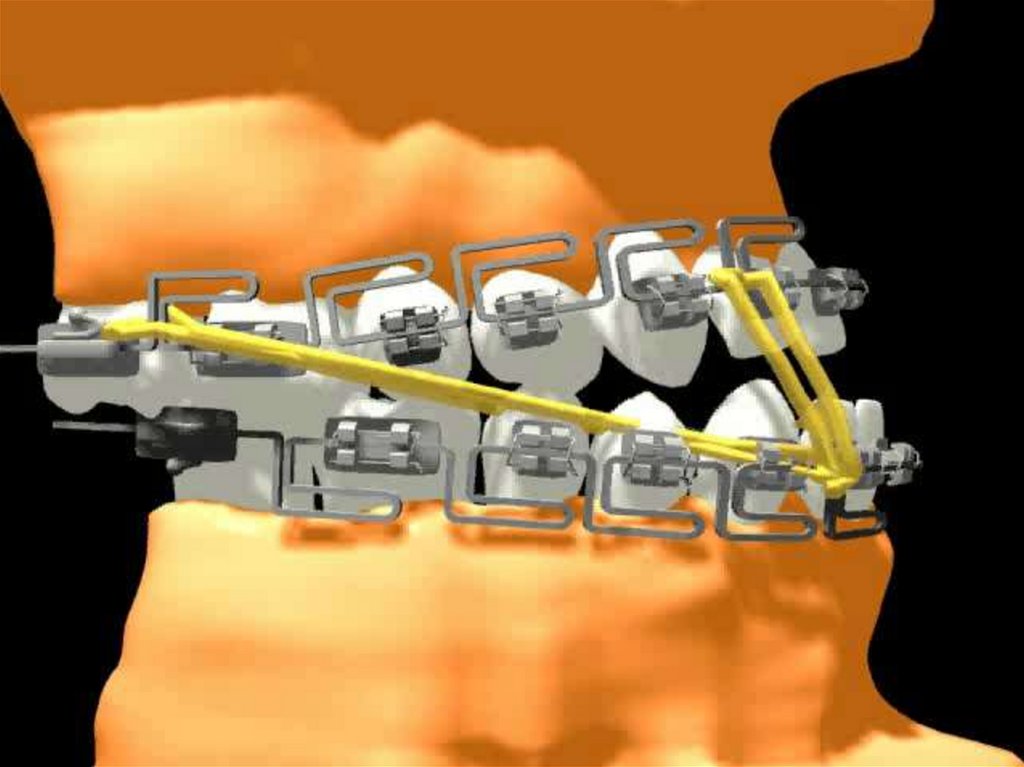
7. VERTICAL PROBLEM
Gonial angleMandibular plane angle
(SN - MP, FMA)
Occlusomandibular plane A.
PFH / AFH
Y- axis
8.
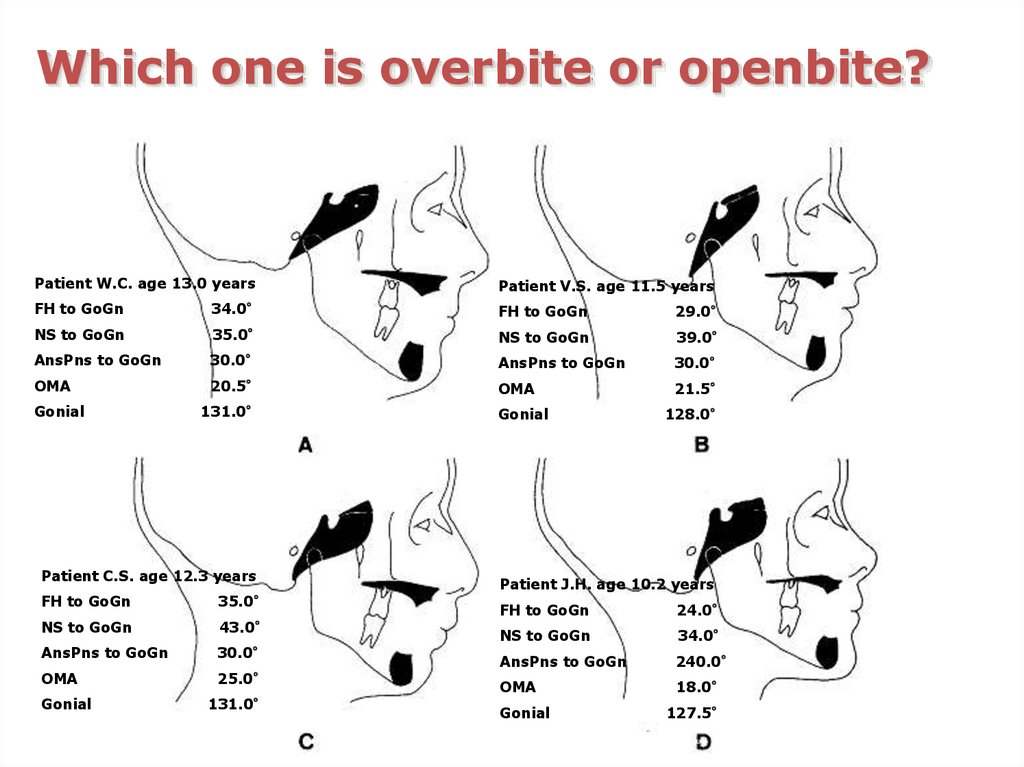
Which one is overbite or openbite?Patient W.C. age 13.0 years
Patient V.S. age 11.5 years
FH to GoGn
34.0°
FH to GoGn
29.0°
NS to GoGn
35.0°
NS to GoGn
39.0°
AnsPns to GoGn
30.0°
AnsPns to GoGn
30.0°
OMA
20.5°
OMA
21.5°
Gonial
131.0°
Patient C.S. age 12.3 years
FH to GoGn
35.0°
NS to GoGn
43.0°
AnsPns to GoGn
30.0°
OMA
25.0°
Gonial
131.0°
Gonial
128.0°
Patient J.H. age 10.2 years
FH to GoGn
24.0°
NS to GoGn
34.0°
AnsPns to GoGn
240.0°
OMA
18.0°
Gonial
127.5°
9. Normal occlusion sample
Group 1- age range : 7-14 years
- Sample No. : 119 persons
Boys : 56
Girls : 63
10. Untreated malocclusion sample
Age range : 7-16 yearsSample No. : 500 patients
Group 2 (Deep – overbite group)
4.5 – 11mm overbite range, 174 cases
Group 3 (Normal – overbite group)
0.5 – 4mm overbite range, 270 cases
Group 4 (Open–bite group)
0 - 11mm open-bite range, 56 cases
11.
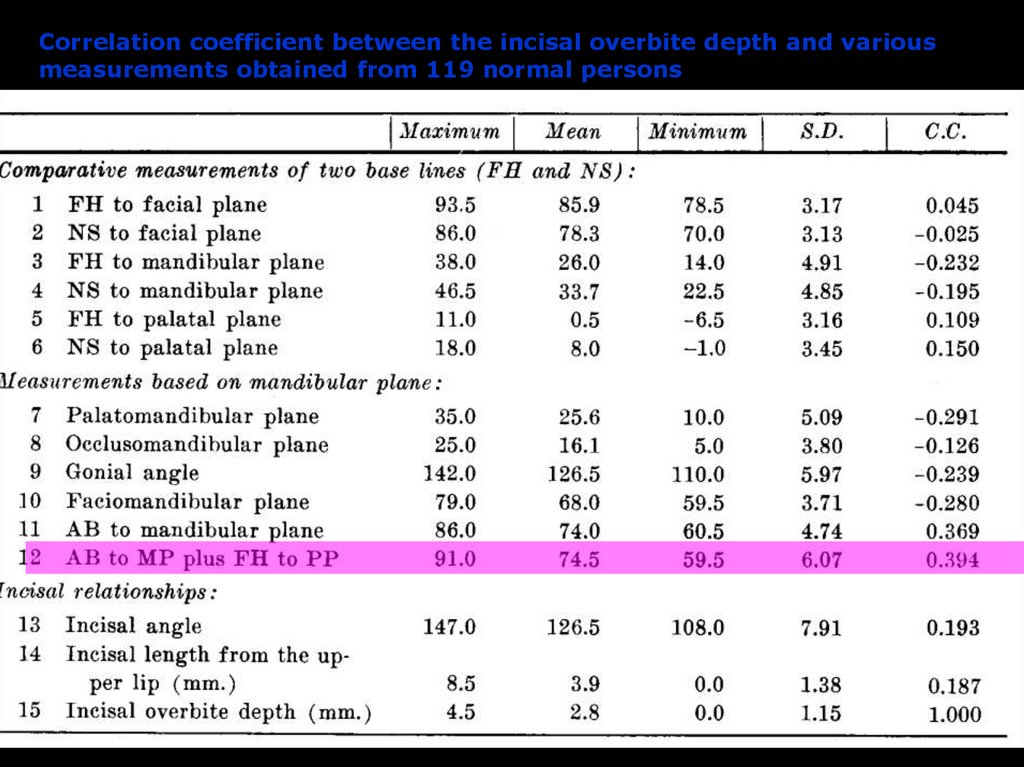
Correlation coefficient between the incisal overbite depth and variousmeasurements obtained from 119 normal persons
12.
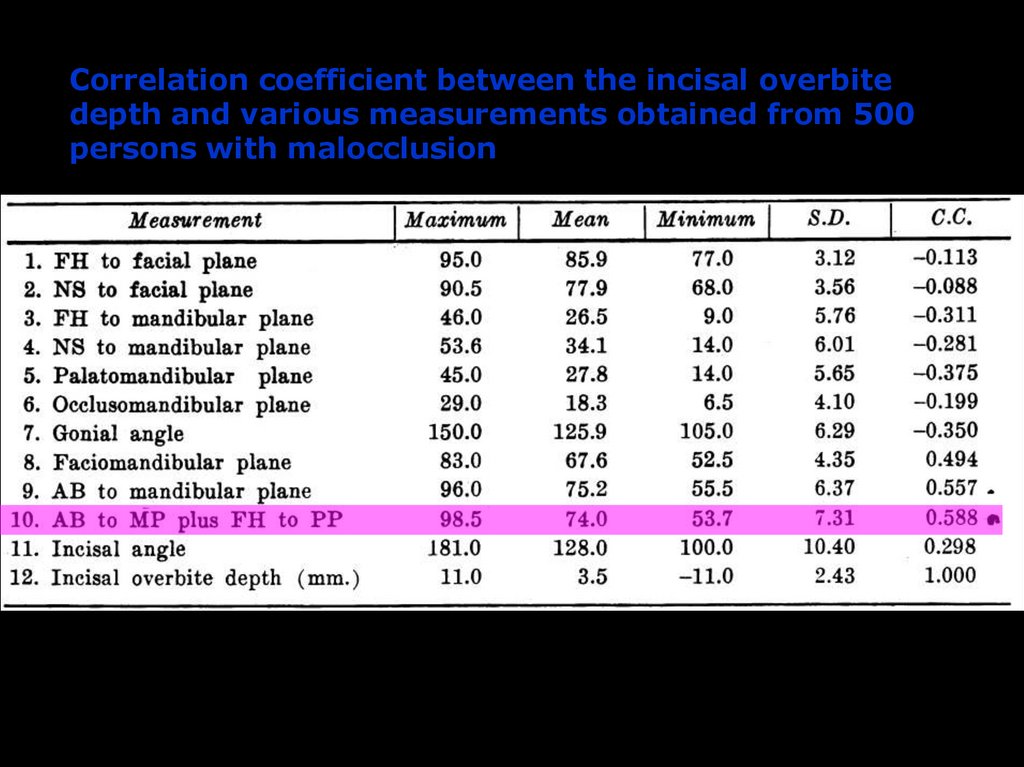
Correlation coefficient between the incisal overbitedepth and various measurements obtained from 500
persons with malocclusion
13.
14.
15.
16.
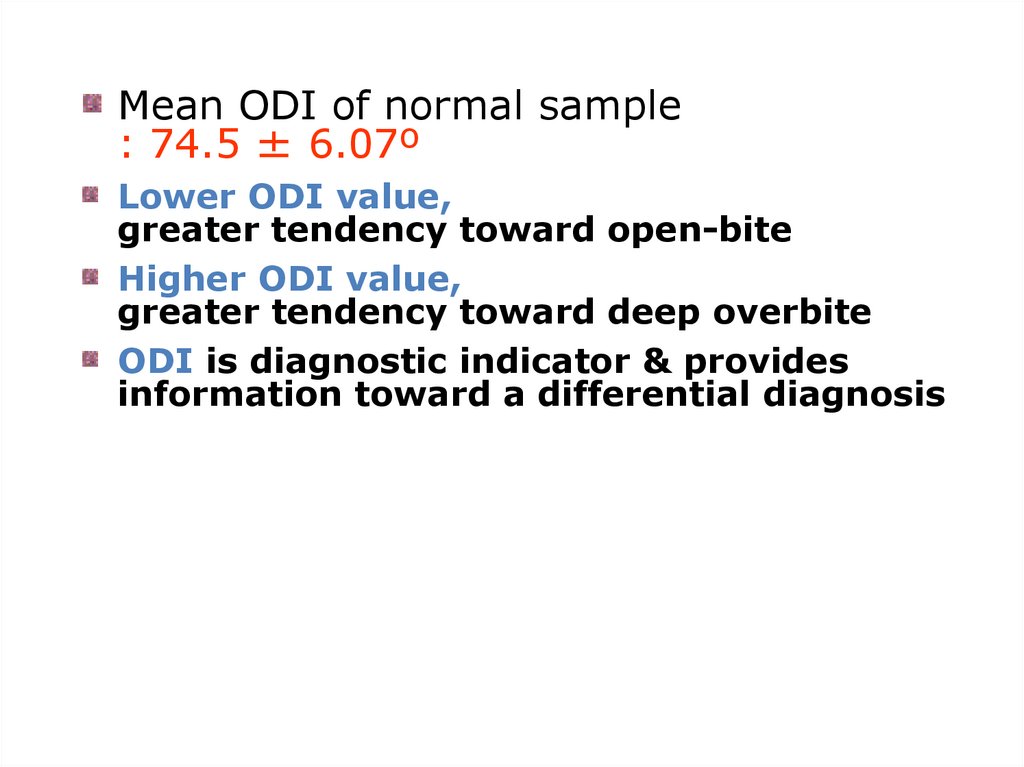
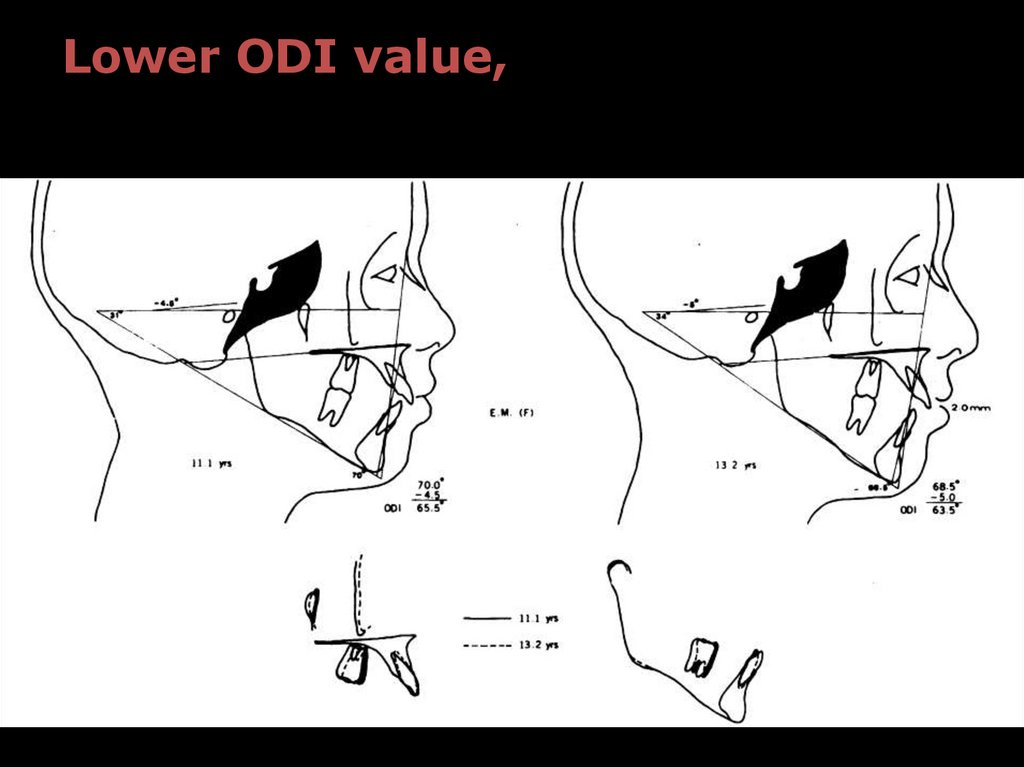
Mean ODI of normal sample: 74.5 ± 6.07º
Lower ODI value,
greater tendency toward open-bite
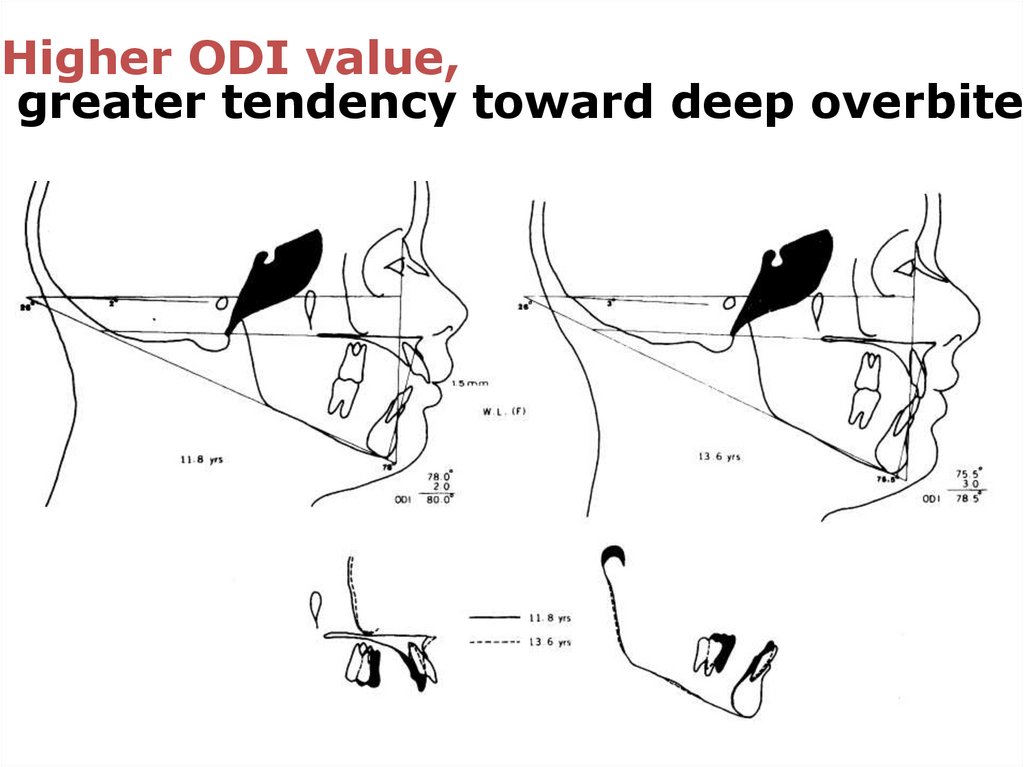
Higher ODI value,
greater tendency toward deep overbite
ODI is diagnostic indicator & provides
information toward a differential diagnosis
17.
Which one is overbite or openbite?Patient W.C. age 13.0 years
Patient V.S. age 11.5 years
FH to GoGn
34.0°
FH to GoGn
29.0°
NS to GoGn
35.0°
NS to GoGn
39.0°
AnsPns to GoGn
30.0°
AnsPns to GoGn
30.0°
OMA
20.5°
OMA
21.5°
Gonial
131.0°
Patient C.S. age 12.3 years
FH to GoGn
35.0°
NS to GoGn
43.0°
AnsPns to GoGn
30.0°
OMA
25.0°
Gonial
131.0°
Gonial
128.0°
Patient J.H. age 10.2 years
FH to GoGn
24.0°
NS to GoGn
34.0°
AnsPns to GoGn
240.0°
OMA
18.0°
Gonial
127.5°
18.
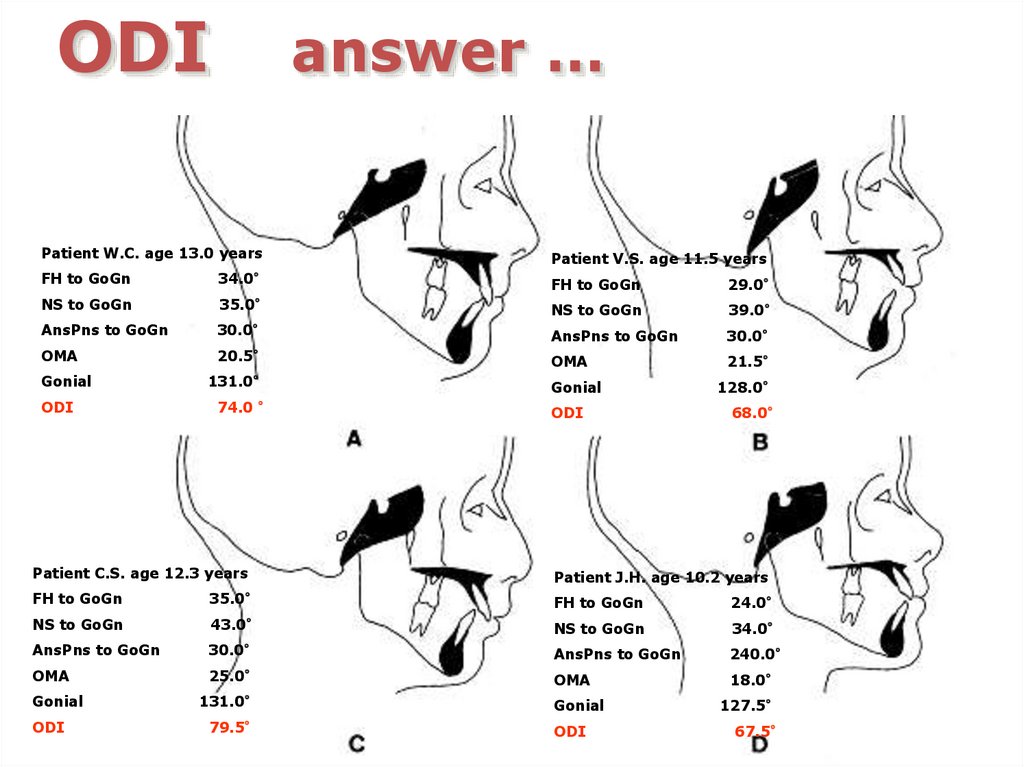
ODIanswer …
Patient W.C. age 13.0 years
Patient V.S. age 11.5 years
FH to GoGn
34.0°
FH to GoGn
29.0°
NS to GoGn
35.0°
NS to GoGn
39.0°
AnsPns to GoGn
30.0°
AnsPns to GoGn
30.0°
OMA
20.5°
OMA
21.5°
Gonial
ODI
131.0°
74.0 °
Gonial
ODI
128.0°
68.0°
Patient C.S. age 12.3 years
Patient J.H. age 10.2 years
FH to GoGn
35.0°
FH to GoGn
24.0°
NS to GoGn
43.0°
NS to GoGn
34.0°
AnsPns to GoGn
30.0°
AnsPns to GoGn
240.0°
OMA
25.0°
OMA
18.0°
Gonial
ODI
131.0°
79.5°
Gonial
ODI
127.5°
67.5°
19.
Lower ODI value,greater tendency toward open-bite
20.
Higher ODI value,greater tendency toward deep overbite
21.
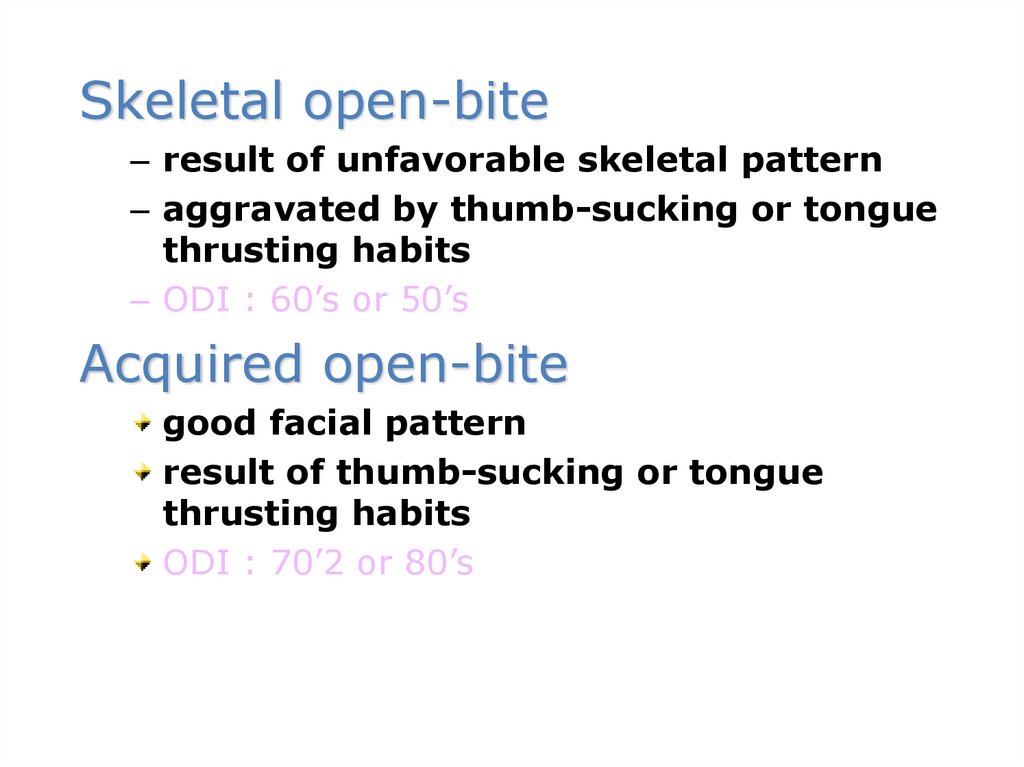
Skeletal open-bite– result of unfavorable skeletal pattern
– aggravated by thumb-sucking or tongue
thrusting habits
– ODI : 60’s or 50’s
Acquired open-bite
good facial pattern
result of thumb-sucking or tongue
thrusting habits
ODI : 70’2 or 80’s
22.
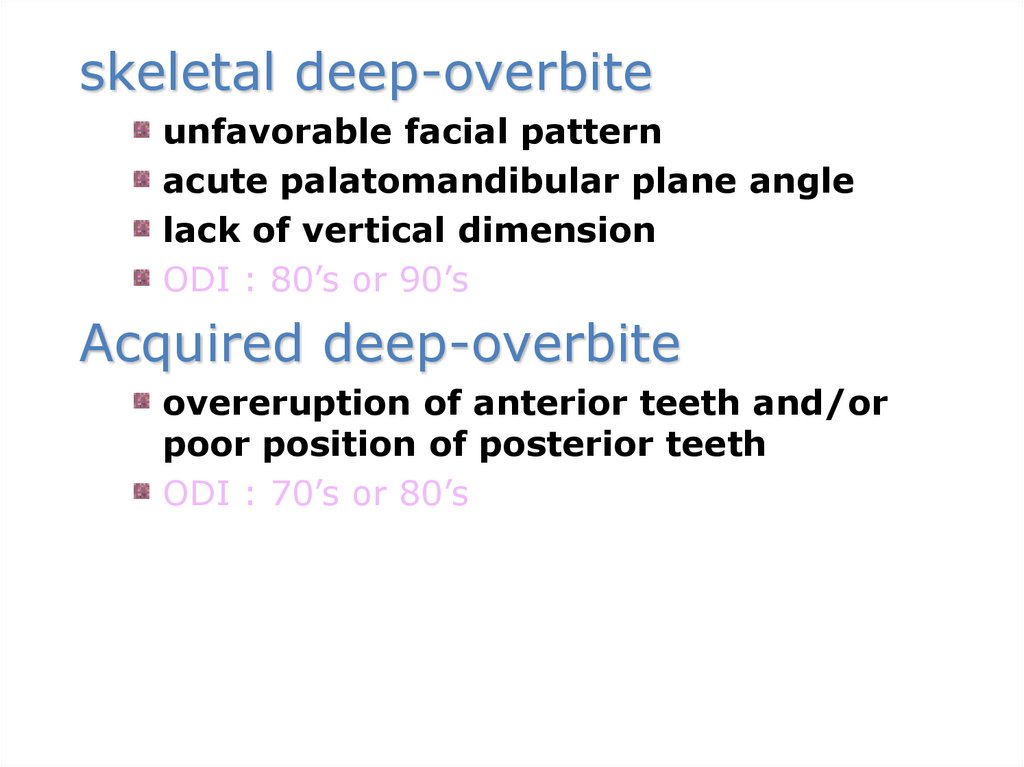
skeletal deep-overbiteunfavorable facial pattern
acute palatomandibular plane angle
lack of vertical dimension
ODI : 80’s or 90’s
Acquired deep-overbite
overeruption of anterior teeth and/or
poor position of posterior teeth
ODI : 70’s or 80’s
23.
24.
Mean ODI of normal sample: 74.5 ± 6.07º
lower ODI value,
greater tendency toward open-bite
higher ODI value,
greater tendency toward deep overbite
ODI is diagnostic indicator & provides
information toward a differential diagnosis
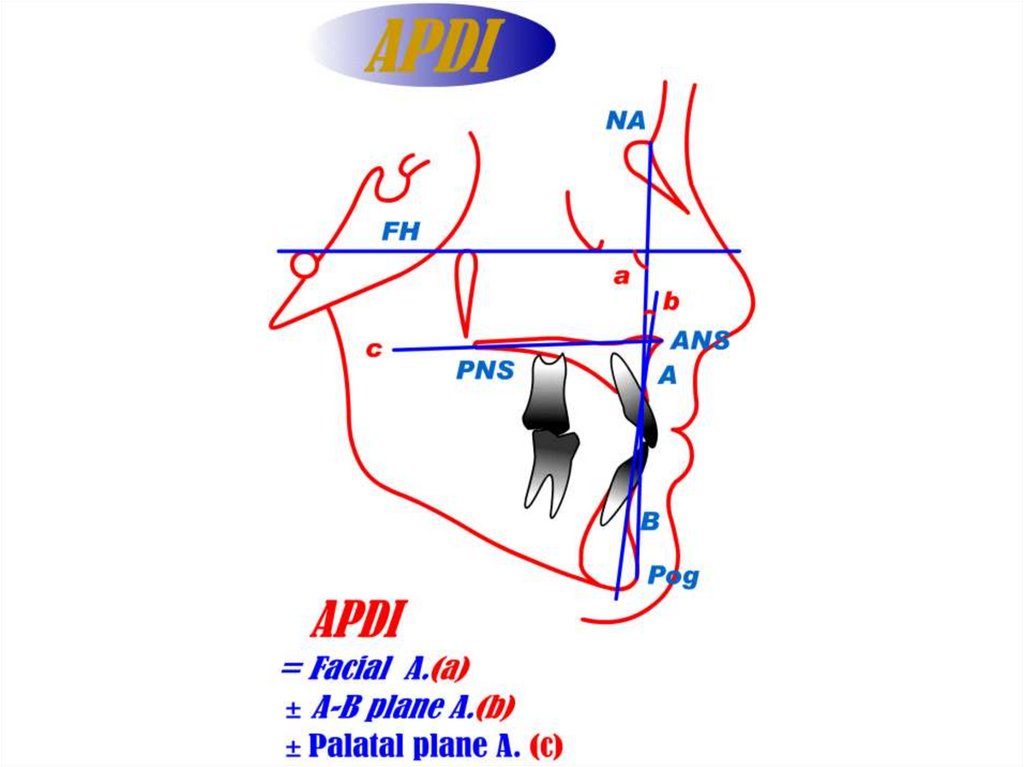
25. APDI
Antero –Posterior
Dysplasia
Indicator
26. Anteroposterior Dysplasia Indicator : An adjunct Cephalometric differential diagnosis
Young H. Kim,Am. J. Orthod. 73:619-633, 1978
27. Cephalometric analysis of A-P dysplasia
Steiner(1953) : ANB angleDowns(1948) : A-B plane angle
Hitchcoch(1973) : A-B plane to occlusal
plane
Jacobson(1975) : Wits appraisal
Ferrazzini(1976) : perpendicular line
from point A and Mx. plane (ANSPNS)
28.
29. Sample No.
GroupGroup
Group
Group
1
2
3
4
:
:
:
:
normal occlusion sample (102)
Class I malocclusion (214)
Class II malocclusion (624)
Class III malocclusion (36)
30.
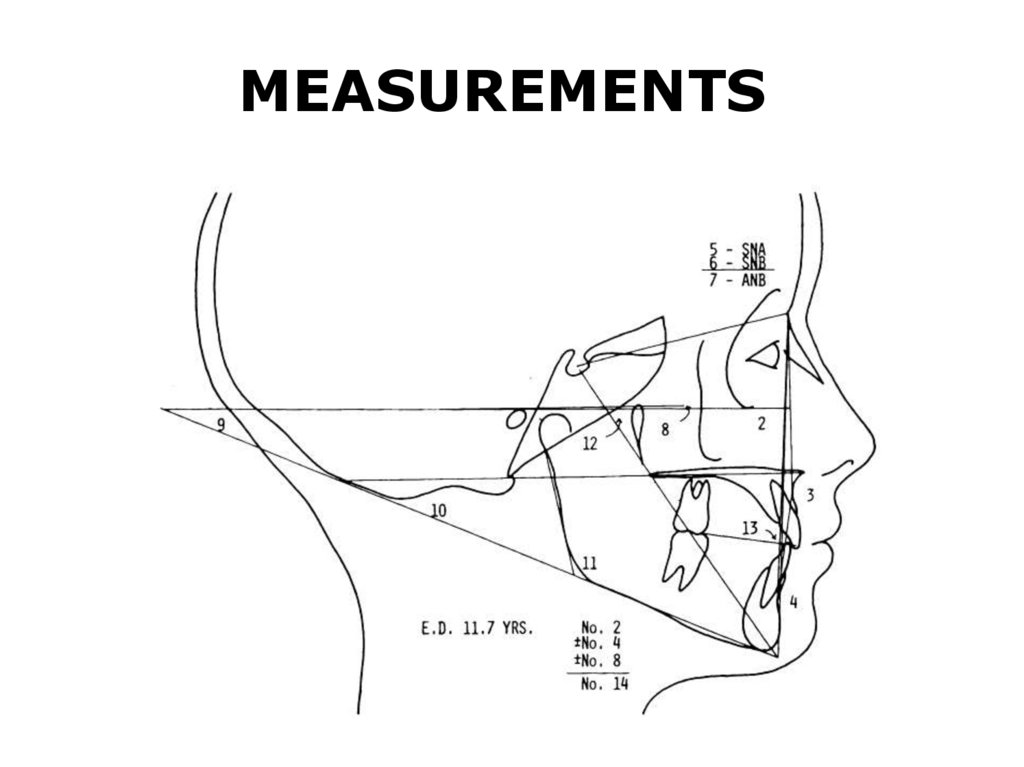
MEASUREMENTS31.
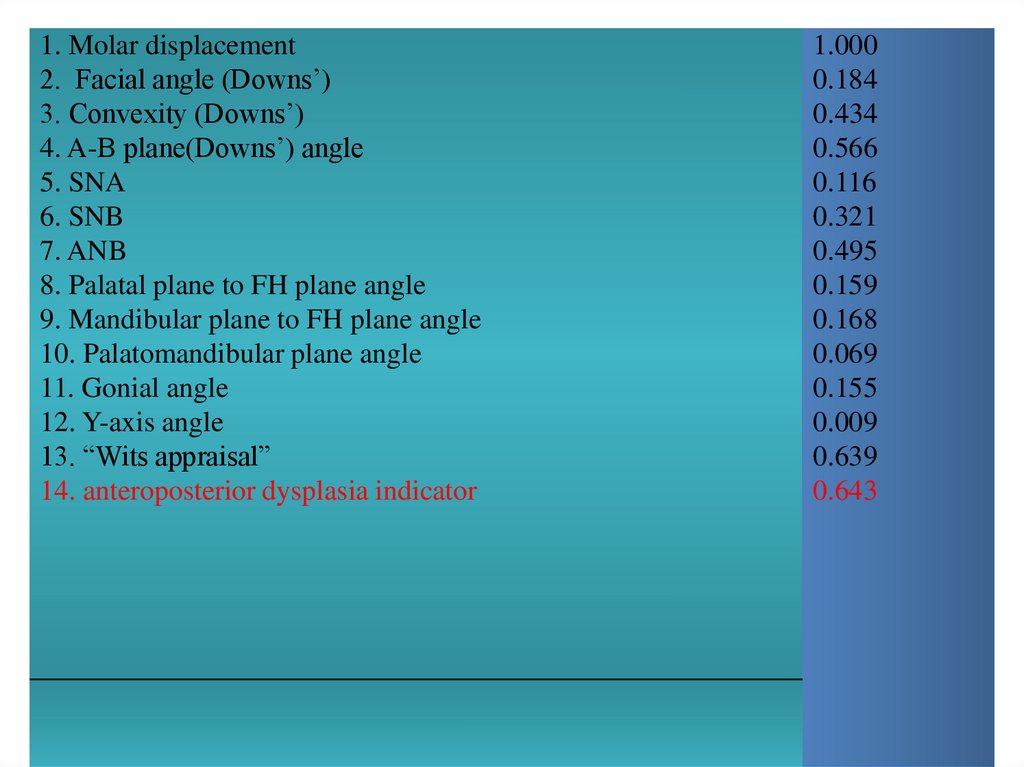
1. Molar displacement2. Facial angle (Downs’)
3. Convexity (Downs’)
4. A-B plane(Downs’) angle
5. SNA
6. SNB
7. ANB
8. Palatal plane to FH plane angle
9. Mandibular plane to FH plane angle
10. Palatomandibular plane angle
11. Gonial angle
12. Y-axis angle
13. “Wits appraisal”
14. anteroposterior dysplasia indicator
1.000
0.184
0.434
0.566
0.116
0.321
0.495
0.159
0.168
0.069
0.155
0.009
0.639
0.643
32. Correlation coeffient value : Displacement of molar relationship versus various cephalometric measurements (N = 874)
High C.C :Wits appraisal (0.639)
APDI (0.643)
33.
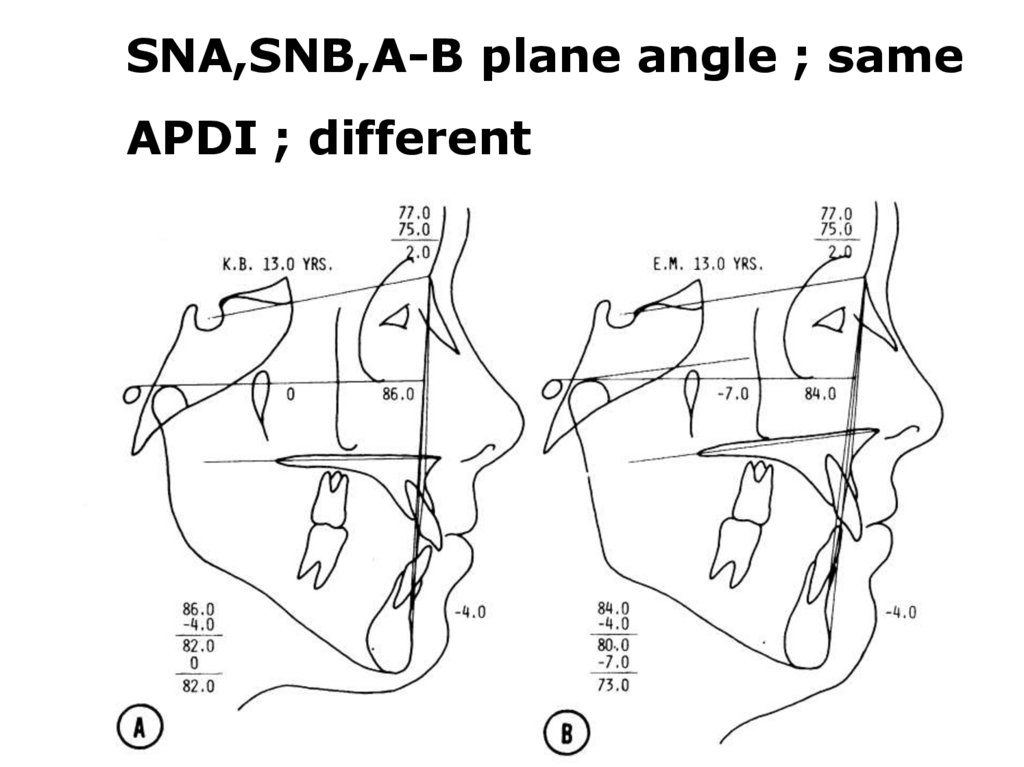
SNA,SNB,A-B plane angle ; sameAPDI ; different
34.
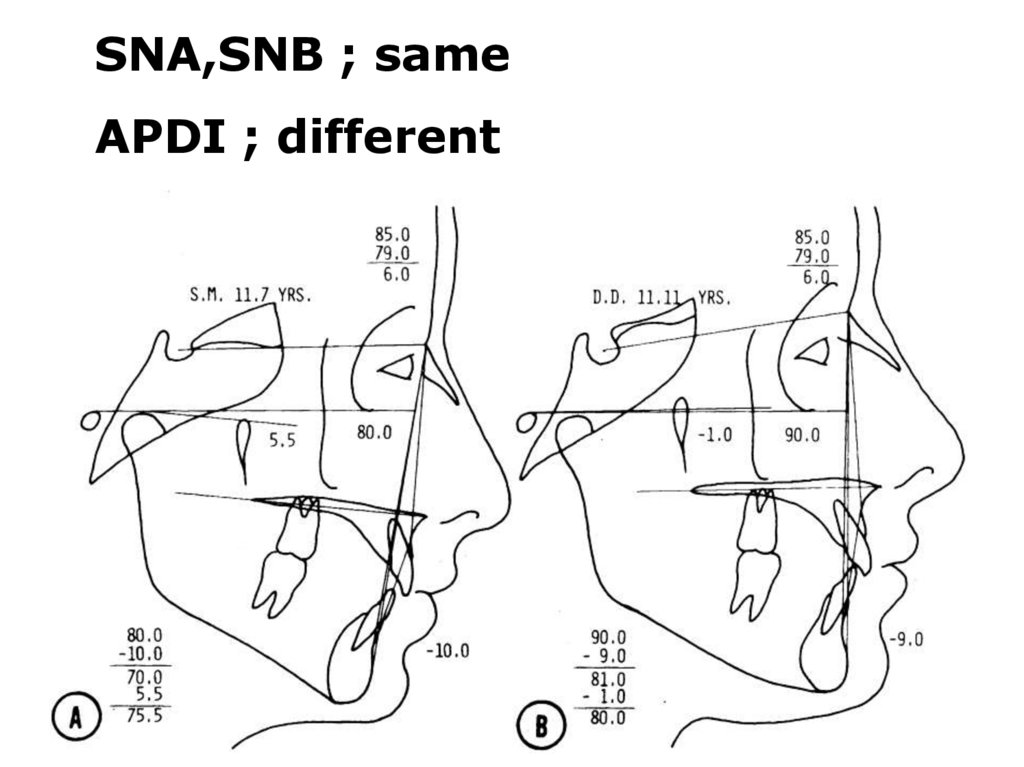
SNA,SNB ; sameAPDI ; different
35.
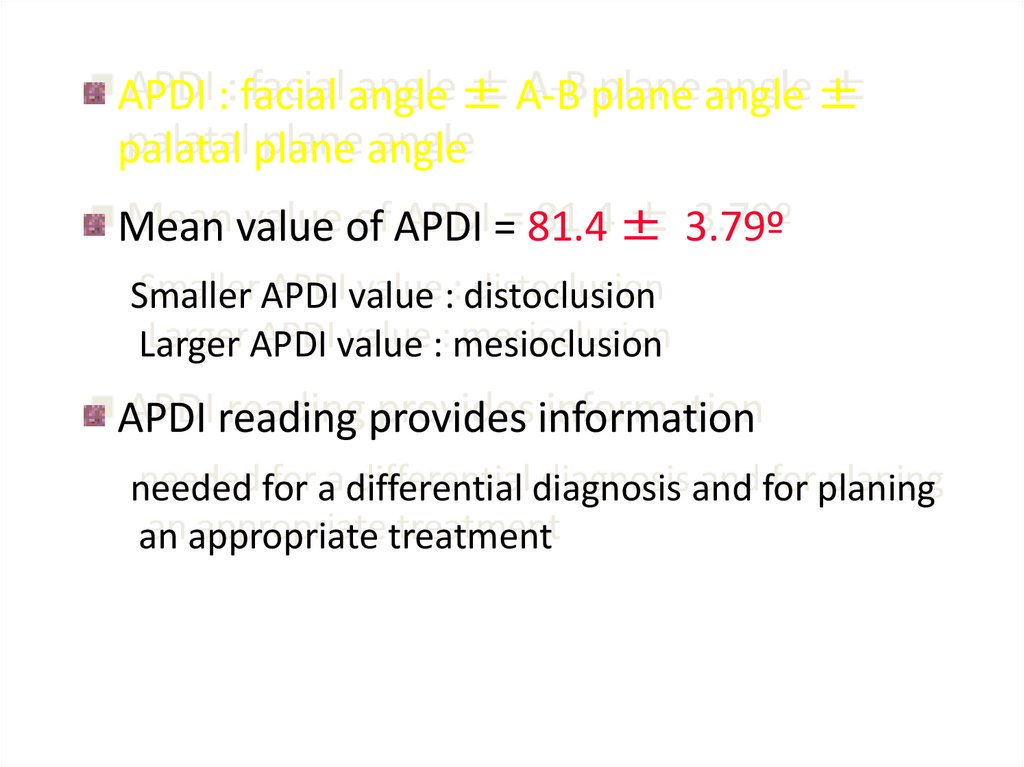
APDI : facial angle ± A-B plane angle ±palatal plane angle
Mean value of APDI = 81.4 ± 3.79º
Smaller APDI value : distoclusion
Larger APDI value : mesioclusion
APDI reading provides information
needed for a differential diagnosis and for planing
an appropriate treatment