


 Информатика
Похожие презентации:


Шаблоны слайдов от McKinsey
1.
Шаблоны слайдов с планом работШаблоны слайдов с процессом
Шаблоны слайдов со структурами/деревом решений
Шаблоны слайдов с горизонтами
Приложение:
шаблоны и
примеры слайдов
Шаблоны слайдов From-to
Шаблоны слайдов с воронками
Шаблоны слайдов с компонентами
Шаблоны слайдов с матрицами
Примеры слайдов с визуализацией числовых данных
1
2.
Video content analysis (VCA) technology and infrastructure is readily availableJul. ‘15
in 2-5 years
Sophisticated realtime and
predictive BI solutions
are in pilot stages
Dec. ‘14
Digital CCTV cameras are
installed in many client’s
locations, raw video data is
available
Provider roadmaps indicate
BI solutions for customer
behavior, frontline
management and cloud
analytics
Oct. ‘15
Current technology allows
to perform people count,
queue tracking and
create heat maps
in 1-2 years
Providers currently refine
end-to-end tracking
capabilities in large
perimeters and accuracy
in crowded
environments
2
3.
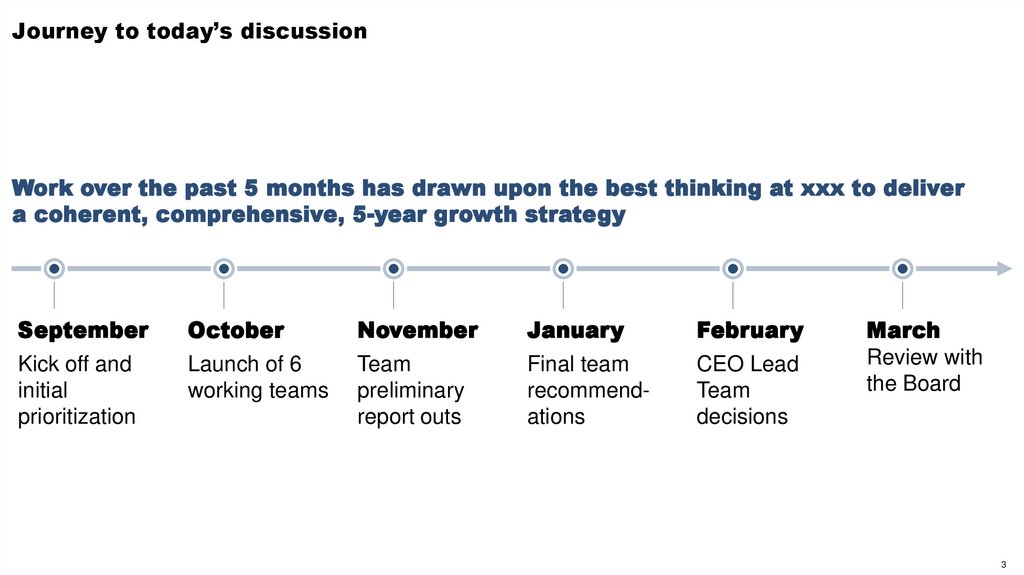
Journey to today’s discussionWork over the past 5 months has drawn upon the best thinking at xxx to deliver
a coherent, comprehensive, 5-year growth strategy
September
October
November
January
February
Kick off and
initial
prioritization
Launch of 6
working teams
Team
preliminary
report outs
Final team
recommendations
CEO Lead
Team
decisions
March
Review with
the Board
3
4.
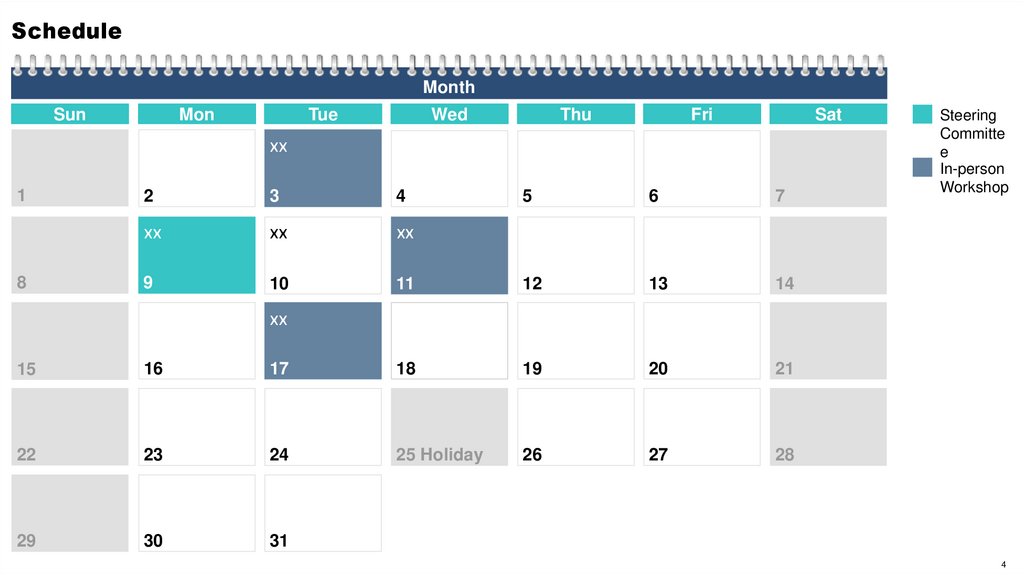
ScheduleMonth
Sun
Mon
Tue
Wed
Thu
Fri
Sat
хх
1
8
2
3
4
5
6
7
хх
хх
хх
9
10
11
12
13
14
Steering
Committe
e
In-person
Workshop
хх
15
16
17
18
19
20
21
22
23
24
25 Holiday
26
27
28
29
30
31
4
5.
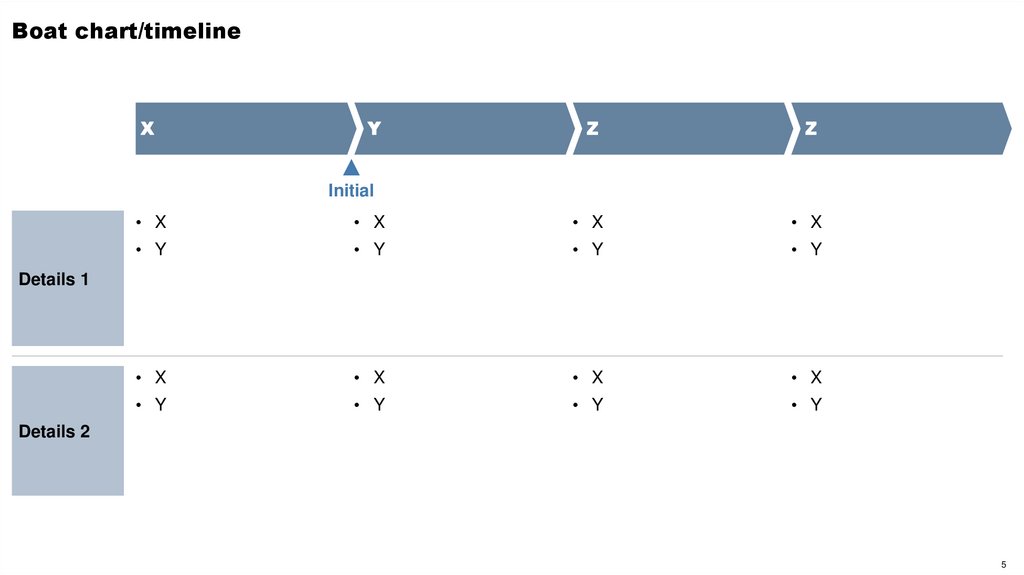
Boat chart/timelineX
Y
Z
Z
Initial
• X
• X
• X
• X
• Y
• Y
• Y
• Y
• X
• X
• X
• X
• Y
• Y
• Y
• Y
Details 1
Details 2
5
6.
TimelineX weeks
X weeks
…
1
2
X weeks
…
…
…
…
…
…
….
….
…
…
6
7.
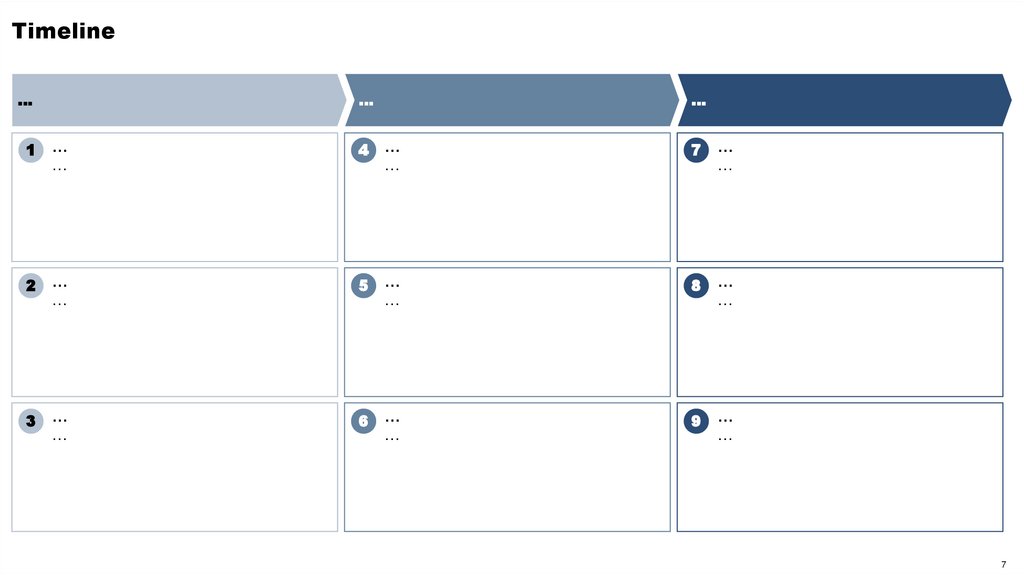
Timeline…
…
…
1
…
…
4
…
…
7
…
…
2
…
…
5
…
…
8
…
…
3
…
…
6
…
…
9
…
…
7
8.
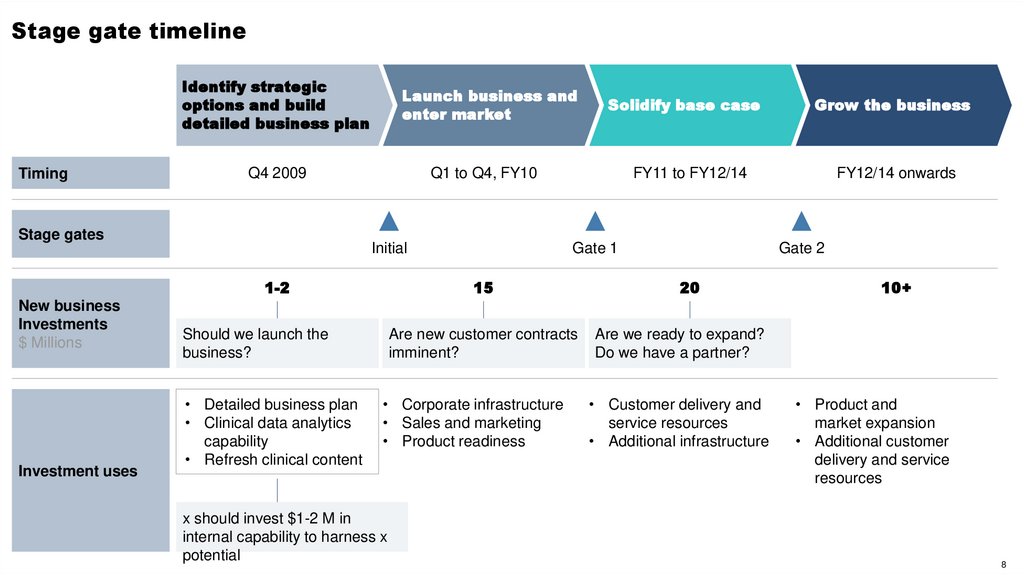
Stage gate timelineIdentify strategic
options and build
detailed business plan
Timing
Launch business and
enter market
Q4 2009
Stage gates
Q1 to Q4, FY10
Initial
1-2
New business
Investments
$ Millions
Investment uses
Gate 1
Are new customer contracts
imminent?
• Corporate infrastructure
• Sales and marketing
• Product readiness
x should invest $1-2 M in
internal capability to harness x
potential
Grow the business
FY11 to FY12/14
15
Should we launch the
business?
• Detailed business plan
• Clinical data analytics
capability
• Refresh clinical content
Solidify base case
FY12/14 onwards
Gate 2
20
10+
Are we ready to expand?
Do we have a partner?
• Customer delivery and
service resources
• Additional infrastructure
• Product and
market expansion
• Additional customer
delivery and service
resources
8
9.
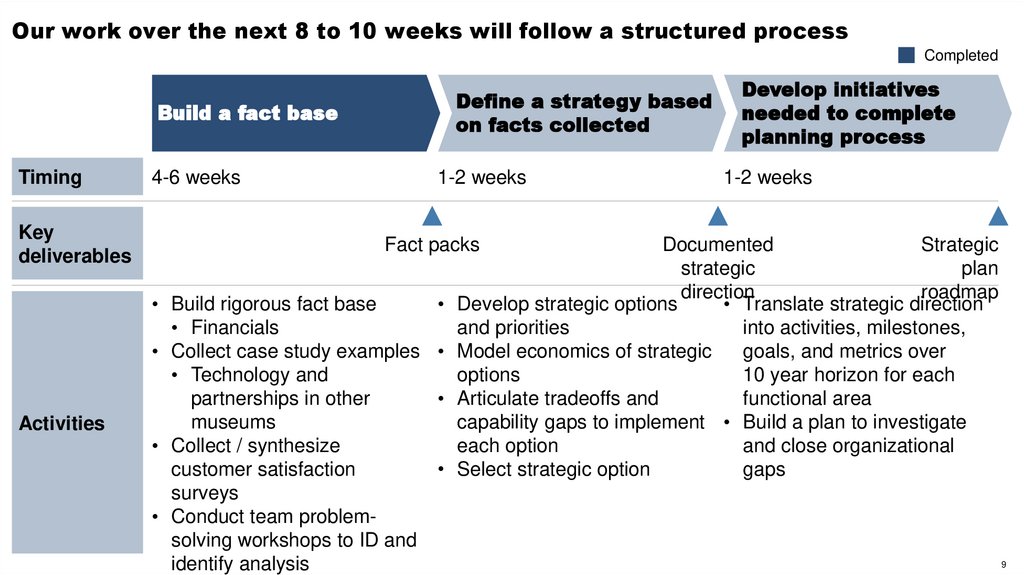
Our work over the next 8 to 10 weeks will follow a structured processCompleted
Define a strategy based
on facts collected
Build a fact base
Timing
Key
deliverables
Activities
4-6 weeks
1-2 weeks
Develop initiatives
needed to complete
planning process
1-2 weeks
Fact packs
• Build rigorous fact base
• Financials
• Collect case study examples
• Technology and
partnerships in other
museums
• Collect / synthesize
customer satisfaction
surveys
• Conduct team problemsolving workshops to ID and
identify analysis
Documented
Strategic
strategic
plan
direction
roadmap
Develop strategic options
• Translate strategic direction
and priorities
into activities, milestones,
Model economics of strategic
goals, and metrics over
options
10 year horizon for each
Articulate tradeoffs and
functional area
capability gaps to implement • Build a plan to investigate
each option
and close organizational
Select strategic option
gaps
9
10.
ScheduleMonday
Tuesday
Wednesday
Thursday
Friday
Monday
7
8
9
10
11
14
TBD
Activities
TBD
Deliverables
10
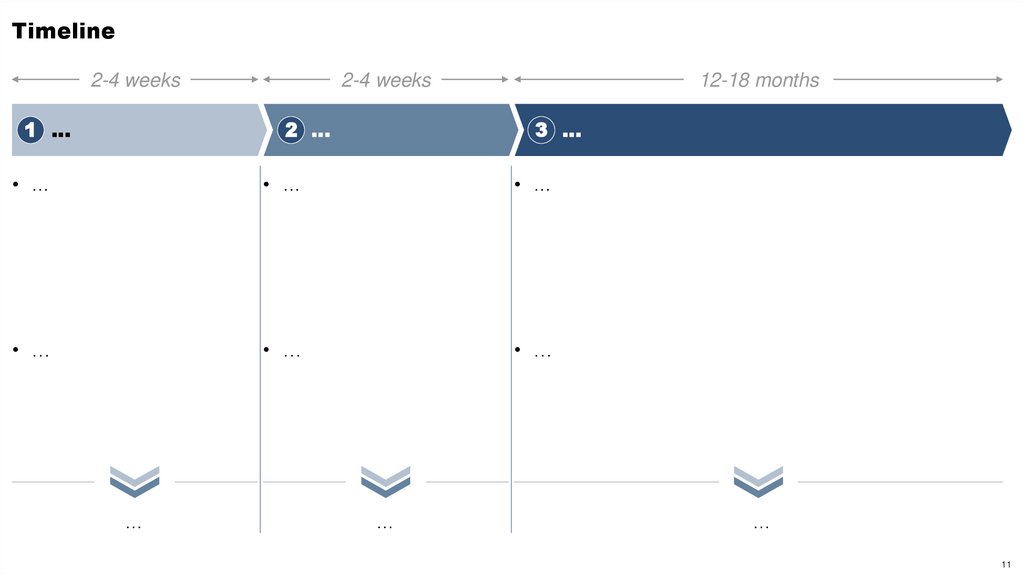
11.
Timeline2-4 weeks
1 …
2-4 weeks
2 …
12-18 months
3 …
• …
• …
• …
• …
• …
• …
…
…
…
11
12.
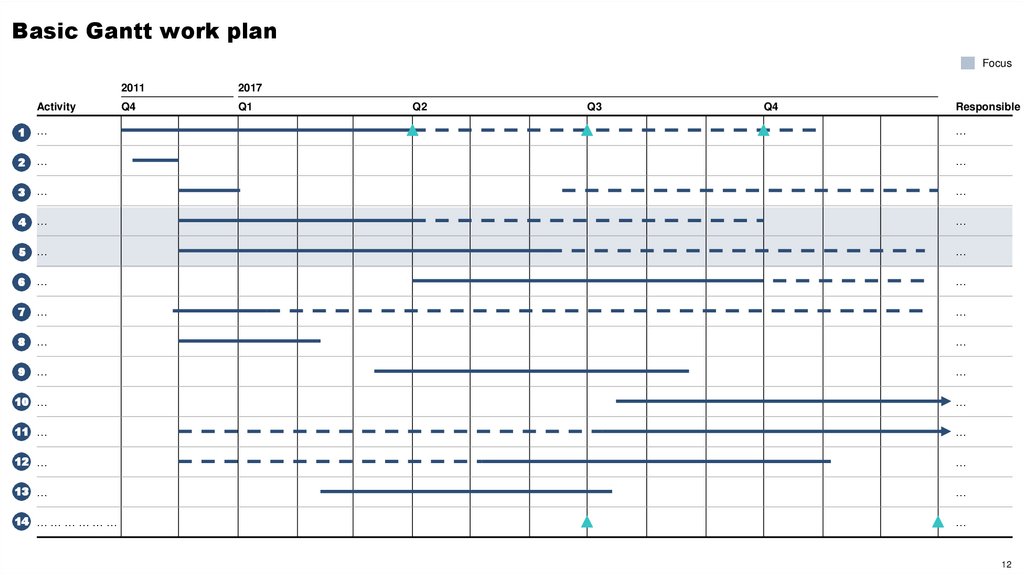
Basic Gantt work planFocus
Activity
2011
2017
Q4
Q1
Q2
Q3
Q4
Responsible
1
…
…
2
…
…
3
…
…
4
…
…
5
…
…
6
…
…
7
…
…
8
…
…
9
…
…
10 …
…
11 …
…
12 …
…
13 …
…
14 … … … … … …
…
12
13.
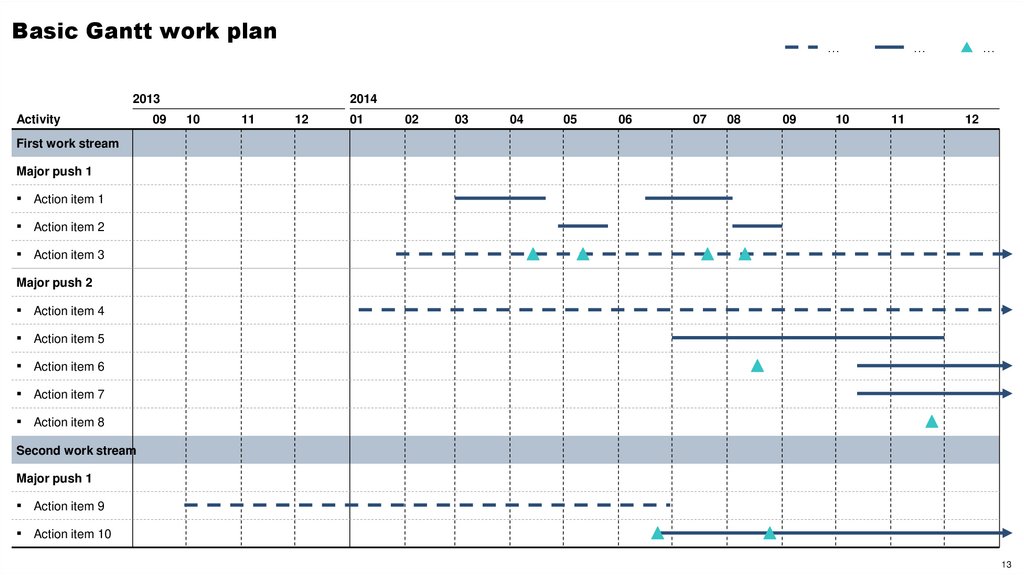
Basic Gantt work plan…
2013
Activity
09
…
…
2014
10
11
12
01
02
03
04
05
06
07
08
09
10
11
12
First work stream
Major push 1
▪ Action item 1
▪ Action item 2
▪ Action item 3
Major push 2
▪ Action item 4
▪ Action item 5
▪ Action item 6
▪ Action item 7
▪ Action item 8
Second work stream
Major push 1
▪ Action item 9
▪ Action item 10
13
14.
Шаблоны слайдов с планом работШаблоны слайдов с процессом
Шаблоны слайдов со структурами/деревом решений
Шаблоны слайдов с горизонтами
Приложение:
шаблоны и
примеры слайдов
Шаблоны слайдов From-to
Шаблоны слайдов с воронками
Шаблоны слайдов с компонентами
Шаблоны слайдов с матрицами
Примеры слайдов с визуализацией числовых данных
14
15.
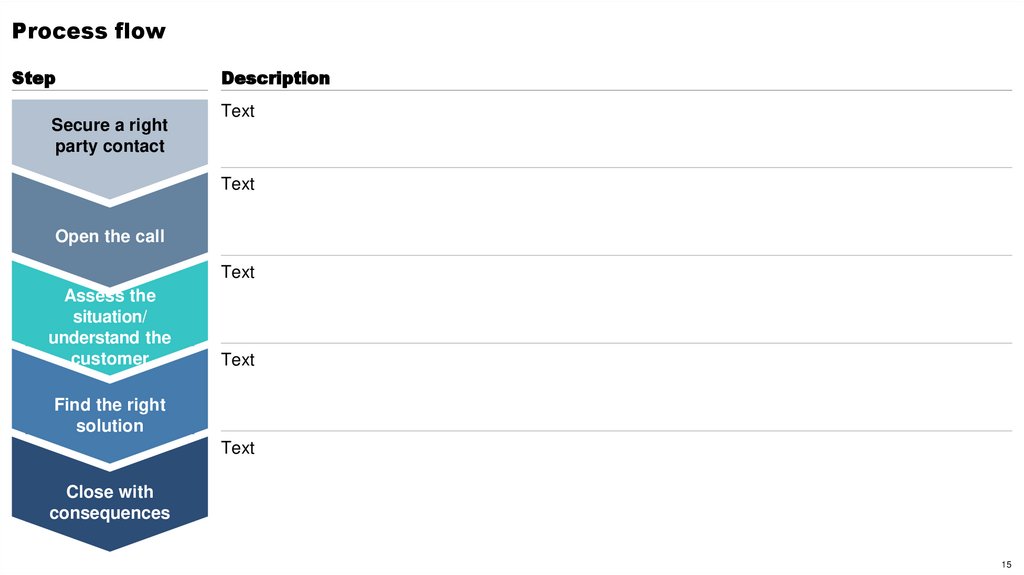
Process flowStep
Secure a right
party contact
Description
Text
Text
Open the call
Text
Assess the
situation/
understand the
customer
Text
Find the right
solution
Text
Close with
consequences
15
16.
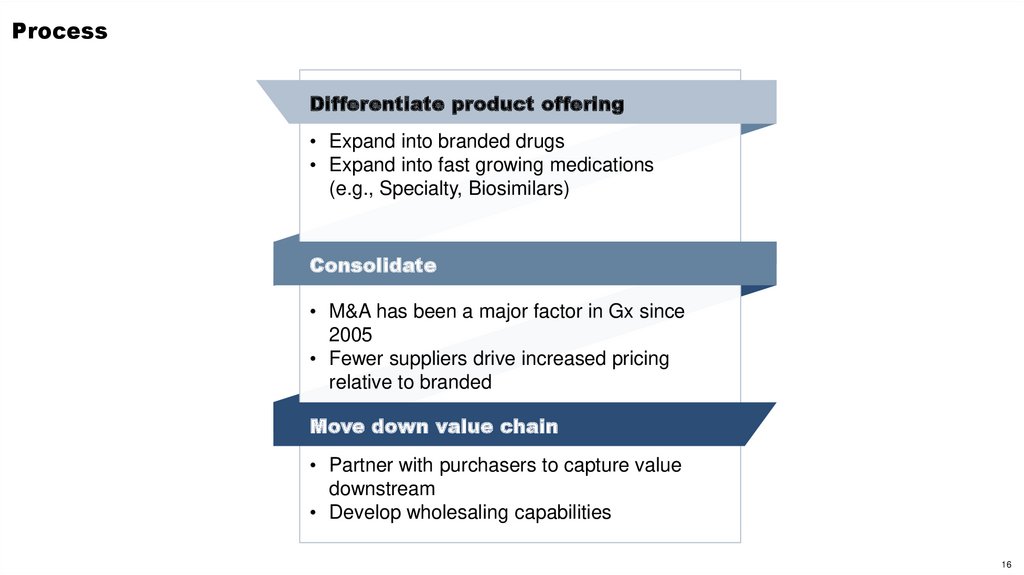
ProcessDifferentiate product offering
• Expand into branded drugs
• Expand into fast growing medications
(e.g., Specialty, Biosimilars)
Consolidate
• M&A has been a major factor in Gx since
2005
• Fewer suppliers drive increased pricing
relative to branded
Move down value chain
• Partner with purchasers to capture value
downstream
• Develop wholesaling capabilities
16
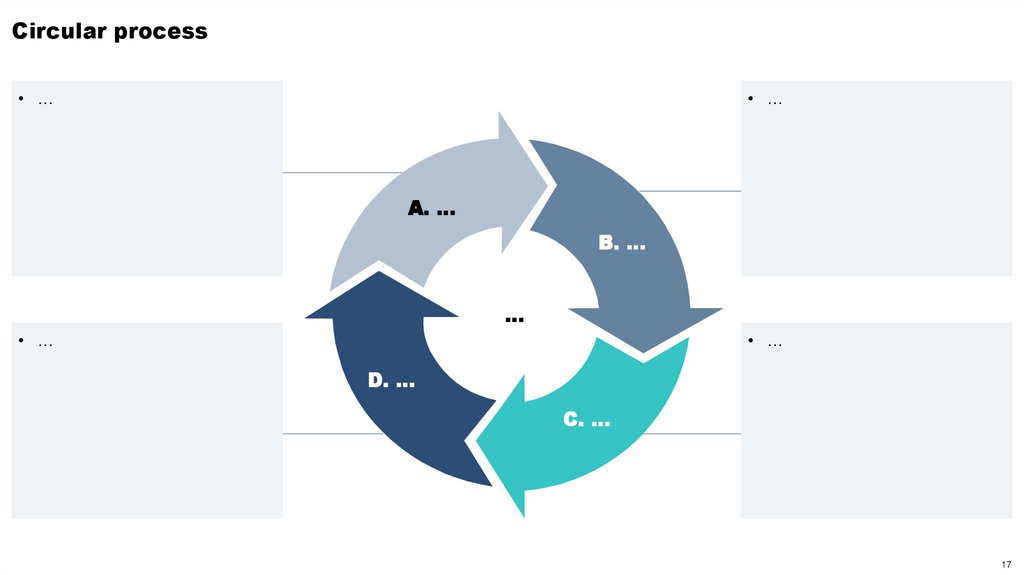
17.
Circular process• …
• …
A. …
B. …
…
• …
• …
D. …
C. …
17
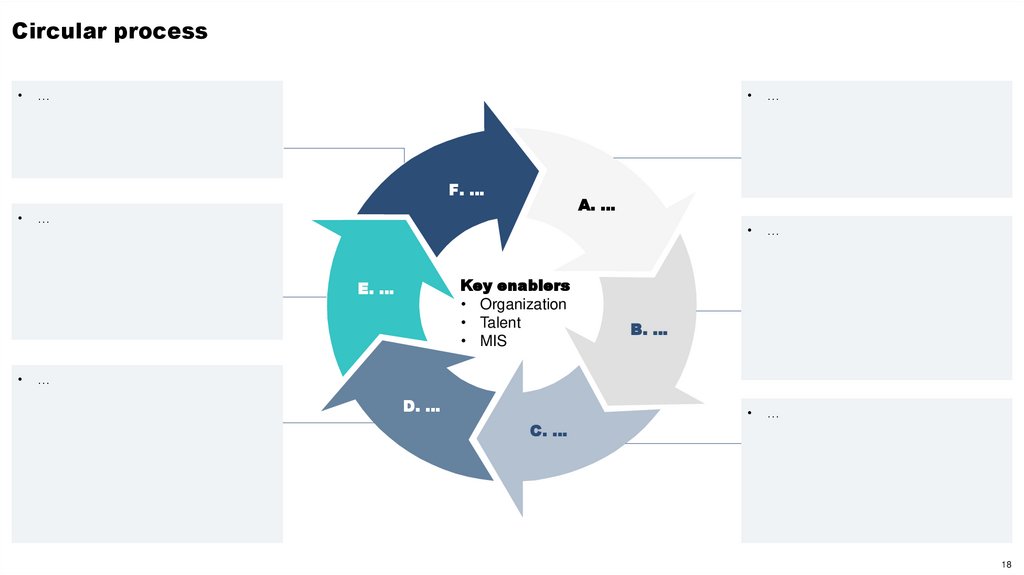
18.
Circular process…
F. …
…
…
…
A. …
…
Key enablers
• Organization
• Talent
• MIS
E. …
B. …
…
D. …
C. …
18
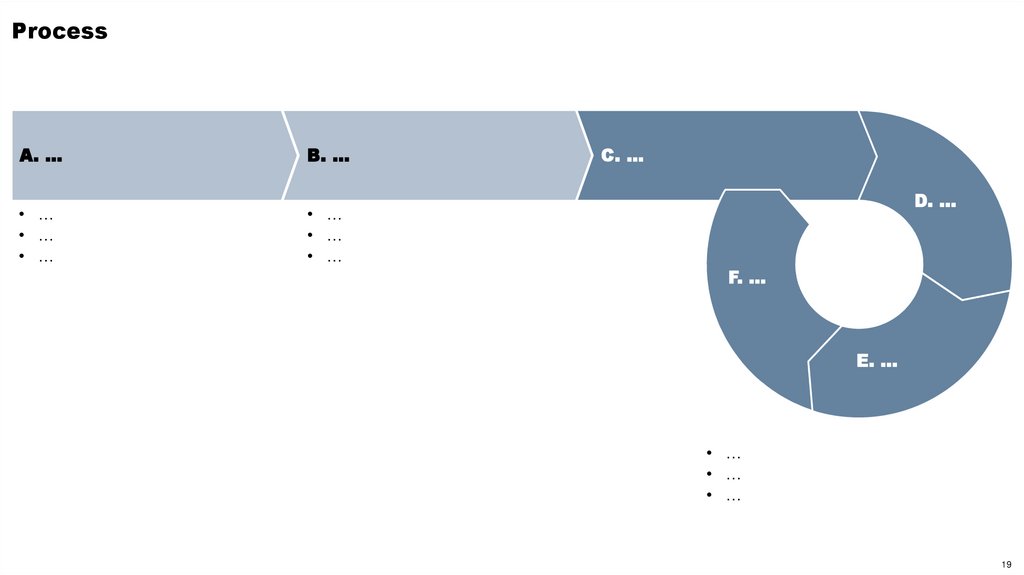
19.
ProcessA. …
B. …
• …
• …
• …
• …
• …
• …
C. …
D. …
F. …
E. …
• …
• …
• …
19
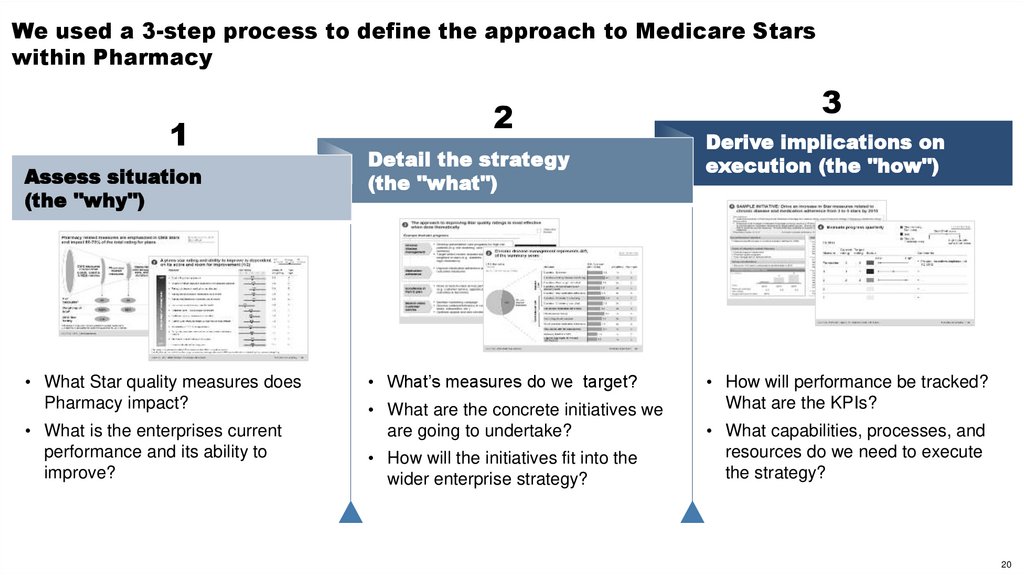
20.
We used a 3-step process to define the approach to Medicare Starswithin Pharmacy
1
Assess situation
(the "why")
• What Star quality measures does
Pharmacy impact?
• What is the enterprises current
performance and its ability to
improve?
2
Detail the strategy
(the "what")
• What’s measures do we target?
• What are the concrete initiatives we
are going to undertake?
• How will the initiatives fit into the
wider enterprise strategy?
3
Derive implications on
execution (the "how")
• How will performance be tracked?
What are the KPIs?
• What capabilities, processes, and
resources do we need to execute
the strategy?
20
21.
Operations readiness assessment overviewSurvey
Readiness assessment
Interviews
Client interviews
Workshop
Initiative read out and
prioritization
Working session
Review client
implementation plan
Timing
January 2013
March 2013
June 2013
2014
Format
10-15 question survey
operational readiness
Interviews with client
functional area leaders
4 hour session with client
leaders to align on capabilities
and priority level
Review working session on
developed implementation
plans with McKinsey experts
• Assessment of high level
• Targeted assessment of
• Review findings to develop
• Present implementation
post reform operational
readiness gaps
• Group consensus on
Outcomes
capability readiness and
prioritization
operational readiness gaps
on "top of mind" post reform
issues
• High level understanding of
gaps and competitive
positioning
common under-standing on
capability current state and
gaps
• Align on priority of capabilities
by strategic need
• Action-plan on how to
plan to McKinsey
operations experts
• Agree on initiatives needed
to close the operational gap
• Align on project timelines
proceed with developing
implementation plans
Client
support
needed
• Identify participants for survey, interviews, and workshop
• Schedule workshop and interview sessions
• Schedule workshop with
operations team and
McKinsey experts
• Create schedule, agenda,
and implementation plans
for working session with
McKinsey operations
experts
21
22.
Шаблоны слайдов с планом работШаблоны слайдов с процессом
Шаблоны слайдов со структурами/деревом решений
Шаблоны слайдов с горизонтами
Приложение:
шаблоны и
примеры слайдов
Шаблоны слайдов From-to
Шаблоны слайдов с воронками
Шаблоны слайдов с компонентами
Шаблоны слайдов с матрицами
Примеры слайдов с визуализацией числовых данных
22
23.
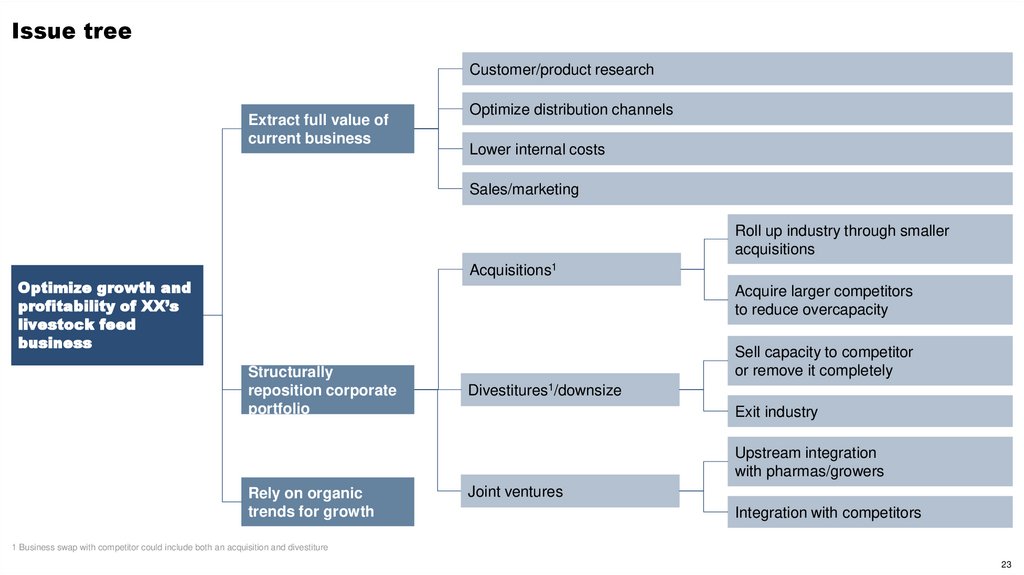
Issue treeCustomer/product research
Extract full value of
current business
Optimize distribution channels
Lower internal costs
Sales/marketing
Roll up industry through smaller
acquisitions
Acquisitions1
Optimize growth and
profitability of XX’s
livestock feed
business
Acquire larger competitors
to reduce overcapacity
Structurally
reposition corporate
portfolio
Sell capacity to competitor
or remove it completely
Divestitures1/downsize
Exit industry
Upstream integration
with pharmas/growers
Rely on organic
trends for growth
Joint ventures
Integration with competitors
1 Business swap with competitor could include both an acquisition and divestiture
23
24.
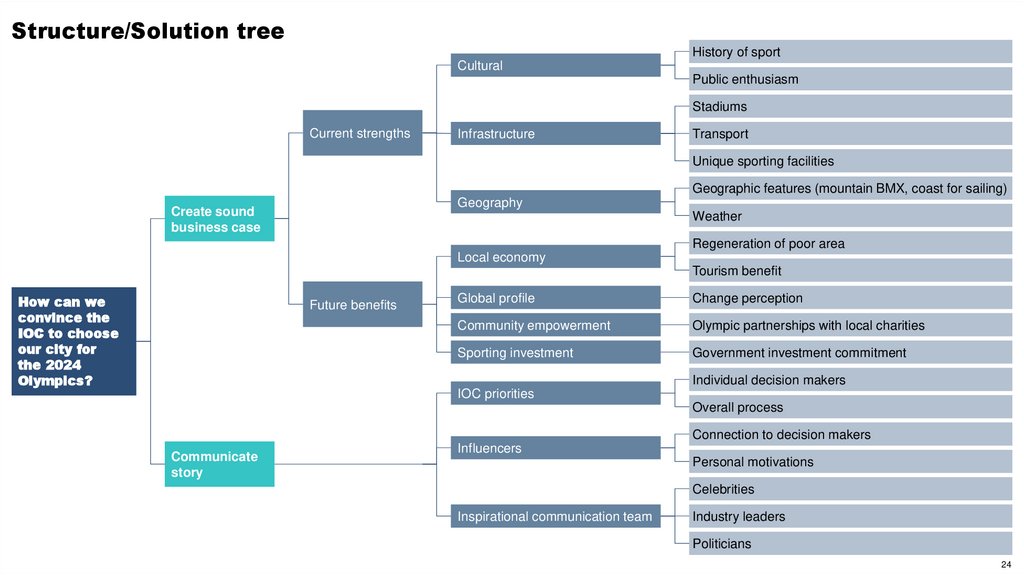
Structure/Solution treeHistory of sport
Cultural
Public enthusiasm
Stadiums
Current strengths
Infrastructure
Transport
Unique sporting facilities
Geographic features (mountain BMX, coast for sailing)
Geography
Create sound
business case
Weather
Regeneration of poor area
Local economy
Tourism benefit
How can we
convince the
IOC to choose
our city for
the 2024
Olympics?
Future benefits
Global profile
Change perception
Community empowerment
Olympic partnerships with local charities
Sporting investment
Government investment commitment
Individual decision makers
IOC priorities
Overall process
Connection to decision makers
Communicate
story
Influencers
Personal motivations
Celebrities
Inspirational communication team
Industry leaders
Politicians
24
25.
Structure/Solution treeHeading
• Text
Text
• Text
Text
Text
• Text
Text
Text
• Text
Text
• Text
Text
Text
• Text
Text
25
26.
Structure/Solution treeText
Text
Text
Text
• Text
• Text
• Text
• Text
• Text
• Text
Text
Text
Text
Text
26
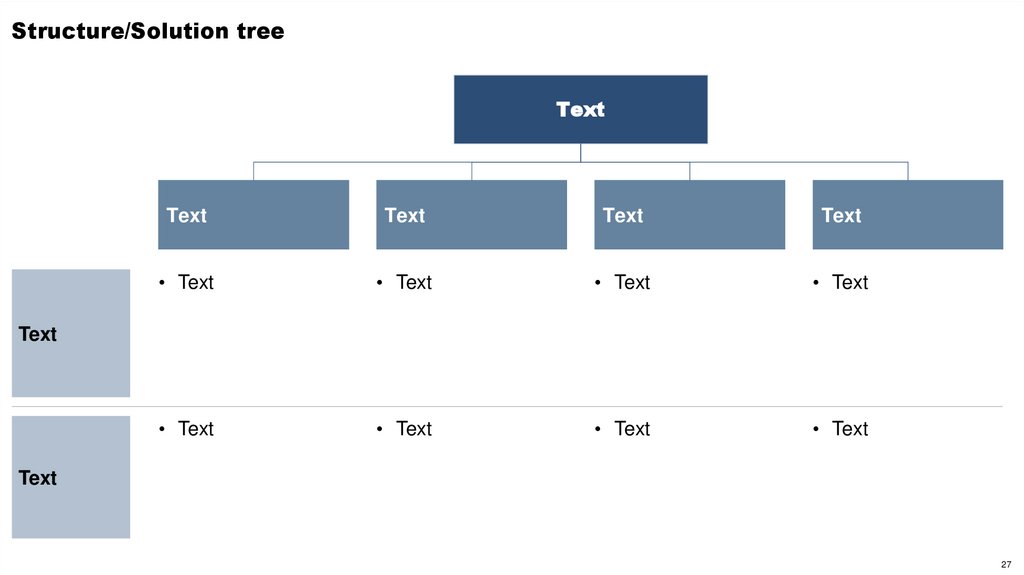
27.
Structure/Solution treeText
Text
Text
Text
Text
• Text
• Text
• Text
• Text
• Text
• Text
• Text
• Text
Text
Text
27
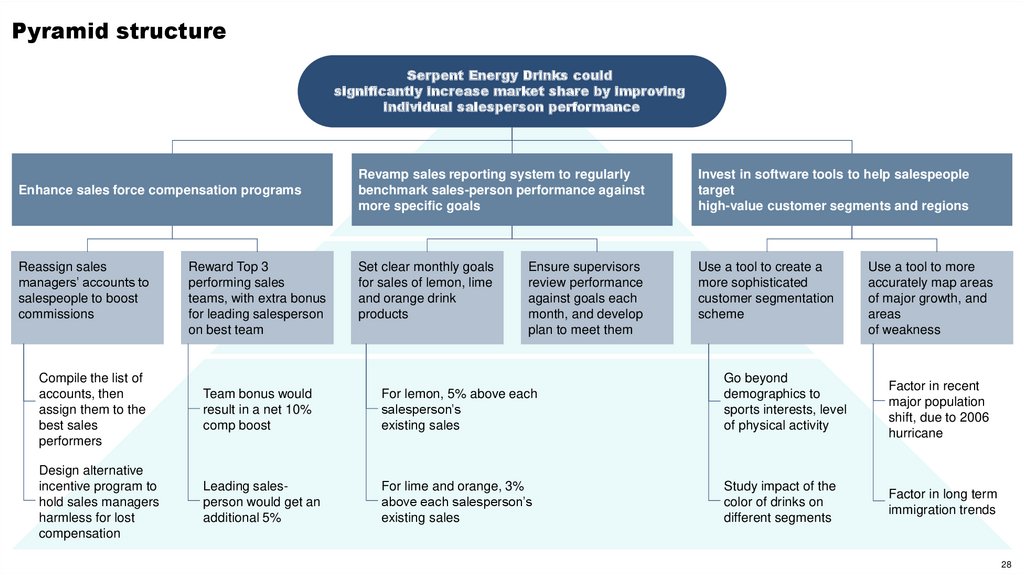
28.
Pyramid structureSerpent Energy Drinks could
significantly increase market share by improving
individual salesperson performance
Enhance sales force compensation programs
Revamp sales reporting system to regularly
benchmark sales-person performance against
more specific goals
Invest in software tools to help salespeople
target
high-value customer segments and regions
Reassign sales
managers’ accounts to
salespeople to boost
commissions
Set clear monthly goals
for sales of lemon, lime
and orange drink
products
Use a tool to create a
more sophisticated
customer segmentation
scheme
Reward Top 3
performing sales
teams, with extra bonus
for leading salesperson
on best team
Ensure supervisors
review performance
against goals each
month, and develop
plan to meet them
Compile the list of
accounts, then
assign them to the
best sales
performers
Team bonus would
result in a net 10%
comp boost
For lemon, 5% above each
salesperson’s
existing sales
Go beyond
demographics to
sports interests, level
of physical activity
Design alternative
incentive program to
hold sales managers
harmless for lost
compensation
Leading salesperson would get an
additional 5%
For lime and orange, 3%
above each salesperson’s
existing sales
Study impact of the
color of drinks on
different segments
Use a tool to more
accurately map areas
of major growth, and
areas
of weakness
Factor in recent
major population
shift, due to 2006
hurricane
Factor in long term
immigration trends
28
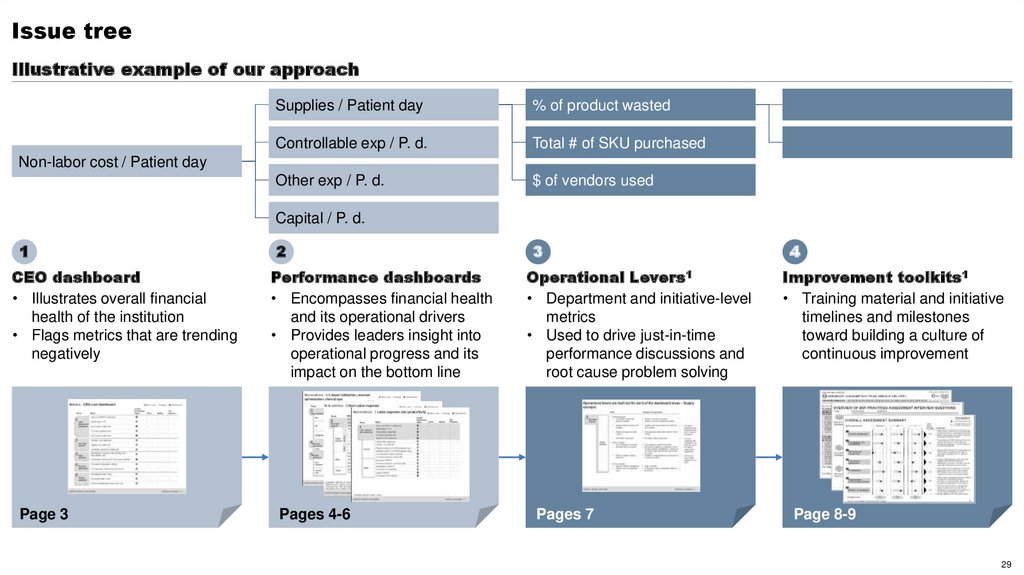
29.
Issue treeIllustrative example of our approach
Supplies / Patient day
% of product wasted
Controllable exp / P. d.
Total # of SKU purchased
Other exp / P. d.
$ of vendors used
Non-labor cost / Patient day
Capital / P. d.
1
CEO dashboard
• Illustrates overall financial
health of the institution
• Flags metrics that are trending
negatively
Page 3
2
Performance dashboards
• Encompasses financial health
and its operational drivers
• Provides leaders insight into
operational progress and its
impact on the bottom line
Pages 4-6
3
Operational Levers1
• Department and initiative-level
metrics
• Used to drive just-in-time
performance discussions and
root cause problem solving
Pages 7
4
Improvement toolkits1
• Training material and initiative
timelines and milestones
toward building a culture of
continuous improvement
Page 8-9
29
30.
Шаблоны слайдов с планом работШаблоны слайдов с процессом
Шаблоны слайдов со структурами/деревом решений
Шаблоны слайдов с горизонтами
Приложение:
шаблоны и
примеры слайдов
Шаблоны слайдов From-to
Шаблоны слайдов с воронками
Шаблоны слайдов с компонентами
Шаблоны слайдов с матрицами
Примеры слайдов с визуализацией числовых данных
30
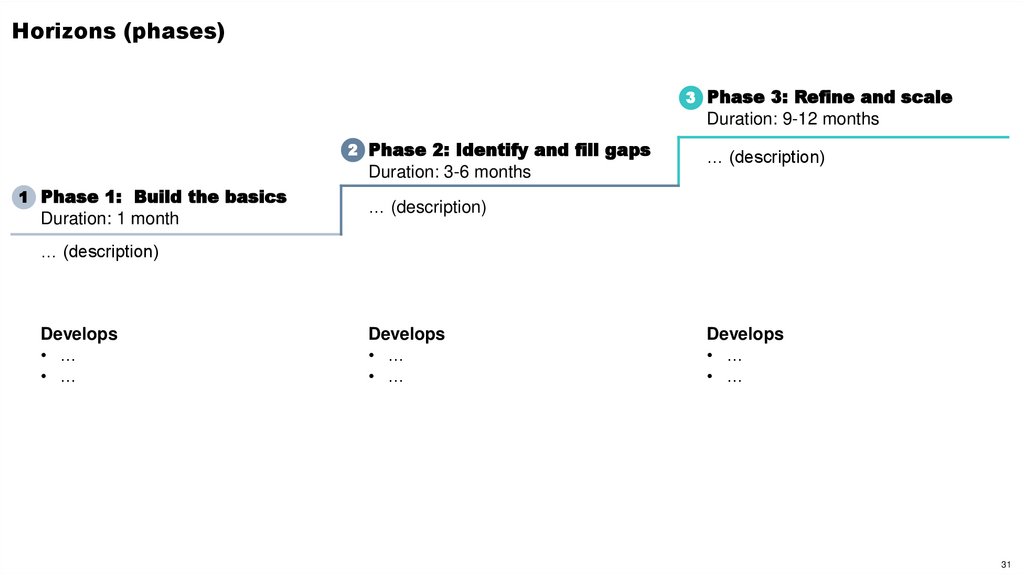
31.
Horizons (phases)3 Phase 3: Refine and scale
Duration: 9-12 months
2 Phase 2: Identify and fill gaps
Duration: 3-6 months
1 Phase 1: Build the basics
Duration: 1 month
… (description)
… (description)
… (description)
Develops
• …
• …
Develops
• …
• …
Develops
• …
• …
31
32.
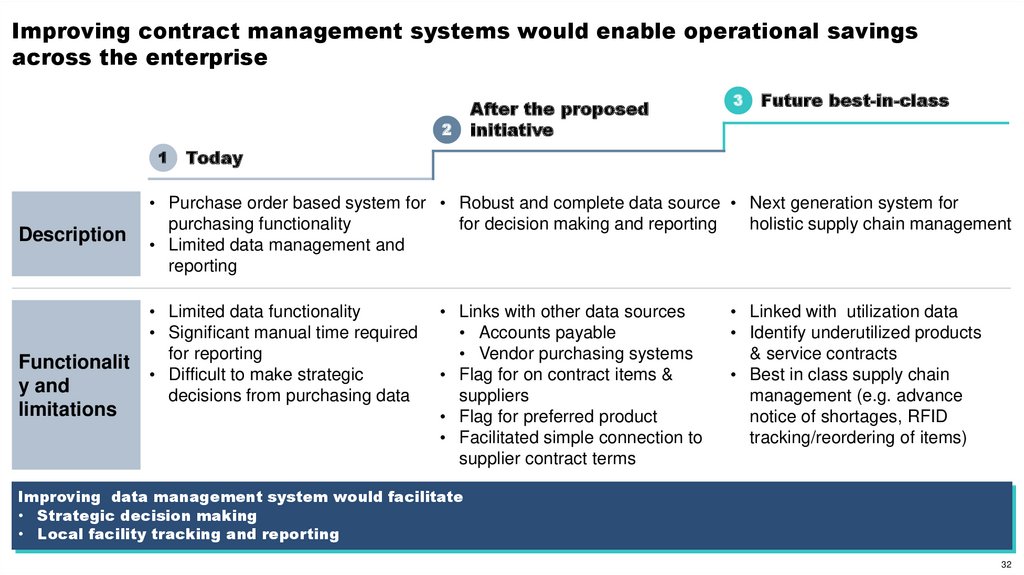
Improving contract management systems would enable operational savingsacross the enterprise
2
1
Description
Functionalit
y and
limitations
After the proposed
initiative
3
Future best-in-class
Today
• Purchase order based system for • Robust and complete data source • Next generation system for
purchasing functionality
for decision making and reporting
holistic supply chain management
• Limited data management and
reporting
• Limited data functionality
• Significant manual time required
for reporting
• Difficult to make strategic
decisions from purchasing data
• Links with other data sources
• Accounts payable
• Vendor purchasing systems
• Flag for on contract items &
suppliers
• Flag for preferred product
• Facilitated simple connection to
supplier contract terms
• Linked with utilization data
• Identify underutilized products
& service contracts
• Best in class supply chain
management (e.g. advance
notice of shortages, RFID
tracking/reordering of items)
Improving data management system would facilitate
• Strategic decision making
• Local facility tracking and reporting
32
33.
Шаблоны слайдов с планом работШаблоны слайдов с процессом
Шаблоны слайдов со структурами/деревом решений
Шаблоны слайдов с горизонтами
Приложение:
шаблоны и
примеры слайдов
Шаблоны слайдов From-to
Шаблоны слайдов с воронками
Шаблоны слайдов с компонентами
Шаблоны слайдов с матрицами
Примеры слайдов с визуализацией числовых данных
33
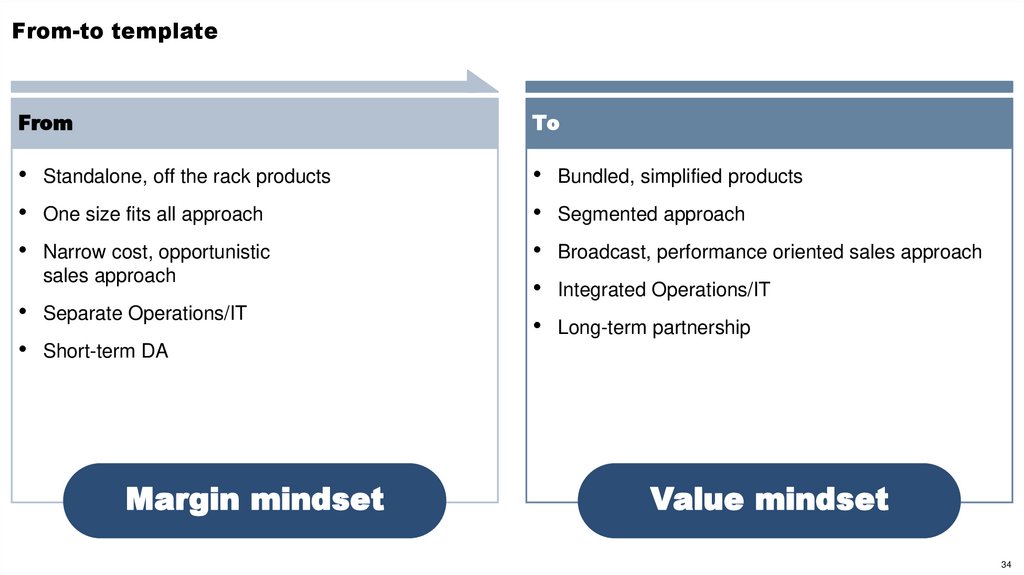
34.
From-to templateFrom
To
Standalone, off the rack products
Bundled, simplified products
One size fits all approach
Segmented approach
Narrow cost, opportunistic
sales approach
Broadcast, performance oriented sales approach
Integrated Operations/IT
Separate Operations/IT
Long-term partnership
Short-term DA
Margin mindset
Value mindset
34
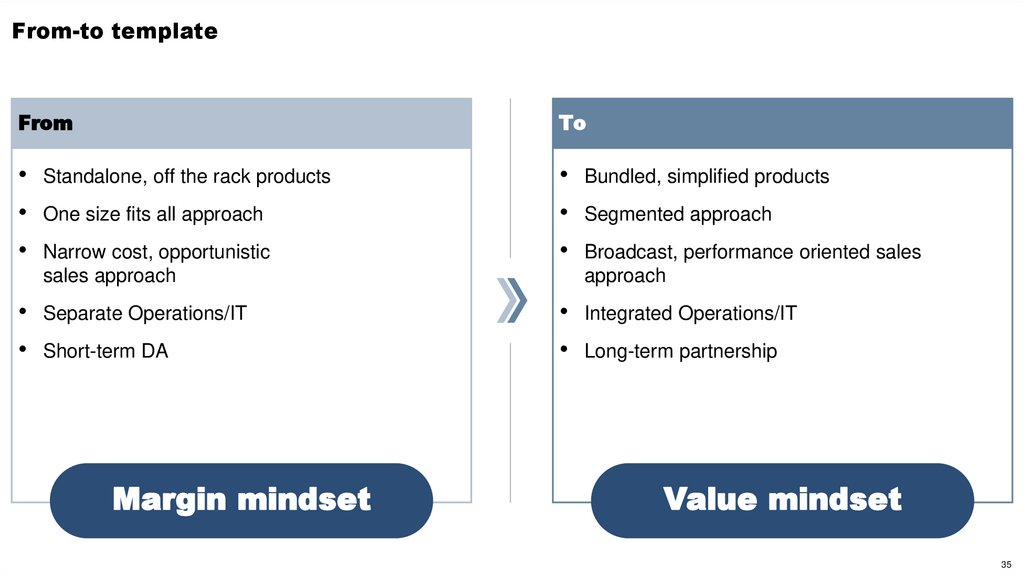
35.
From-to templateFrom
To
Standalone, off the rack products
Bundled, simplified products
One size fits all approach
Segmented approach
Narrow cost, opportunistic
sales approach
Broadcast, performance oriented sales
approach
Separate Operations/IT
Integrated Operations/IT
Short-term DA
Long-term partnership
Margin mindset
Value mindset
35
36.
From-to templateTitle
Title
36
37.
From-to templateFrom …
To …
• …
• …
• …
• …
• …
• …
• …
• …
• …
• …
…
…
…
…
…
37
38.
From-to templateCurrent state
Title
• …
• …
• …
• …
• …
Behavior changes
icon
icon
icon
icon
icon
…
Future state
…
…
…
…
…
…
…
…
…
38
39.
Situation-Complication-resolution templateSituation
Complication
Resolution
• Text
• Text
• Text
39
40.
From-to template…
• …
• …
• …
…
• …
• …
• …
40
41.
Шаблоны слайдов с планом работШаблоны слайдов с процессом
Шаблоны слайдов со структурами/деревом решений
Шаблоны слайдов с горизонтами
Приложение:
шаблоны и
примеры слайдов
Шаблоны слайдов From-to
Шаблоны слайдов с воронками
Шаблоны слайдов с компонентами
Шаблоны слайдов с матрицами
Примеры слайдов с визуализацией числовых данных
41
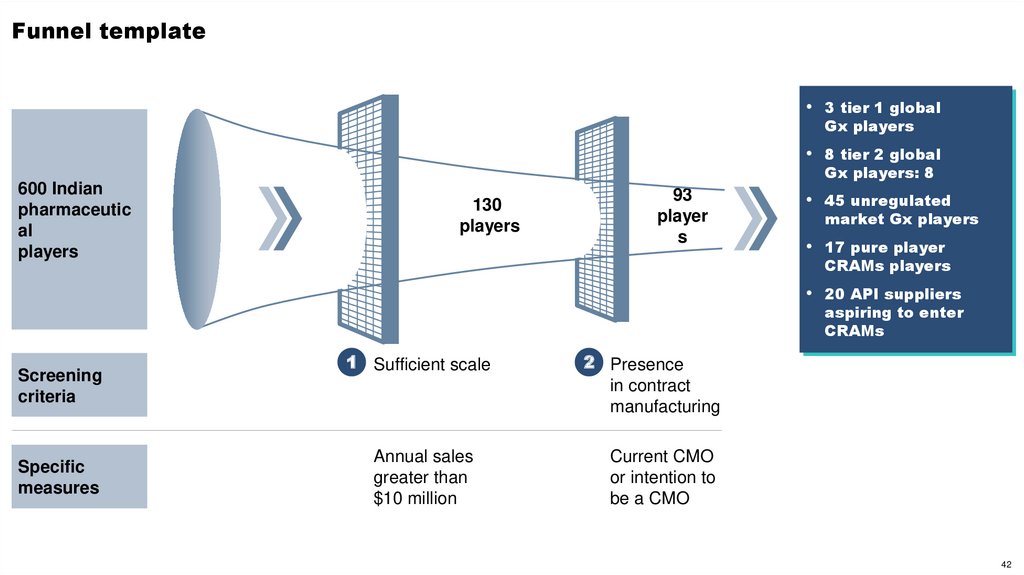
42.
Funnel template• 3 tier 1 global
Gx players
• 8 tier 2 global
Gx players: 8
600 Indian
pharmaceutic
al
players
130
players
93
player
s
• 45 unregulated
market Gx players
• 17 pure player
CRAMs players
• 20 API suppliers
aspiring to enter
CRAMs
Screening
criteria
Specific
measures
1 Sufficient scale
Annual sales
greater than
$10 million
2 Presence
in contract
manufacturing
Current CMO
or intention to
be a CMO
42
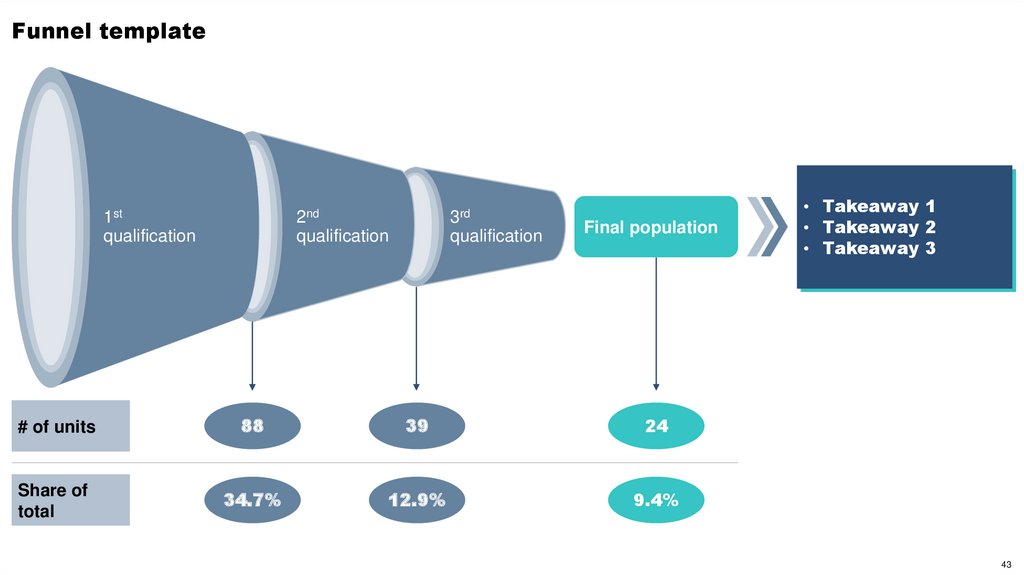
43.
Funnel template1st
qualification
2nd
qualification
3rd
qualification
Final population
# of units
88
39
24
Share of
total
34.7%
12.9%
9.4%
• Takeaway 1
• Takeaway 2
• Takeaway 3
43
44.
Funnel templateText
• ...
• …
Text
• ...
• …
Text
• ...
• …
Text
• ...
• …
44
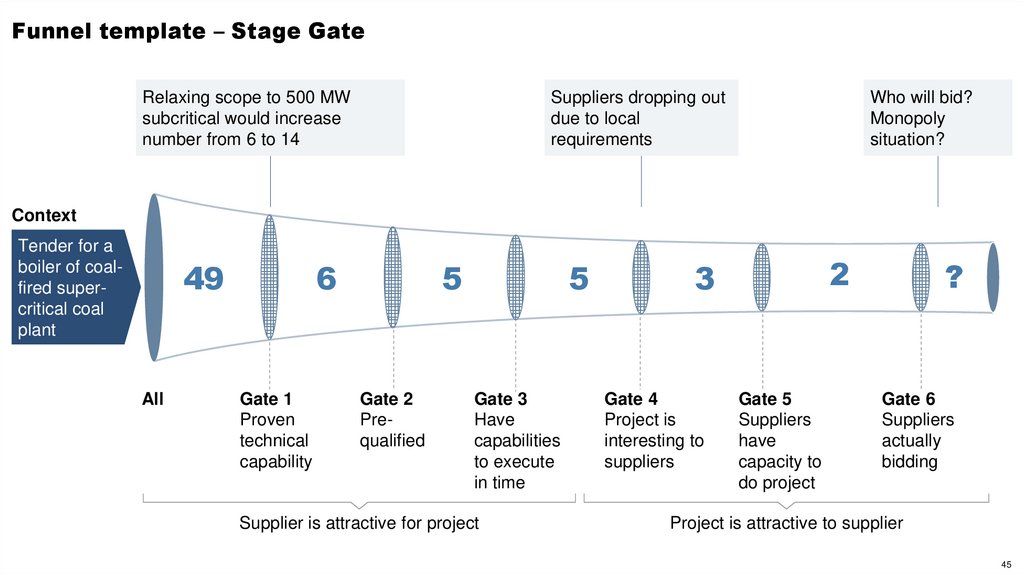
45.
Funnel template – Stage GateRelaxing scope to 500 MW
subcritical would increase
number from 6 to 14
Suppliers dropping out
due to local
requirements
Who will bid?
Monopoly
situation?
Context
Tender for a
boiler of coalfired supercritical coal
plant
49
All
6
Gate 1
Proven
technical
capability
5
Gate 2
Prequalified
5
Gate 3
Have
capabilities
to execute
in time
Supplier is attractive for project
2
3
Gate 4
Project is
interesting to
suppliers
Gate 5
Suppliers
have
capacity to
do project
?
Gate 6
Suppliers
actually
bidding
Project is attractive to supplier
45
46.
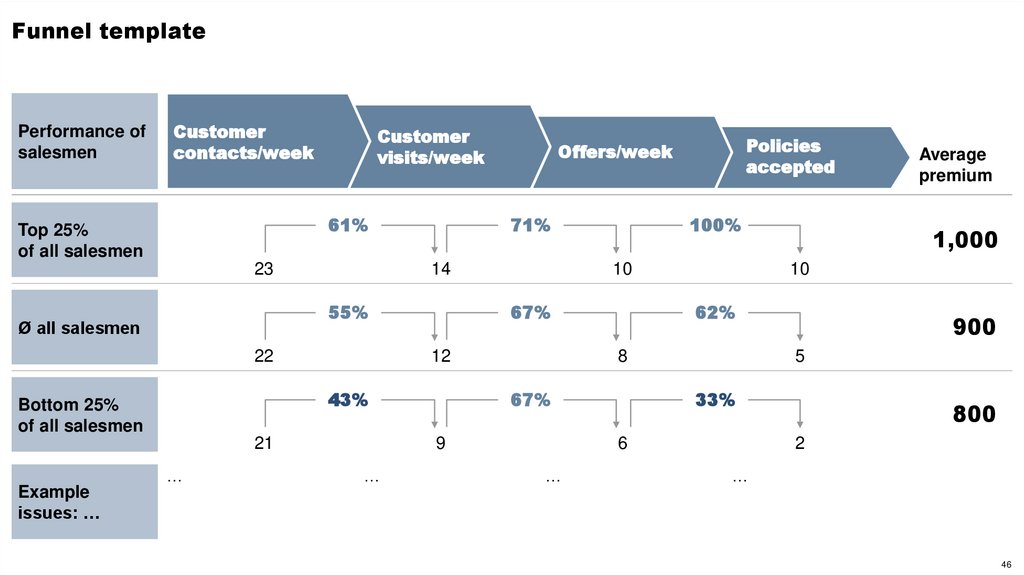
Funnel templatePerformance of
salesmen
Customer
contacts/week
Customer
visits/week
61%
Top 25%
of all salesmen
23
71%
14
55%
Ø all salesmen
22
…
10
12
21
900
5
33%
6
…
1,000
62%
67%
Average
premium
10
8
9
…
100%
67%
43%
Bottom 25%
of all salesmen
Policies
accepted
Offers/week
800
2
…
Example
issues: …
46
47.
Шаблоны слайдов с планом работШаблоны слайдов с процессом
Шаблоны слайдов со структурами/деревом решений
Шаблоны слайдов с горизонтами
Приложение:
шаблоны и
примеры слайдов
Шаблоны слайдов From-to
Шаблоны слайдов с воронками
Шаблоны слайдов с компонентами
Шаблоны слайдов с матрицами
Примеры слайдов с визуализацией числовых данных
47
48.
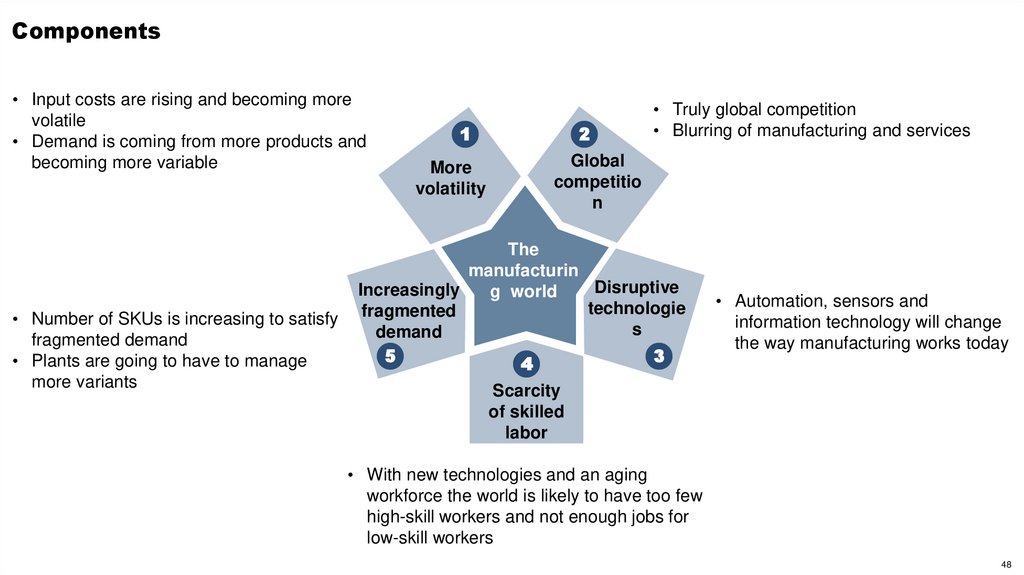
Components• Input costs are rising and becoming more
volatile
• Demand is coming from more products and
becoming more variable
• Number of SKUs is increasing to satisfy
fragmented demand
• Plants are going to have to manage
more variants
1
2
• Truly global competition
• Blurring of manufacturing and services
Global
competitio
n
More
volatility
The
manufacturin
Disruptive
Increasingly
g world
technologie
fragmented
s
demand
5
4
3
• Automation, sensors and
information technology will change
the way manufacturing works today
Scarcity
of skilled
labor
• With new technologies and an aging
workforce the world is likely to have too few
high-skill workers and not enough jobs for
low-skill workers
48
49.
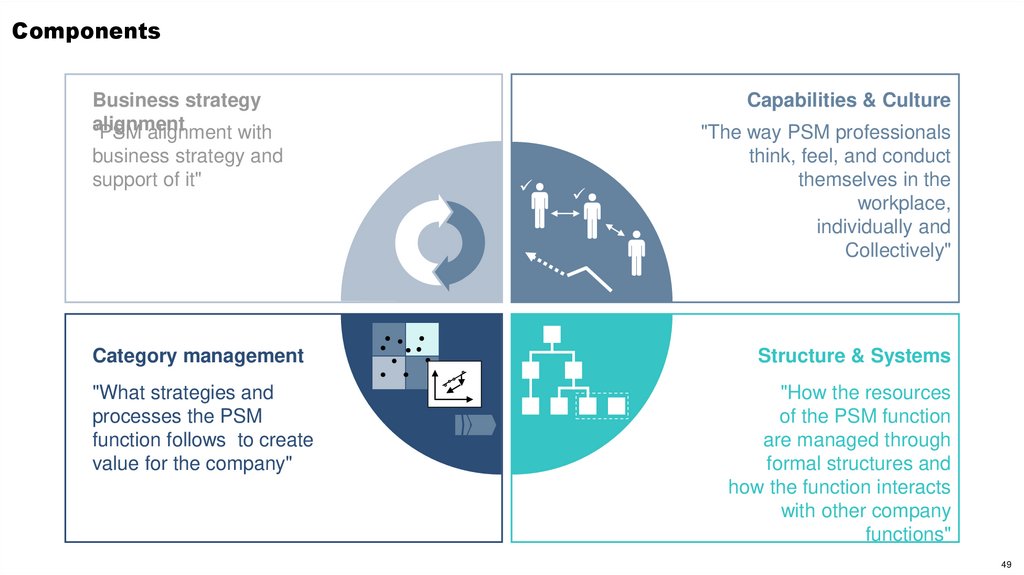
ComponentsBusiness strategy
alignment
"PSM alignment with
business strategy and
support of it"
Category management
"What strategies and
processes the PSM
function follows to create
value for the company"
Capabilities & Culture
"The way PSM professionals
think, feel, and conduct
themselves in the
workplace,
individually and
Collectively"
Structure & Systems
"How the resources
of the PSM function
are managed through
formal structures and
how the function interacts
with other company
functions"
49
50.
Components…
…
…
…
…
…
…
…
…
…
…
…
…
50
51.
Components…
…
…
…
…
…
…
51
52.
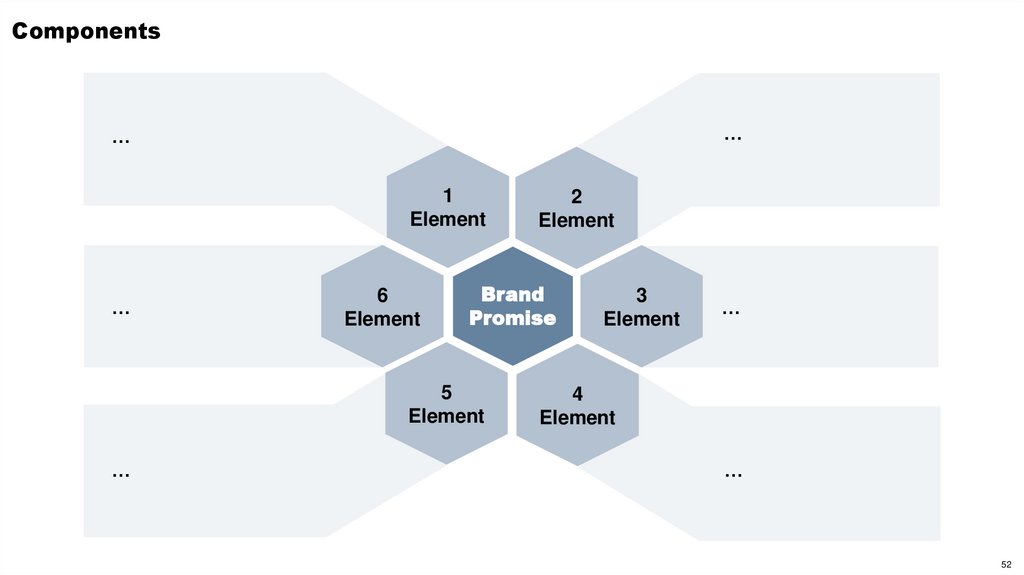
Components…
…
1
Element
…
6
Element
Brand
Promise
5
Element
…
2
Element
3
Element
…
4
Element
…
52
53.
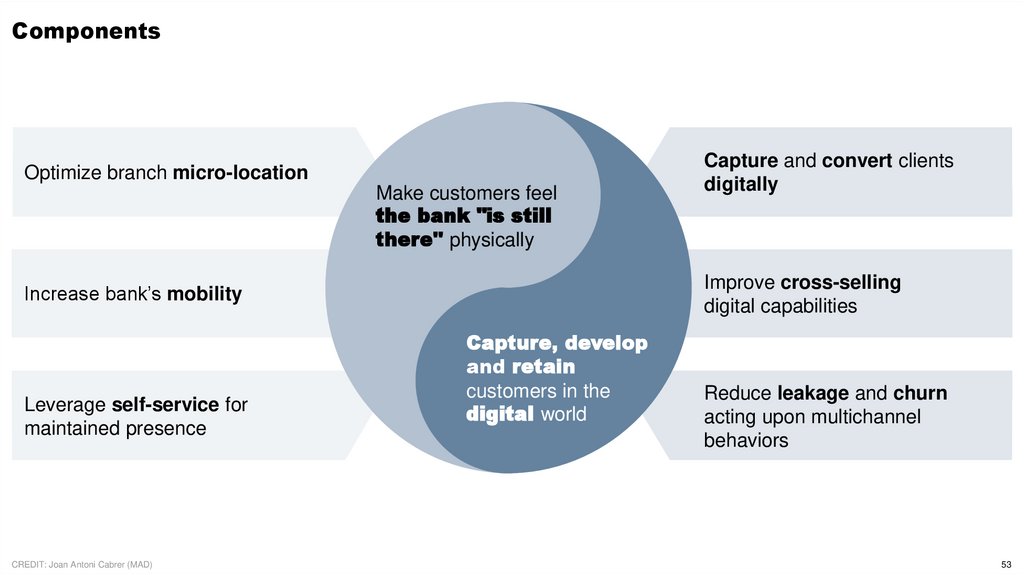
ComponentsOptimize branch micro-location
Make customers feel
the bank "is still
there" physically
Improve cross-selling
digital capabilities
Increase bank’s mobility
Leverage self-service for
maintained presence
CREDIT: Joan Antoni Cabrer (MAD)
Capture and convert clients
digitally
Capture, develop
and retain
customers in the
digital world
Reduce leakage and churn
acting upon multichannel
behaviors
53
54.
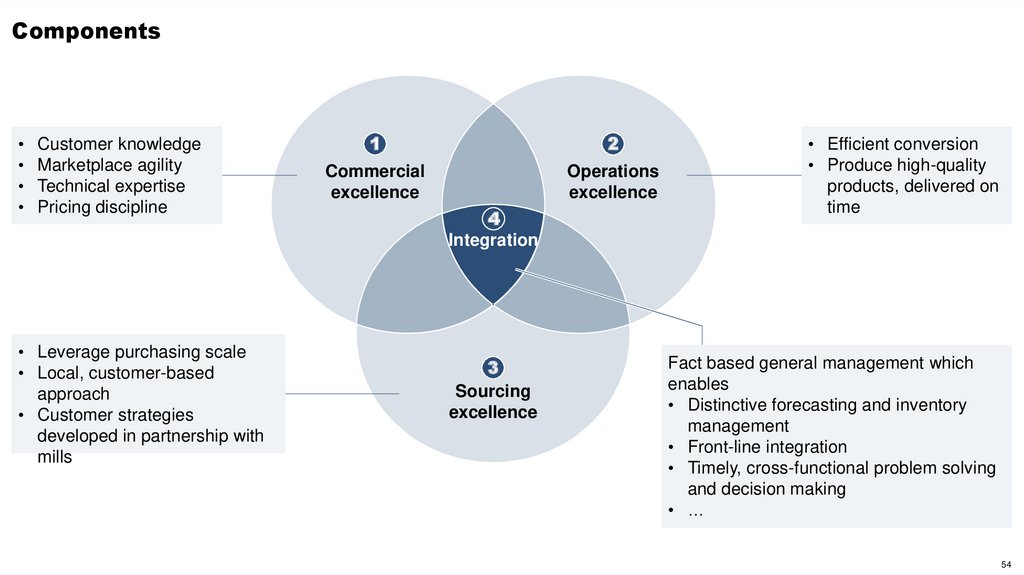
ComponentsCustomer knowledge
Marketplace agility
Technical expertise
Pricing discipline
• Leverage purchasing scale
• Local, customer-based
approach
• Customer strategies
developed in partnership with
mills
1
2
Commercial
excellence
Operations
excellence
4
Integration
3
Sourcing
excellence
• Efficient conversion
• Produce high-quality
products, delivered on
time
Fact based general management which
enables
• Distinctive forecasting and inventory
management
• Front-line integration
• Timely, cross-functional problem solving
and decision making
• …
54
55.
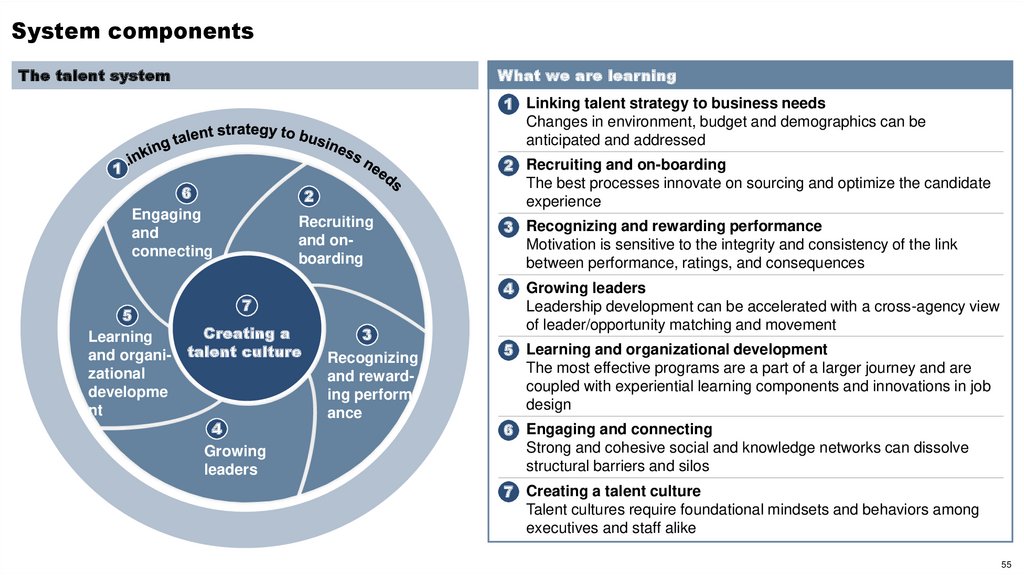
System componentsThe talent system
What we are learning
1 Linking talent strategy to business needs
Changes in environment, budget and demographics can be
anticipated and addressed
2 Recruiting and on-boarding
The best processes innovate on sourcing and optimize the candidate
experience
1
6
Engaging
and
connecting
5
Learning
and organizational
developme
nt
2
Recruiting
and onboarding
7
Creating a
talent culture
4
Growing
leaders
3
Recognizing
and rewarding performance
3 Recognizing and rewarding performance
Motivation is sensitive to the integrity and consistency of the link
between performance, ratings, and consequences
4 Growing leaders
Leadership development can be accelerated with a cross-agency view
of leader/opportunity matching and movement
5 Learning and organizational development
The most effective programs are a part of a larger journey and are
coupled with experiential learning components and innovations in job
design
6 Engaging and connecting
Strong and cohesive social and knowledge networks can dissolve
structural barriers and silos
7 Creating a talent culture
Talent cultures require foundational mindsets and behaviors among
executives and staff alike
55
56.
Components• …
• …
Element 1
• …
• …
Element 2
• …
• …
Element 3
56
57.
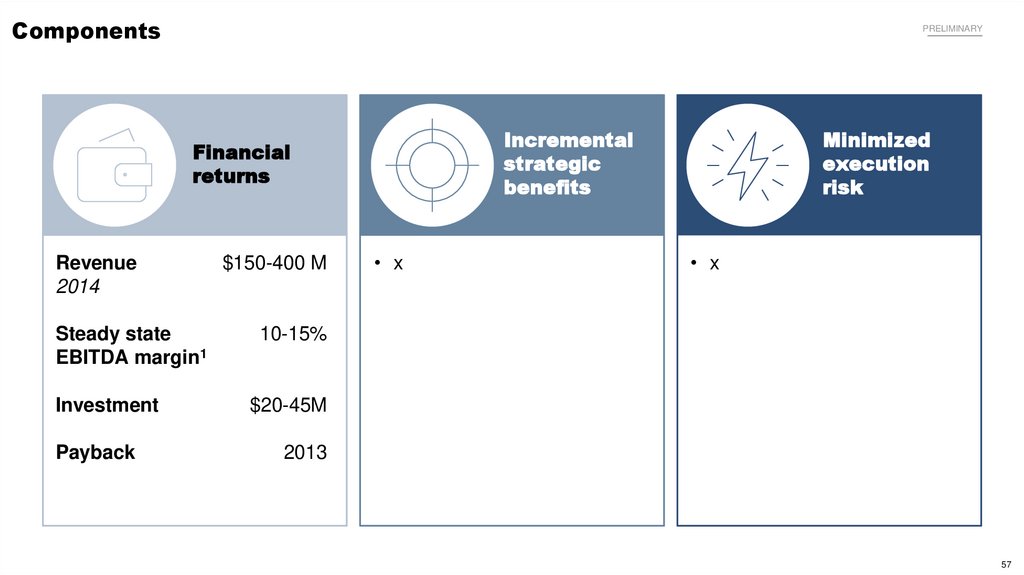
ComponentsPRELIMINARY
Incremental
strategic
benefits
Financial
returns
Revenue
2014
Steady state
EBITDA margin1
Investment
Payback
$150-400 M
• x
Minimized
execution
risk
• x
10-15%
$20-45M
2013
57
58.
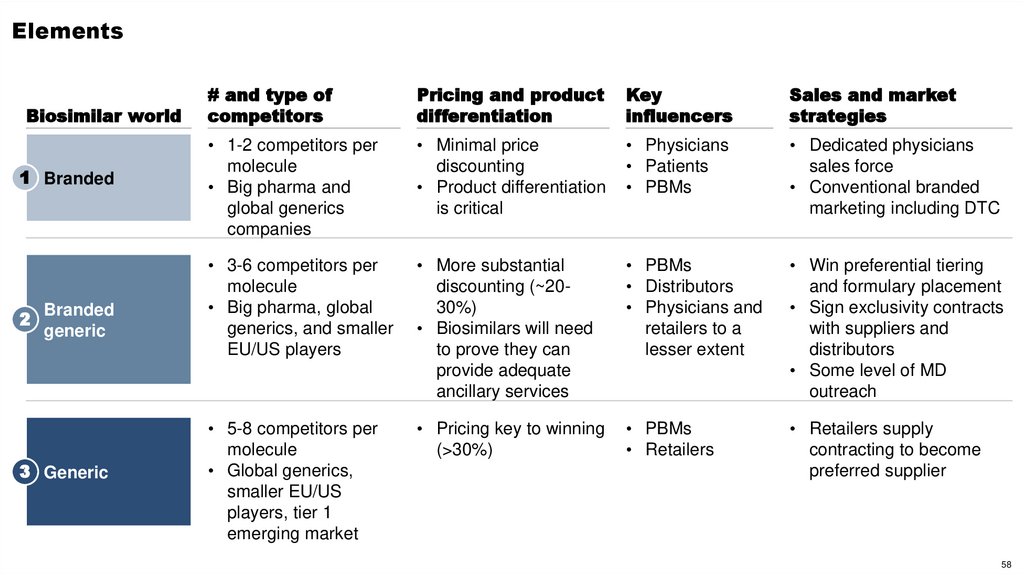
ElementsBiosimilar world
1 Branded
2
Branded
generic
3 Generic
# and type of
competitors
Pricing and product
differentiation
Key
influencers
Sales and market
strategies
• 1-2 competitors per
molecule
• Big pharma and
global generics
companies
• Minimal price
discounting
• Product differentiation
is critical
• Physicians
• Patients
• PBMs
• Dedicated physicians
sales force
• Conventional branded
marketing including DTC
• 3-6 competitors per
molecule
• Big pharma, global
generics, and smaller
EU/US players
• More substantial
discounting (~2030%)
• Biosimilars will need
to prove they can
provide adequate
ancillary services
• PBMs
• Distributors
• Physicians and
retailers to a
lesser extent
• Win preferential tiering
and formulary placement
• Sign exclusivity contracts
with suppliers and
distributors
• Some level of MD
outreach
• 5-8 competitors per
molecule
• Global generics,
smaller EU/US
players, tier 1
emerging market
• Pricing key to winning
(>30%)
• PBMs
• Retailers
• Retailers supply
contracting to become
preferred supplier
58
59.
Шаблоны слайдов с планом работШаблоны слайдов с процессом
Шаблоны слайдов со структурами/деревом решений
Шаблоны слайдов с горизонтами
Приложение:
шаблоны и
примеры слайдов
Шаблоны слайдов From-to
Шаблоны слайдов с воронками
Шаблоны слайдов с компонентами
Шаблоны слайдов с матрицами
Примеры слайдов с визуализацией числовых данных
59
60.
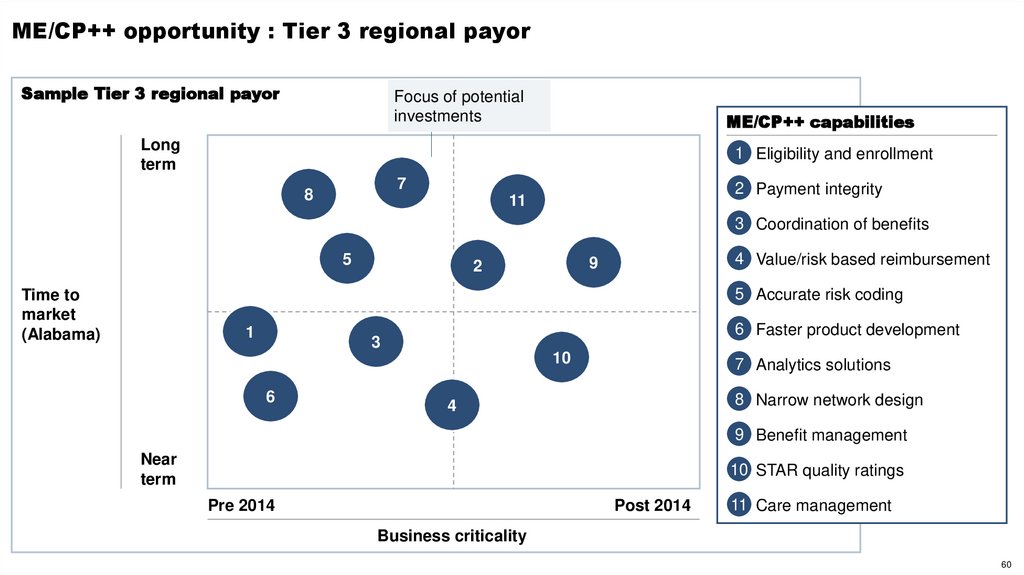
ME/CP++ opportunity : Tier 3 regional payorSample Tier 3 regional payor
Focus of potential
investments
ME/CP++ capabilities
Long
term
1▪ Eligibility and enrollment
2▪ Payment integrity
7
8
11
3▪ Coordination of benefits
5
4▪ Value/risk based reimbursement
9
2
5▪ Accurate risk coding
Time to
market
(Alabama)
1
6▪ Faster product development
3
10
6
7▪ Analytics solutions
8▪ Narrow network design
4
9▪ Benefit management
Near
term
10
▪ STAR quality ratings
Pre 2014
Post 2014
11
▪ Care management
Business criticality
60
61.
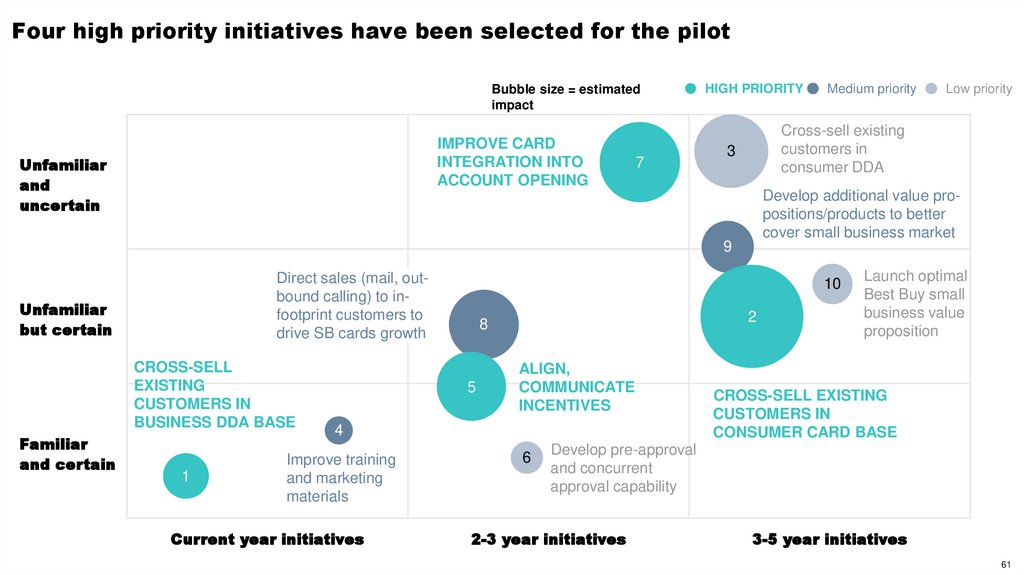
Four high priority initiatives have been selected for the pilotBubble size = estimated
impact
IMPROVE CARD
INTEGRATION INTO
ACCOUNT OPENING
Unfamiliar
and
uncertain
7
HIGH PRIORITY
Medium priority
Low priority
Cross-sell existing
customers in
consumer DDA
3
Develop additional value propositions/products to better
cover small business market
9
Direct sales (mail, outbound calling) to infootprint customers to
drive SB cards growth
Unfamiliar
but certain
CROSS-SELL
EXISTING
CUSTOMERS IN
BUSINESS DDA BASE
Familiar
and certain
1
10
2
8
5
ALIGN,
COMMUNICATE
INCENTIVES
4
Improve training
and marketing
materials
Current year initiatives
6
Launch optimal
Best Buy small
business value
proposition
CROSS-SELL EXISTING
CUSTOMERS IN
CONSUMER CARD BASE
Develop pre-approval
and concurrent
approval capability
2-3 year initiatives
3-5 year initiatives
61
62.
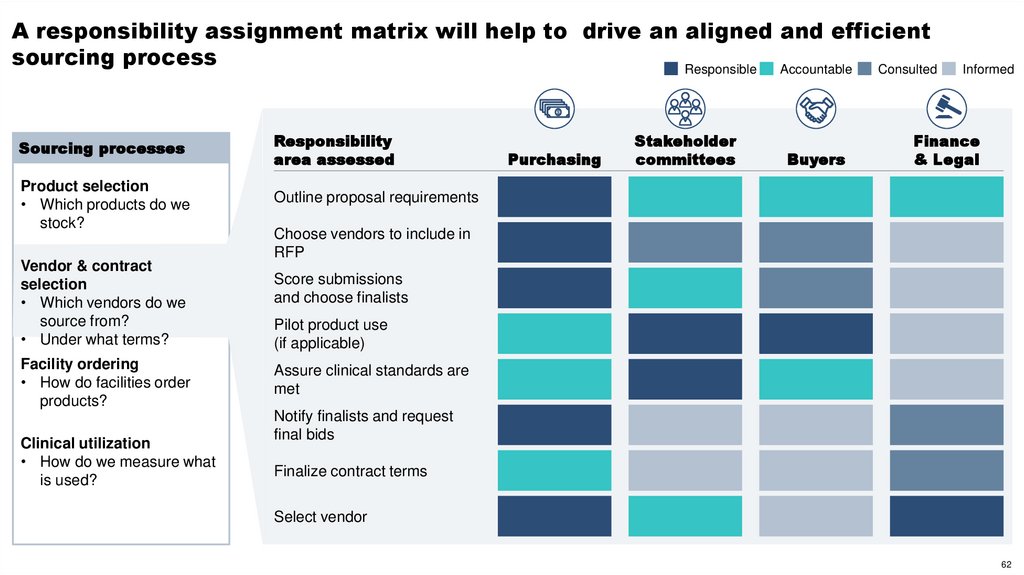
A responsibility assignment matrix will help to drive an aligned and efficientsourcing process
Responsible
Accountable
Consulted
Sourcing processes
Responsibility
area assessed
Product selection
• Which products do we
stock?
Outline proposal requirements
Vendor & contract
selection
• Which vendors do we
source from?
• Under what terms?
Facility ordering
• How do facilities order
products?
Clinical utilization
• How do we measure what
is used?
Purchasing
Stakeholder
committees
Buyers
Informed
Finance
& Legal
Choose vendors to include in
RFP
Score submissions
and choose finalists
Pilot product use
(if applicable)
Assure clinical standards are
met
Notify finalists and request
final bids
Finalize contract terms
Select vendor
62
63.
Шаблоны слайдов с планом работШаблоны слайдов с процессом
Шаблоны слайдов со структурами/деревом решений
Шаблоны слайдов с горизонтами
Приложение:
шаблоны и
примеры слайдов
Шаблоны слайдов From-to
Шаблоны слайдов с воронками
Шаблоны слайдов с компонентами
Шаблоны слайдов с матрицами
Примеры слайдов с визуализацией числовых данных
63
64.
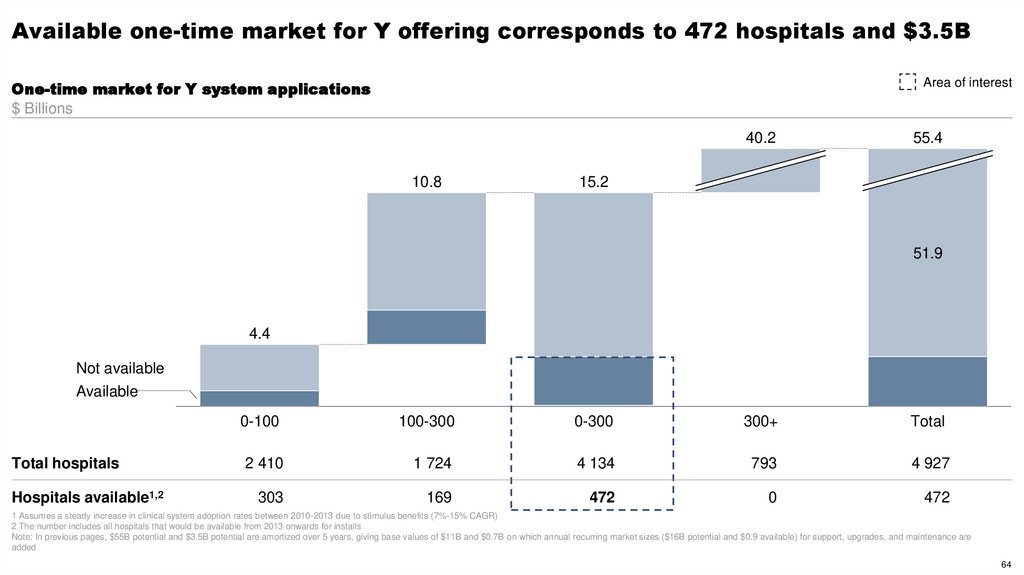
Available one-time market for Y offering corresponds to 472 hospitals and $3.5BArea of interest
One-time market for Y system applications
$ Billions
40.2
10.8
55.4
15.2
8,4
51.9
11,7
4.4
Not available
Available
Total hospitals
Hospitals available1,2
2,5
3,3
3,5
3,6
1,1
0-100
100-300
0-300
300+
Total
2 410
1 724
4 134
793
4 927
303
169
472
0
472
1 Assumes a steady increase in clinical system adoption rates between 2010-2013 due to stimulus benefits (7%-15% CAGR)
2 The number includes all hospitals that would be available from 2013 onwards for installs
Note: In previous pages, $55B potential and $3.5B potential are amortized over 5 years, giving base values of $11B and $0.7B on which annual recurring market sizes ($16B potential and $0.9 available) for support, upgrades, and maintenance are
added
64
65.
Spending on health care exceeded expected levels by $572 billion in 2009 – 23% oftotal spending on health care that year
Total US health care spending, 2009 By category, 2009
Percent
$ Billions
100% = $2,486 billion
Below ESAW
Above ESAW
Total
522
Outpatient care
• Share of US
spending above
Estimated
23%
• Spending
According to
Wealth (ESAW)
Long-term and
home care
498
47
Inpatient care
245
-275
Drugs and
nondurables
120
Health administration
and insurance
Durables
Investment in health
1 019
98
293
163
35
-11
72
5721
233
2 486
65
66.
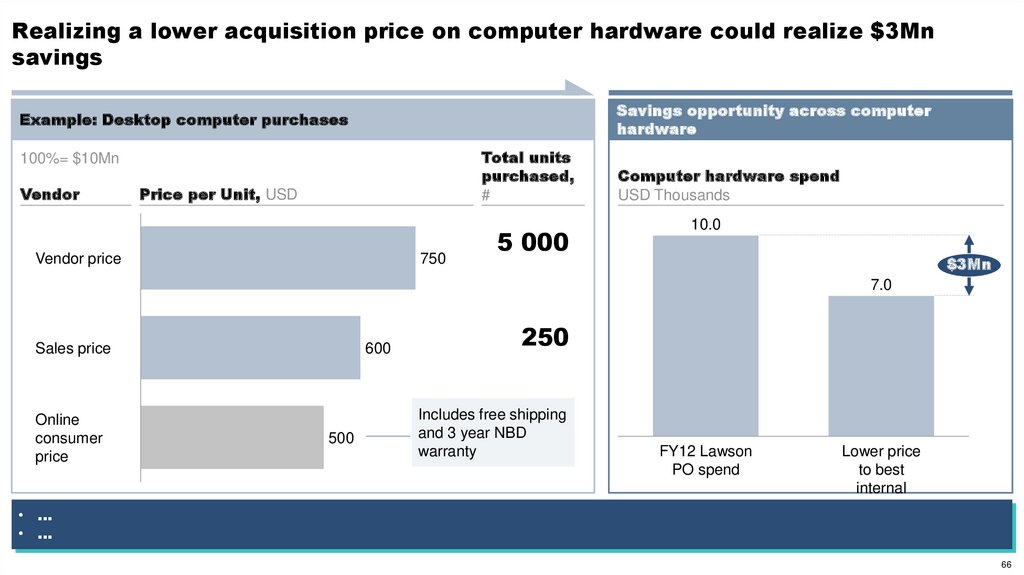
Realizing a lower acquisition price on computer hardware could realize $3Mnsavings
Savings opportunity across computer
hardware
Example: Desktop computer purchases
Total units
purchased,
#
100%= $10Mn
Vendor
Price per Unit, USD
Vendor price
750
5 000
Computer hardware spend
USD Thousands
10.0
$3Mn
7.0
Sales price
Online
consumer
price
600
500
250
Includes free shipping
and 3 year NBD
warranty
FY12 Lawson
PO spend
Lower price
to best
internal
• …
• …
66
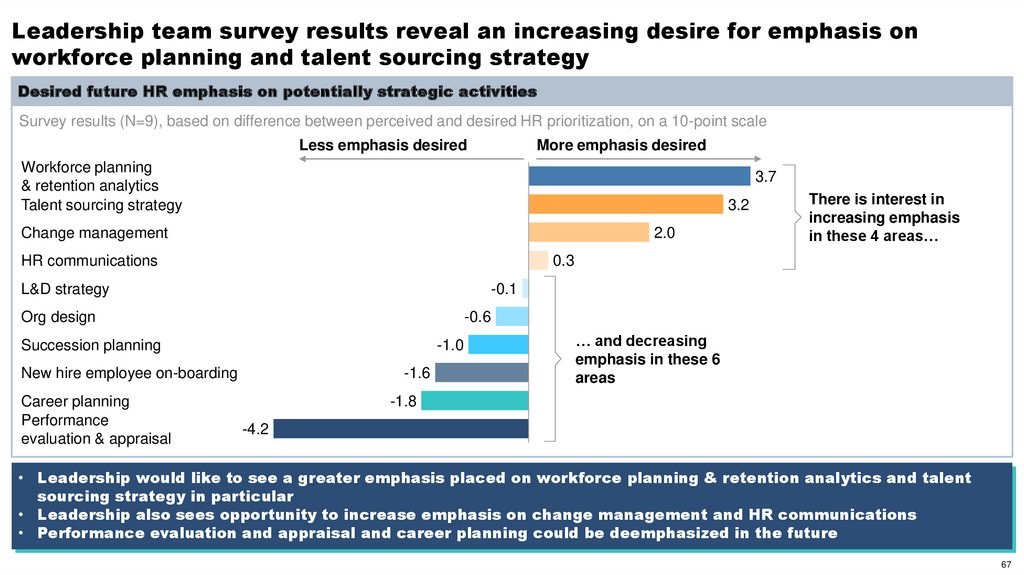
67.
Leadership team survey results reveal an increasing desire for emphasis onworkforce planning and talent sourcing strategy
Desired future HR emphasis on potentially strategic activities
Survey results (N=9), based on difference between perceived and desired HR prioritization, on a 10-point scale
Less emphasis desired
More emphasis desired
Workforce planning
& retention analytics
Talent sourcing strategy
3.7
3.2
Change management
2.0
HR communications
0.3
L&D strategy
-0.1
Org design
-0.6
Succession planning
-1.0
New hire employee on-boarding
Career planning
Performance
evaluation & appraisal
There is interest in
increasing emphasis
in these 4 areas…
-1.6
… and decreasing
emphasis in these 6
areas
-1.8
-4.2
• Leadership would like to see a greater emphasis placed on workforce planning & retention analytics and talent
sourcing strategy in particular
• Leadership also sees opportunity to increase emphasis on change management and HR communications
• Performance evaluation and appraisal and career planning could be deemphasized in the future
67
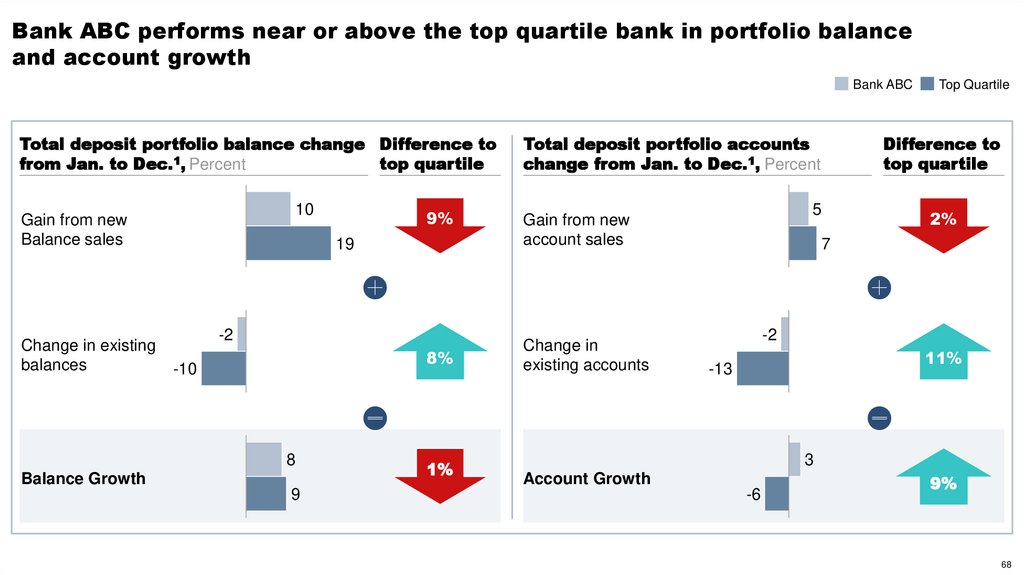
68.
Bank ABC performs near or above the top quartile bank in portfolio balanceand account growth
Bank ABC
Total deposit portfolio balance change Difference to
top quartile
from Jan. to Dec.1, Percent
10
Gain from new
Balance sales
Change in existing
balances
9%
19
-2
8%
-10
8
Balance Growth
9
1%
Total deposit portfolio accounts
change from Jan. to Dec.1, Percent
Change in
existing accounts
Difference to
top quartile
5
Gain from new
account sales
Top Quartile
2%
7
-2
11%
-13
3
Account Growth
-6
9%
68
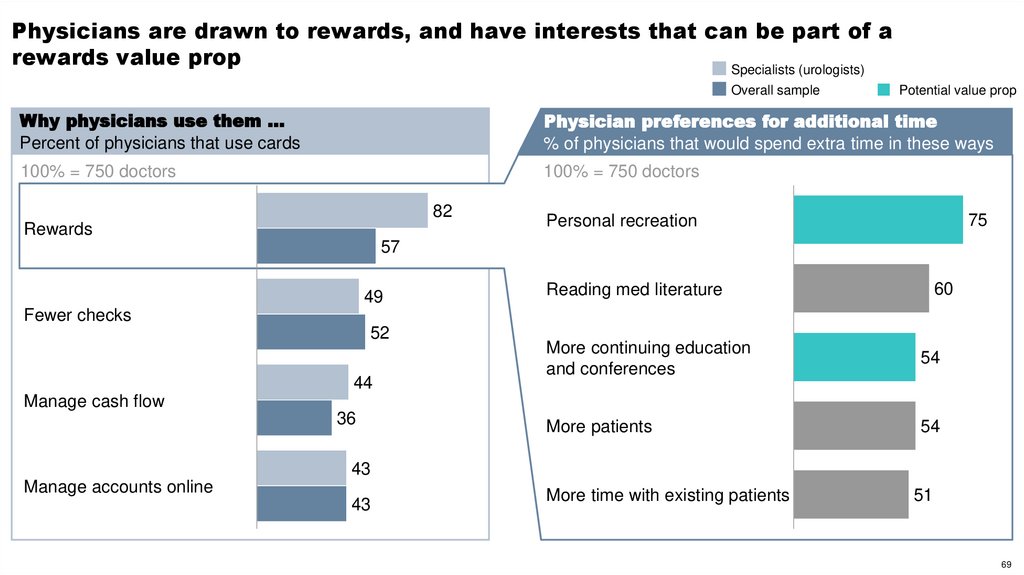
69.
Physicians are drawn to rewards, and have interests that can be part of arewards value prop
Specialists (urologists)
Overall sample
Potential value prop
Why physicians use them …
Percent of physicians that use cards
Physician preferences for additional time
% of physicians that would spend extra time in these ways
100% = 750 doctors
100% = 750 doctors
82
Rewards
75
Personal recreation
57
49
60
Reading med literature
Fewer checks
52
44
More continuing education
and conferences
54
More patients
54
Manage cash flow
36
43
Manage accounts online
43
More time with existing patients
51
69
70.
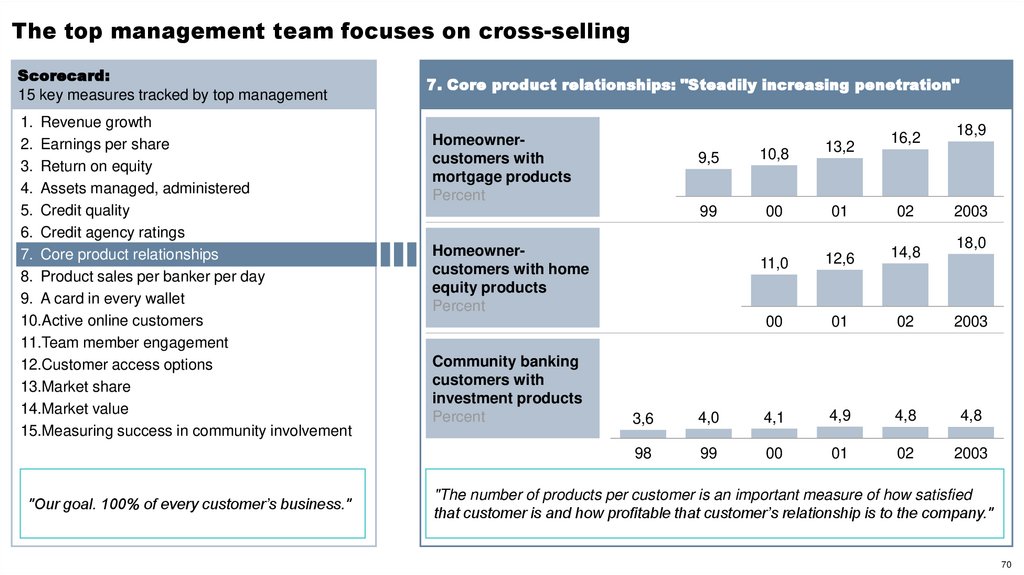
The top management team focuses on cross-sellingScorecard:
15 key measures tracked by top management
1. Revenue growth
2. Earnings per share
3. Return on equity
4. Assets managed, administered
5. Credit quality
6. Credit agency ratings
7. Core product relationships
8. Product sales per banker per day
9. A card in every wallet
10.Active online customers
11.Team member engagement
12.Customer access options
13.Market share
14.Market value
15.Measuring success in community involvement
"Our goal. 100% of every customer’s business."
7. Core product relationships: "Steadily increasing penetration"
Homeownercustomers with
mortgage products
Percent
18,9
9,5
10,8
13,2
99
00
01
02
11,0
12,6
14,8
00
01
02
2003
Homeownercustomers with home
equity products
Percent
Community banking
customers with
investment products
Percent
16,2
2003
18,0
3,6
4,0
4,1
4,9
4,8
4,8
98
99
00
01
02
2003
"The number of products per customer is an important measure of how satisfied
that customer is and how profitable that customer’s relationship is to the company."
70
71.
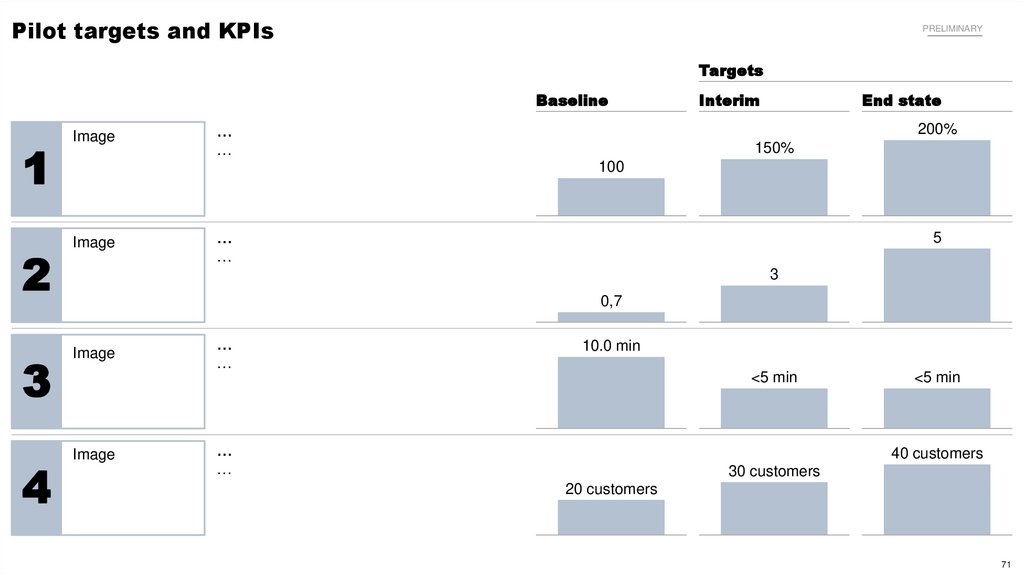
Pilot targets and KPIsPRELIMINARY
Targets
Baseline
1
Image
2
Image
3
Image
4
Image
…
…
Interim
End state
200%
150%
100
…
…
5
3
0,7
…
…
10.0 min
<5 min
…
…
<5 min
40 customers
30 customers
20 customers
71
72.
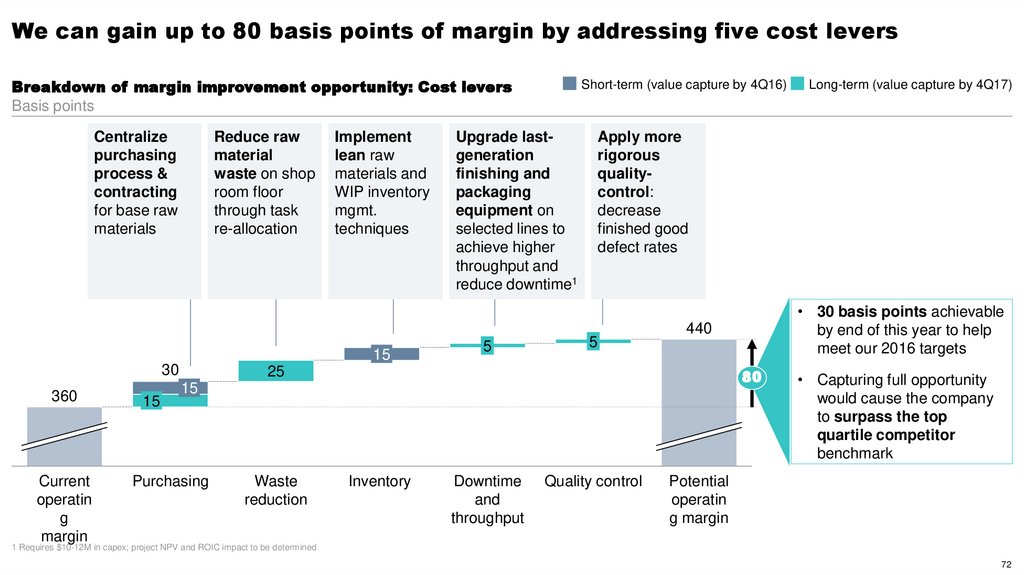
We can gain up to 80 basis points of margin by addressing five cost leversBreakdown of margin improvement opportunity: Cost levers
Basis points
Centralize
purchasing
process &
contracting
for base raw
materials
Reduce raw
material
waste on shop
room floor
through task
re-allocation
Implement
lean raw
materials and
WIP inventory
mgmt.
techniques
15
30
360
Current
operatin
g
margin
15
Short-term (value capture by 4Q16)
Upgrade lastgeneration
finishing and
packaging
equipment on
selected lines to
achieve higher
throughput and
reduce downtime1
5
Apply more
rigorous
qualitycontrol:
decrease
finished good
defect rates
5
80
15
Waste
reduction
• 30 basis points achievable
by end of this year to help
meet our 2016 targets
440
25
Purchasing
Inventory
Downtime
and
throughput
Long-term (value capture by 4Q17)
Quality control
• Capturing full opportunity
would cause the company
to surpass the top
quartile competitor
benchmark
Potential
operatin
g margin
1 Requires $10-12M in capex; project NPV and ROIC impact to be determined
72
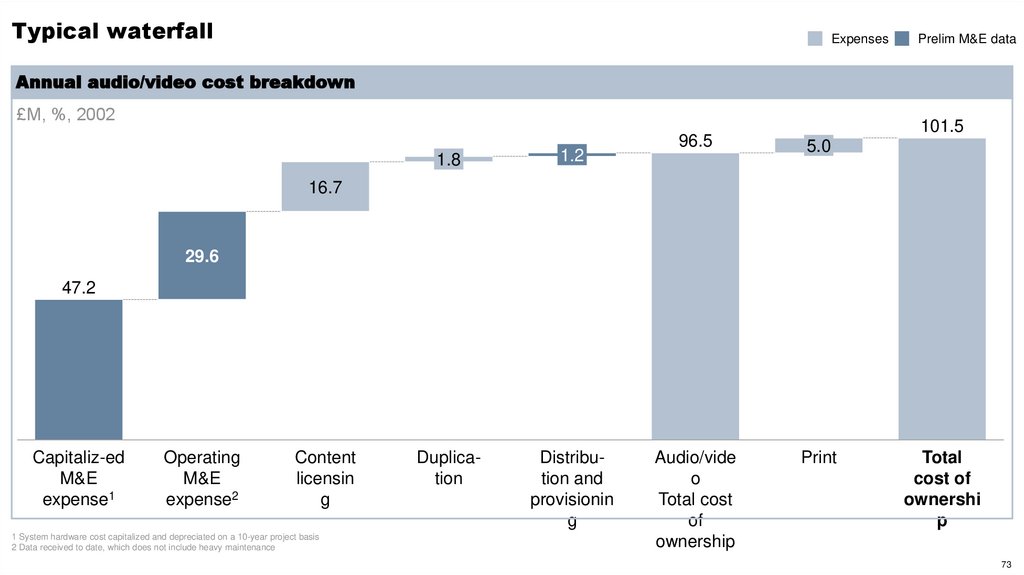
73.
Typical waterfallExpenses
Prelim M&E data
Annual audio/video cost breakdown
£M, %, 2002
1.8
1.2
Duplication
Distribution and
provisionin
g
101.5
96.5
5.0
Audio/vide
o
Total cost
of
ownership
16.7
29.6
47.2
Capitaliz-ed
M&E
expense1
Operating
M&E
expense2
Content
licensin
g
1 System hardware cost capitalized and depreciated on a 10-year project basis
2 Data received to date, which does not include heavy maintenance
Total
cost of
ownershi
p
73
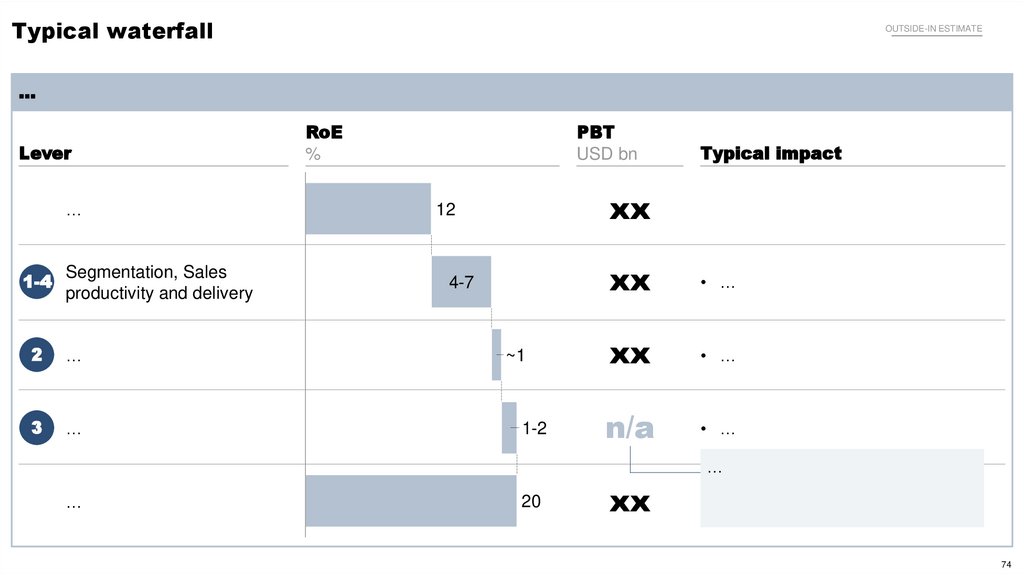
74.
Typical waterfallOUTSIDE-IN ESTIMATE
…
Lever
…
1-4
Segmentation, Sales
productivity and delivery
2
…
3
…
RoE
%
PBT
USD bn
Typical impact
xx
12
4-7
~1
1-2
xx
• …
xx
• …
n/a
• …
…
…
20
xx
74
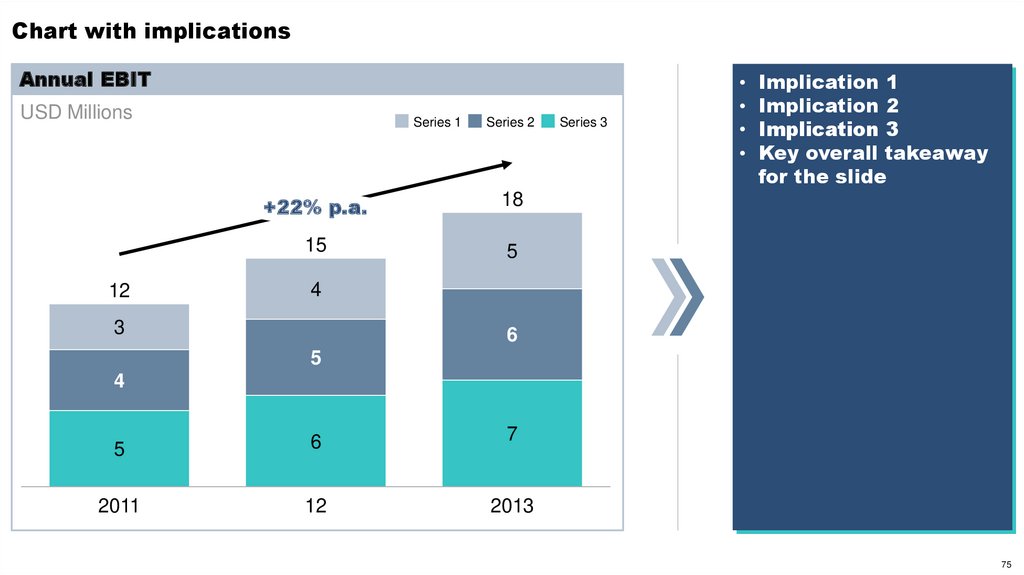
75.
Chart with implicationsAnnual EBIT
USD Millions
12
Series 1
Series 2
+22% p.a.
18
15
5
Series 3
Implication 1
Implication 2
Implication 3
Key overall takeaway
for the slide
4
3
6
5
4
5
6
7
2011
12
2013
75
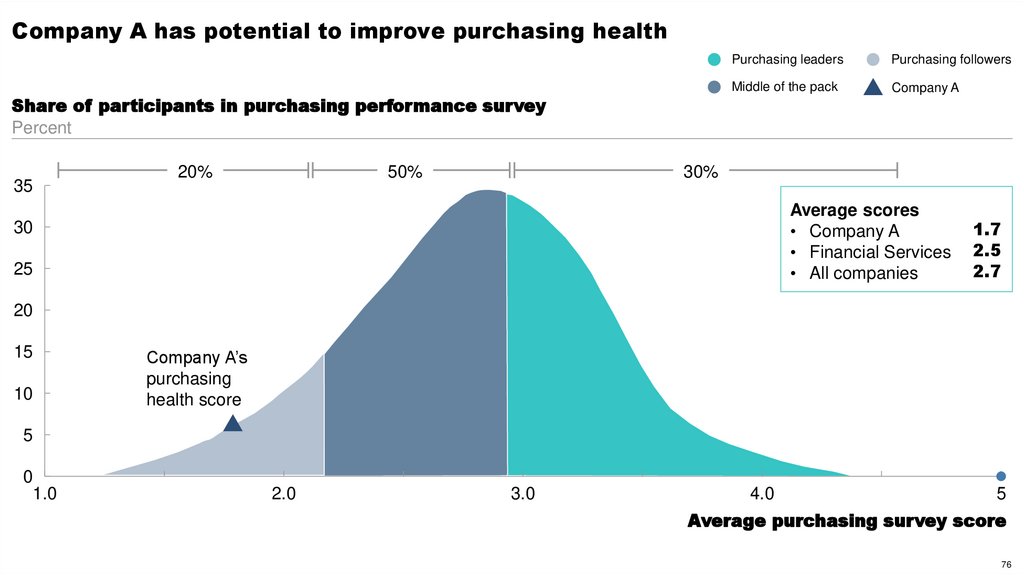
76.
Company A has potential to improve purchasing healthShare of participants in purchasing performance survey
Percent
35
20%
50%
Purchasing leaders
Purchasing followers
Middle of the pack
Company A
30%
Average scores
• Company A
• Financial Services
• All companies
30
25
1.7
2.5
2.7
20
15
10
Company A’s
purchasing
health score
5
0
1.0
2.0
3.0
4.0
5
Average purchasing survey score
76
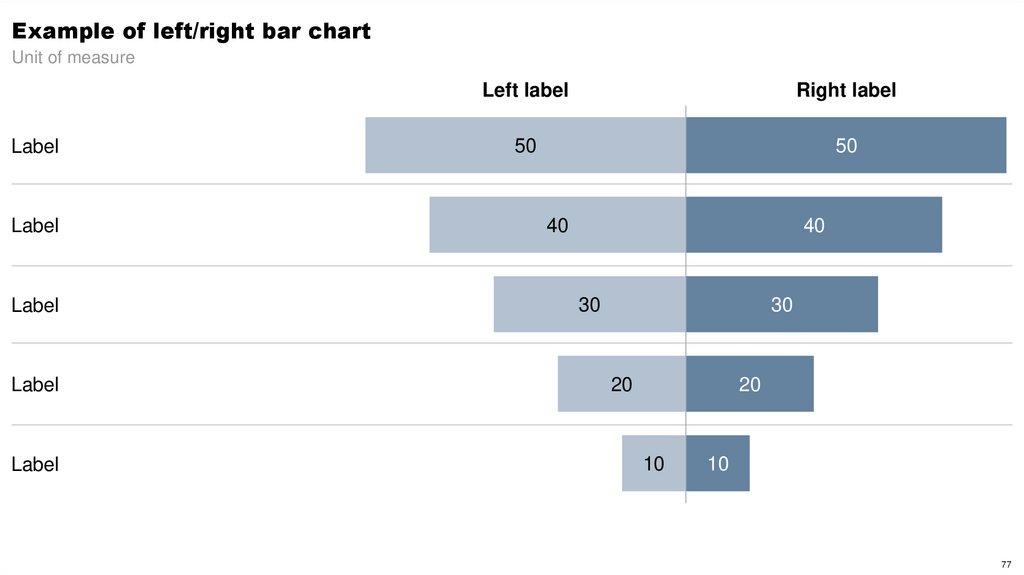
77.
Example of left/right bar chartUnit of measure
Label
Label
Label
Label
Label
Left label
Right label
50
50
40
40
30
30
20
20
10
10
77