


 Финансы
Похожие презентации:
")
")


State Support Shipbuilding in Ukraine
1.
State Support ForThe Shipbuilding
Industry In Ukraine
Appendix
Kyiv, Kherson, April 2021.
2.
Содержание Стр.1.
Prerequisites for the development of shipbuilding in Ukraine
2.
A Brief Overview Of The Reasons For The Development And Support Of The Shipbuilding Industry In The World
Reference Materials On Leading Countries In Shipbuilding
3
21
3.
The Region Market, The Potential For Ukraine
4.
Impact Of The Shipbuilding Industry On The Economy Of Ukraine
5.
Main Challenges Of Shipbuilding And Ship Repair In Ukraine 67
6.
Overview Of Available State Support Tools In Ukraine, Comparison With Best Practices In The Region
7.
Proposed List Of State Support Measures For Shipbuilding To Be Implemented In Ukraine109
Reference Materials
11
38
56
86
123
8.
Appendices
129
8.1
Profiles of the proposed state support measures
8.2
Overview Of Modern Examples Of Water Transport Development In The Regions160
Cluster Profiles On The Black Sea
130
173
Overview Of Available Production Capacity In Ukraine
186
Other Materials 191
Настоящий документ является конфиденциальным. Он предназначен исключительно для внутреннего использования фирмой-клиентом и не является законченным без сопроводительного
подробного анализа и устной презентации. Документ не может быть передан и/или другим способом предоставлен третьим лицам без предварительного письменного разрешения фирмы Roland
Berger.
© Roland Berger
2
3.
1. Prerequisites for thedevelopment of
shipbuilding in Ukraine
4.
Ukraine has a number of geographical and infrastructural prerequisitesthat determine the need for its own shipbuilding
Prerequisites for the development of shipbuilding in Ukraine
Access to the largest navigable rivers in Eastern Europe
(Dnieper and Danube), as well as access to the Black Sea basin
Growing domestic and export cargo turnover of the country
Availability of established port infrastructure
Availability of operating shipyards/ shipbuilding infrastructure
Opportunities for the development of inland waterway transport as the cheapest
logistics modality
Source: *CLIENT*, Roland Berger
4
5.
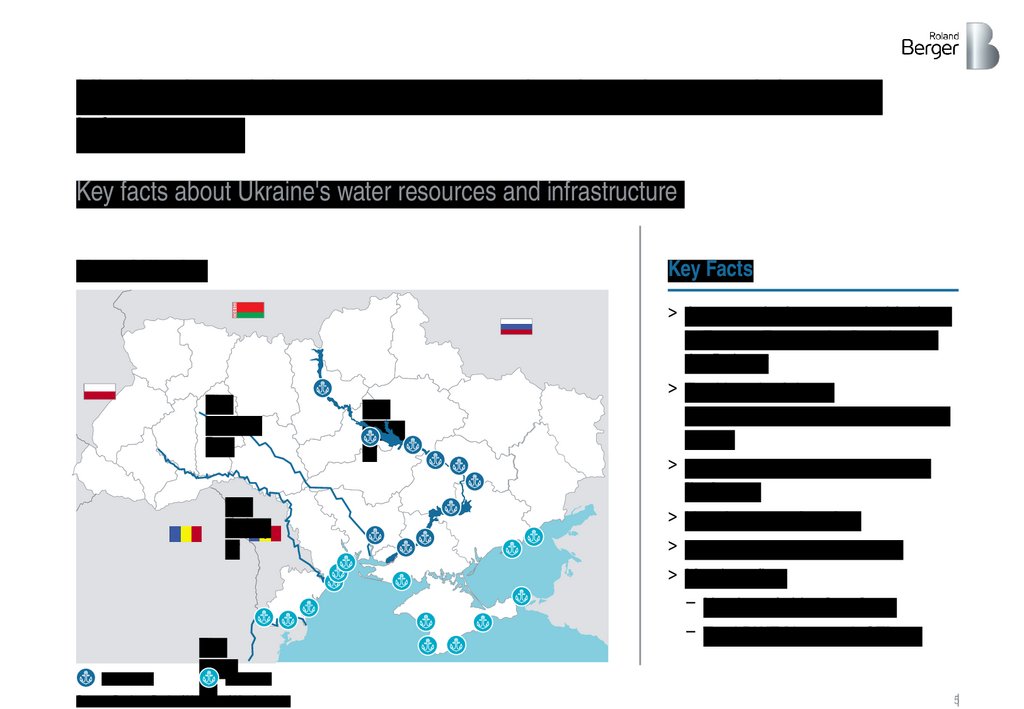
Ukraine has rich water resources, developed sea and river portinfrastructure
Key facts about Ukraine's water resources and infrastructure
Map of Ukraine
Key Facts
The
Yuzhniy
Bug
The
Dniest
er
The
Danu
River ports
Sea ports
be
Source: Register Book of Vessels of Ukraine 2019
The
Dniep
er
> Access to the largest navigable rivers
in Eastern Europe: the Danube and
the Dnieper
> Total length of rivers
(or navigable length of all rivers) [km]
~4,400
> Total length of the maritime border
[km] 1,355
> No. of seaports [pcs.] 14
> Number of river ports [pcs.] 10
> Merchant fleet
– Number of ships [pcs.] 546
– Total DWT [thousand GT] 660
5
6.
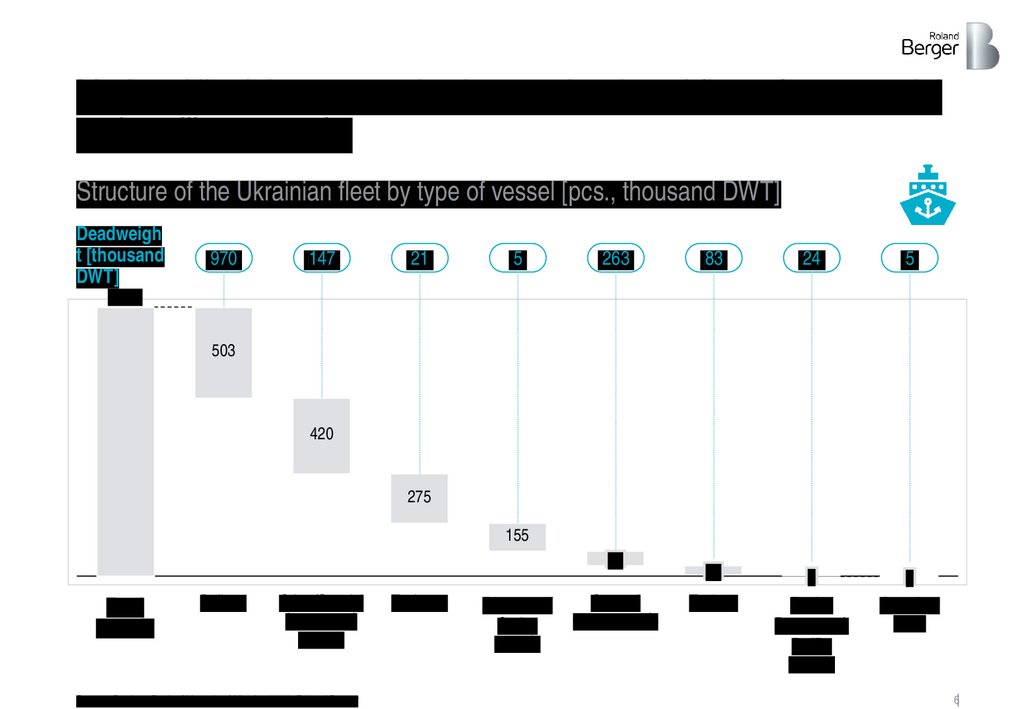
Modern Ukrainian companies have a developed fleet of commercialand auxiliary vessels
Structure of the Ukrainian fleet by type of vessel [pcs., thousand DWT]
Deadweigh
t [thousand
DWT]
970
147
21
5
263
83
24
5
50
6
2
Tankers
Ferries
Passenger/
Ro/Ro
vessels
Container
ships
1.491
503
420
275
155
80
Total
vessels
Bulkers
Other/Special
(non-cargo)
vessels
Source: Register Book of Vessels of Ukraine 2019, Roland Berger
Tugboats
Passenger/
Cruise
vessels
General
cargo vessels
6
7.
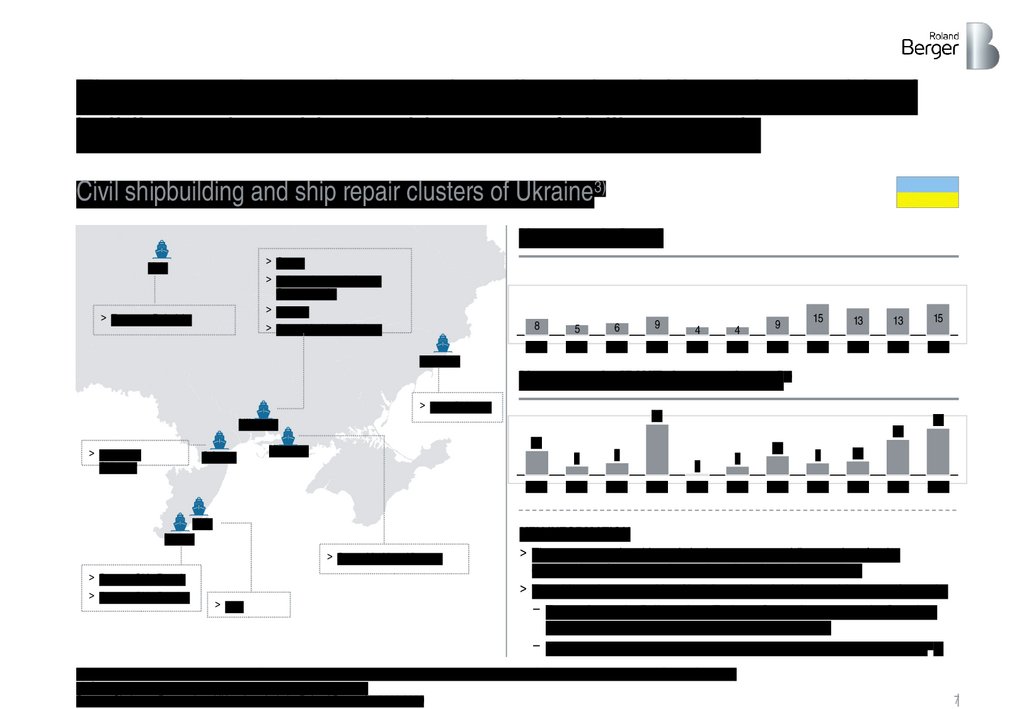
The country has 10 large and medium-sized shipyards capable ofbuilding and repairing a wide range of civilian vessels
Civil shipbuilding and ship repair clusters of Ukraine3)
New vessels [pcs.]
> Ocean
> Shipyard named after 61
Communards
> Nibulon
Kyiv
> Forge on Rybalsky
8
> Smart Maritime-Nikolaev
2010
5
2011
6
9
2012
2013
4
2014
4
2015
9
2016
15
13
13
15
2017
2018
2019
2020
Mariupol
New vessels [DWT thousand tons]1)
> Azov Shipyard
39
Nikolaev
> Ilyichevsk
Shipyard
Odessa
19
Kherson
2010
Kilia
Ismael
> Smart Maritime-Kherson
> Dunnay Ship Repair
> Dunnay Ship Service
27
> Kilia
7
9
2011
2012
1
2013
2014
7
2015
15
2016
9
11
2017
2018
2019
36
2020
KEY INFORMATION
> There are 10 major shipyards in the country, providing services for the
construction of new vessels, repair and modernization services
> The shipyards are capable of building and maintaining a wide range of vessels:
– Types of vessels: Bulk carriers, Tankers, General cargo vessels, Container
ships, Offshore vessels, Specialized and other vessels
– Typical deadweight: 5-10 thousand DWT / Maximum 300 thousand DWT2)
1) According to publicly available data (data on DWT of individual vessels is not publicly available) 2) Design capabilities of Ocean Shipyard
3) Only civil shipbuilding, but including the Forge on Rybalsky
Source: Clarksons Research, additional analysis by Roland Berger for 2016-2020
7
8.
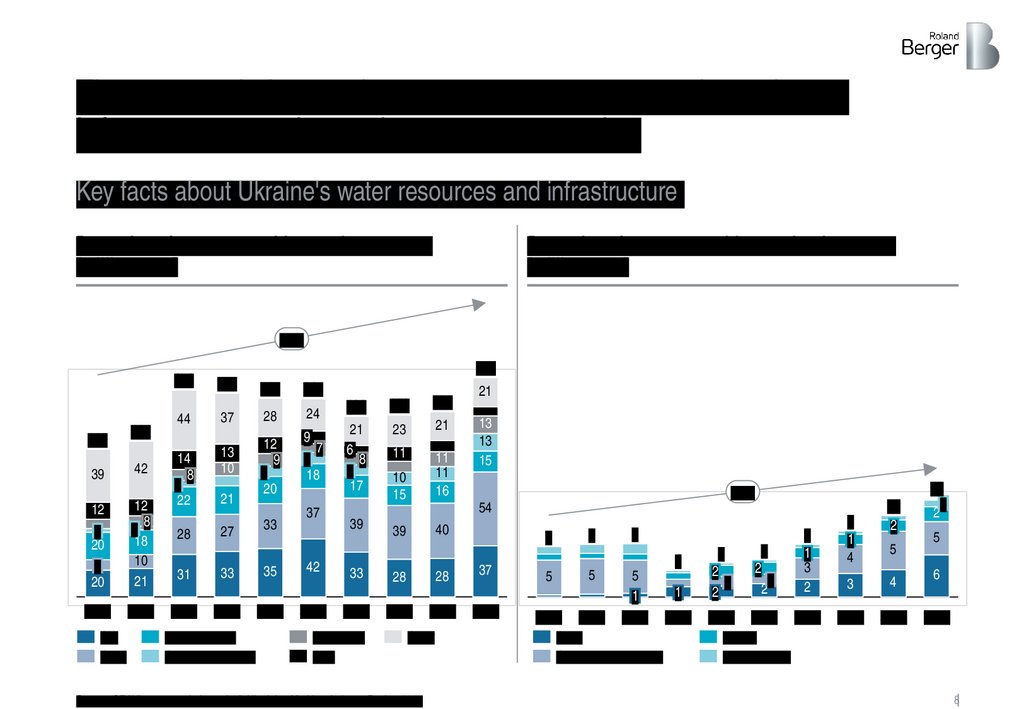
The country is increasing export cargo turnover through portinfrastructure and waterborne transportation
Key facts about Ukraine's water resources and infrastructure
Dynamics of cargo transshipment by seaports
[million tons]
Dynamics of cargo transshipment by river ports
[million tons]
+4%
151
108
39
114
42
12
3
20
8
20
12
3 8
18
10
21
2010
2011
Ore
Grain
44
14
8
5
22
28
31
2012
160
149
37
13
10
21
27
33
2013
Ferrous metals
Other bulk cargoes
145
145
28
24
12
9
8
20
9
7
8
18
33
35
2014
37
42
2015
132
133
135
21
6
8
8
17
23
21
11
11
11
16
39
33
2016
Containers
Coal
10
15
21
13
13
15
+8%
54
40
39
28
28
2017
2018
Other
Source: SE "Ukrpromvneshekspertiza", Ukrainian Maritime Industry Review 2021
7
7
37
2019
7
1
5
2
1
2
5
2
1
2
7
1
3
2
2013
2014
2015
2016
4
5
5
2010
2011
5
1
2012
Grain
Construction materials
9
1
4
11
2
5
3
4
2017
2018
13
1
2
5
6
2019
Metalls
Other cargoes
8
9.
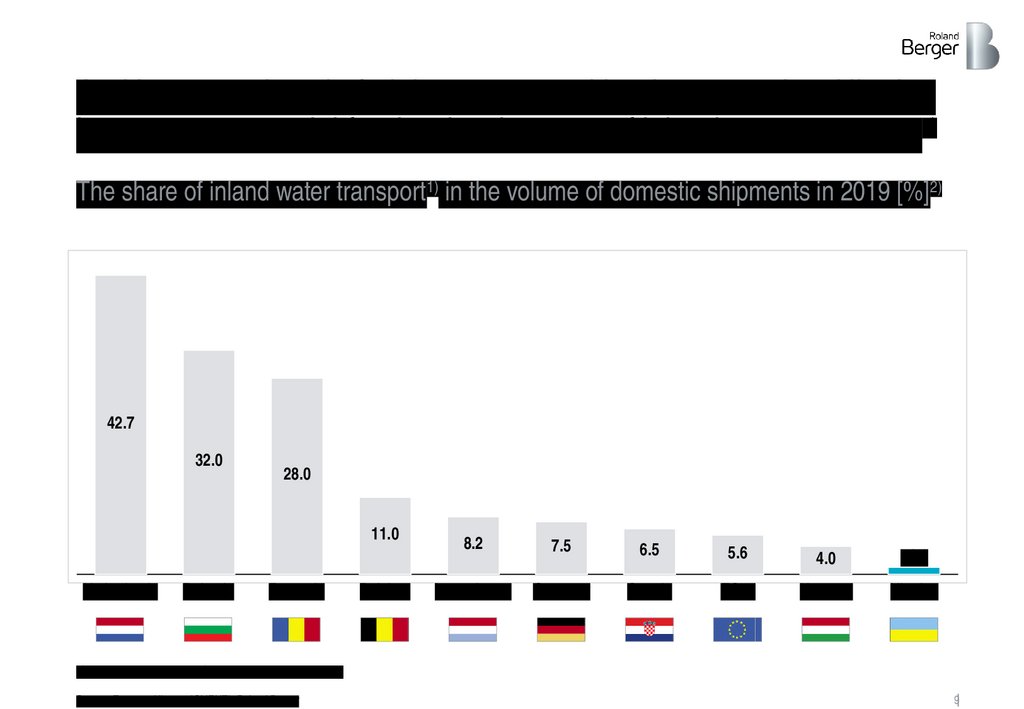
And in comparison in freight transport with other countries, Ukrainehas a great potential for the development of inland water transport1)
The share of inland water transport1) in the volume of domestic shipments in 2019 [%]2)
42.7
32.0
28.0
11.0
Netherlands
Bulgaria
Romania
Belgium
8.2
7.5
6.5
5.6
4.0
<1.0
Luxembourg
Germany
Croatia
ЕС28
Hungary
Ukraine
1) Inland water transport; 2) Excluding pipeline transport
Source: Eurostat, Ukrstat, *CLIENT*, Roland Berger
9
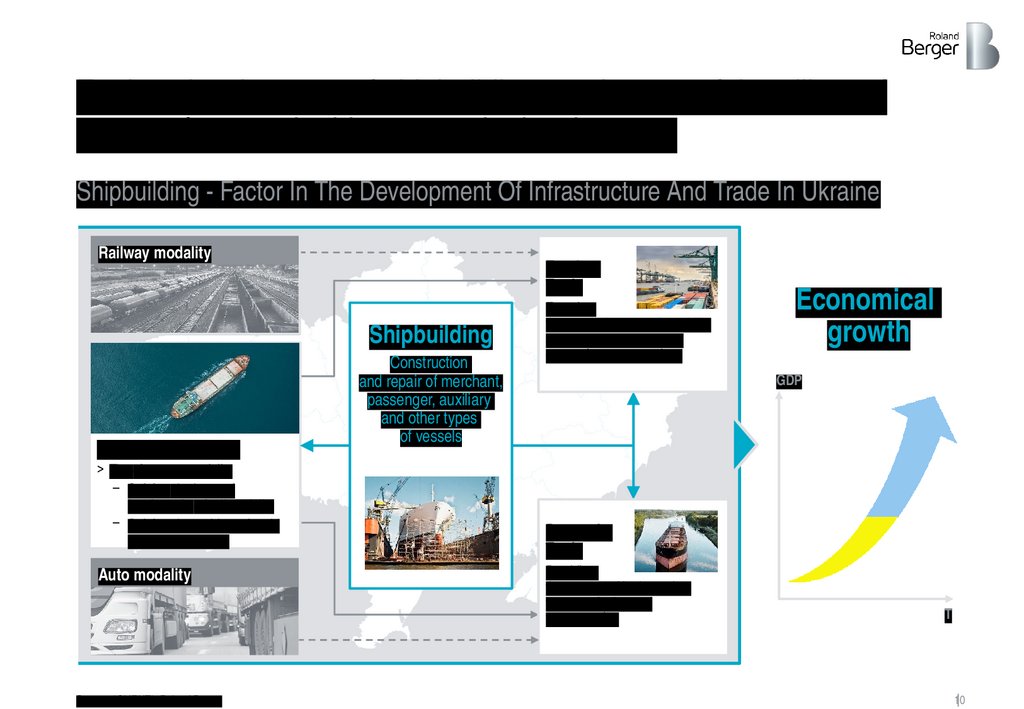
10.
Further development of shipbuilding can be one of the pillars ofsupport for sustainable economic development
Shipbuilding - Factor In The Development Of Infrastructure And Trade In Ukraine
Railway modality
Foreign
Trade
Shipbuilding
River/sea modality
> The cheapest modality
– Solving the issue of
bottlenecks of rail modality
– Solving the problem of rapid
road deterioration
Auto modality
Source: *CLIENT*, Roland Berger
Construction
and repair of merchant,
passenger, auxiliary
and other types
of vessels
Ensuring
the country's economic stability
and security by increasing
exports/currency earnings
Economical
growth
GDP
Domestic
Trade
Providing
the country with cheap river
transport for internal
transportation
Т
10
11.
2. A Brief Overview OfThe Reasons For The
Development And
Support Of The
Shipbuilding Industry In
The World
12.
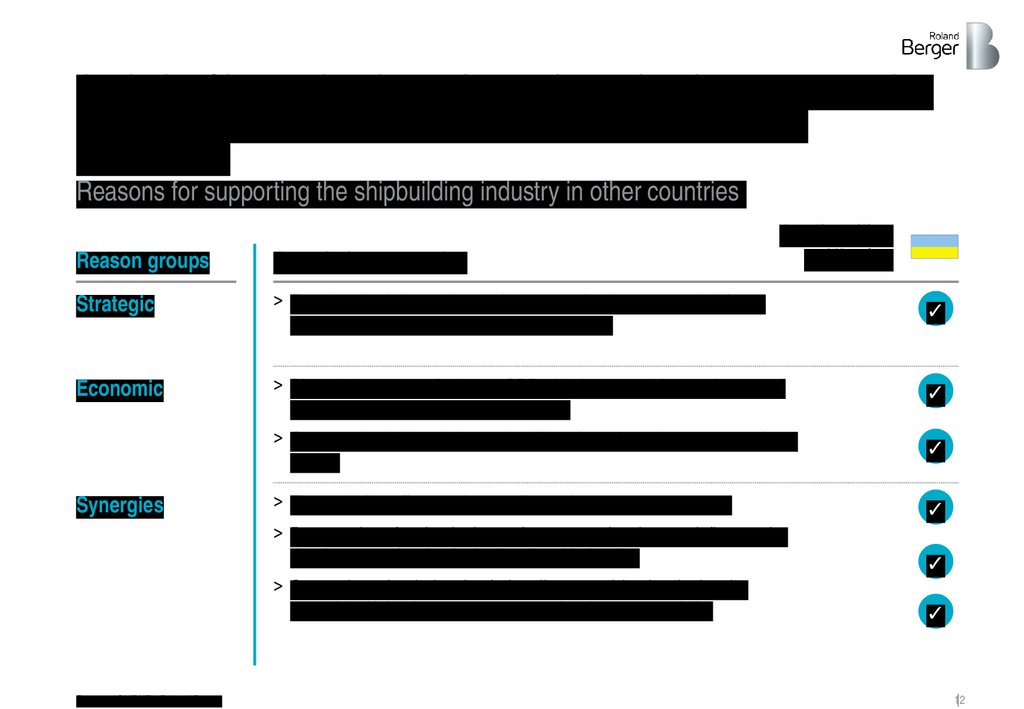
Analysis of international experience shows that there are a numberof strategic, economic and synergistic reasons to support
shipbuilding
Reasons for supporting the shipbuilding industry in other countries
Applicability
to Ukraine
Reason groups
Description, examples
Strategic
> Ensuring the independence of transport, food, energy and defense
aspects of river and sea activities of the state
✓
Economic
> Direct industry contribution to GDP with the potential to retain most of
the value added produced domestically
> Creation of additional jobs and additional tax deductions to the national
budget
✓
> The multiplier effect on the supplier and contractor subsectors
> Preservation of technologies and competencies that can influence the
development of technologies in related industries
> Supporting other industries (primarily exports) by developing the
potential of inland water transport as the cheapest modality
✓
Synergies
Source: *CLIENT*, Roland Berger
✓
✓
✓
12
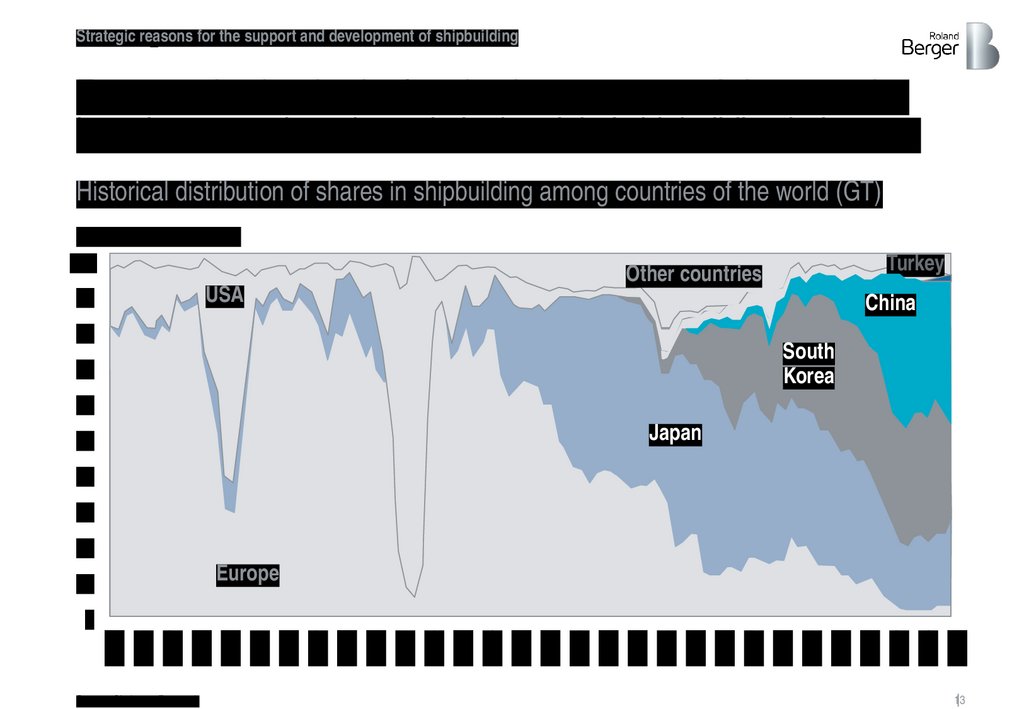
13.
Strategic reasonsfor the support and development of shipbuilding
1
For example, despite the fact that in recent years Asian countries
have begun to play a key role in the global shipbuilding industry,...
Historical distribution of shares in shipbuilding among countries of the world (GT)
Global shipbuilding [%]
100
USA
90
Turkey
Other countries
China
80
South
Korea
70
60
Japan
50
40
30
20
Europe
10
1902
1906
1910
1914
1918
1922
1926
1930
1934
1938
1942
1946
1950
1954
1958
1962
1966
1970
1974
1978
1982
1986
1990
1994
1998
2002
2006
2010
2014
2018
0
Source: Clarksons Research
13
14.
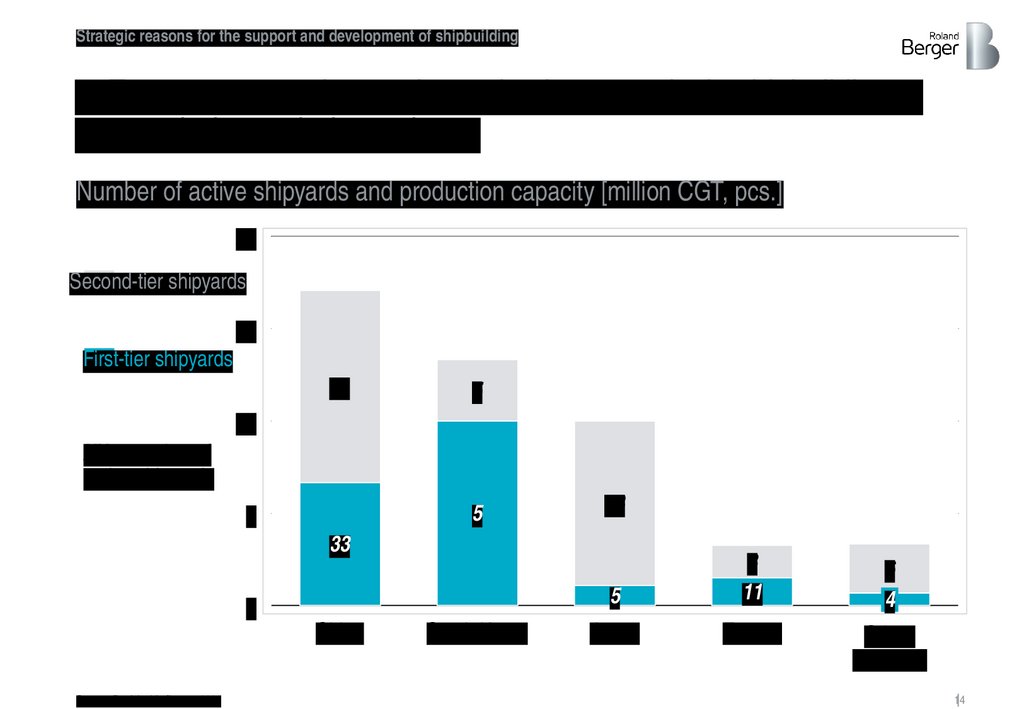
Strategic reasons for the support and development of shipbuilding... European countries retain production capacity in shipbuilding to
ensure their own independence
Number of active shipyards and production capacity [million CGT, pcs.]
24
Second-tier shipyards
18
First-tier shipyards
81
5
12
ХХ – number of
active shipyards
5
6
48
33
0
China
Source: Danish ship finance 2020
South Korea
5
3
11
6
4
Japan
Europe
Other
countries
14
15.
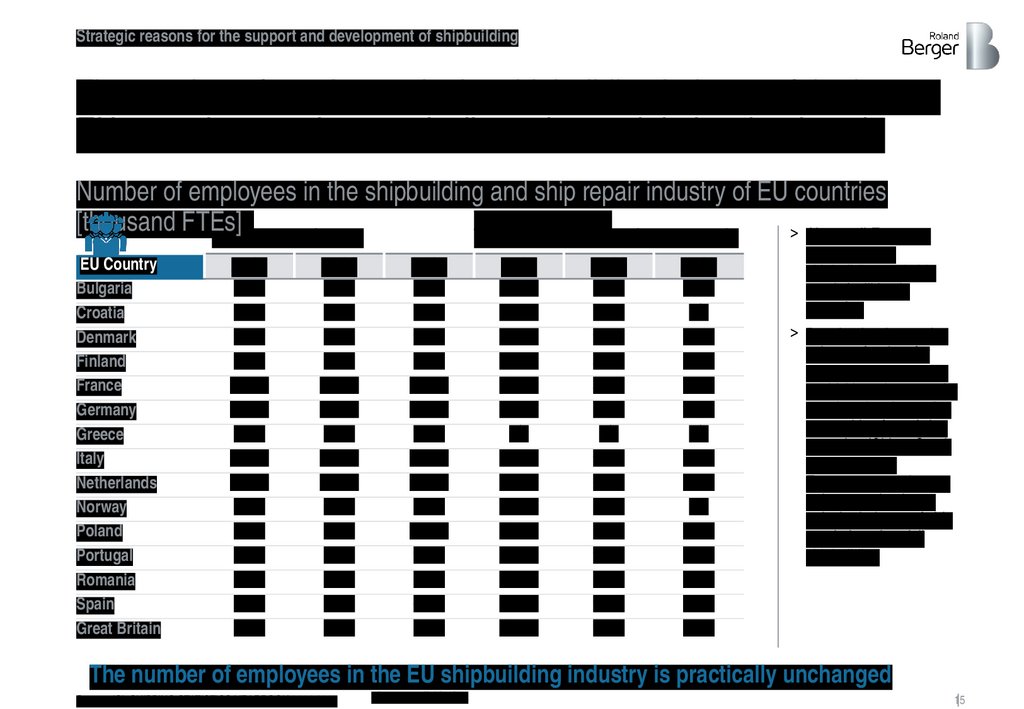
Strategic reasons for the support and development of shipbuildingThe number of employees in the shipbuilding industry of the largest
EU countries remains practically unchanged during the decade
Number of employees in the shipbuilding and ship repair industry of EU countries
Total
Workers involved
[thousand FTEs]
> Almost all European
industry employees
in the construction of new vessels
EU Country
Bulgaria
Croatia
Denmark
Finland
France
Germany
Greece
Italy
Netherlands
Norway
Poland
Portugal
Romania
Spain
Great Britain
2010
2014
2018
2010
2014
2018
4.3
8.8
1.8
3.8
16.4
18.0
2.3
11.6
13.2
5.0
7.0
1.3
8.1
6.2
3.0
4.1
7.7
0.7
2.8
14.5
17.9
2.1
11.4
11.7
4.0
7.8
0.8
8.2
4.4
2.7
5.7
7.4
0.9
3.2
11.9
18.3
1.7
12.8
10.5
3.1
13.1
0.8
8.6
4.5
3.0
2.0
8.4
1.3
3.8
2.1
10.8
n/a
8.5
10.9
4.6
1.8
0.6
7.8
2.1
0.2
1.8
7.4
0.1
2.2
2.2
7.8
n/a
6.4
8.3
3.8
1.4
0.1
7.4
0.9
0.3
2.3
n/a
0.1
2.5
1.9
8.4
n/a
7.2
7.5
n/a
2.3
0.1
7.1
0.9
0.3
countries have
shipbuilding and ship
repair facilities in
operation
> Despite the decreasing
volume of orders for
new construction in the
world (down by >40% by
2010) and serious price
competition from Asian
countries (China, South
Korea, Japan),
European countries are
trying to maintain not
only the industry of ship
repair, but also civil
shipbuilding
The number of employees in the EU shipbuilding industry is practically unchanged
Source: ISL SHIPPING STATISTICS YEARBOOK 2014-2019
n/a – no available data
15
16.
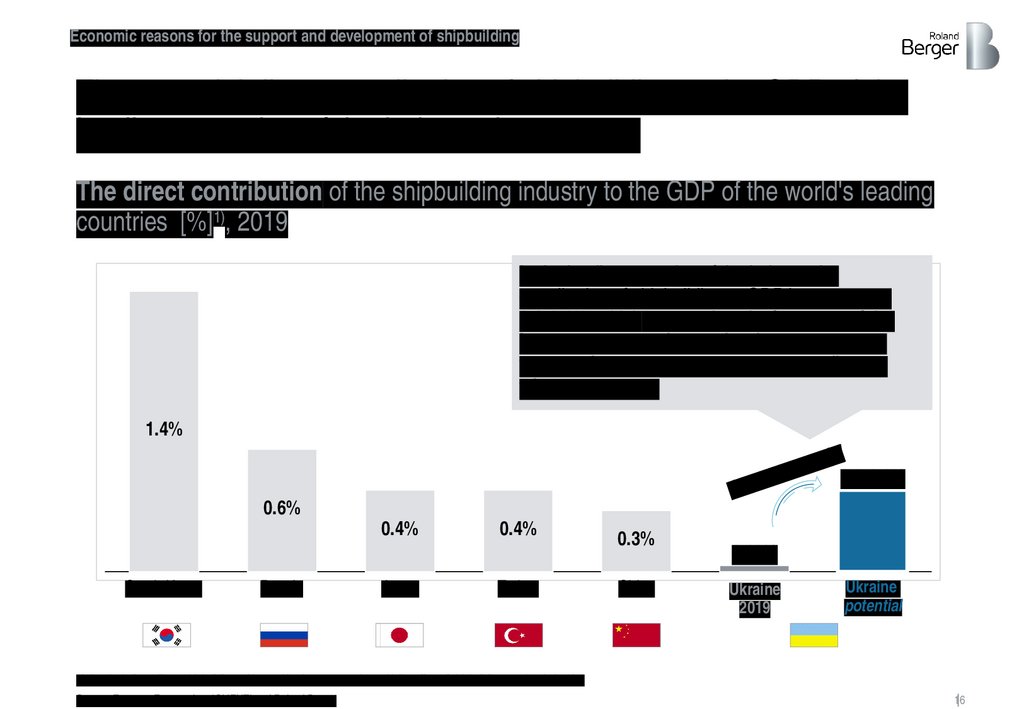
Economic reasons for the support and development of shipbuildingThe potential direct contribution of shipbuilding to the GDP of the
leading countries of the industry is 0.3-0.6%
The direct contribution of the shipbuilding industry to the GDP of the world's leading
countries [%]1), 2019
In the leading countries of the industry the
contribution of shipbuilding to GDP is on average
0,3-0,6%, which means that the increase of the
industry turnover in Ukraine from the current
values will allow to reach comparable figures
with benchmarks
1.4%
al
tenti
o
p
th
0.3-0.6%
Grow
0.6%
0.4%
South Korea
Russia
Japan
0.4%
Turkey
0.3%
China
0.03%
Ukraine
2019
Ukraine
potential
1) data including military shipbuilding; without taking into account the multiplier effect of shipbuilding on other industries
Source: Eurostat, Euromonitor, *CLIENT* and Roland Berger
16
17.
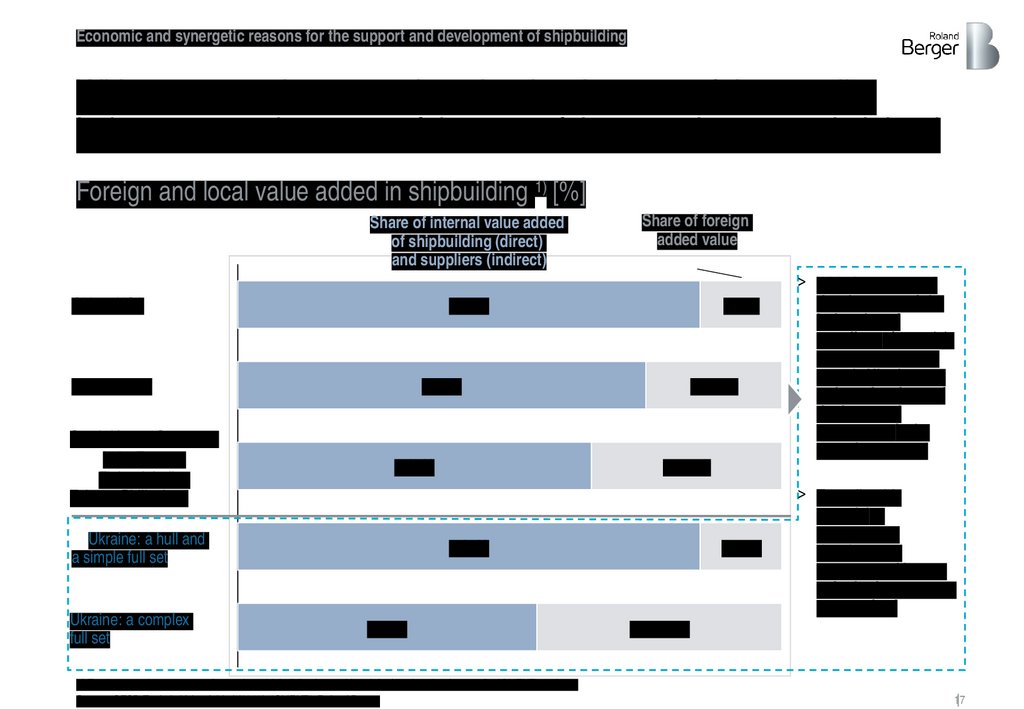
Economic and synergetic reasons for the support and development of shipbuildingWith a systematic approach to the development of the supplier
industry, more than 85% of the cost of the vessel can remain inland
Foreign and local value added in shipbuilding 1) [%]
Share of internal value added
of shipbuilding (direct)
and suppliers (indirect)
China, USA
> 85%
Japan, Brazil
South Korea, Germany,
Italy, France,
Finland, India,
Taiwan, Philippines
<15%
> 75%
> 65%
Ukraine: a hull and
a simple full set
Ukraine: a complex
full set
Share of foreign
added value
15-25%
25-35%
> 85%
< 60%
1) For the countries represented, complete shipbuilding is considered; for Ukraine, the data are for *CLIENT* projects
Source: OECD Trade in Value Added (2018), *CLIENT*, Roland Berger
5-15%
> With the structural
development of the
industries of
suppliers of materials
and components for
vessels Ukraine can
reduce the share of
the imported
component in the
cost of one vessel
> To realize this
potential, a
shipbuilding
development
strategy and import
substitution program
are required
> 40-50%
17
18.
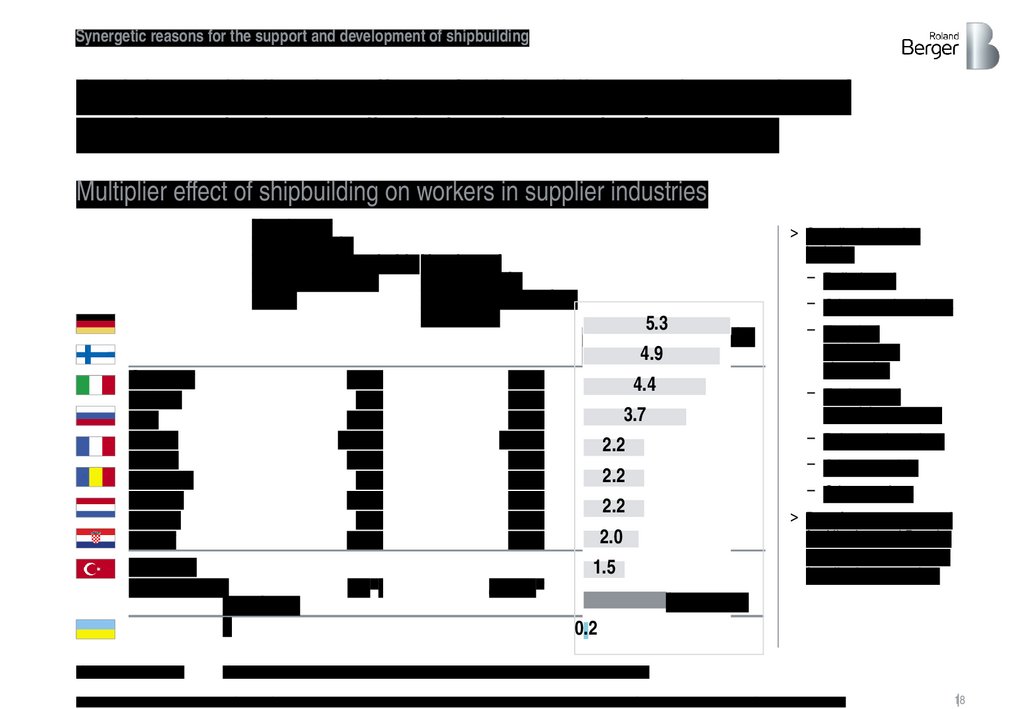
Synergetic reasons for the support and development of shipbuildingAnd the multiplicative effect of shipbuilding on the number of
employees in the supplier industries can be from 2 to 5
Multiplier effect of shipbuilding on workers in supplier industries
Number of
employees in
shipbuilding and ship Number of
repair,[thousand
employees in
FTEs]
supplier companies,
[ths FTEs]
Germany
Finland
Italy
Russia
France
Romania
Holland
Croatia
Turkey
Average
Ukraine 2019
benchmar
k
1) including outstaffers
17.8
2.8
11.4
190.0
14.5
8.2
11.7
7.7
21.3
94.2
13.8
50.6
700.0
32.4
18.1
25.5
15.0
32.7
6.81)
до 1.52)
> Supplier industries
include:
– Rolled steel
5.3
Multiplier effect on the
supplier4.9
industry
4.4
3.7
2.2
– Other metal products
– Electrical
engineering,
electronics
– Engines and
propulsion systems
– Paints and coatings
– Other materials
– Other services
2.2
2.2
> Data for 2019 was used
for Ukraine and Russia,
data for 2014 was used
for all other countries.
2.0
1.5
from 2 to 5
0.2
2) Roland Berger's estimate for metallurgy 300 FTEs, for other directions – an assumption
Source: Marine Peterburg, Minpromtorg, Shipping Statistics Yearbook 2019, Ministry of Transport and Infrastructure Turkey, BALance Technology Consulting – European Marine Supplies Industry 2014
18
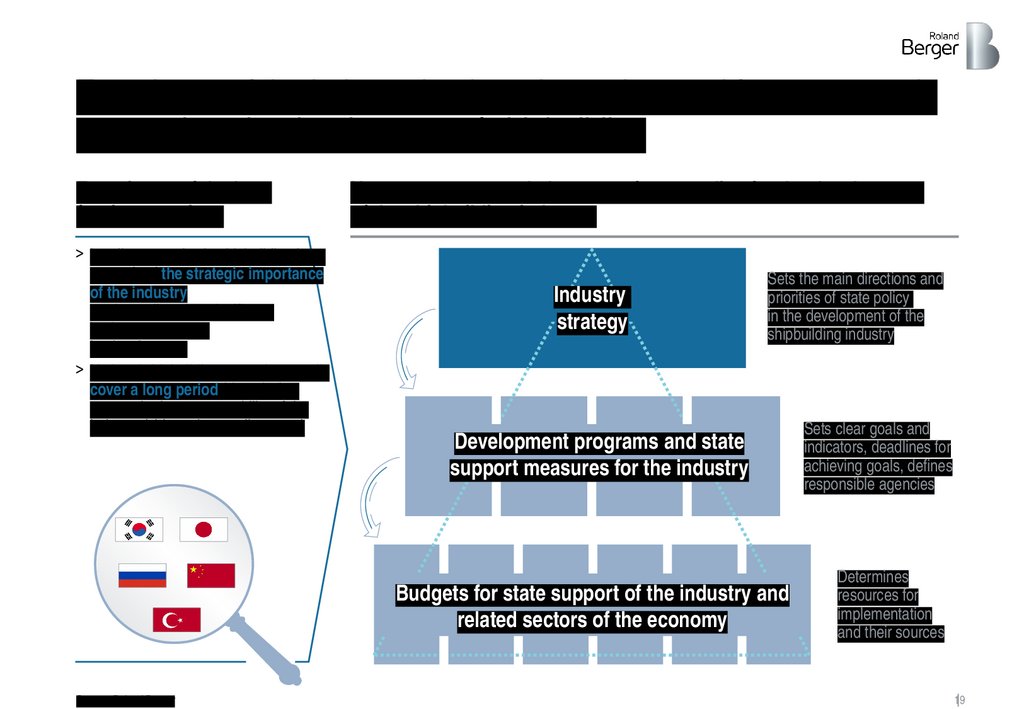
19.
Experience of the industry leaders shows the need for a systematicapproach to the development of shipbuilding
Experience of the best
foreign practices
> Leading countries in shipbuilding have
recognized the strategic importance
of the industry
and are allocating significant
budgets to support
its development
> National shipbuilding strategies usually
cover a long period (decades) to
ensure the long-term stability of the
industry (shipyards, suppliers, etc.)
Necessary structural elements of state policy for the development
of the shipbuilding industry
Industry
strategy
Sets the main directions and
priorities of state policy
in the development of the
shipbuilding industry
Development programs and state
support measures for the industry
Budgets for state support of the industry and
related sectors of the economy
Source: Roland Berger
Sets clear goals and
indicators, deadlines for
achieving goals, defines
responsible agencies
Determines
resources for
implementation
and their sources
19
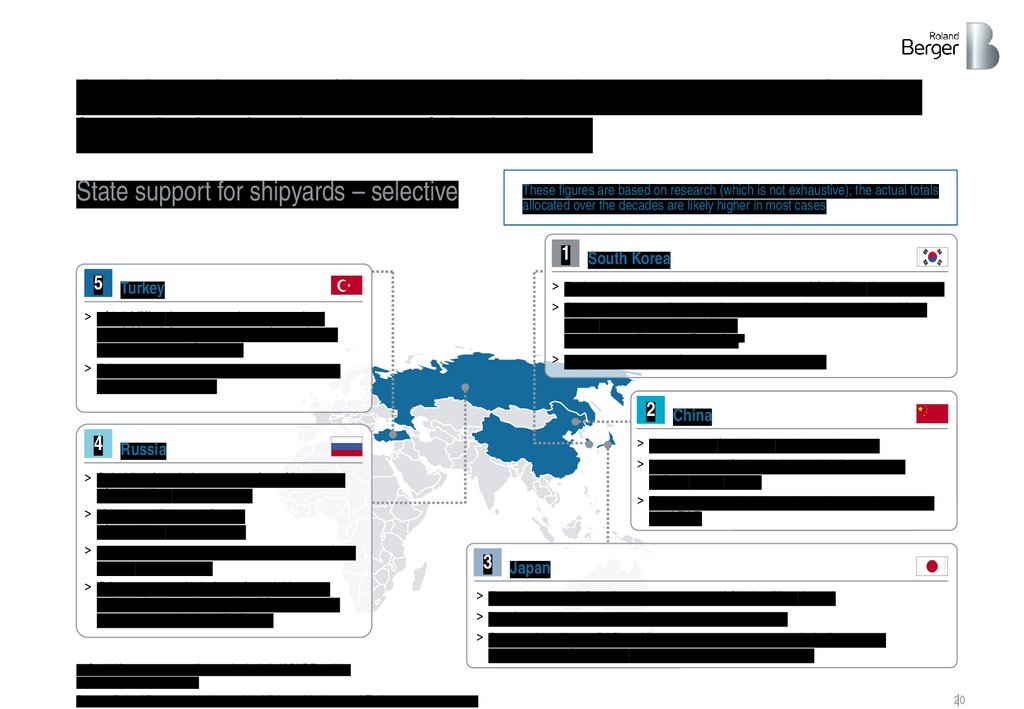
20.
And the existence of long-term national support programs is a keyfactor in the development of the industry
State support for shipyards – selective
These figures are based on research (which is not exhaustive); the actual totals
allocated over the decades are likely higher in most cases
1 South Korea
5 Turkey
> Preferential loans to shipyards in the amount of $9 billion (2015 – 2017)
> Shipyard customer financing (local transportation companies) of $9.5
billion (2015 – 2019) in addition
to export credit agency financing1)
> Personnel support of $130 million (2009 – 2014)
> ~$2.9 billion (2000 – 2019) to support land
acquisition, infrastructure expansion projects,
and concessional financing
> Other support measures: payment guarantees
and legislative benefits
2 China
4 Russia
> Subsidies for reimbursement of % of loan costs
~$120 million (2019 – 2022).
> "Shipboard Disposal Grant"
~$25 million (2019 – 2022).
> Marine and river civil ship leasing program ~$562
million (2010 – 2021)
> Other measures include preferential loans to
individual shipyards, creation of free economic
zones, support for local R&D, etc.
> Financing of $30 billion in shipyards (2009)
> Investments in Chinese shipyards infrastructure
of $2.5 billion (2006)
> Other measures include tax incentives and support for
local R&D
3 Japan
> Export loans and direct loans to customers of $440 million (2010)
> The $320 million in concessional lending (2018 – 2019)
> Support for industry R&D and human resources programs, including grants
(an average of $65 million per year for educational programs)
1) South Korean export credit agencies include K-SURE and the
Export-Import Bank of Korea
Source: Roland Berger research materials, Ministry of Industry and Trade, government reports
20
21.
Reference Materials OnLeading Countries In
Shipbuilding
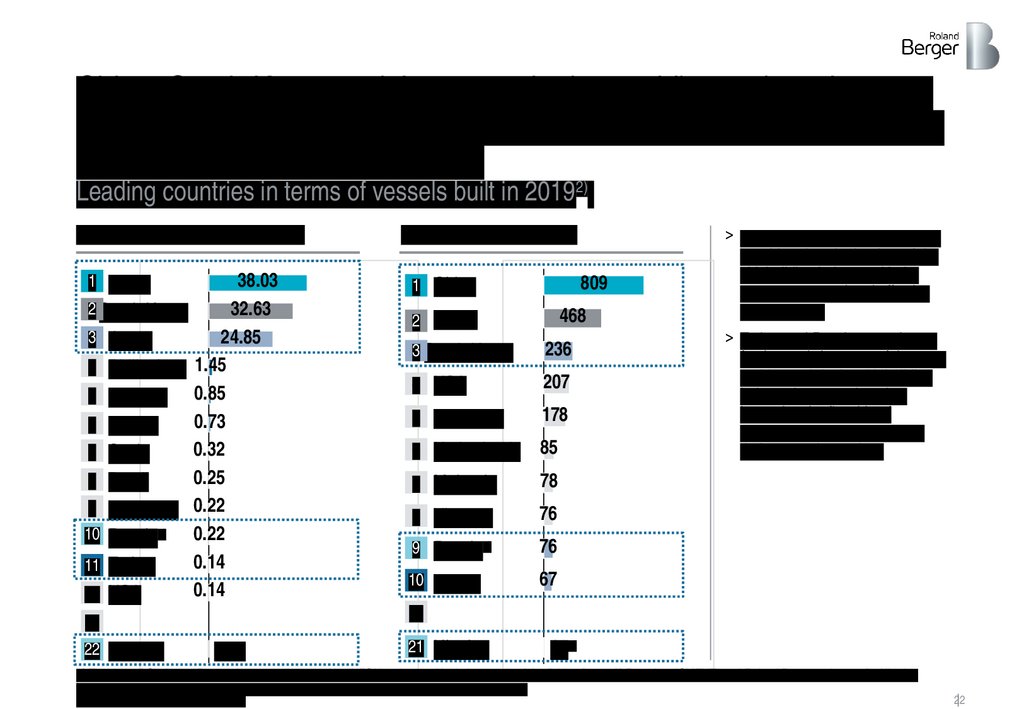
22.
China, South Korea and Japan are in the world's top three in termsof total DWT and number of vessels built, while Turkey is the fastest
growing in the Black Sea region
Leading countries in terms of vessels built in 20192)
Total DWT of ships [mln tons]
38.03
2 South Korea
32.63
3 Japan
24.85
4 Philippines 1.45
0.85
5 Vietnam
0.73
6 Taiwan
0.32
7 Spain
0.25
8 Brazil
9 Indonesia 0.22
10 Russia1)
0.22
0.14
11 Turkey
0.14
12 USA
1 China
809
1 China
468
2 Japan
3 South Korea
236
4 USA
207
5 Indonesia
178
6 Netherlands
85
7 Malaysia
78
8 Vietnam
76
9 Russia1)
76
10 Turkey
67
> China, South Korea, Japan were
considered as the leaders of the
shipbuilding industry with the
most pronounced and effective
state support
> Turkey and Russia were chosen
for the study because of the most
rapid growth in the shipbuilding
industry in recent decades,
becoming the flagship of
shipbuilding and ship repair in
their respective regions
…
…
22 Ukraine
Number of ships [pcs.]
0.03
21 Ukraine
102)
1) The data of Сlarksons Research are supplemented by INFOLine data and include vessels of the fishing fleet; 2) Based on *CLIENT* and Roland Berger estimates for Ukraine
excluding military orders; with military orders – 14 pcs. The other countries – civilian ships only.
Source: Сlarksons Research, INFOLine
22
23.
All leading countries have shipbuilding strategies to improve thecompetitiveness of shipyards
Review of National Strategies
> Leading countries in
shipbuilding have recognized
the strategic importance of
the industry and have
allocated significant budgets
to support its development
> National shipbuilding
strategies usually cover a
long period (decades) to
ensure the long-term stability
of the industry (shipyards,
suppliers, etc.)
> Localization is the key
support mechanism that
involves the production and
repair of military and civilian
ships at local shipyards
Briefly on national shipbuilding strategies
1
2
3
4
5
Key advantages
> A water transport strategy is
being implemented, currently
under the leadership of the
KOSHIPA association
Localization of defense
capabilities (increased
security)
China
> Implemented since 2006 – growth
as a result of initiatives has
pushed the industry into 3rd place
in the world
Long-term contribution
Japan
> Implemented since 1947 –
significant growth in military and
civilian shipbuilding
South
Korea
Russia
Turkey
Source: Roland Berger, OECD, Clarksons Research, reports of country agencies
> Development strategies were laid in
the early 2010s; an updated strategy
for the development of the
shipbuilding industry until 2035 was
approved in October 2019
> Implemented since 2000, thanks to
which the industry now ranks 11th
in the world
to GDP
Job creation (direct
and indirect)
Significant spillover
effects on other
industries
23
24.
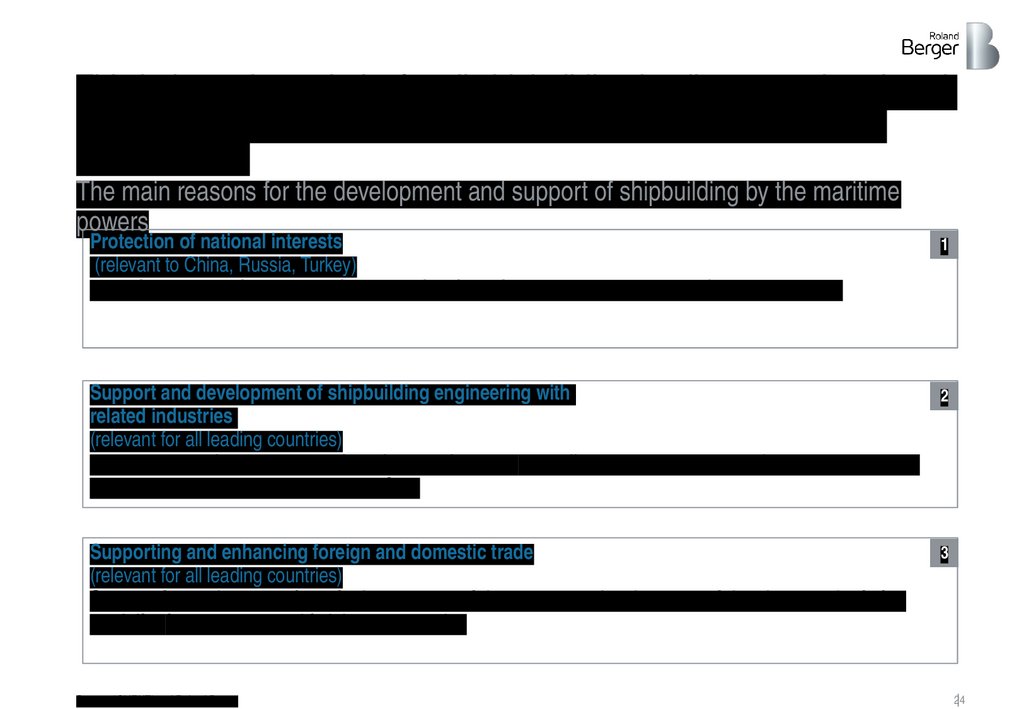
This industry is a priority for all shipbuilding leading countries since itprotects national interests and creates support for the economy
development.
The main reasons for the development and support of shipbuilding by the maritime
powers
Protection of national interests
(relevant to China, Russia, Turkey)
Ensuring a strategic presence in areas of national interest and increasing defense capabilities
1
Support and development of shipbuilding engineering with
related industries
(relevant for all leading countries)
Development of a complex engineering sub-industry with effects in a large number of related industries, a
long-term contribution to the country's GDP
2
Supporting and enhancing foreign and domestic trade
(relevant for all leading countries)
Support for trade expansion of other sectors of the economy, development of the cheapest logistics
modality for passenger and freight transportation
3
Source: *CLIENT* and Roland Berger
24
25.
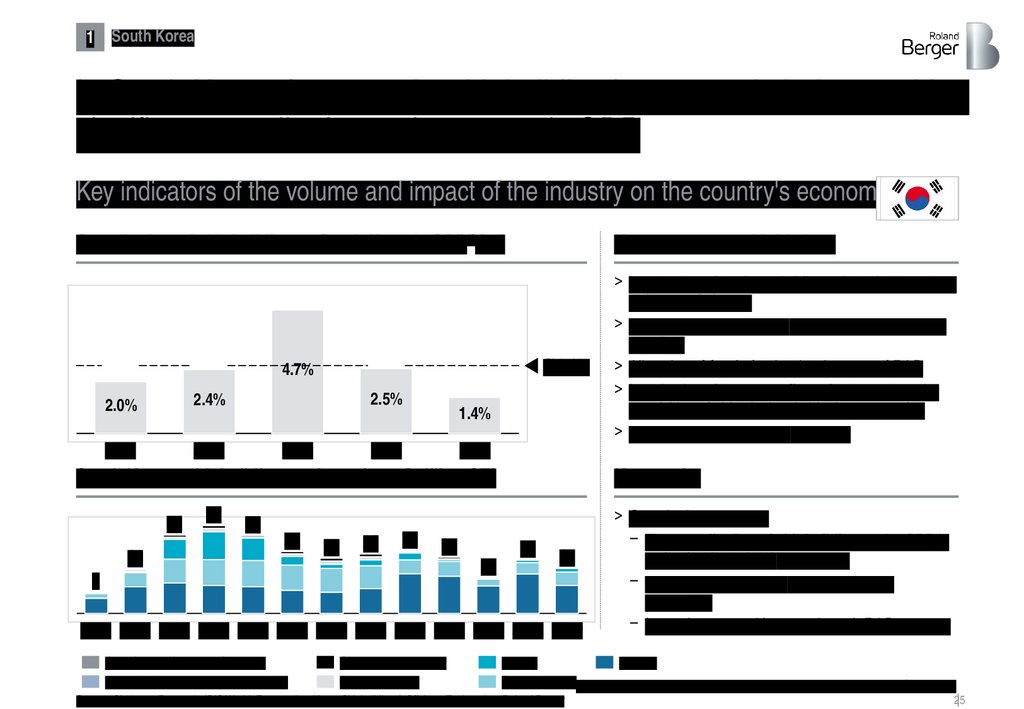
1South Korea
In South Korea, for example, shipbuilding is a strategic industry with a
significant contribution to the country's GDP
Key indicators of the volume and impact of the industry on the country's economy
Contribution of shipbuilding to South Korea's GDP 1) [%]
Key measures and initiatives
Ø 2.6%
4.7%
2.0%
2.4%
2000
2005
2.5%
2009
1.4%
2015
2019
South Korean shipbuilding market volume [million GT]
31
35
31
25
18
22
24
25
23
9
Key results
22
15
18
2000 2005 2010 2011 2012 2013 2014 2015 2016 2017 2018 2019 2020
Other/special (non-cargo) vessels
Ferries/Ro/Ro type passenger vessels
General cargo vessels
Offshore vessels
> Introduction of preferential financing of shipyards to
reduce capital costs
> Creation of an equipment testing center to support
suppliers
> Allocation of funds for the development of R&D
> Introduction of customer financing to support the
acquisition of ships by local shipping companies
> Creation of export credit insurance
> Over the last 20 years
– The contribution of shipbuilding to the GDP is
maintained at ~ 2.6% on average
– Formation of demand by local shipping
companies
– Improving competitiveness through R&D support
Bulkers
Tankers
Container ships1) Military shipbuilding was also taken into account in calculating the GDP share
Source: Clarksons Research, IBIS World, Euromonitor, Korea Shipbuilding & Offshore Engineering, Roland Berger
25
26.
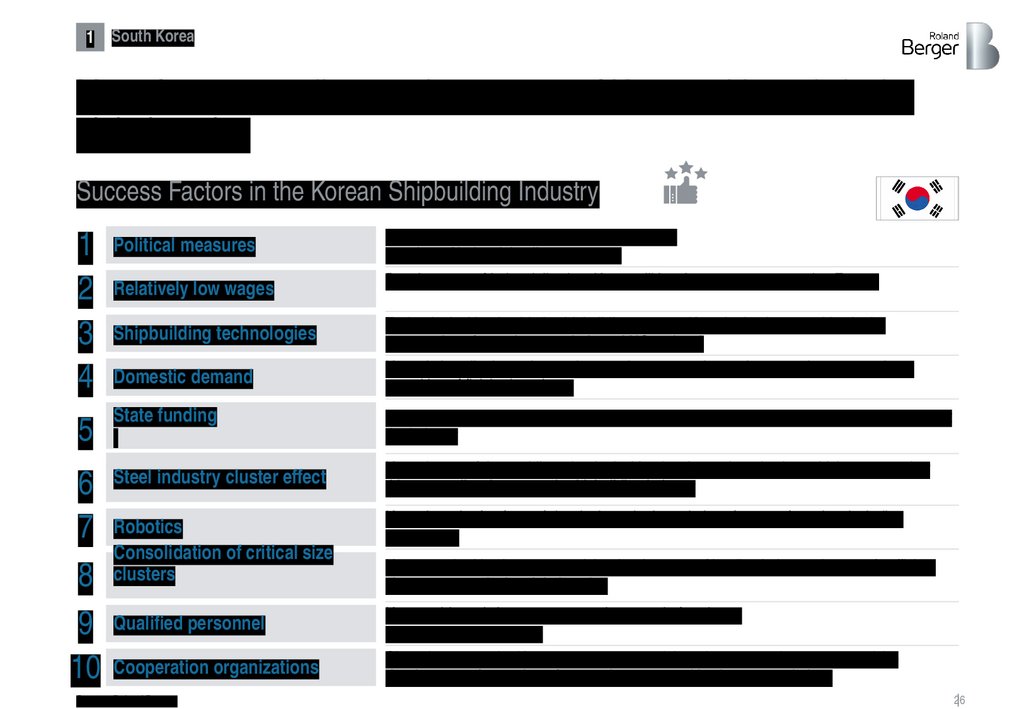
1South Korea
Many factors contribute to the success of Korean shipyards in the
global market
Success Factors in the Korean Shipbuilding Industry
1
2
3
4
5
6
7
8
9
10
Political measures
The government supports shipbuilding through
a variety of industrial policy measures
Relatively low wages
Despite years of industrialization, Korea still has low wages compared to Europe
Shipbuilding technologies
Technological leadership in shipbuilding ensures Korea's dominant position in the
construction of complex vessels (e.g., LNG tankers)
Korea is heavily dependent on imported resources, but at the same time exports large
quantities of finished products
Domestic demand
State funding
Korea has systematized the funding environment for shipbuilding projects needed to support
the industry
Steel industry cluster effect
Korea is one of the world's technological leaders in steel production, which, among other
things, supplies the country's shipbuilding industry
Robotics
Consolidation of critical size
clusters
Korea is at the forefront of developing robotics solutions for manufacturing, including
shipbuilding
Qualified personnel
Korean shipyards have access to a large pool of workers,
specialists and managers
Since the 1970s, the Korean government and the private sector have supported the
development of a number of research centers and business associations
Cooperation organizations
Source: Roland Berger
Korean authorities have ensured the development of leading industry clusters of sufficient
size to compete in the global market
26
27.
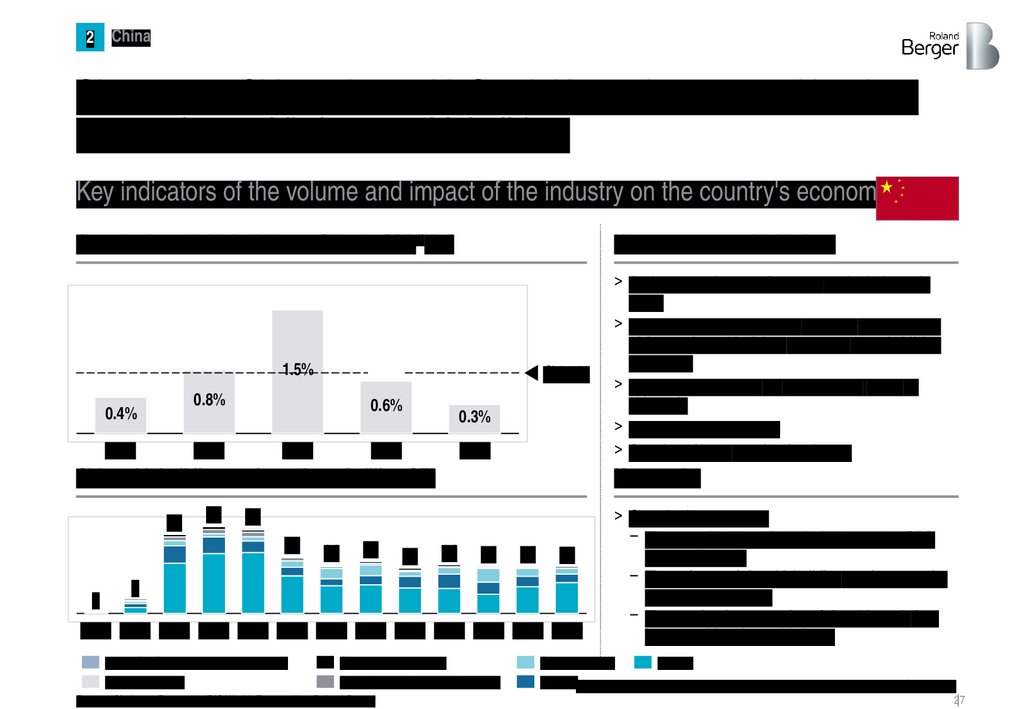
2China
Since 2010, China, along with South Korea, has secured its place
among the world's largest shipbuilders
Key indicators of the volume and impact of the industry on the country's economy
Contribution of shipbuilding to China's GDP1) [%]
Key measures and initiatives
1.5%
Ø 0.7%
0.8%
0.4%
2000
0.6%
2005
2009
0.3%
2015
2019
China shipbuilding market volume [million GT]
39
43
2
Key results
42
28
24
26
23
24
24
24
23
7
2000 2005 2010 2011 2012 2013 2014 2015 2016 2017 2018 2019 2020
Ferries/Ro/Ro type passenger vessels
Offshore vessels
General cargo vessels
Other/special (non-cargo) vessels
Source: Clarksons Research, IBIS World, Euromonitor, Roland Berger
> Assignment of strategic status to the industry in
2006.
> Introduction of an incentive scheme for recycling
old vessels and building new ones by subsidizing
customers
> Granting preferential or interest-free loans to
shipyards
> Tax exemption or relief
> Creation of large production bases
> Over the last 20 years
– The contribution of shipbuilding to the GDP
averaged ~0.7%
– The volume of the shipbuilding market grew by
more than 11 times
– The production capacity of the shipyards has
increased by almost 22 times
Container ships
Bulkers
Tankers1) Military shipbuilding was also taken into account in calculating the GDP share
27
28.
China2
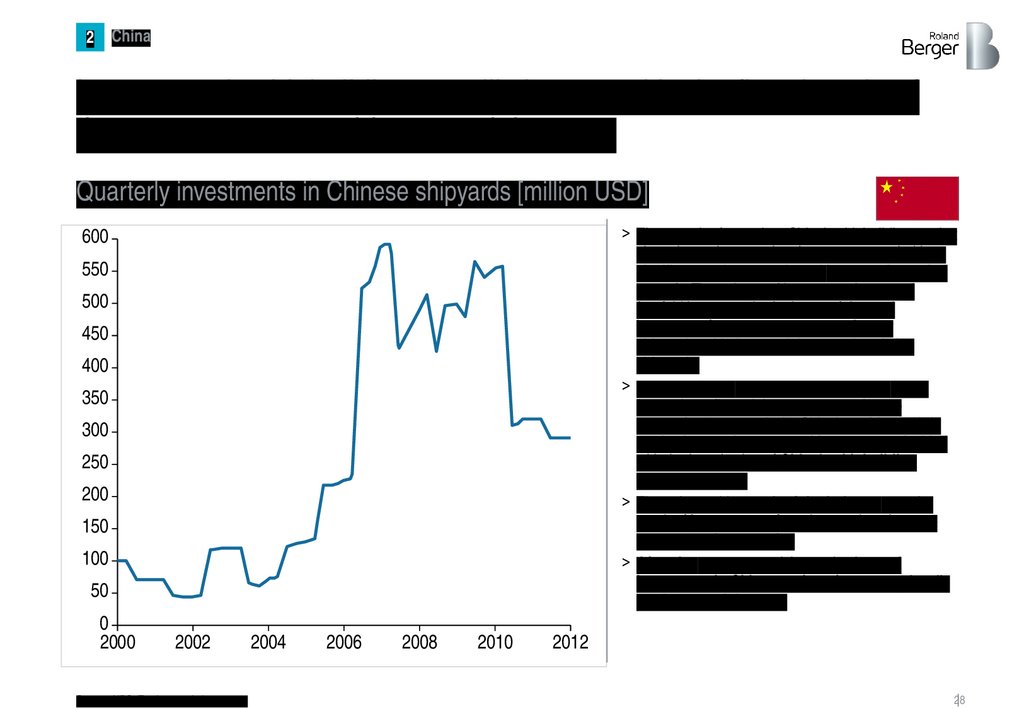
Investment in shipbuilding steadily increased in the first decade of
the 21st century, reaching a peak in 2007.
Quarterly investments in Chinese shipyards [million USD]
> The growth of entry into China's shipbuilding market
since the early 2000s has been accompanied by a
significant and unprecedented increase in capital
growth. The volume of investment increased
fourfold in 2006 only. And 43% of the total
investment from 2006 to 2011 was in new
shipyards, with the remaining 57% in existing
shipyards.
> 25%, 36%, and 38% of total investment came
from private firms, joint ventures, and state
enterprises, respectively. China's rapid growth in
production, market entry and investment coincided
with the introduction of China's shipbuilding
industrial policy
> Thus, the rapid growth of the industry was the
result of investments from key market players –
state-owned companies
> After the 2008-2012 crisis, production and
investment in China continued to grow primarily
on the part of the state
600
550
500
450
400
350
300
250
200
150
100
50
0
2000
2002
Source: NBS, Total quarterly investment
2004
2006
2008
2010
2012
28
29.
2China
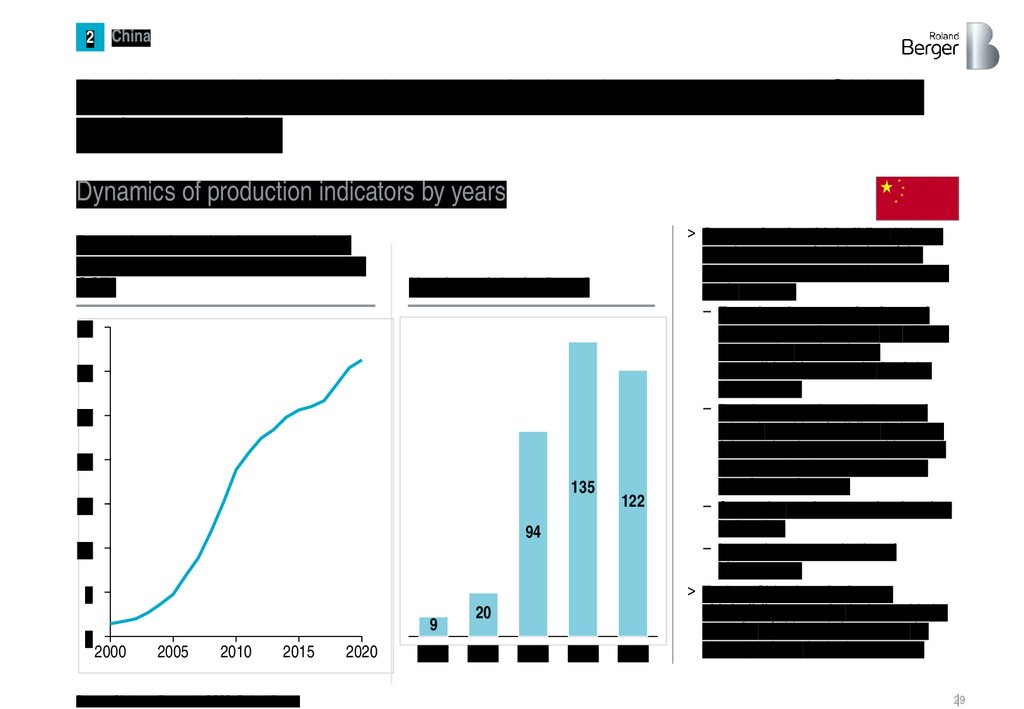
Rapid growth in production capacity has in turn supported China's
trade expansion
Dynamics of production indicators by years
Dynamics of production capacity of
chinese shipyards, 2000-2020 [million
CGT]
Number of docks [pcs.]
35
30
25
20
135
15
122
94
10
5
0
9
2000
2005
2010
2015
Source: Clarksons Research, OECD, Roland Berger
2020
2000
20
2005
2010
2014
2017
> Support for the shipbuilding industry
remains a strategic objective of the
Chinese government, which has several
goals at once
– Ensuring the strengthening and
development of the navy as a factor
in protecting national and
geopolitical interests in the AsiaPacific region
– Development of entire clusters of
related machine-building industries
(electronics, instrument making, etc.)
due to localization and technology
transfer requirements
– Supporting trade expansion in other
industries
– Increasing own production of
bioresources
> To date, China has the largest
shipbuilding capacity in the world, the
capacity of shipyards has grown by
almost 22 times in the last 20 years
29
30.
3Japan
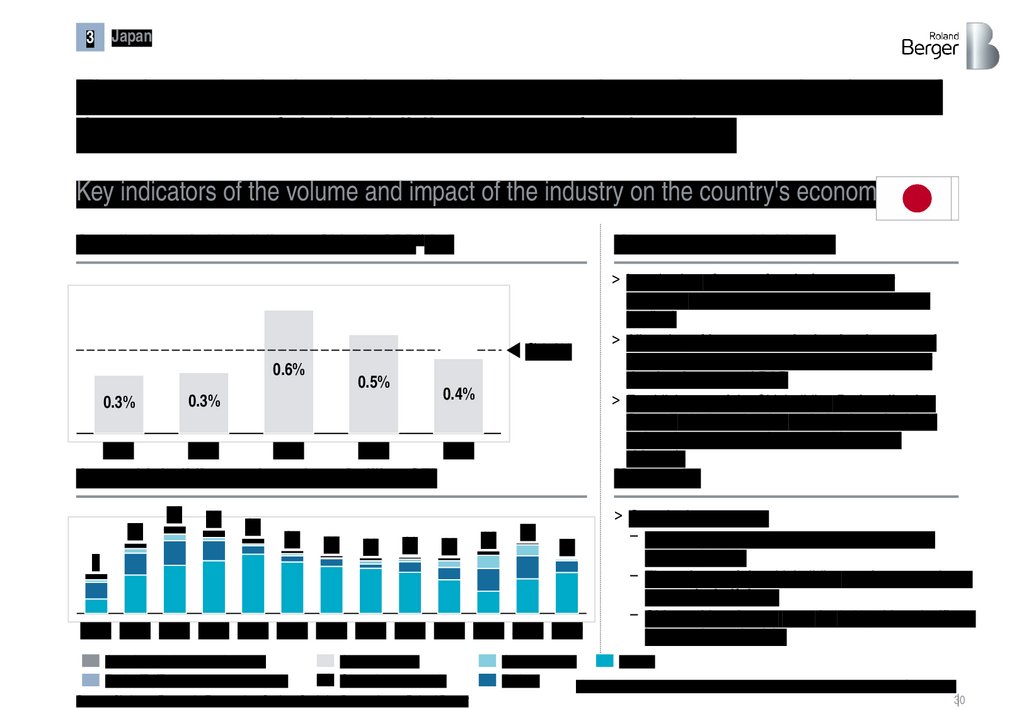
Thanks to the industry's stable support, Japan has remained one of
the most powerful shipbuilding powers for decades.
Key indicators of the volume and impact of the industry on the country's economy
Contribution of shipbuilding to China's GDP1) [%]
Key measures and initiatives
Ø 0.4%
0.6%
0.3%
0.3%
2000
2005
0.5%
2009
0.4%
2015
2019
Japan shipbuilding market volume [million GT]
16
20
19
17
15
9
13
13
13
Key results
13
14
16
13
2000 2005 2010 2011 2012 2013 2014 2015 2016 2017 2018 2019 2020
Other/special (non-cargo) vessels
Ferries/Ro/Ro type passenger vessels
> Introduction of a set of tools for customer
financing (export credit insurance, other types of
lending)
> Allocation of investments in the development of
human resources in shipbuilding and grants for
the development of R&D
> Establishment of the Shipbuilding Rationalization
Council, dedicated to the optimization of related
industries to support the competitiveness of
shipyards
Offshore vessels
General cargo vessels
Source: Clarksons Research, Euromonitor, Statista; Statistics Bureau Japan, Roland Berger
> Over the last 20 years
– The contribution of shipbuilding to the GDP
averaged ~0.4%
– The volume of the shipbuilding market grew almost
one and a half times
– Shipyard headcount grew by 27%, with a significant
increase in productivity
Container ships
Bulkers
Tankers
1) Military shipbuilding was also taken into account in calculating the GDP share
30
31.
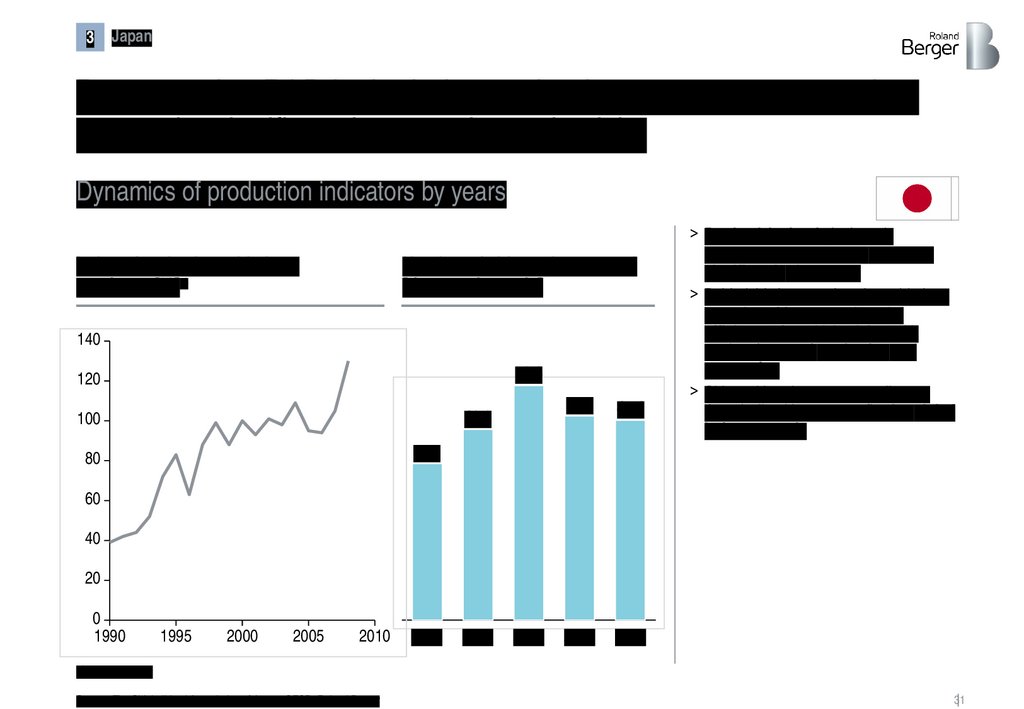
3Japan
By supporting R&D in the industry, the Japanese government has
ensured a significant increase in productivity
Dynamics of production indicators by years
Index of real value added per
employee [%]1)
Number of shipyard personnel
[thousand people]
140
53.3
120
43.3
100
46.4
45.4
2015
2020
> Productivity levels in Japan's
shipbuilding industry have increased
significantly since 1990.
> Behind this increase in value-added are
a number of factors, such as the
efficiency of combining labor with
modern factors of production and
automation
> Shipyard headcount grew until 2010,
then declined by ~15%, reflecting global
industry trends
35.6
80
60
40
20
0
1990
1995
2000
2005
2010
2000
2005
2010
1) 2000 = 100%
Source: The Shipbuilders' Association of Japan, OECD, Roland Berger
31
32.
3Japan
The Japanese government has introduced a set of credit and grant
instruments for the development of the shipbuilding industry
An overview of major lending and grant instruments in Japan
The volume of lending and grant instruments to support
shipbuilding in 2004-2011 [million dollars].
4,326
3,016
3,203 3,316
3,617
1,945
1,471
2004
2005
1,292
2006
2007
2008
2009
Source: The Shipbuilders' Association of Japan, OECD, Roland Berger
2010
> The Japanese government has divided its support
measures for the shipbuilding industry into four
categories:
– Export Credits – loans provided by the Japan
Bank for International Cooperation (JBIC) to
support export credits
– Export Credit Insurance – Insurance (net
coverage) provided by Nippon Export and
Investment Insurance (NEXI). NEXI does not
provide guarantees for export loans
– "Home" Credits – funding of maritime shipping
companies' projects to create a wide range of
maritime infrastructure provided by the
Development Bank of Japan (DBJ) in partnership
with commercial banks
– And grants for R&D – areas of technology to
reduce CO2 emissions
2011
32
33.
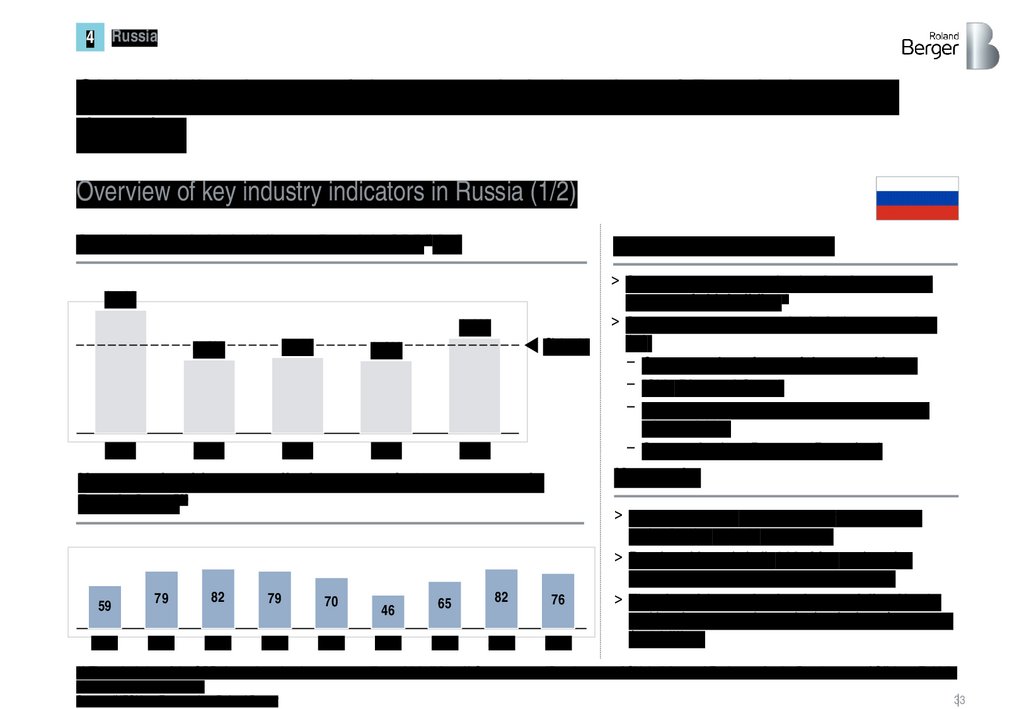
Russia4
Shipbuilding is one of the strategic industries of Russia in recent
decades
Overview of key industry indicators in Russia (1/2)
Contribution of shipbuilding to Russia's GDP1) [%]
Key measures and initiatives
0.7%
0.6%
2000
0.4%
0.5%
0.4%
2005
2009
2015
Ø 0.5%
2019
Key results
New vessels with a water displacement of 50 tons or more in
Russia [pcs.]3)
59
2011
79
82
79
70
2012
2013
2014
2015
> Separate state program for the development and
support of shipbuilding2)
> State support measures include (not a complete
list):
– Compensation of part of the cost of loans
– "Ship Disposal Grant"
– Marine and river civil ship leasing program and
other activities
– State order (e.g. Rosatom, Rosneft,...)
46
65
82
76
2016
2017
2018
2019
> The contribution of shipbuilding to the GDP is
maintained at ~ 0.5% on average
> Russian shipyards built 914 ships and marine
equipment in the period from 2010 to 2019
> The size of the marine leasing portfolio of banks
and leasing companies at the beginning of 2020 was
$5.8 billion.
1) The calculation of the GDP share also takes into account military shipbuilding; 2) State program "Development of Shipbuilding and Equipment for the Development of Offshore Fields";
3) Including fishing vessels
Source: INFOLine, Euromonitor, Roland Berger
33
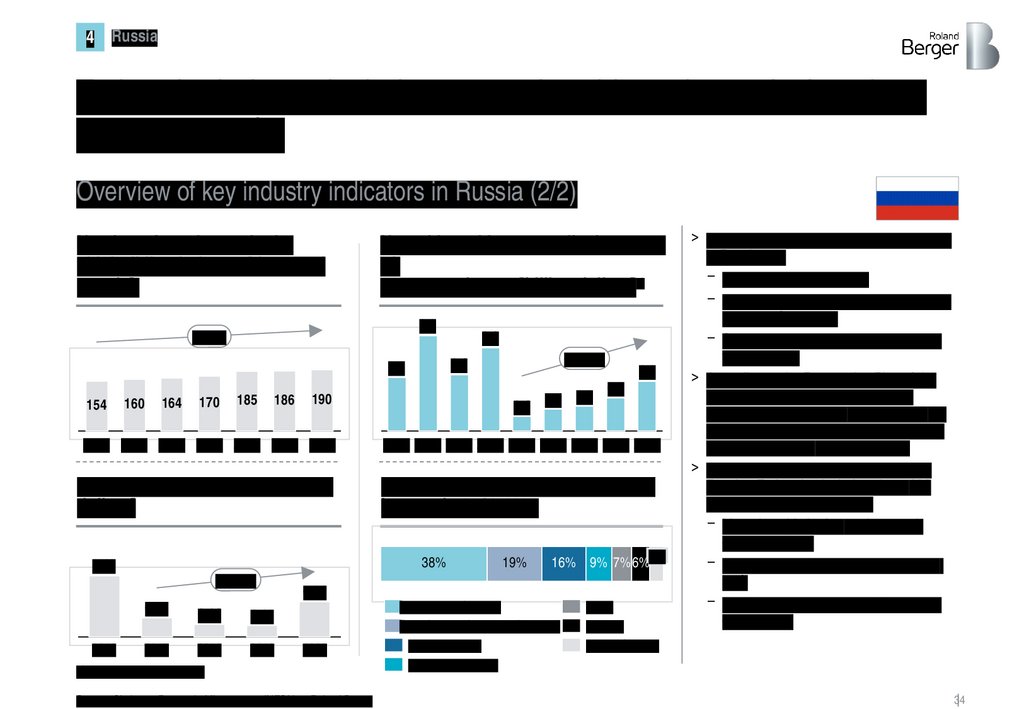
34.
4Russia
Today, the industry includes 180 active shipyards employing about
190,000 people.
Overview of key industry indicators in Russia (2/2)
Number of employees in the
shipbuilding industry [thousand
people].
New ships with a water displacement
of
50 tons and more [billion dollars]1)
2.3
+3.6%
160
164
170
185
186
190
2013 2014 2015 2016 2017 2018 2019
Use of budget allocations [billion
dollars]
+22.7%
0.21
2013
0.4
2017
0.14
0.13
2018
2019
0.5
0.6
1.2
0.8
2011 2012 2013 2014 2015 2016 2017 2018 2019
Structure of civilian ships launched
by type in 2018-2020
38%
0.68
+35.9%
1.4
1.3
154
2.0
19%
5%
16% 9% 7% 6%
0.39
2020
1) Including fishing vessels
Source: Clarksons Research, Minpromtorg, INFOLine, Roland Berger
Bulk carriers / barges
Other/special (non-cargo) vessels
Fishing vessels
Passenger vessels
Boats
Tankers
Ferries / Ro-Ro
> The key drivers of the shipbuilding industry
in Russia are:
– Updating the military fleet
– Development of arctic territories and the
Northern Sea Route
– Saturation of the domestic market with
fish products
> According to the Perspective Plan of the
Ministry of Industry and Trade of the
Russian Federation, the total demand for
ships and marine equipment in the period
from 2013 to 2035 will be 894 pcs.
> To date, the shipbuilding industry of the
Russian Federation includes about 600
enterprises, which include:
– More than 90 design and research
organizations,
– 180 shipyards and ship repair plants,
and
– More than 300 companies producing
components
34
35.
Turkey5
Since 2000, Turkey has been systematically developing and
supporting the shipbuilding industry
Key indicators of the volume and impact of the industry on the country's economy
Contribution of shipbuilding to Turkey's GDP1) [%]
Key measures and initiatives
0.5%
0.4%
0.3%
0.3%
Ø 0.3%
0.1%
2000
2005
2009
2015
2019
Turkey shipbuilding market volume [million GT]
0.4
0.2
0.2
0.3
0.2
0.1
0.1
0.1
0.1
> Land acquisition and infrastructure development
for local shipyards
> Provision of guarantees for direct loans for
shipbuilding activities
> Exemption of shipyards from a whole group of taxes
(VAT, customs duties, etc.), funding of social
insurance
> Subsidizing certain groups of costs
0.1
Key results
0.1
0.1
0.1
> Turkey was the world's 11th largest shipbuilding
nation in 2019
> Production capacity has quadrupled since 2000
> The number of workers employed in shipbuilding
doubled to 30 thousand in 2019
2000 2005 2010 2011 2012 2013 2014 2015 2016 2017 2018 2019 2020
Offshore vessels
Container ships
Ferries/Ro/Ro type passenger vessels
General cargo vessels
Source: Clarksons Research, Euromonitor, Roland Berger
Bulkers
Tankers
Other/special (non-cargo) vessels
1) Military shipbuilding was also taken into account in calculating the GDP share
35
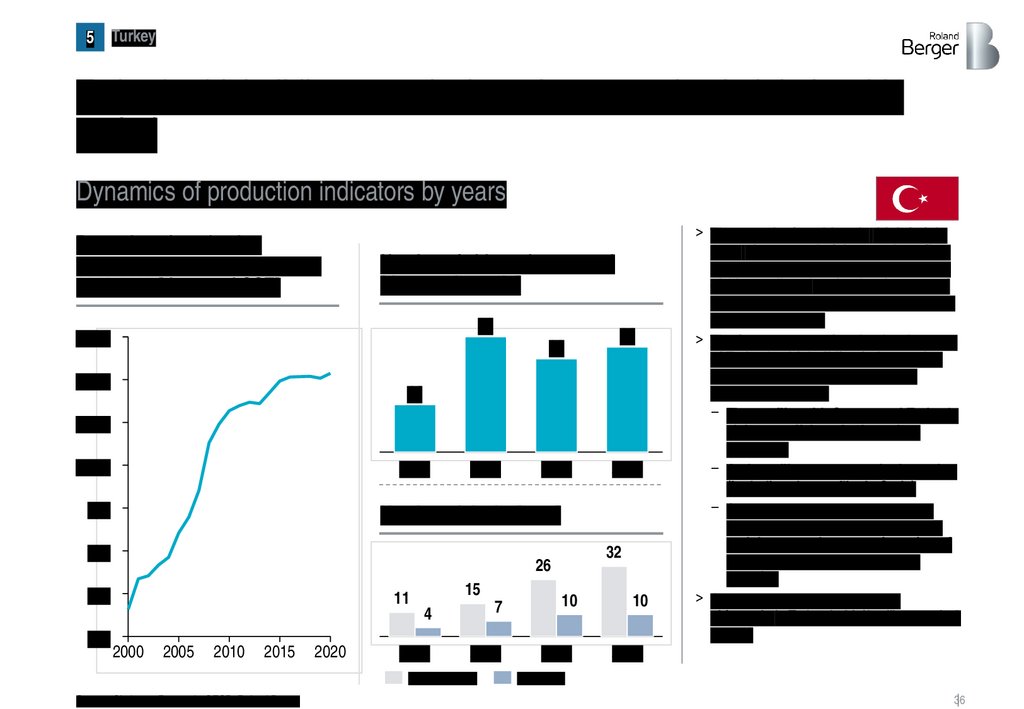
36.
5Turkey
Turkey's shipbuilding capacity has almost quadrupled during this
period
Dynamics of production indicators by years
Dynamics of production
capacities of Turkish shipyards,
2000-2020 [thousand CGT]
Number of shipyard personnel
[thousand people]
34
1,600
28
1,400
31
14
1,200
1,000
2003
800
2008
2019
Number of docks [pcs.]
600
32
26
400
200
2017
11
2000
2005
2010
2015
2020
15
4
7
2003
2008
Floating docks
Source: Clarksons Research, OECD, Roland Berger
10
2017
10
> The growth of world trade, high freight
rates, the renewal of the merchant fleet
in accordance with international rules – all
of this contributed to the development of
maritime transport and the shipbuilding
industry of Turkey.
> The factors supporting the development
of Turkey's shipbuilding industry also
include the country's military and
political ambitions:
– The conflict with Cyprus and Turkey's
claims to offshore hydrocarbon
resources
– Active military presence in the region
(including the conflict in Syria)
– Strategic objectives to reduce the
import dependence of shipbuilding
and the general export orientation of
the country's military-industrial
complex
> Currently, the number of active
shipyards in Turkey is 82 (9 military and 73
private)
2019
Dry docks
36
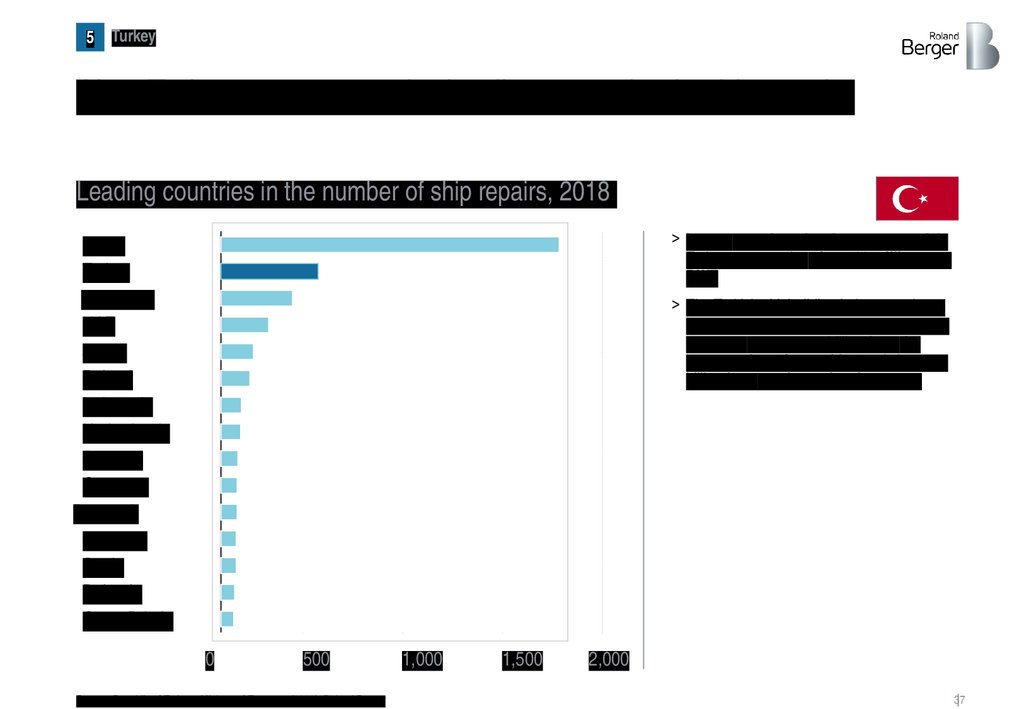
37.
5Turkey
Also, Turkey was among the leading countries in ship repairs
Leading countries in the number of ship repairs, 2018
> In 2020, repair and maintenance work in
Turkey amounted to about 22 million tons
DWT
China
Turkey
Singapore
UAE
Japan
Poland
Indonesia
Netherlands
Portugal
Germany
Denmark
Romania
Spain
Bulgaria
Great Britain
> The Turkish shipbuilding industry makes a
significant contribution to the country's
economy: approx. 1.1 billion from the
construction of new ships and about 0.7
billion from repairs and maintenance
0
500
Source: Republic of Turkey - Ministry of Economy (2018), Roland Berger
1,000
1,500
2,000
37
38.
3. The region market, thepotential for
Ukraine
39.
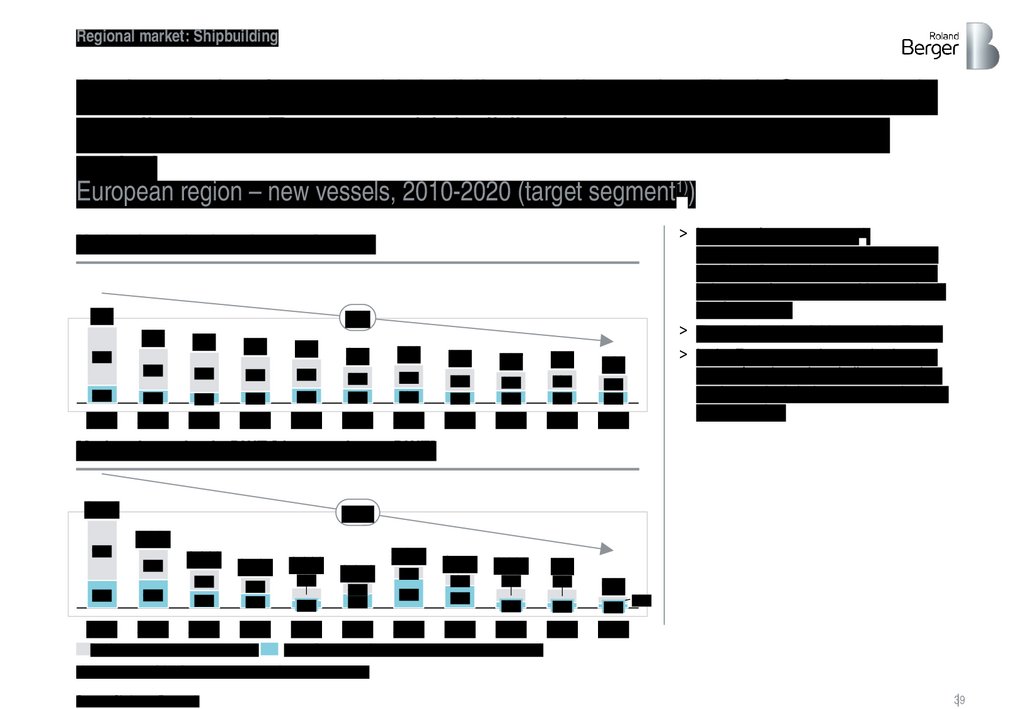
Regional market: ShipbuildingAs the market for new shipbuilding declines, the Black Sea region's
contribution to European shipbuilding has grown over a 10-year
period
1)
European region – new vessels, 2010-2020 (target segment )
> In terms of target segment1)
for Ukraine, the share of shipbuilding of
the Black Sea basin has not decreased
below 30% from 2014, and in 2020 it will
be almost 42%.
> The main leader of this growth is Turkey
> In the European region, production and
types of work, such as hull construction,
are increasingly being outsourced to lowcost countries.
Market dynamics in unit terms [pcs, %]
573
-9%
410
382
350
332
275
288
76%
260
79%
66%
237
251
75%
61%
61%
212
61%
39%
62%
38%
58%
42%
2018
2019
2020
2,173 1 755
1,988 1,595 1,038
1 006
30%
1
272
63%
67%
33%
55%
980
77%
23%
24%
21%
25%
34%
39%
39%
66%
34%
2010
2011
2012
2013
2014
2015
2016
2017
Market dynamics in DWT [thousand tons DWT]
4,571
69%
-18%
3 045
52%
31%
48%
2010
2011
45%
53%
47%
2012
2013
EU (without Romania and Bulgaria)
37%
41%
59%
70%
2014
2015
2016
67%
2017
72%
600
33%
28%
37%
2018
2019
2020
63%
Black Sea region (Turkey, Bulgaria, Romania, Ukraine)
1) Except for LNG/LPG tankers and cruise/passenger vessels
Source: Clarksons Research
39
40.
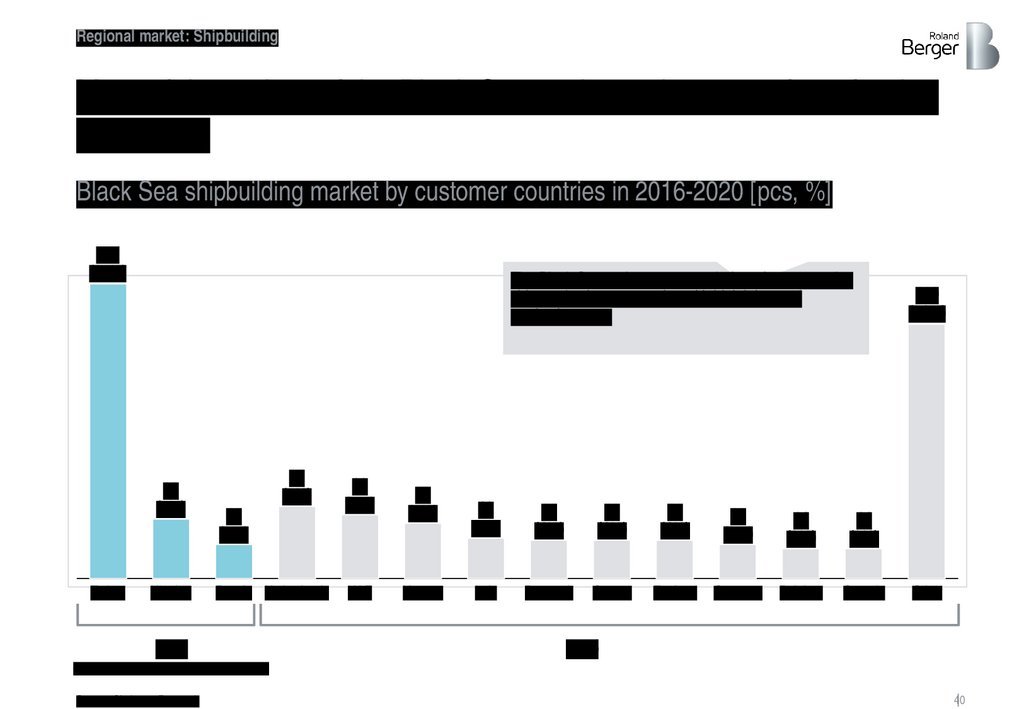
Regional market: ShipbuildingMost of the orders of the Black Sea region today come from foreign
customers
Black Sea shipbuilding market by customer countries in 2016-2020 [pcs, %]
139
(27%)
The Black Sea region acts as a platform for outsourcing
ship production to countries with high labor and
production costs
28
(5%)
Turkey
Ukraine
34
(7%)
16
(3%)
Russia Netherlands
35%
30
(6%)
UAE
26
(5%)
Norway
19
(4%)
18
(4%)
18
(4%)
18
(4%)
16
(3%)
14
(3%)
14
(3%)
Italy
Denmark
Greece
England
Germany
Belgium
Canada
120
(24%)
Other
65%
domestic demand of the black sea region
Source: Clarksons Research
40
41.
Regional market: ShipbuildingFor reference
Turkey and Romania are the leaders in the region in terms of vessels
launched, focusing on tankers and special non-cargo ships2)
Black Sea region – specialization of countries, new ships, 2016-2020 [pcs.]
Turkey
Romania
48
67
Bulk carriers1)
Tankers
Container ships
General cargo
vessels1)
Offshore vessels
Ferries/Passenger.
Ro/Ro type vessels
Bulgaria
Ukraine
> Turkey and Romania have
produced significantly larger
volumes over the past 5 years
than Ukraine and Bulgaria, both
in units and in thousands. DWT
> The main specialization of the
countries is:
– Turkey: tankers, ferries/RoRo, non-cargo special
vessels
– Romania: tankers, non-cargo
special vessels, offshore
vessels
– Bulgaria: tankers, non-cargo
special vessels
– Ukraine: general cargo1)
vessels and non-cargo
special vessels
Other/Special (noncargo) vessels2)
1) In some cases it is statistically difficult to separate bulk carriers and general cargo ships. It is advisable to consider these categories together; 2) Mainly tugboats
Source: Clarksons Research
41
42.
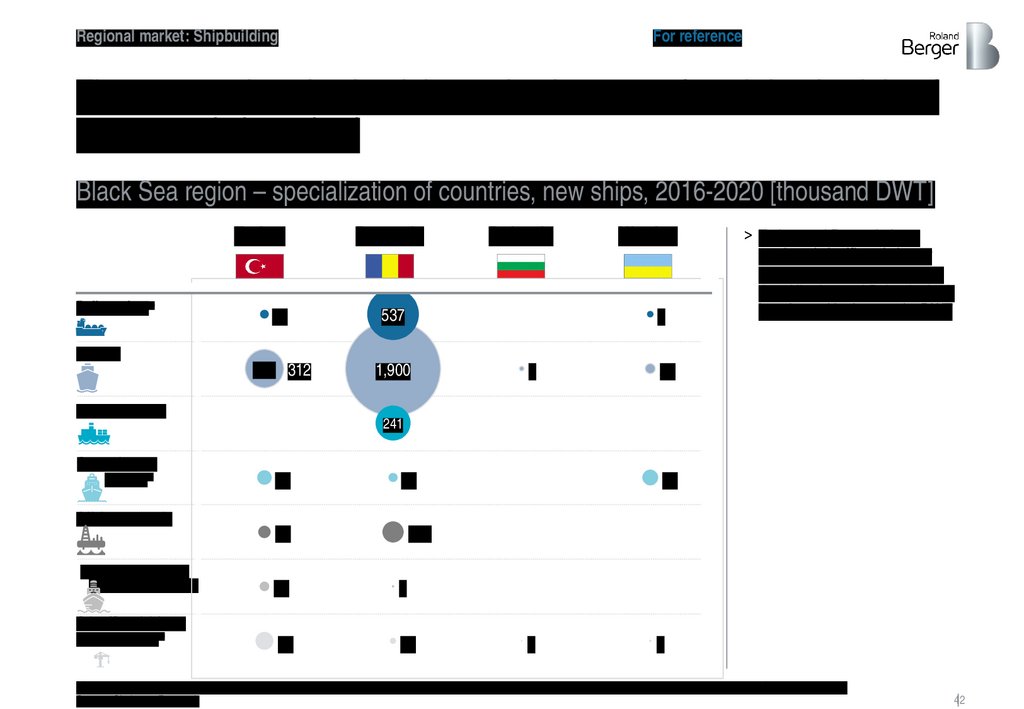
Regional market: ShipbuildingFor reference
These countries also lead the region in terms of total deadweight of
new vessels launched
Black Sea region – specialization of countries, new ships, 2016-2020 [thousand DWT]
Turkey
Bulk carriers1)
Romania
12
537
312 312
1,900
Bulgaria
Ukraine
6
> Turkey and Romania have
produced significantly larger
volumes over the past 5 years
than Ukraine and Bulgaria, both
in units and in thousands. DWT
Tankers
Container ships
General cargo
vessels1)
Offshore vessels
5
22
241
37
13
39
45
105
Ferries/Passenger.
Ro/Ro type vessels
24
3
Other/Special (noncargo) vessels2)
77
11
2
3
1) In some cases it is statistically difficult to separate bulk carriers and general cargo ships. It is advisable to consider these categories together; 2) Mainly tugboats
Source: Clarksons Research
42
43.
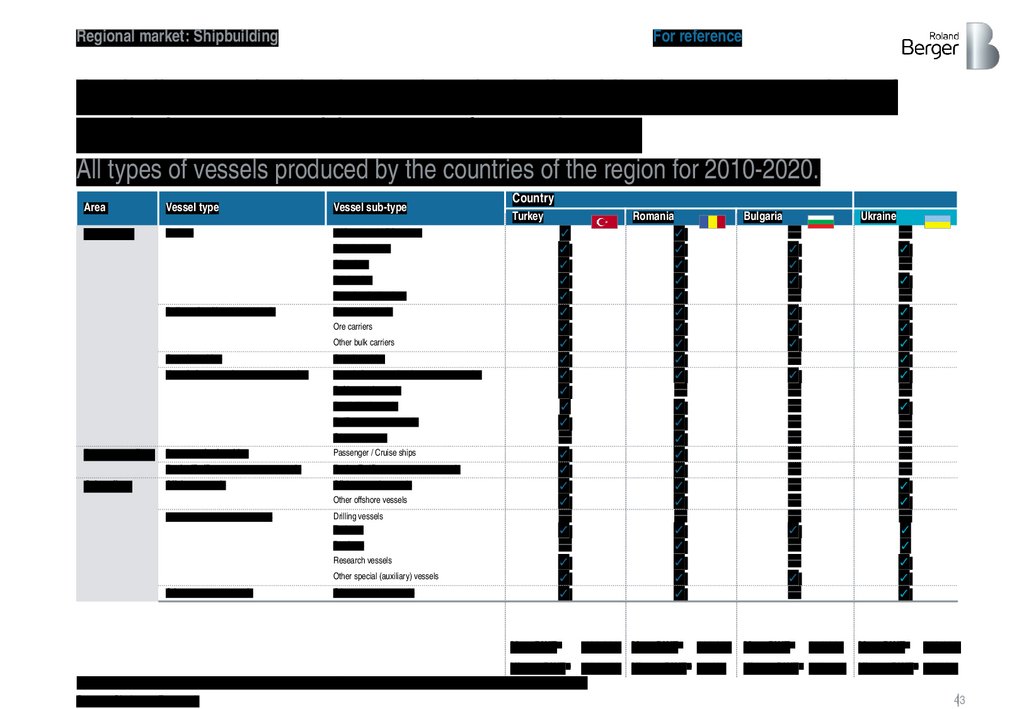
Regional market: ShipbuildingFor reference
And all countries in the region, including Ukraine, are capable of
producing a very wide range of vessel types
All types of vessels produced by the countries of the region for 2010-2020.
Area
Vessel type
Vessel sub-type
Cargo fleet
Tankers
LNG tankers / LPG tankers
Chemical tankers
Oil tankers
Food tanker
Petrochemical tankers
Bulk carriers/dry cargo vessels
Dry cargo vessels
Ore carriers
Other bulk carriers
Container ships
Container ships
Vessels for general cargo transportation
Vessels for conventional cargo transportation
Refrigerated vessels
Specialized vessels
Ro/Ro type cargo vessels
Car transporters
Passenger fleet
Other fleet
Passenger/cruise ships
Passenger / Cruise ships
Ferries/Ro/Ro type passenger vessels
Ferries/Ro/Ro type passenger vessels
Offshore vessels
Offshore supply vessels
Other offshore vessels
Specialized (auxiliary) vessels
Drilling vessels
Tugboats
Dredgers
Research vessels
Other special (auxiliary) vessels
Other non-cargo vessels
Other non-cargo vessels
Country
Turkey
Romania
✓
✓
✓
✓
✓
✓
✓
✓
✓
✓
✓
✓
✓
─
✓
✓
✓
✓
─
✓
─
✓
✓
✓
Bulgaria
✓
✓
✓
✓
✓
✓
✓
✓
✓
✓
─
✓
✓
✓
✓
✓
✓
✓
─
✓
✓
✓
✓
✓
Ukraine
─
✓
✓
✓
─
✓
✓
✓
─
✓
─
─
─
─
─
─
─
─
─
✓
─
─
✓
─
Мax. DWT1)
180,000
Max. DWT1)
100,000
Histor. DWT2)
184.744
Histor. DWT2) 55.437
Max. DWT1)
─
✓
─
✓
─
✓
✓
✓
✓
✓
─
✓
─
─
─
─
✓
✓
─
✓
✓
✓
✓
✓
250,000
Histor. DWT2) 179.754
Max. DWT1)
300,000
Histor. DWT2) 66.187
1) Based on the technical capabilities of the shipyard; 2) By vessels manufactured and serviced since 2000
Source: Clarksons Research
43
44.
Regional market: ShipbuildingThe production capacity of Ukrainian shipyards today is ~196
thousand CGT, and the maximum deadweight up to 300 thousand
tons.
Capacity of Ukrainian shipyards producing civilian ships
Distribution of capacity of Ukrainian civil shipbuilders [thousand CGT]
196
According to *CLIENT* experts, despite the wear and tear, the
production capacity of the shipyards can be restored in the short
term to its maximum potential
35
30
39
22
18
14
14
TOTAL
Max.
deadweight
[thousand
DWT]
*CLIENT*
Kherson
*CLIENT*
Nikolaev
Ocean
27.52)
102)
661)
12
11
Nibulon Kiliya Shipyard Dunnay
Azov Shipyard
Dunnay Ship Service
61 Communard
Ship
Repair
8.7
5.5
10.8
8.5
7
> Of all the capacities of
Ukrainian shipyards,
84% belong to the
segment of up to 15
thousand DWT
> The only powerful
shipyard in Ukraine –
the shipyard "Ocean",
the maximum
deadweight up to 300
thousand DWT
> The capacity of the
shipyard "Forge on
Rybalsky" is excluded
from the review
because of
specialization in
military orders
8.5
1) Based on historical data on ships produced since 2000, however, the design capacity is 300,000 tons. DWT
2) Based on historical data from *CLIENT*
Source: Clarksons Research, Roland Berger, data of companies
44
45.
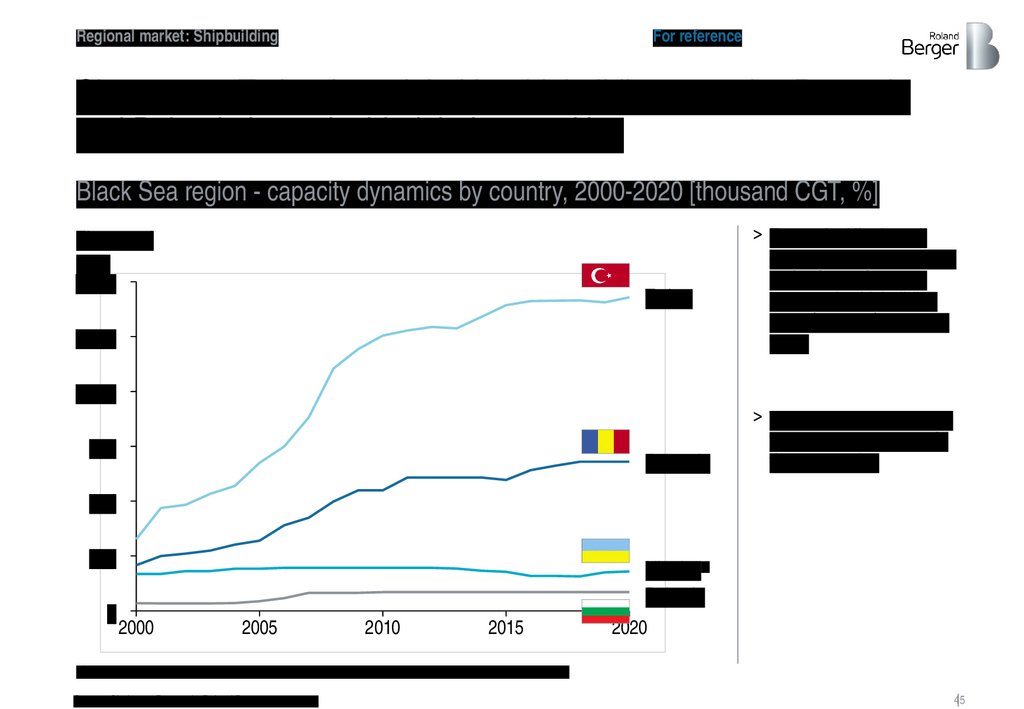
Regional market: ShipbuildingFor reference
Since 2000, Turkey has tripled its shipbuilding capacity, Romania
and Bulgaria have doubled their capacities
Black Sea region - capacity dynamics by country, 2000-2020 [thousand CGT, %]
Thousand
CGT
1,500
Turkey
1,250
> Except for Ukraine, all
countries in the Black Sea
region have shown an
increase in shipbuilding
capacity over the past 20
years
1,000
750
Romania
> This growth is largely due
to government support in
these countries
500
250
0
Ukraine1)
Bulgaria
2000
2005
2010
2015
2020
1) The small increase in capacity in 2018-2019 in Ukraine is due to the development of Nibulon capacity
Source: Clarksons Research, Roland Berger assessment
45
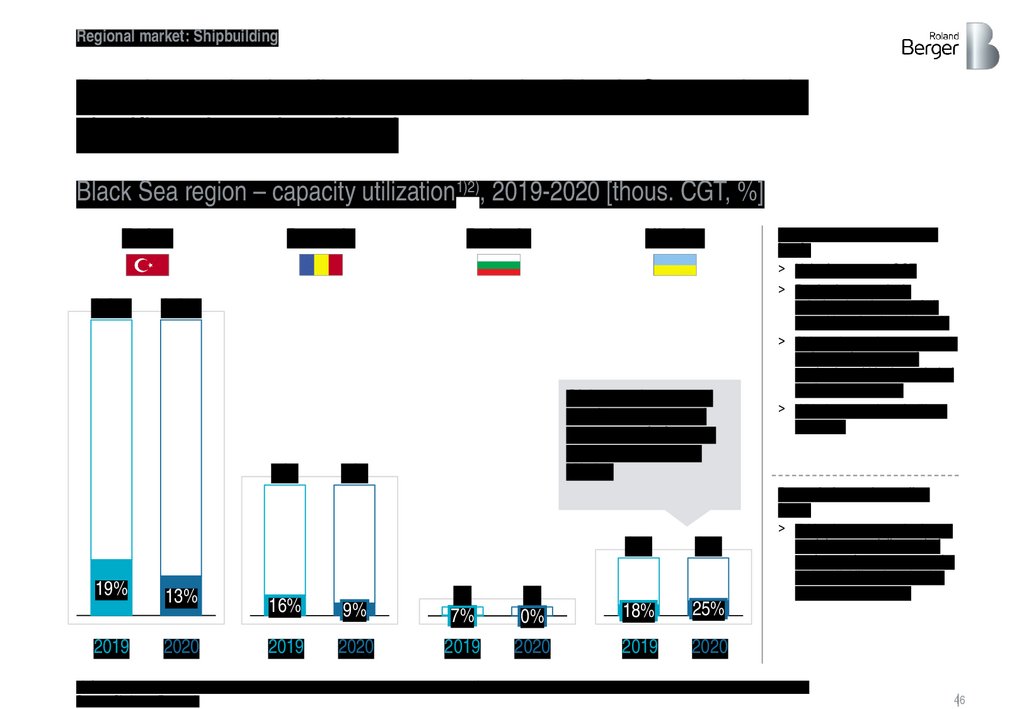
46.
Regional market: ShipbuildingDespite such significant capacity, the Black Sea region is
significantly underutilized
Black Sea region – capacity utilization1)2), 2019-2020 [thous. CGT, %]
Turkey
1,429
Romania
2019
Ukraine
1,429
717
19%
Bulgaria
Of the 18% in 2019 and
25% in 2020. 11% and
12%, respectively, come
from the production of
Nibulon
717
196
196
13%
16%
9%
85
7%
85
0%
18%
25%
2020
2019
2020
2019
2020
2019
2020
Approach to estimating load
levels
> Unit of measure – CGT
> Production capacity is
calculated as the sum of all
capacities of active shipyards
> Shipyard capacity corresponds
to the maximum annual
production within the period of
the last twenty years
> With the exception of military
shipyards
Depreciation and recycling
factor
> Taking into account the fact of
partial wear and disposal of
equipment in recent years, the
real availability of production
facilities may be lower
1) Clarksons Research data may not reflect the actual state of individual shipyards; 2) For Ukraine, available capacity is shown excluding military shipyards
Source: Clarksons Research
46
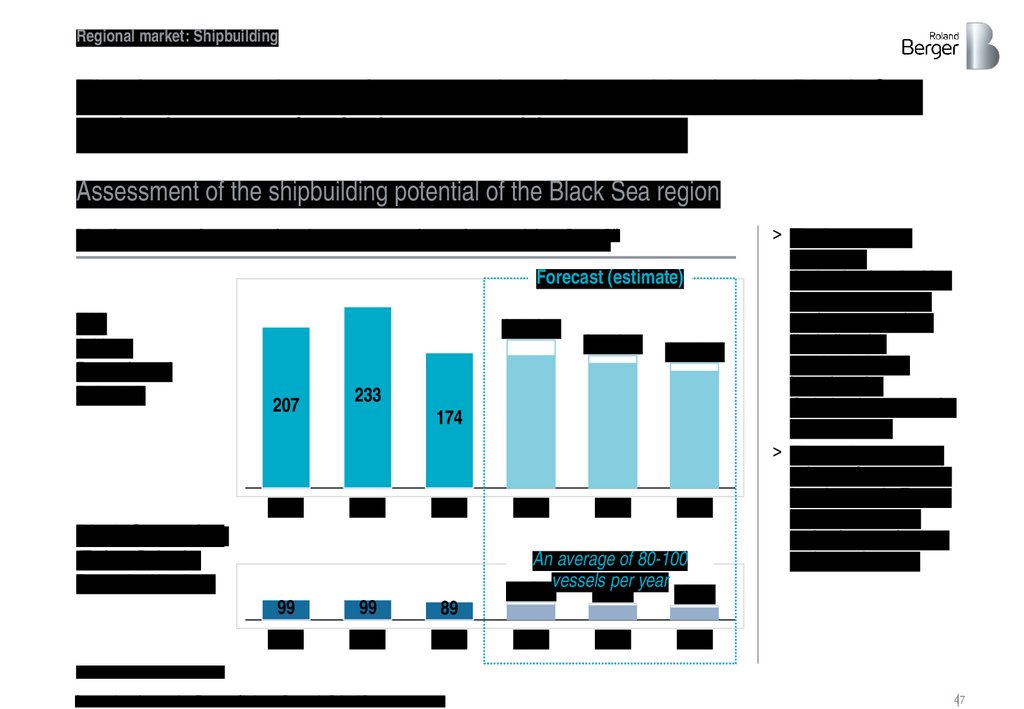
47.
Regional market: ShipbuildingThe forecast volume of construction of new ships in the Black Sea
region in terms of units is 80-100 ships per year
Assessment of the shipbuilding potential of the Black Sea region
Medium-term forecast for the construction of new ships [pcs]1)
Forecast (estimate)
EU
(without
Romania and
Bulgaria)
170-190
207
2018
160-170
150-160
2022
2023
233
174
2019
2020
2021
Black Sea region
(Turkey, Bulgaria,
Romania, Ukraine)
99
99
89
2018
2019
2020
An average of 80-100
per year
90-100vessels
80-90
70-80
2021
2022
> The forecast was
formed on
the basis of and taking
into account current
market expectations
(including the
pandemic factor)
based on the
Orderbook structure for
January 2021.
> The total construction
volume of new vessels
in unit terms in Europe
and the Black Sea
region is ~280 in 2021
and ~230 in 2023.
2023
1) Including all types of vessels
Source: data of companies, Eurostat, Clarksons Research, Roland Berger assessment
47
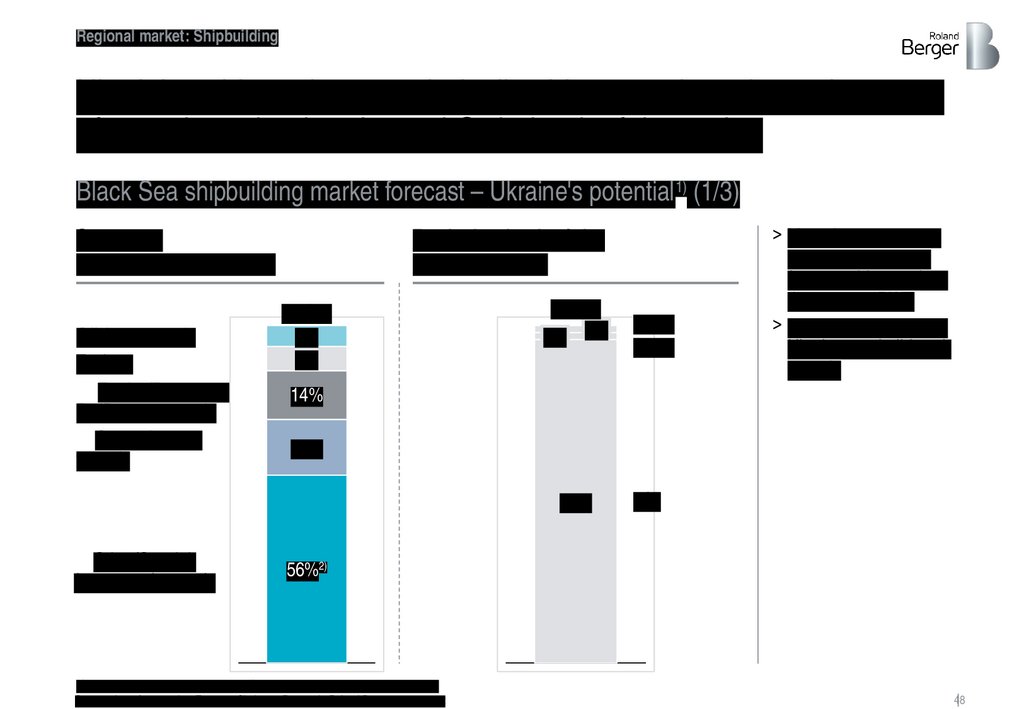
48.
Regional market: ShipbuildingUkrainian shipyards are technically able to produce the entire range
of vessels under the planned Orderbook of the region
Black Sea shipbuilding market forecast – Ukraine's potential 1) (1/3)
Structure
by type of ships [pcs.]
Offshore vessels
Tankers
Ferries/Passenger
Ro/Ro type vessels
General cargo
vessels
Ranks by deadweight
[pcs, ths. DWT]
80-100
6%
7%
80-100
2% 2%
14%
16%
96%
Other/Special
(non-cargo) vessels
20-30
10-20
> More than 90 percent
of Orderbook-based
forecast ships are less
than 10,000 DWT
> Almost all shipyards in
Ukraine can build such
vessels
<10
56%2)
1) Based on the current orderbook; 2) Most specialized vessels are tugboats
Source: data of companies, Eurostat, Clarksons Research, Roland Berger assessment
48
49.
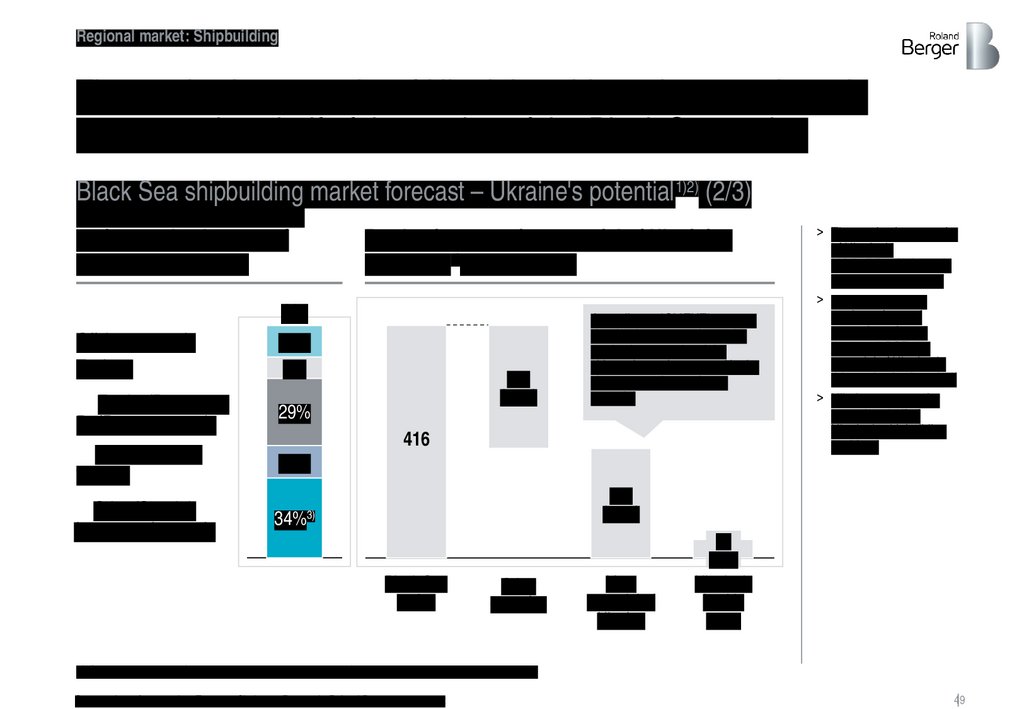
Regional market: ShipbuildingThe production capacity of Ukrainian shipyards approximately
corresponds to half of the market of the Black Sea region
Black Sea shipbuilding market forecast – Ukraine's potential 1)2) (2/3)
Structure of the Black Sea
region market by type of
vessel [thous. CGT]
Offshore vessels
Tankers
Production capacity potential of Ukrainian
shipyards2) [thous. CGT]
416
14%
9%
Ferries/Passenger
Ro/Ro type vessels
General cargo
vessels
29%
Other/Special
(non-cargo) vessels
34%
220
(53%)
According to *CLIENT* experts,
despite the wear and tear, the
production capacity of the
shipyards can be restored in the
short term to its maximum
potential
416
14%
> The production capacity
of Ukraine's
shipbuilding industry is
approx. 196 ths. CGT
> Based on the total
market volume of
approximately 416
thousand CGT, the
potential of Ukraine in
this market is about half
> Nibulon accounts for
more than half of
Ukraine's shipbuilding
workload
196
(47%)
3)
Black Sea
region
Other
countries
Max.
potential of
Ukraine
33
(8%)
Ukraine's
load in
2019.
1) Complete vessels; 2) According to available capacity; 3) Most specialized vessels are tugboats
Source: data of companies, Eurostat, Clarksons Research, Roland Berger assessment
49
50.
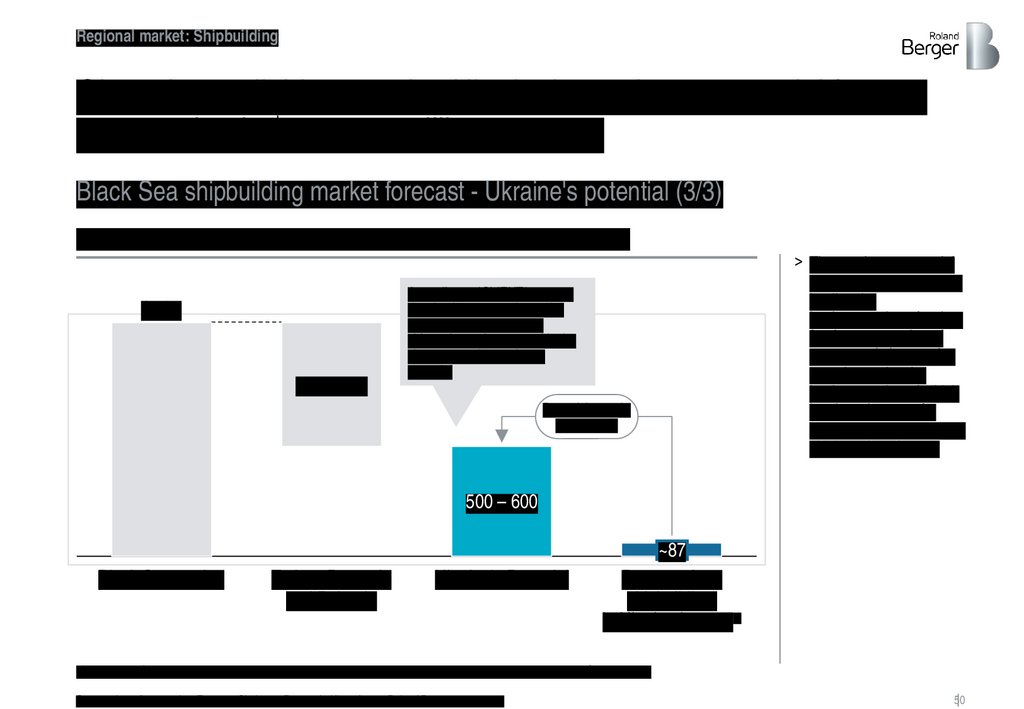
Regional market: ShipbuildingGiven the available capacity, Ukraine's maximum potential for new
construction is $500-600 million per year.
Black Sea shipbuilding market forecast - Ukraine's potential (3/3)
Assessment of Ukraine's shipbuilding potential [million dollars]
1,527
800 – 900
According to *CLIENT* experts,
despite the wear and tear, the
production capacity of the
shipyards can be restored in the
short term to its maximum
potential
Potential growth
of 5-6 times
> The maximum potential
of the market for Ukraine
implies the
implementation of orders
for the construction of
new vessels in complex
complete units, the
implementation of which
involves the use of a
large number of imported
shipboard equipment
500 – 600
Black Sea market
Turkey, Romania
and Bulgaria
Ukraine's Potential
~87
Revenue from
shipbuilding
in Ukraine in 20191)
1) based on *CLIENT* and Roland Berger estimates including military orders; civilian shipbuilding alone is ~$55.5 million.
Source: data of companies, Eurostat, Clarksons Research, Ukrsudprom, Roland Berger assessment
50
51.
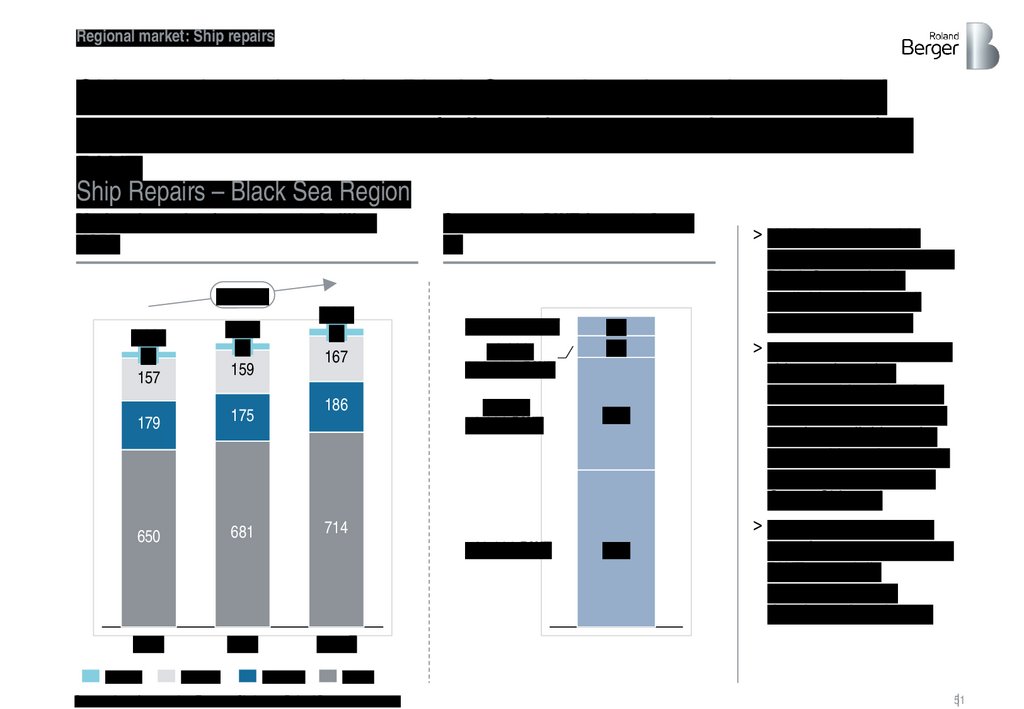
Regional market: Ship repairsShip repair market of the Black Sea region shows the growth of
approx. 5% per year, 94% of all repairs are vessels up to 100 ths.
DWT
Ship Repairs – Black Sea Region
Market dynamics for 2017-2019 [million
USD].
Structure by DWT for 2019 [pcs.,
%]
4% - 5%
1,096
29
167
1,011
25
157
1,042
27
159
179
175
650
681
714
2017
2018
2019E
Ukraine
Bulgaria
186
Romania
>100,000 DWT
50,000100,000 DWT
6%
7%
10,00050,000 DWT
36%
<10,000 DWT
51%
> Half of the entire ship
repair market (51%) of the
Black Sea region is
available to almost all
shipyards in Ukraine
> The remaining 43% of the
ship repair market
accounted for ships from
10 to 100 thousand DWT
are also available to the
largest shipyards, namely
Ilyichevsk Shipyard and
Ocean Shipyard
> 6% of repairs related to
vessels over 100,000 tons
DWT potentially
unavailable due to
deteriorated equipment
Turkey
Source: data of companies, Eurostat, Clarksons, Roland Berger assessment
51
52.
Regional market: Ship repairsTwo-thirds of ship repairs in Ukraine are carried out on the facilities
of Ilyichevsk Shipyard and shipyards of *CLIENT*
Ship repair – Ukraine
Structure of the Ukrainian ship repair market in 2019 [DWT].
959,461
657,422
(69%)
192,685
(20%)
TOTAL Ilyichevsk Shipyard
45 344
27,000
SMG Dunnay Ship Service
Azov Shipyard
22 556
Ocean
14,455
Nibulon
> Because of the inaccuracy of
Clarksons Research's source,
much of the ship repair market
data was gathered from desk
research from public sources,
company data and expert
interviews
Structure of the Ukrainian ship repair market in 2019 [pcs.].
84
(34%)
244
TOTAL Ilyichevsk Shipyard
74
(30%)
35
18
SMG Dunnay Ship Service Nibulon
Source: data of companies, Clarksons Research, Roland Berger assessment
17
Azov Shipyard
> Ilyichevsk Shipyard is the only
shipyard in Ukraine to date,
which can repair largecapacity vessels up to 90
thousand tons DWT
> The shipyards of *CLIENT*, as
well as the majority of other
shipyards in Ukraine, can
service ships up to 10-15
thousand tons DWT due to
existing technical limitations.
16
Ocean
52
53.
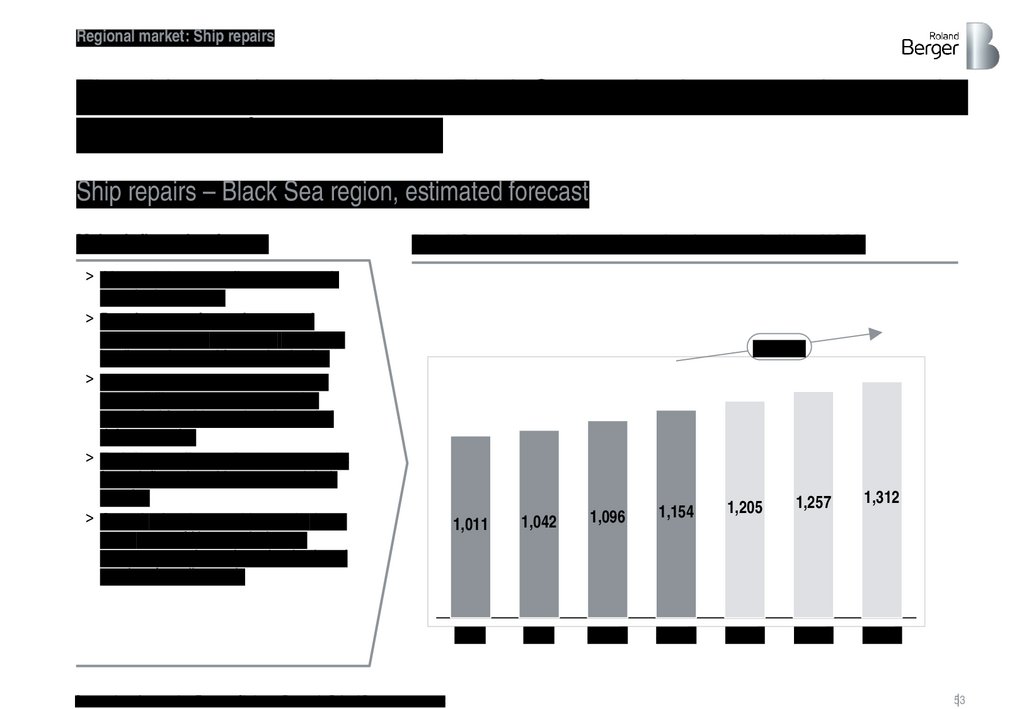
Regional market: Ship repairsThe ship repair market in the Black Sea region is expected to grow by
an average of 4-5% per year
Ship repairs – Black Sea region, estimated forecast
Major influencing factors
Black Sea region ship repair market forecast [million USD].
> Almost 8% average fleet age growth
over the last 7 years
> Requirements for environmental
friendliness and emissions reduction
leading to the need for modernization
> Fluctuating fuel prices result in the
impossibility to use more expensive
green fuel for older engines instead of
doing upgrades
> Freight cost fluctuations as a sporadic
factor influencing shipowners and their
margins
> Growth of grain transshipment in deepwater ports of Novorossiysk, as a
consequence, the projected reduction of
repairs of small vessels
Source: data of companies, Eurostat, Clarksons Research, Roland Berger assessment
4% - 5%
1,011
1,042
1,096
1,154
2017
2018
2019E
2020E
1,205
1,257
1,312
2021F
2022F
2023F
53
54.
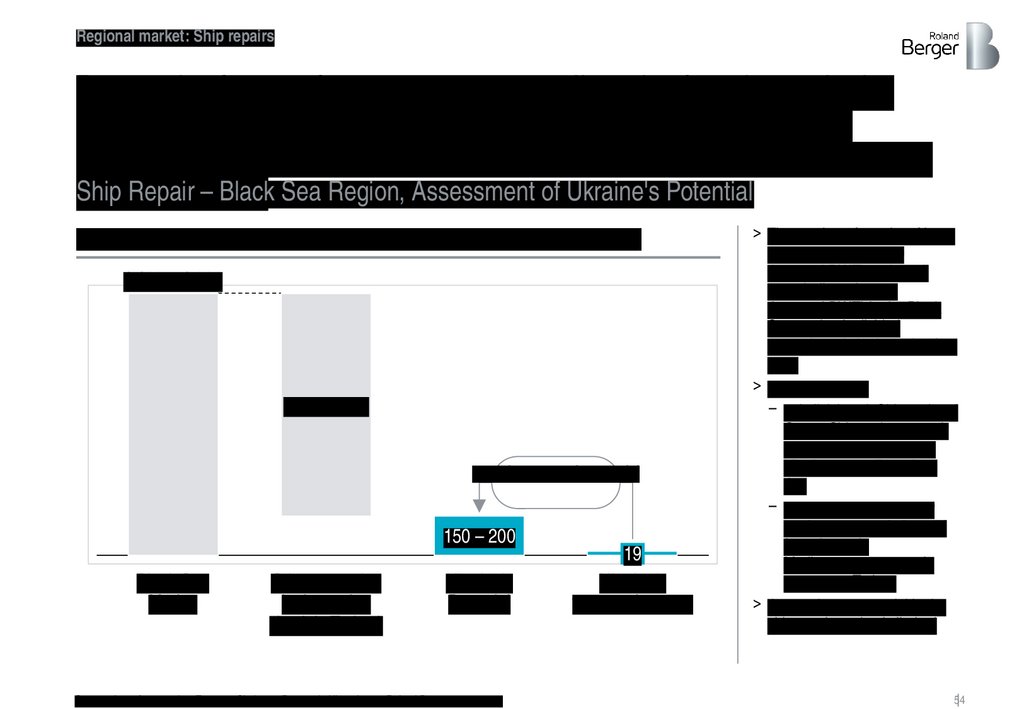
Regional market: Ship repairsDue to the factor of remoteness, as well as the fact that only the
Ilyichevsk Shipyard and Ocean can carry out repairs of large
tonnage vessels, the maximum potential for Ukraine in ship repairs
Ship
Repair
– Black Sea Region, Assessment of Ukraine's Potential
is quite
limited.
Assessment of Ukraine's potential in ship repair [million dollars].
1,100 – 1,300
800 – 1,000
8-10 times growth potential
150 – 200
Black Sea
Market
Other countries
in the region
(mainly Turkey)
Ukraine's
Potential
Source: data of companies, Eurostat, Clarksons Research, Ukrsudprom, Roland Berger assessment
19
Ukraine's
turnover in 2019.
> The number of repairs of large
vessels (more than 10
thousand DWT) and small
vessels (less than 10
thousand DWT) in the Black
Sea market is divided
approximately in the ratio of 60
to 40
> Considering that
– only Ilyichevsk Shipyard and
Ocean Shipyard can repair
large-capacity vessels in
Ukraine, as well as given
that
– the Ukrainian ship repair
yards are remotely located
from the main
Mediterranean routes, in
contrast to Turkey,
> the maximum potential in the
ship repair market is limited
54
55.
Thus the industry potential of Ukraine is about 650-800 million USD,or up to 22.6 billion UAH per year.
Market potential of shipbuilding and ship repair per year [mln USD, bln UAH] 4)
The EU and Black Sea market is more
than $12.5 billion a year
Up to 22.6
Up to 17
Up to 5.6
> The maximum potential is
estimated at 196 thousand
CGT3) under the current
maximum technical load of
existing Ukrainian shipyards
> The total maximum potential
of Ukraine was estimated as
the distribution of capacity
utilization of shipyards
between the construction of
new ships and ship repairs
> The market potential is
determined based on the
current orderbook
> The data are not scaled
2.7
>2,600
>1,500
650-800
>1,100
500 - 600
150-200
Black Sea market
Potential for
Ukraine
Shipbuilding1)
Ship repair
106
19
87
Ukrainian
industry
turnover
in 2019 2)
22.6 - amount in billion UAH
Shipbuilding
Ship repair
1) Complete shipbuilding;
2) Based on 2019 estimates. 2) Based on 2019 estimates by *CLIENT* and Roland Berger, including military orders; only civil shipbuilding is ~$55.5 mln out of $87 mln orders for new vessels
3) Market examples of top shipyards in the world show the possibility of achieving 80-100% capacity utilization, however, Ukraine will have to compete on price and quality
with other Black Sea region players; 4) Except for LNG/LPG tankers, cruise/passenger ships, yachts, fishing and military fleets, offshore platforms
Source: ISL Shipping Statistics Yearbook 2020, Roland Berger estimates,
55