


 Финансы
Похожие презентации:


Financial forecasting and its role in ensuring the financial stability of an organization
1.
Financial forecasting and itsrole in ensuring the financial
stability of an organization
(example of Guangzhou Chuangneng Ship
Fuel Supply Co., Ltd.)
Reporter Feng Langlang
Supervisor Yu.V. Krupenko
2.
CONTENT1. INTRODUCTION
2. THEORETICAL BASIS OF FINANCIAL FORECASTING
3. FINANCIAL FORECASTING ANALYSIS OF CHUANGNENG COMPANY
4. FINANCIAL POTENCIAL AND PREDICT ITS FINANCIAL POTENCIAL
5. CONCLUSIONS
3.
INTRODUCTION4.
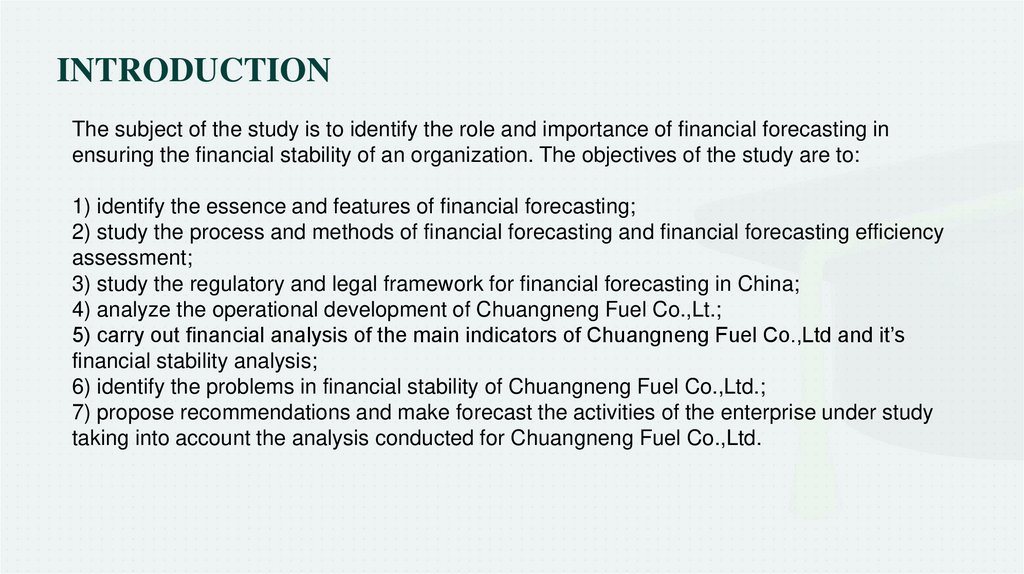
INTRODUCTIONThe subject of the study is to identify the role and importance of financial forecasting in
ensuring the financial stability of an organization. The objectives of the study are to:
1) identify the essence and features of financial forecasting;
2) study the process and methods of financial forecasting and financial forecasting efficiency
assessment;
3) study the regulatory and legal framework for financial forecasting in China;
4) analyze the operational development of Chuangneng Fuel Co.,Lt.;
5) carry out financial analysis of the main indicators of Chuangneng Fuel Co.,Ltd and it’s
financial stability analysis;
6) identify the problems in financial stability of Chuangneng Fuel Co.,Ltd.;
7) propose recommendations and make forecast the activities of the enterprise under study
taking into account the analysis conducted for Chuangneng Fuel Co.,Ltd.
5.
THEORETICAL BASISOF FINANCIAL
FORECASTING
6.
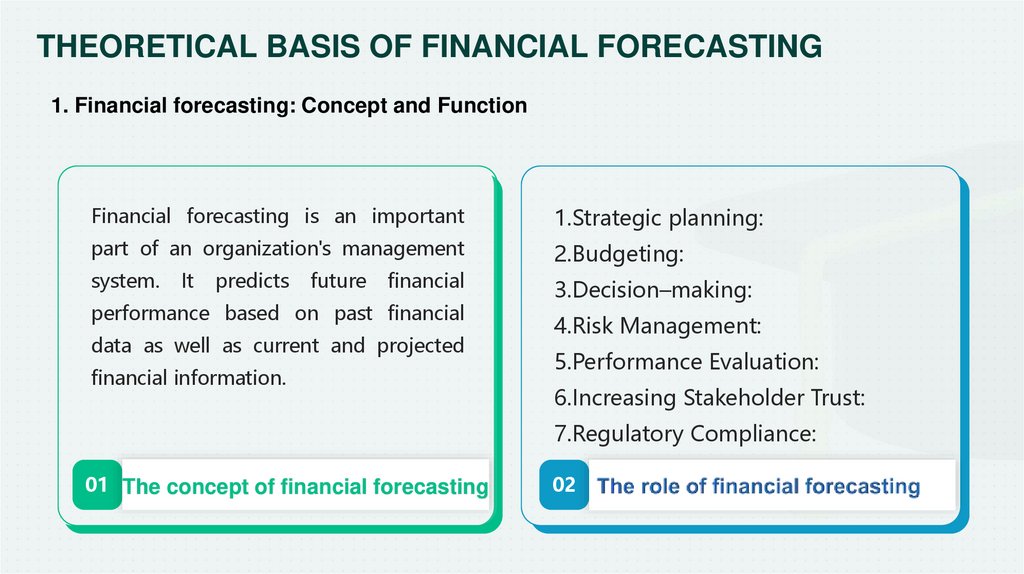
THEORETICAL BASIS OF FINANCIAL FORECASTING1. Financial forecasting: Concept and Function
Financial forecasting is an important
1.Strategic planning:
part of an organization's management
2.Budgeting:
system.
3.Decision–making:
It
predicts
future
financial
performance based on past financial
data as well as current and projected
financial information.
4.Risk Management:
5.Performance Evaluation:
6.Increasing Stakeholder Trust:
7.Regulatory Compliance:
01 The conceptCONCccEPT
of financial forecasting
02
rolerrole
7.
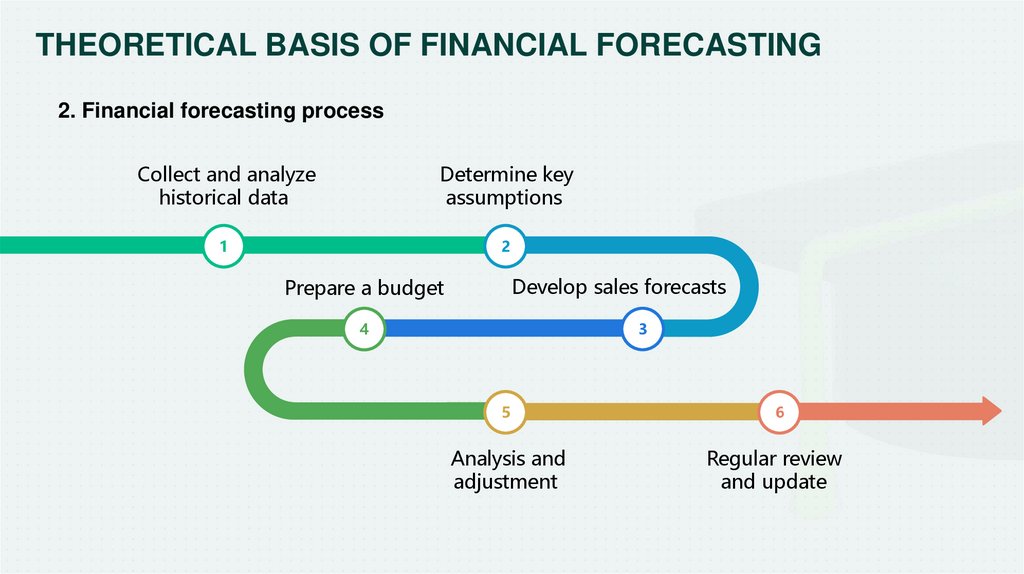
THEORETICAL BASIS OF FINANCIAL FORECASTING2. Financial forecasting process
Collect and analyze
historical data
Determine key
assumptions
1
2
Develop sales forecasts
Prepare a budget
3
4
5
6
Analysis and
adjustment
Regular review
and update
8.
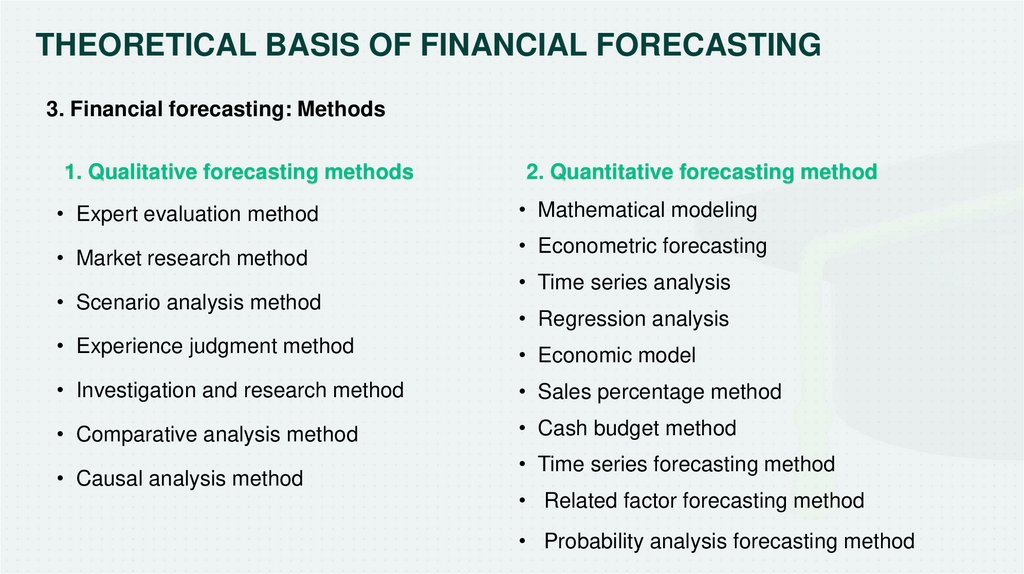
THEORETICAL BASIS OF FINANCIAL FORECASTING3. Financial forecasting: Methods
1. Qualitative forecasting methods
2. Quantitative forecasting method
• Expert evaluation method
• Mathematical modeling
• Market research method
• Scenario analysis method
• Econometric forecasting
• Time series analysis
• Regression analysis
• Experience judgment method
• Economic model
• Investigation and research method
• Sales percentage method
• Comparative analysis method
• Cash budget method
• Causal analysis method
• Time series forecasting method
• Related factor forecasting method
• Probability analysis forecasting method
9.
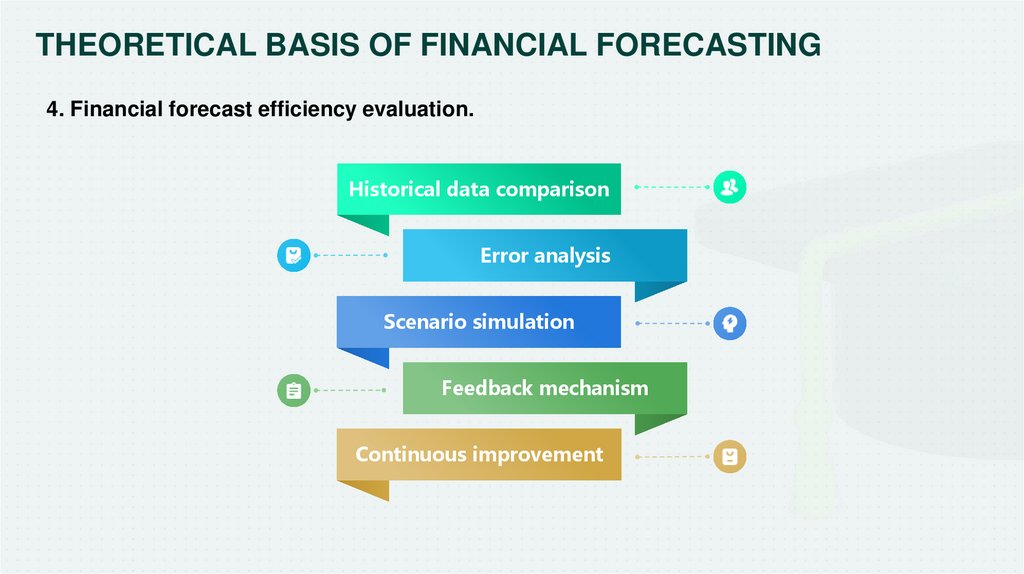
THEORETICAL BASIS OF FINANCIAL FORECASTING4. Financial forecast efficiency evaluation.
Historical data comparison
Error analysis
Scenario simulation
Feedback mechanism
Continuous improvement
10.
FINANCIAL ANALYSIS11.
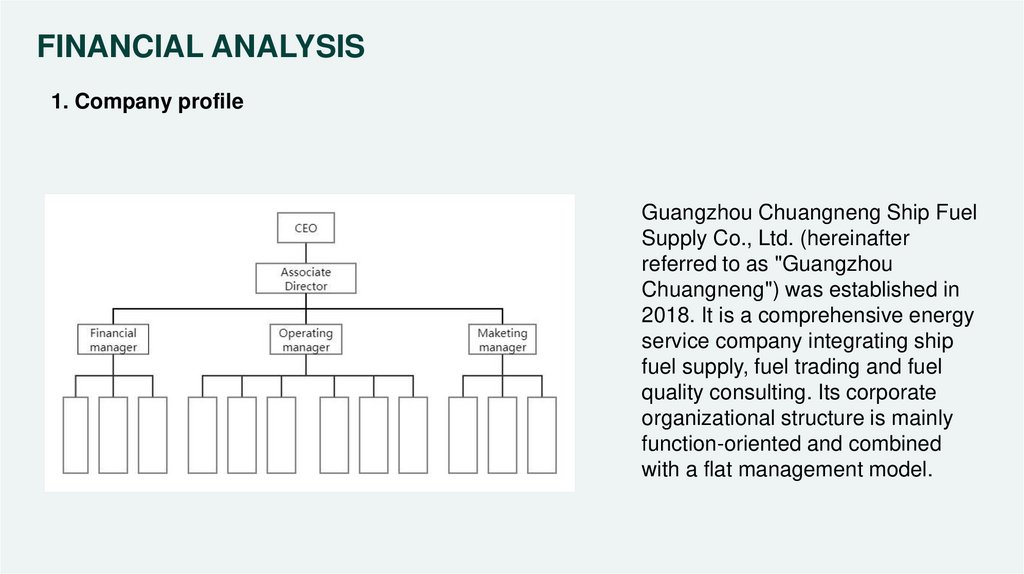
FINANCIAL ANALYSIS1. Company profile
Guangzhou Chuangneng Ship Fuel
Supply Co., Ltd. (hereinafter
referred to as "Guangzhou
Chuangneng") was established in
2018. It is a comprehensive energy
service company integrating ship
fuel supply, fuel trading and fuel
quality consulting. Its corporate
organizational structure is mainly
function-oriented and combined
with a flat management model.
12.
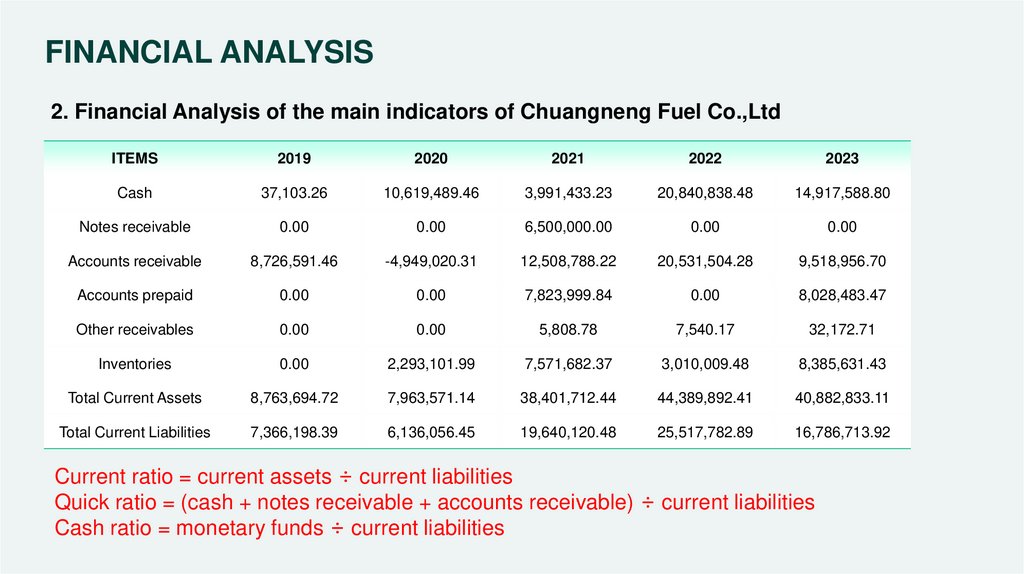
FINANCIAL ANALYSIS2. Financial Analysis of the main indicators of Chuangneng Fuel Co.,Ltd
ITEMS
2019
2020
2021
2022
2023
Cash
37,103.26
10,619,489.46
3,991,433.23
20,840,838.48
14,917,588.80
Notes receivable
0.00
0.00
6,500,000.00
0.00
0.00
Accounts receivable
8,726,591.46
-4,949,020.31
12,508,788.22
20,531,504.28
9,518,956.70
Accounts prepaid
0.00
0.00
7,823,999.84
0.00
8,028,483.47
Other receivables
0.00
0.00
5,808.78
7,540.17
32,172.71
Inventories
0.00
2,293,101.99
7,571,682.37
3,010,009.48
8,385,631.43
Total Current Assets
8,763,694.72
7,963,571.14
38,401,712.44
44,389,892.41
40,882,833.11
Total Current Liabilities
7,366,198.39
6,136,056.45
19,640,120.48
25,517,782.89
16,786,713.92
Current ratio = current assets ÷ current liabilities
Quick ratio = (cash + notes receivable + accounts receivable) ÷ current liabilities
Cash ratio = monetary funds ÷ current liabilities
13.
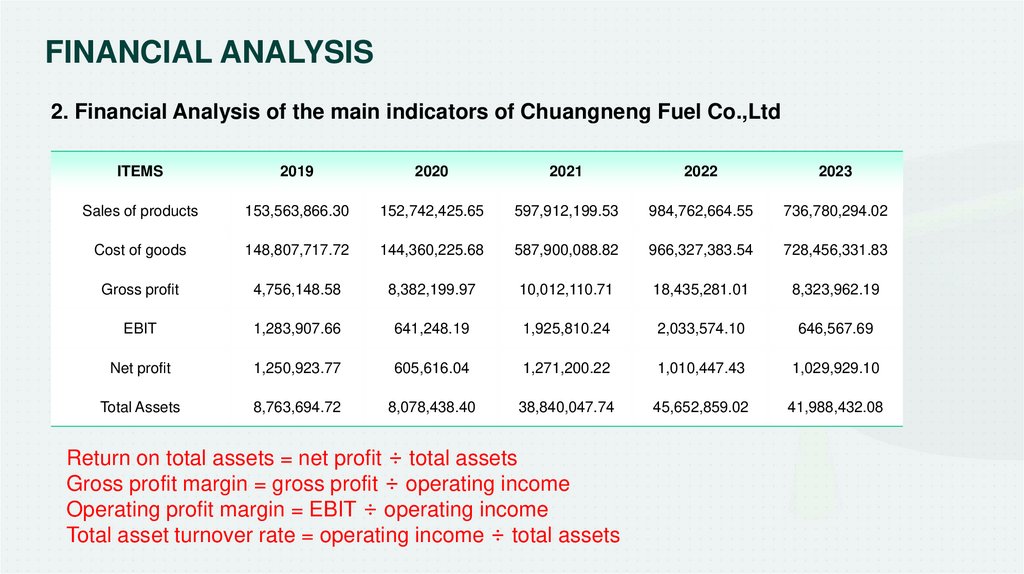
FINANCIAL ANALYSIS2. Financial Analysis of the main indicators of Chuangneng Fuel Co.,Ltd
ITEMS
2019
2020
2021
2022
2023
Sales of products
153,563,866.30
152,742,425.65
597,912,199.53
984,762,664.55
736,780,294.02
Cost of goods
148,807,717.72
144,360,225.68
587,900,088.82
966,327,383.54
728,456,331.83
Gross profit
4,756,148.58
8,382,199.97
10,012,110.71
18,435,281.01
8,323,962.19
EBIT
1,283,907.66
641,248.19
1,925,810.24
2,033,574.10
646,567.69
Net profit
1,250,923.77
605,616.04
1,271,200.22
1,010,447.43
1,029,929.10
Total Assets
8,763,694.72
8,078,438.40
38,840,047.74
45,652,859.02
41,988,432.08
Return on total assets = net profit ÷ total assets
Gross profit margin = gross profit ÷ operating income
Operating profit margin = EBIT ÷ operating income
Total asset turnover rate = operating income ÷ total assets
14.
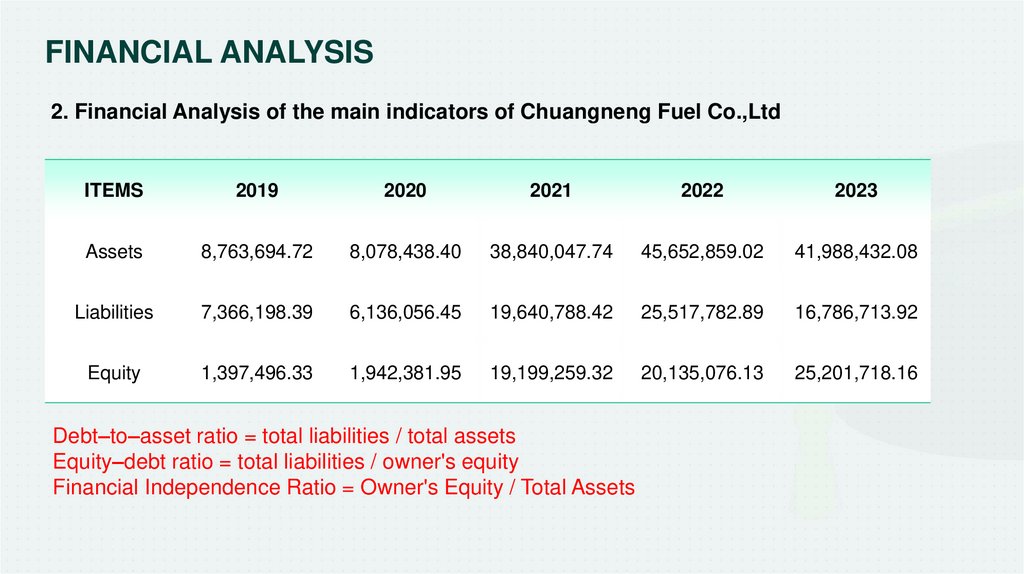
FINANCIAL ANALYSIS2. Financial Analysis of the main indicators of Chuangneng Fuel Co.,Ltd
ITEMS
2019
2020
2021
2022
2023
Assets
8,763,694.72
8,078,438.40
38,840,047.74
45,652,859.02
41,988,432.08
Liabilities
7,366,198.39
6,136,056.45
19,640,788.42
25,517,782.89
16,786,713.92
Equity
1,397,496.33
1,942,381.95
19,199,259.32
20,135,076.13
25,201,718.16
Debt–to–asset ratio = total liabilities / total assets
Equity–debt ratio = total liabilities / owner's equity
Financial Independence Ratio = Owner's Equity / Total Assets
15.
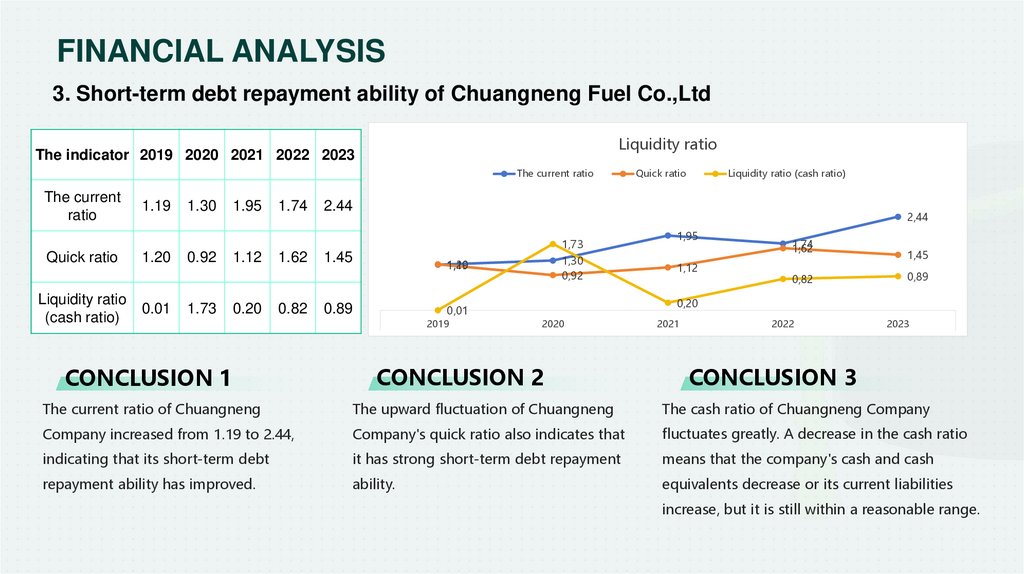
FINANCIAL ANALYSIS3. Short-term debt repayment ability of Chuangneng Fuel Co.,Ltd
Liquidity ratio
The indicator 2019 2020 2021 2022 2023
The current ratio
The current
ratio
1.19
1.30
1.95
1.74
Liquidity ratio
(cash ratio)
1.20
0.01
0.92
1.73
1.12
0.20
1.62
0.82
CONCLUSION 1
Liquidity ratio (cash ratio)
2.44
2,44
1,73
Quick ratio
Quick ratio
1.45
1,30
0,92
1,20
1,19
0.89
0,01
2019
1,95
1,12
1,74
1,62
0,82
1,45
0,89
0,20
2020
CONCLUSION 2
2021
2022
2023
CONCLUSION 3
The current ratio of Chuangneng
The upward fluctuation of Chuangneng
The cash ratio of Chuangneng Company
Company increased from 1.19 to 2.44,
Company's quick ratio also indicates that
fluctuates greatly. A decrease in the cash ratio
indicating that its short-term debt
it has strong short-term debt repayment
means that the company's cash and cash
repayment ability has improved.
ability.
equivalents decrease or its current liabilities
increase, but it is still within a reasonable range.
16.
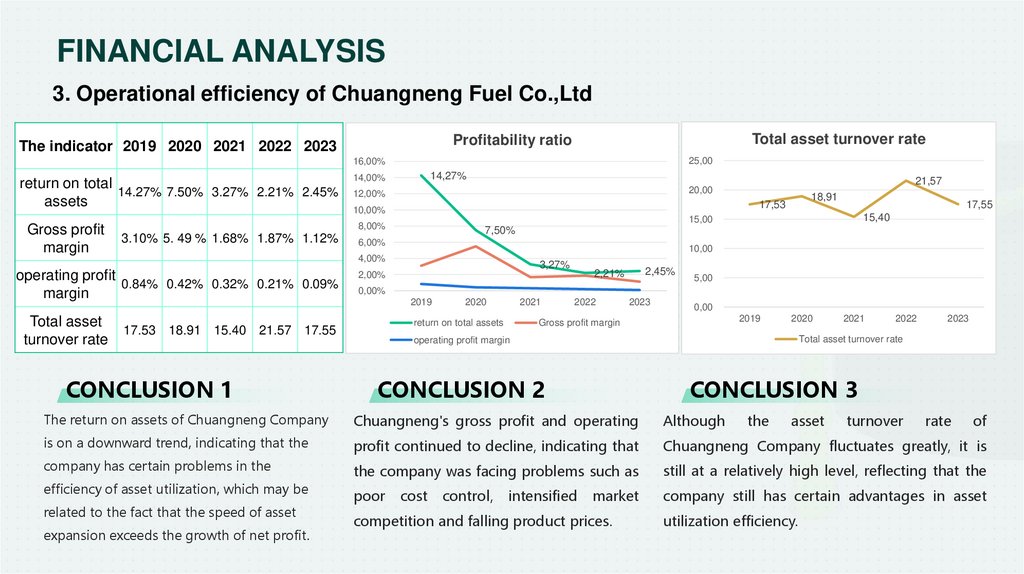
FINANCIAL ANALYSIS3. Operational efficiency of Chuangneng Fuel Co.,Ltd
Total asset turnover rate
Profitability ratio
The indicator 2019 2020 2021 2022 2023
25,00
16,00%
return on total
14.27% 7.50% 3.27% 2.21% 2.45%
assets
Gross profit
margin
18.91 15.40
21.57
17,55
15,40
15,00
7,50%
6,00%
10,00
3,27%
2,45%
2,21%
2,00%
5,00
0,00%
2019
2020
2021
return on total assets
17.55
CONCLUSION 1
18,91
17,53
10,00%
4,00%
17.53
21,57
20,00
12,00%
8,00%
3.10% 5. 49 % 1.68% 1.87% 1.12%
operating profit
0.84% 0.42% 0.32% 0.21% 0.09%
margin
Total asset
turnover rate
14,27%
14,00%
2022
2023
0,00
2019
Gross profit margin
2020
2021
2022
2023
Total asset turnover rate
operating profit margin
CONCLUSION 2
CONCLUSION 3
The return on assets of Chuangneng Company
Chuangneng's gross profit and operating
Although
is on a downward trend, indicating that the
profit continued to decline, indicating that
Chuangneng Company fluctuates greatly, it is
company has certain problems in the
the company was facing problems such as
still at a relatively high level, reflecting that the
efficiency of asset utilization, which may be
poor
company still has certain advantages in asset
related to the fact that the speed of asset
expansion exceeds the growth of net profit.
cost
control,
intensified
market
competition and falling product prices.
the
asset
utilization efficiency.
turnover
rate
of
17.
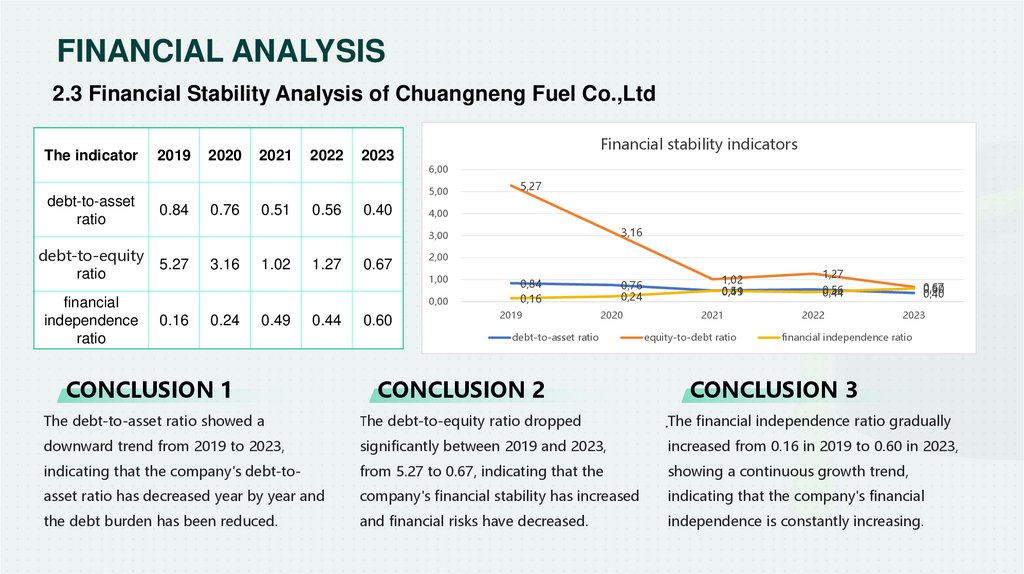
FINANCIAL ANALYSIS2.3 Financial Stability Analysis of Chuangneng Fuel Co.,Ltd
The indicator
debt-to-asset
ratio
2019
2020
2021
2022
2023
Financial stability indicators
6,00
5,00
0.84
0.76
0.51
0.56
0.40
5,27
4,00
3,16
3,00
debt-to-equity
ratio
financial
independence
ratio
5.27
3.16
1.02
1.27
0.67
2,00
1,00
0,00
0.16
0.24
0.49
0.44
CONCLUSION 1
0.60
0,84
0,16
2019
0,76
0,24
2020
debt-to-asset ratio
CONCLUSION 2
1,02
0,51
0,49
2021
equity-to-debt ratio
1,27
0,56
0,44
2022
0,67
0,60
0,40
2023
financial independence ratio
CONCLUSION 3
The debt-to-asset ratio showed a
The debt-to-equity ratio dropped
.The financial independence ratio gradually
downward trend from 2019 to 2023,
significantly between 2019 and 2023,
increased from 0.16 in 2019 to 0.60 in 2023,
indicating that the company's debt-to-
from 5.27 to 0.67, indicating that the
showing a continuous growth trend,
asset ratio has decreased year by year and
company's financial stability has increased
indicating that the company's financial
the debt burden has been reduced.
and financial risks have decreased.
independence is constantly increasing.
18.
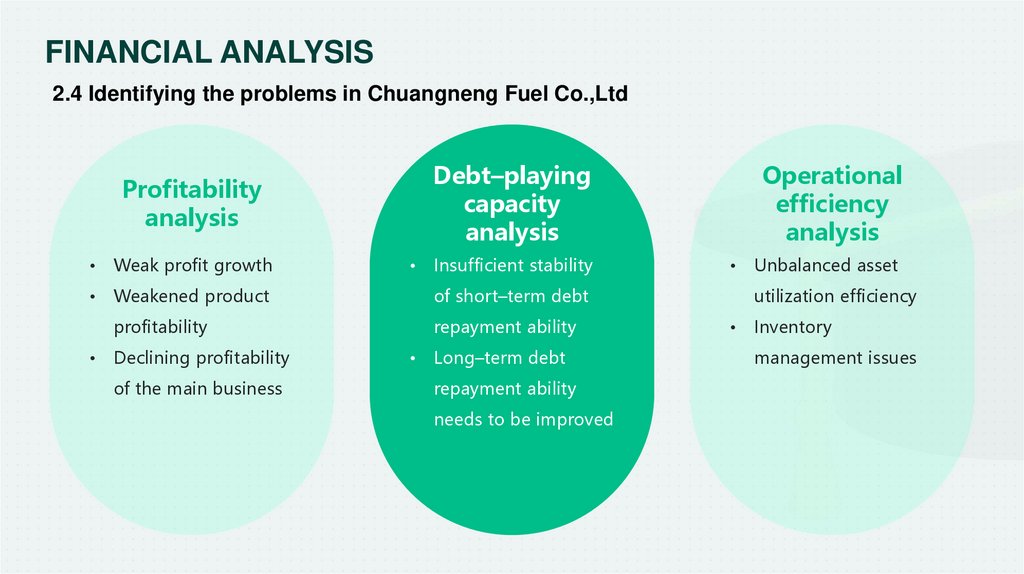
FINANCIAL ANALYSIS2.4 Identifying the problems in Chuangneng Fuel Co.,Ltd
Debt–playing
capacity
analysis
Profitability
analysis
Weak profit growth
Weakened product
of short–term debt
profitability
repayment ability
Declining profitability
of the main business
Insufficient stability
Long–term debt
repayment ability
needs to be improved
Operational
efficiency
analysis
Unbalanced asset
utilization efficiency
Inventory
management issues
19.
FINANCIAL POTENCIALAND PREDICT ITS FINANCIAL
POTENCIAS
20.
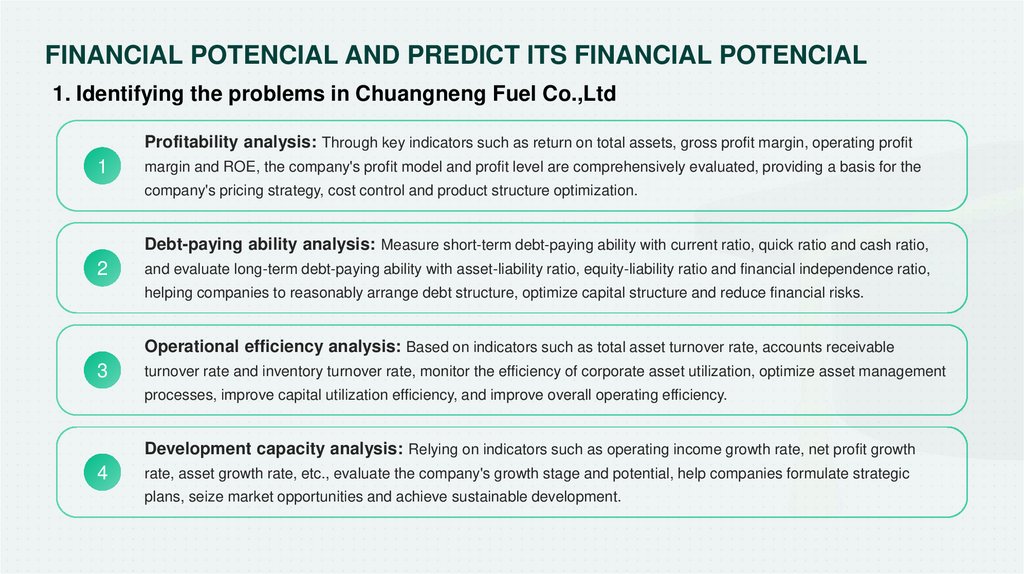
FINANCIAL POTENCIAL AND PREDICT ITS FINANCIAL POTENCIAL1. Identifying the problems in Chuangneng Fuel Co.,Ltd
Profitability analysis: Through key indicators such as return on total assets, gross profit margin, operating profit
1
margin and ROE, the company's profit model and profit level are comprehensively evaluated, providing a basis for the
company's pricing strategy, cost control and product structure optimization.
Debt-paying ability analysis: Measure short-term debt-paying ability with current ratio, quick ratio and cash ratio,
2
and evaluate long-term debt-paying ability with asset-liability ratio, equity-liability ratio and financial independence ratio,
helping companies to reasonably arrange debt structure, optimize capital structure and reduce financial risks.
Operational efficiency analysis: Based on indicators such as total asset turnover rate, accounts receivable
3
turnover rate and inventory turnover rate, monitor the efficiency of corporate asset utilization, optimize asset management
processes, improve capital utilization efficiency, and improve overall operating efficiency.
Development capacity analysis: Relying on indicators such as operating income growth rate, net profit growth
4
rate, asset growth rate, etc., evaluate the company's growth stage and potential, help companies formulate strategic
plans, seize market opportunities and achieve sustainable development.
21.
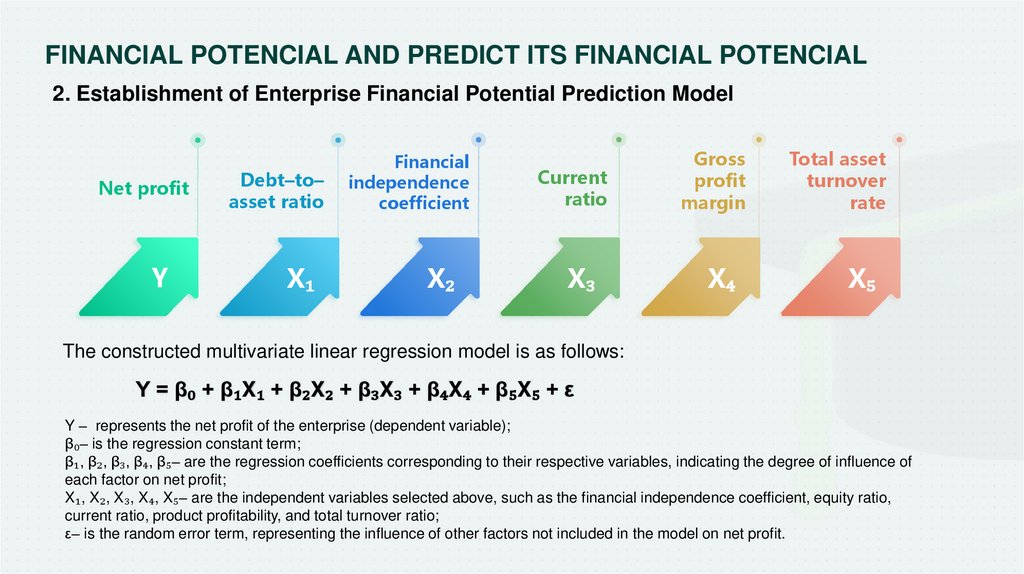
FINANCIAL POTENCIAL AND PREDICT ITS FINANCIAL POTENCIAL2. Establishment of Enterprise Financial Potential Prediction Model
Net profit
Y
Debt–to–
asset ratio
X₁
Financial
independence
coefficient
X₂
Current
ratio
Gross
profit
margin
Total asset
turnover
rate
X₃
X₄
X₅
The constructed multivariate linear regression model is as follows:
Y = β₀ + β₁X₁ + β₂X₂ + β₃X₃ + β₄X₄ + β₅X₅ + ε
Y – represents the net profit of the enterprise (dependent variable);
β₀– is the regression constant term;
β₁, β₂, β₃, β₄, β₅– are the regression coefficients corresponding to their respective variables, indicating the degree of influence of
each factor on net profit;
X₁, X₂, X₃, X₄, X₅– are the independent variables selected above, such as the financial independence coefficient, equity ratio,
current ratio, product profitability, and total turnover ratio;
ε– is the random error term, representing the influence of other factors not included in the model on net profit.
22.
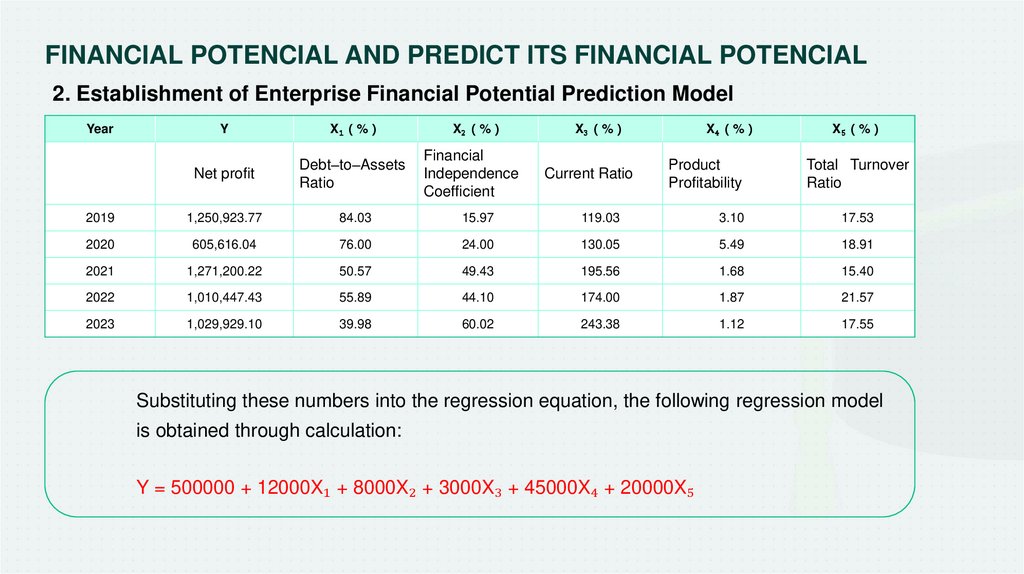
FINANCIAL POTENCIAL AND PREDICT ITS FINANCIAL POTENCIAL2. Establishment of Enterprise Financial Potential Prediction Model
Y
X₁ %
X₂ %
Net profit
Debt–to–Assets
Ratio
Financial
Independence
Coefficient
2019
1,250,923.77
84.03
15.97
119.03
3.10
17.53
2020
605,616.04
76.00
24.00
130.05
5.49
18.91
2021
1,271,200.22
50.57
49.43
195.56
1.68
15.40
2022
1,010,447.43
55.89
44.10
174.00
1.87
21.57
2023
1,029,929.10
39.98
60.02
243.38
1.12
17.55
Year
X₃ %
Current Ratio
X₄ %
Product
Profitability
X₅ %
Total Turnover
Ratio
Substituting these numbers into the regression equation, the following regression model
is obtained through calculation:
Y = 500000 + 12000X₁ + 8000X₂ + 3000X₃ + 45000X₄ + 20000X₅
23.
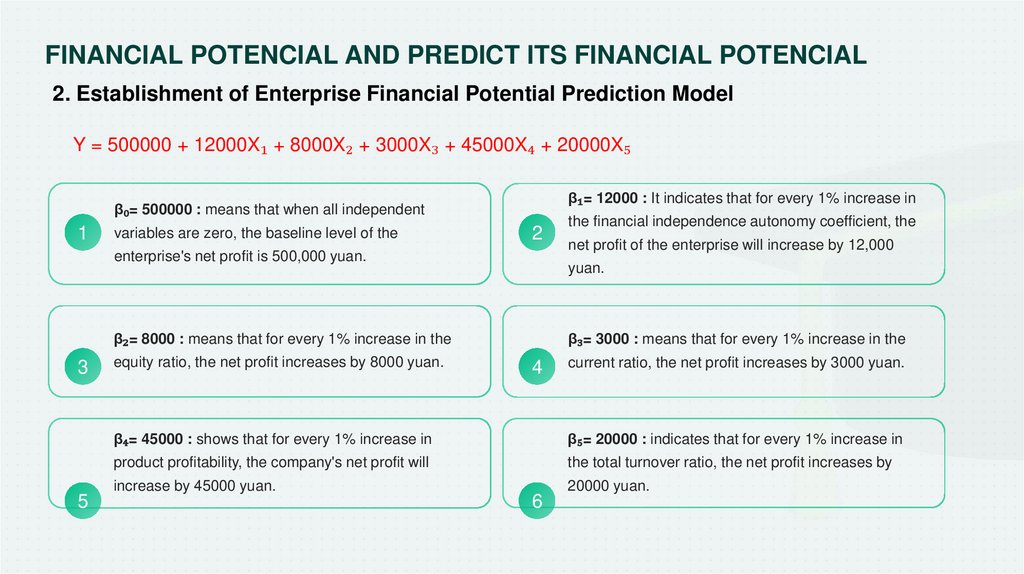
FINANCIAL POTENCIAL AND PREDICT ITS FINANCIAL POTENCIAL2. Establishment of Enterprise Financial Potential Prediction Model
Y = 500000 + 12000X₁ + 8000X₂ + 3000X₃ + 45000X₄ + 20000X₅
β₁= 12000 : It indicates that for every 1% increase in
β₀= 500000 : means that when all independent
1
variables are zero, the baseline level of the
2
enterprise's net profit is 500,000 yuan.
5
equity ratio, the net profit increases by 8000 yuan.
net profit of the enterprise will increase by 12,000
yuan.
β₂= 8000 : means that for every 1% increase in the
3
the financial independence autonomy coefficient, the
β₃= 3000 : means that for every 1% increase in the
4
current ratio, the net profit increases by 3000 yuan.
β₄= 45000 : shows that for every 1% increase in
β₅= 20000 : indicates that for every 1% increase in
product profitability, the company's net profit will
the total turnover ratio, the net profit increases by
increase by 45000 yuan.
20000 yuan.
6
24.
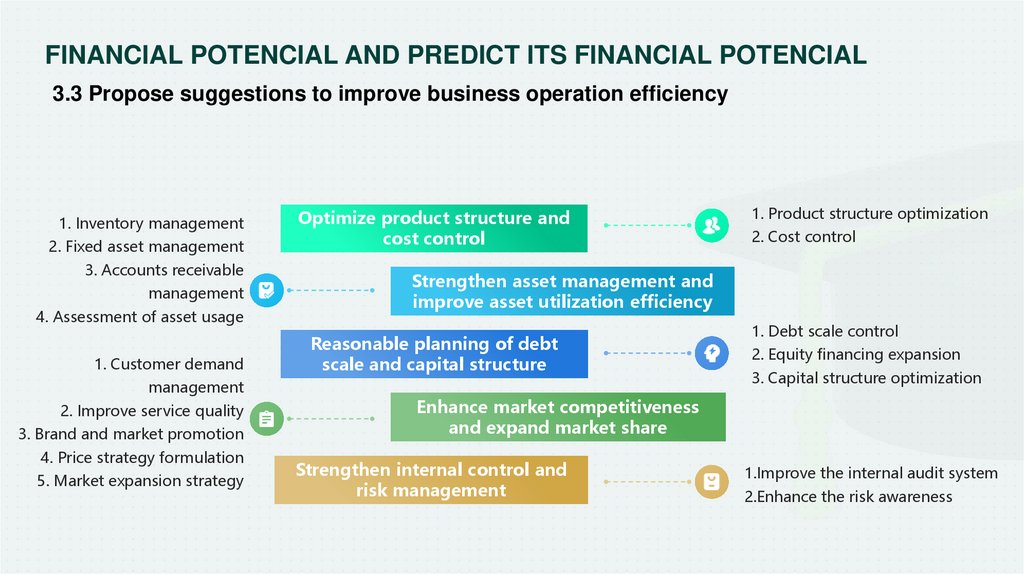
FINANCIAL POTENCIAL AND PREDICT ITS FINANCIAL POTENCIAL3.3 Propose suggestions to improve business operation efficiency
1. Inventory management
2. Fixed asset management
3. Accounts receivable
management
4. Assessment of asset usage
1. Customer demand
management
2. Improve service quality
3. Brand and market promotion
4. Price strategy formulation
5. Market expansion strategy
Optimize product structure and
cost control
1. Product structure optimization
2. Cost control
Strengthen asset management and
improve asset utilization efficiency
Reasonable planning of debt
scale and capital structure
1. Debt scale control
2. Equity financing expansion
3. Capital structure optimization
Enhance market competitiveness
and expand market share
Strengthen internal control and
risk management
1.Improve the internal audit system
2.Enhance the risk awareness
25.
CONCLUSIONS26.
CONCLUSIONSThis study takes Guangzhou Chuangneng Ship Fuel Supply Co., Ltd. as the research object. From the perspective of
combining theory and practice, it deeply explores the core role of financial forecasting in enterprise management and
provides scientific basis and practical guidance for financial decision-making.
On the theoretical level, the concept, composition and importance of financial forecasting are comprehensively analyzed,
and qualitative and quantitative forecasting methods and their applicability are explained.
On the practical level, through the calculation and analysis of a series of key financial indicators of Guangzhou
Chuangneng Company, it is found that the company has problems in short-term debt repayment ability and profitability,
and a multivariate linear regression model is constructed to predict financial potential, and optimization suggestions are
put forward based on this, hoping to help the company achieve financial stability and sustainable development.
Overall, this study provides strong support for the financial decision-making of Guangzhou Chuangneng Company,
helping managers understand the key factors affecting financial potential and achieve financial stability and sustainable
development.
27.
THANK YOU!Reporter Feng
Langlang
Supervisor Yu.V. Krupenko