


 Экономика
 Финансы
Похожие презентации:


Financial Evaluation of an IT Project
1.
5В050700-ManagementProject Management
Practice 10: Financial
Evaluation of an IT Project
Duration: 1 study hour
Course no: 13570
Prepared by: Tulekov N
Almaty
2021 г.
2.
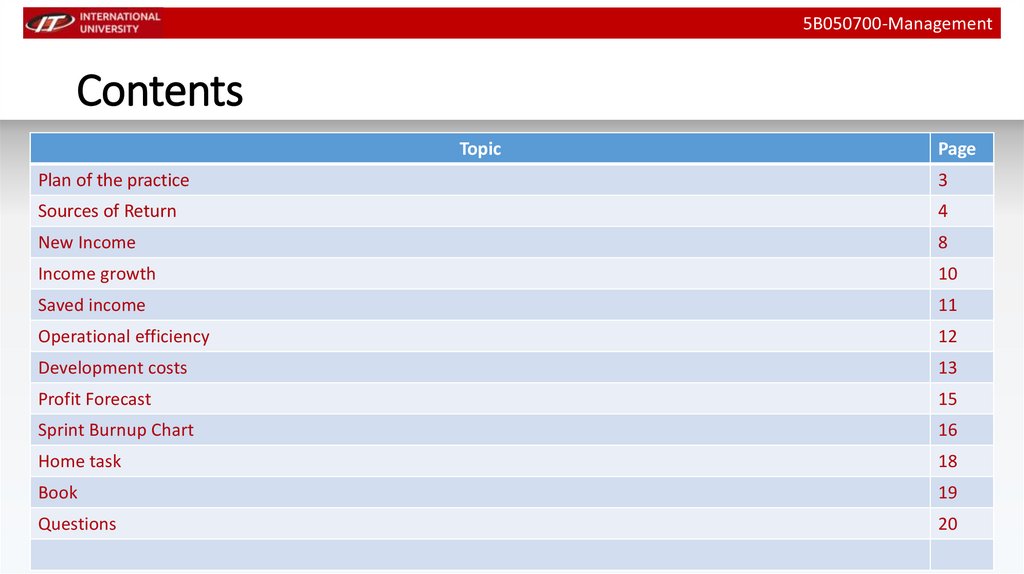
5В050700-ManagementContents
Topic
Page
Plan of the practice
3
Sources of Return
4
New Income
8
Income growth
10
Saved income
11
Operational efficiency
12
Development costs
13
Profit Forecast
15
Sprint Burnup Chart
16
Home task
18
Book
19
Questions
20
3.
5В050700-ManagementPlan of the practice
As continue of the last lection we will try today to
build a financial report of effectiveness of an IT
project.
We will observe several sources of income and
costs.
Also we will put all figures in a table for better
visualisation
Let’s go
4.
5В050700-ManagementSources of Return (1/4)
Some projects are implemented to generate income, others to reduce
costs, and others to achieve both. If you can estimate the amount of
money that each topic will bring or save, you can use it for prioritization
purposes. The responsibility for predicting the financial value of the topic
lies with the product owner, but it can be shared with team members programmers, testers, analysts, project managers, etc. In most cases, the
product owner must also rely on business knowledge and sales and
marketing team forecasts.
To determine the financial impact of the topic, I prefer to organize
meetings with the number of people that seems appropriate. The purpose
of such a topic assessment meeting is to complete the form given in the
table for each topic. Depending on the number of topics and participants,
this event may not be limited to a single meeting.
5.
5В050700-ManagementSources of Return (2/4)
Table 10.1 provides a line for each quarter of the next
two years. The time horizon is set at the option of the
command. Sometimes teams prefer to determine the
monthly return for one or two years. In my
experience, a two-year period is suitable for most
projects. This is a kind of middle ground between
divination about the distant future and a reasonable
look forward. Due to the high uncertainty associated
with software development projects, others take this
approach (Bills, 2004a).
Table 10.1 contains columns for different types of recoil, which may be for topics. If you have other return
types in your project, change the headings accordingly. Similarly, use other column headings if you want to
specify them. It is not necessary to have the same set of columns for all topics.
The meeting participants complete the worksheet by estimating the cost in the cells they consider to be
affected by the development of the topic.
6.
5В050700-ManagementSources of Return (3/4)
Where do the numbers come from? Ideally - from a marketing study, which was used in the economic
justification of the feasibility of the project. At a minimum, the person requesting this topic should quantify
the basis for its development. Income from the project can come from various sources. For convenience, we
will designate them as new income, income growth, retained income and operational efficiency.
There can be no doubt that the most common source of income in the project is the generation of new
income. Few companies are content with the existing market share, in most they try to attract new
customers. Even if the product is not sold directly, adding new features can generate new revenue. It is often
useful to distinguish revenue from new customers from additional, incremental income from existing
customers. Income gains can be the result of a new system or product:.
· Provides incentives for existing customers to
purchase additional licenses.
· Contains features that allow you to set a higher
price.
· Contains optional expansion modules that can be
sold separately.
· Provides incentives for the use of consulting
services (for example, integration with a third-party
application).
7.
5В050700-ManagementSources of Return (4/4)
Apart from the new income and income growth is the retained
income. Saved income refers to income that an organization may
lose if it does not implement a project or topic.
No organization can boast of the greatest possible effectiveness.
There is always a task that can be simplified or eliminated. If you
are developing software for use by internal customers, you are
likely well aware of the importance of operational efficiency. At the
same time, even when you are working on a commercial program
that will be sold outside your company, some tasks within the
project can increase operational efficiency. [1. page 77]
8.
5В050700-ManagementNew Income(1/2)
We don't have reliable data. Sales Representative Terry says that based on current sales
forecasts, he will be able to attract 50 new customers per quarter this year, and 100
customers per quarter next year. These values are included in the New Clients column of
Table 10.3. Although the function will appear only in the middle of the 2nd quarter, Terry is
sure that already this quarter will attract 50 new customers.
Now we estimate the revenue per client. This can be done based on existing customer data.
We know, for example, that the average customer pays us $400 a year. However, we believe
that the new service will be most attractive to small customers, those who pay us an
average of $200 per year. In our opinion, you can count on an additional $100 per year from
each such client. The total value of each new customer is thus $300 per year, or $75 per
quarter. Since the service will be available from the 2nd quarter, revenue per customer this
quarter is proportionally reduced. These values are added to the "Revenue per Customer"
column in Table 10.3, which allows you to define "New Revenue."[1. page 78]
9.
5В050700-ManagementNew Income(2/2)
10.
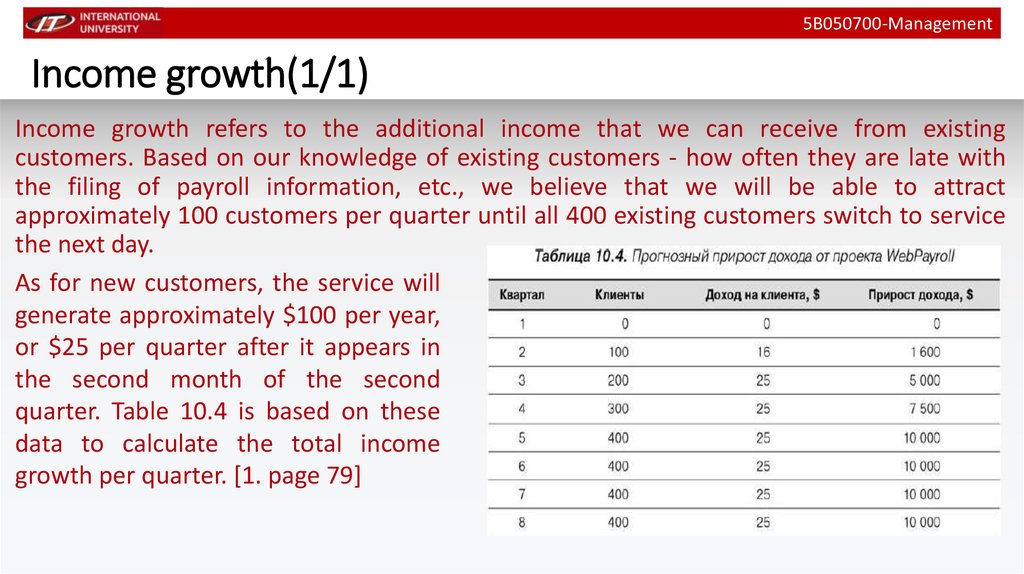
5В050700-ManagementIncome growth(1/1)
Income growth refers to the additional income that we can receive from existing
customers. Based on our knowledge of existing customers - how often they are late with
the filing of payroll information, etc., we believe that we will be able to attract
approximately 100 customers per quarter until all 400 existing customers switch to service
the next day.
As for new customers, the service will
generate approximately $100 per year,
or $25 per quarter after it appears in
the second month of the second
quarter. Table 10.4 is based on these
data to calculate the total income
growth per quarter. [1. page 79]
11.
5В050700-ManagementSaved income(1/1)
Saved income is something that we will not lose due to customer dissatisfaction with our
product, growing needs or other reasons for refusing to WebPayroll. The company currently
does not have a good indicator to track this factor. We only know that it is beginning to turn
into a problem and will become much more
serious over the next few years. According to our
estimates, the transition to the next day service
will prevent the departure of 20 customers per
quarter in the first year and 40 customers per
quarter in the second year. It is especially
important that these customers continue to use
WebPayroll, despite the lack of this functionality
until the second quarter. Knowing that each
existing customer generates $400 per year, i.e.
$100 per quarter, we can calculate the saved
revenue as shown in Table 10.5. [1. page 80]
12.
5В050700-ManagementOperational efficiency(1/1)
For the next day's maintenance project to be successful, we need to almost completely
eliminate manual interference with the system that exists today. Without automating this
operation, we will have to include two additional accountants in the middle of this year and
two more in the middle of next year.
As a result of the planned efficiency improvement in the
next day's maintenance project, we expect to reduce one of
these positions each year. Accountants cost an average of
$20 000 a year. Each of them is also provided with office
space, certain equipment, software and compensation
payments. In total, these additional hidden expenses
amount to about another 50% of the employee's salary. In
other words, the real cost of an accountant is closer to $30
000 a year. It's called full pay. The number of accountants
who have not been hired and the full salary give when
multiplying the operating efficiency for each quarter.[1.
page 81]
13.
5В050700-ManagementDevelopment costs (1/2)
In order to complete the development of the investment profile of the service WebPayroll project
the next day, we need to estimate the expected costs of developing the topic. To do this, look at the
wages of all project participants (Table 10.7).
The full salary in table 10.7 is calculated by
increasing the salary of each employee by 50%.
Since the iteration takes two weeks, the total salary
per iteration is 1/26 of the total salary. The Time in
Project column indicates the proportion of time
that each team member in the project has. All are
fully occupied except for one programmer. The
column "Adjusted iteration costs" shows the project
costs for each participant, taking into account the
full salary and the time of participation in the
project. In general, the team's iteration costs are
$13 550. Round this value to $13 500. [1. page 81]
14.
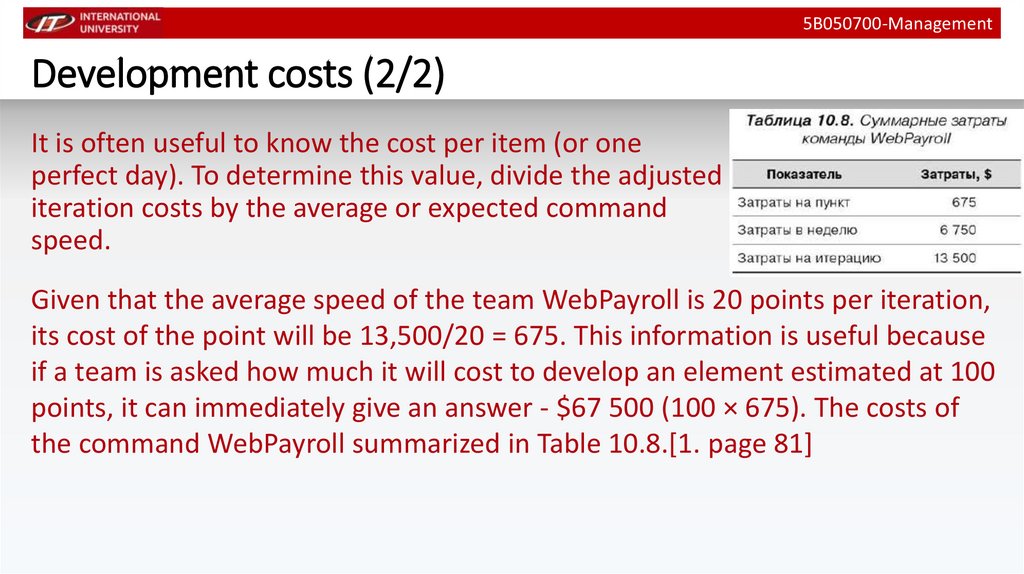
5В050700-ManagementDevelopment costs (2/2)
It is often useful to know the cost per item (or one
perfect day). To determine this value, divide the adjusted
iteration costs by the average or expected command
speed.
Given that the average speed of the team WebPayroll is 20 points per iteration,
its cost of the point will be 13,500/20 = 675. This information is useful because
if a team is asked how much it will cost to develop an element estimated at 100
points, it can immediately give an answer - $67 500 (100 × 675). The costs of
the command WebPayroll summarized in Table 10.8.[1. page 81]
15.
5В050700-ManagementProfit Forecast (1/1)
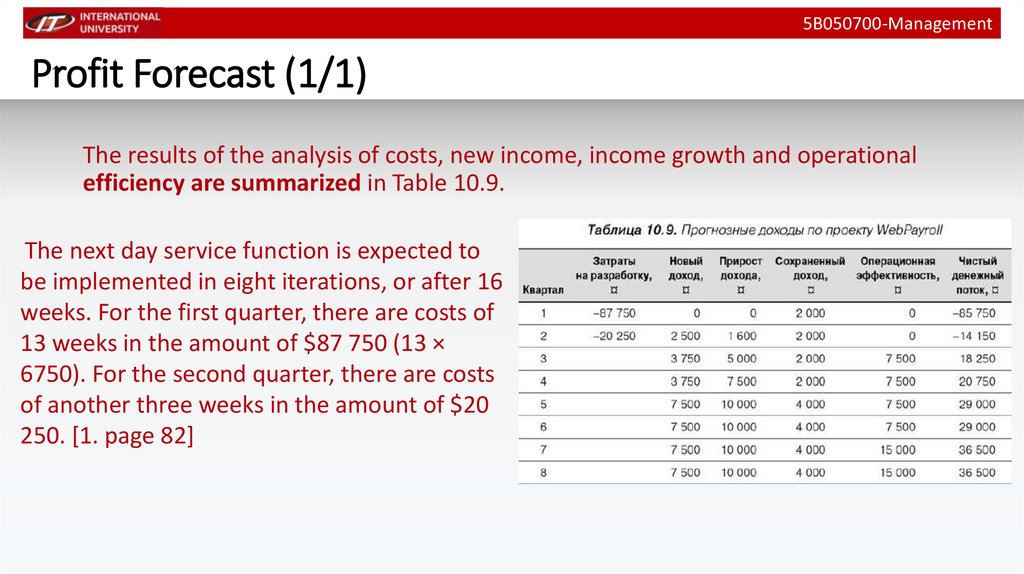
The results of the analysis of costs, new income, income growth and operational
efficiency are summarized in Table 10.9.
The next day service function is expected to
be implemented in eight iterations, or after 16
weeks. For the first quarter, there are costs of
13 weeks in the amount of $87 750 (13 ×
6750). For the second quarter, there are costs
of another three weeks in the amount of $20
250. [1. page 82]
16.
B044-ManagementSprint Burnup Chart (1/2)
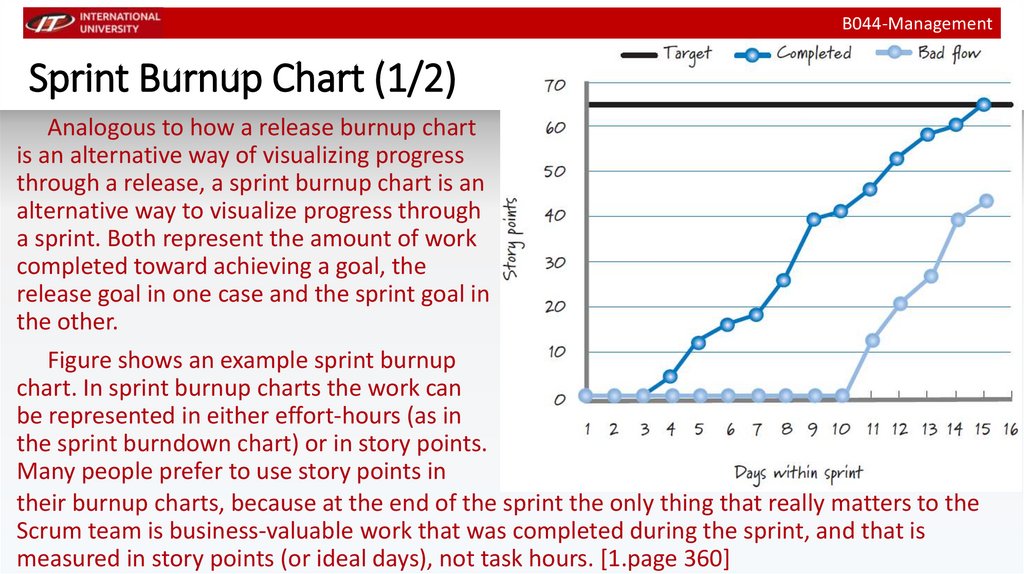
Analogous to how a release burnup chart
is an alternative way of visualizing progress
through a release, a sprint burnup chart is an
alternative way to visualize progress through
a sprint. Both represent the amount of work
completed toward achieving a goal, the
release goal in one case and the sprint goal in
the other.
Figure shows an example sprint burnup
chart. In sprint burnup charts the work can
be represented in either effort-hours (as in
the sprint burndown chart) or in story points.
Many people prefer to use story points in
their burnup charts, because at the end of the sprint the only thing that really matters to the
Scrum team is business-valuable work that was completed during the sprint, and that is
measured in story points (or ideal days), not task hours. [1.page 360]
17.
B044-ManagementSprint Burnup Chart (2/2)
Also, if we measure story points of completed
product backlog items, at a glance we can get a
good feel for how the work is flowing and how the
team is completing product backlog items through
the sprint. To illustrate this point a third line
(labeled “Bad flow”) is included on the sprint
burnup chart in Figure (normally this line would
not be on the chart; it is added in this example for
comparison purposes). The “Bad flow” line
illustrates what the burnup chart might look like if
the team starts too many product backlog items at
the same time, delays completion of items until
later in the sprint, fails to meet the sprint target because of the reduced velocity of doing too
much work in parallel, works on product backlog items that are large and therefore take a long
time to finish, or takes other actions that result in bad flow. [1.page 360]
18.
5В050700-ManagementHome task
By the next practice:
1. to prepare Project Forecast Calculation table
2. to prepare Burnup chart
on your project
19.
B044-ManagementBooks
1. Mike Kohn – Agile estimating and planning. Alpina Publisher, 2018
2. Rubin K- Essential Scrum – A Practical Guide to the Most Popular
Agile Process. Pearson Education, Inc.2012
20.
5В050700-ManagementQuestions