Похожие презентации:
Financial planning
1. MBA Sport Management
Financial Planning + Time value of moneyHubert János Kiss
2. 2. dia
Financial PlanningPlan of the day
Today we will see financial planning and the time value of money.
First we will speak in general about the process of financial planning.
Then we will go through an example in detail to see how the planning can be
done. Afterwards, we will do financial planning for a sport club (Manchester
United) based on real numbers. Thus, you can see that financial planning can
be applied really and that after the class you will be able to make such plans.
Next, we will speak about the importance of external finance needs and
sustainable rate of growth.
An important part of financial planning is to ensure that the daily operations
of the company can be financed. Working capital management and cash
budgeting deal with this issue.
Then we change topic and will study the time value of money, one of the
pillars of finance.
The material that we cover builds strongly – as always - on
• chapter 3 in Bodie – Merton - Cleeton, D. L. (2009). Financial Economics.
Pearson/Prentice Hall
• the chapter about working capital in Brealey – Myers: Principles of Corporate
Finance.
3. 3. dia
Financial PlanningFinancial Planning
The class on financial statements served to understand how a firm is working
from a financial point of view.
If you are a manager, then you should understand how your firm works, but
you should manage it as well. That means that you should set targets and see
how those targets can be achieved and the appropriate financial background
should be secured. Financial planning helps in this endeavour.
4. 4. dia
Financial PlanningThe Financial Planning Process
Financial planning is a dynamic process that follows a cycle of making plans,
implementing them, and revising them in the light of actual results.
The starting point is the strategic plan. Strategy guides the financial planning
process by establishing overall business development guidelines and growth
targets. Which businesses does the firm want to
• enter
• expand
• contract
• exit
and how quickly?
Hence, the strategic plan sets the targets that we want to achieve.
5. 5. dia
Financial PlanningThe Financial Planning Process
A key factor in setting the strategy and the financial play is the length of the
planning horizon. The longer is the financial plan, the less detailed it should be
(in general).
The revision of a financial plan is generally a function of the length of the
planning horizon. Short-term plans are revised frequently, long-term plans are
revised much less frequently.
6. 6. dia
Financial PlanningThe Financial Planning Process
The financial planning horizon may be broken down into several steps:
• There is a forecasting exercise.
• Management forecasts the key external factors, including level of
economic activity, inflation, interest rates, and the competition’s output
and prices.
• Based on above, they next forecast revenues, expenses, cash flows, and
implied need for external financing.
• Setting targets.
• Specific performance targets are generated for the divisions, functions and key
individuals of the firm.
• Periodic measurements of performance are made, and compared to the plan in
order to correct either the plan or performance.
• Periodically, key personnel are counseled, rewarded or punished, and a new
iteration is instigated.
7. 7. dia
Financial PlanningThe Financial Planning Process – Remarks
• Some variables must be forecast well in advance because exploitation
requires a long lead-time, others may be reacted to immediately. If you are
the manager of a pharmaceutical company and think about developing a
medicine, then since it takes time to develop it you have to forecast well in
advance the potential demand for the medicine.
• Some variables are highly volatile, and can’t be forecast effectively, so the
best we can do is to plan for the unknown (contingency planning). If your
company works in a developing country with unstable macroeconomic
conditions, then forecasting inflation may be impossible.
• Planning horizons must be appropriate.
• For a magazine stand, a two year planning horizon may be far too long.
• A pharmaceutical business (with long new-plant construction lead-times,
and long drug development/testing/approval procedures) needs a
planning horizon that may be as long a ten years.
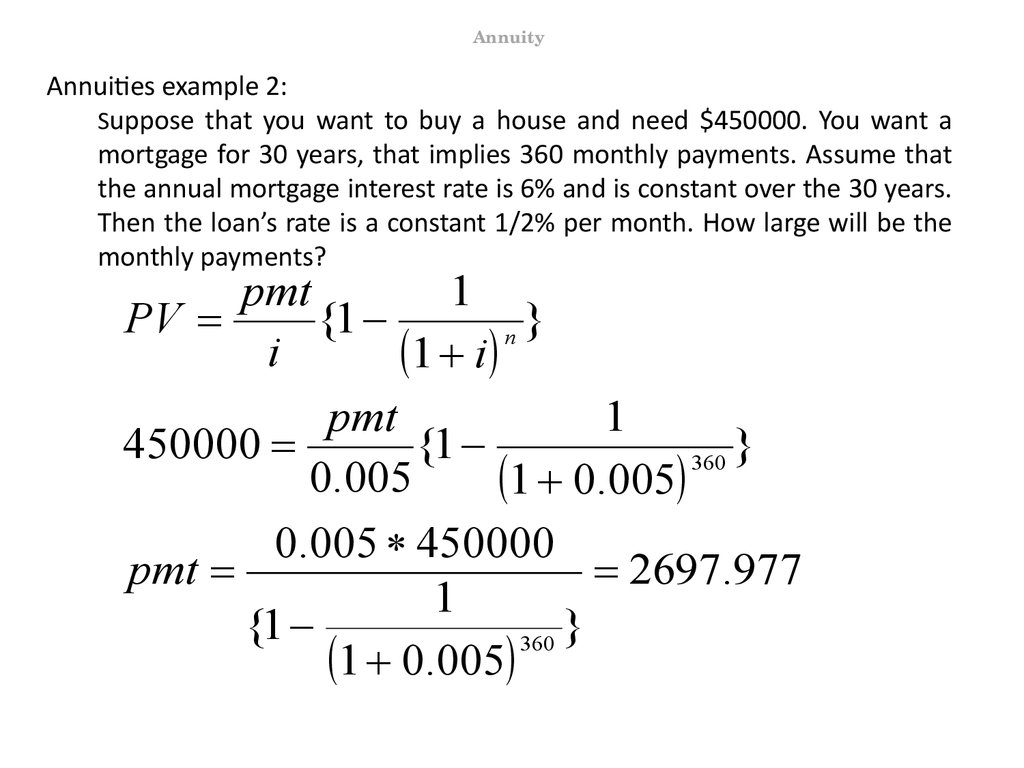
8. 8. dia
Financial PlanningThe Financial Planning Process – Remarks
• A plan should always lead to decisions that justify the cost of its preparation.
Proper planning is, in essence, part of the process of decision making. Any
part of a plan that does not lead to a decision is probably a waste of
managerial resources.
• A plan should make reasonable tradeoffs between flexibility and the cost of
flexibility.
9. 9. dia
Financial PlanningFinancial planning – an example
• Consider the following example of a fictional company called GPC.
• Let us have a look first at the income statements and the balance sheets of
the last three years!
• Assume that it is all that we know about the company. (We are the new
managers and we have been just hired.) How can we prepare the financial
plan for the next year?
• Assume also that taxes are 40% of the earnings after interest expenses are
deducted.
• Assume also that 30% of the earnings after taxes is paid out as dividend.
10. 10. dia
Financial PlanningFinancial planning – Example: Income statement
Year
(Nearest $ Million)
xxx0
xxx1
xxx2
xxx3
Income Statement
Sales
Cost of goods sold
Gross margin
Selling, general & admin. expenses
EBIT
Interest expenses
Taxes
Net income
Dividends
Change in shareholder's equity
200
110
90
30
60
30
12
18
5
13
240
132
108
36
72
45
11
16
5
11
288
158
130
43
86
64
9
13
4
9
11. 11. dia
Financial PlanningFinancial planning – Example: balance sheet
Balance Sheet
Assets:
Cash & equivalents
Receivables
Inventories
Property, Plant & equipment
Total Assets
Liabilities:
Payables
Short-term debt
Long-term debt
Total Liabilities
Shareholder's equity
10
40
50
500
600
12
48
60
600
720
14
58
72
720
864
17
69
86
864
1037
30
120
150
300
300
36
221
150
407
313
43
347
150
540
324
52
502
150
704
333
12. 12. dia
Financial PlanningFinancial planning – Steps
• How can we prepare the financial plan for the next year?
The easiest way is to see if there are some stable relationship between the
items of the income statement and the balance sheet. This is known as the
percent-of-sales method.
Important steps:
First, examine which items in the income statement have maintained a fixed
ratio to sales. This enables us to decide which items should be forecast on
projected sales, and which need to be forecast on another basis.
The second step is to forecast sales. This is a major exercise, but we will
assume that sales will continue to grow at 20% next year (as it has in the past).
The third step is to forecast those items that have been assumed to vary with sales.
The fourth and final step is to forecast the missing items that have not been assumed
to vary with sales.
13. 13. dia
Financial PlanningFinancial planning – First step
Which items in the income statement / balance sheet have maintained a fixed
ratio to sales? To do so, we need to express the items in relation to sales. That
is, we have to divide items by sales.
(Percent of Year's Sales)
Year xxx1
xxx2
xxx3
Income Statement
Sales
100.0% 100.0% 100.0%
Cost of goods sold
55.0% 55.0% 55.0%
Gross margin
45.0% 45.0% 45.0%
Selling, general & admin exp. 15.0% 15.0% 15.0%
EBIT
30.0% 30.0% 30.0%
Interest expenses
15.0% 18.8% 22.2%
Taxes
6.0%
4.5%
3.1%
Net income
9.0%
6.7%
4.7%
Dividends
2.7%
2.0%
1.4%
6.3%
4.7%
3.3%
Change in equity
14. 14. dia
Financial PlanningFinancial planning – First step
Balance Sheet
Assets:
Cash & equivalents
Receivables
Inventories
Property, Plant & equipment
Total Assets
Liabilities:
Payables
Short-term debt
Long-term debt
Total Liabilities
Shareholder's equity
6.0%
6.0%
6.0%
24.0% 24.0% 24.0%
30.0% 30.0% 30.0%
300.0% 300.0% 300.0%
360.0% 360.0% 360.0%
18.0% 18.0% 18.0%
110.7% 144.6% 174.2%
75.0% 62.5% 52.1%
203.7% 225.1% 244.3%
156.3% 134.9% 115.7%
15. 15. dia
Financial PlanningFinancial planning – First step: combining tables
GPC Financial Statements, Years xxx1 - xxx3
Year
(Nearest $ Million)
xxx0
xxx1
xxx2
xxx3
(Percent of Year's Sales)
xxx1
xxx2
xxx3
Income Statement
Sales
Cost of goods sold
Gross margin
Selling, general & admin. expenses
EBIT
Interest expenses
Taxes
Net income
Dividends
Change in shareholder's equity
200
110
90
30
60
30
12
18
5
13
240
132
108
36
72
45
11
16
5
11
288
158
130
43
86
64
9
13
4
9
100.0% 100.0% 100.0%
55.0% 55.0% 55.0%
45.0% 45.0% 45.0%
15.0% 15.0% 15.0%
30.0% 30.0% 30.0%
15.0% 18.8% 22.2%
6.0%
4.5%
3.1%
9.0%
6.7%
4.7%
2.7%
2.0%
1.4%
6.3%
4.7%
3.3%
10
40
50
500
600
12
48
60
600
720
14
58
72
720
864
17
69
86
864
1037
6.0%
6.0%
6.0%
24.0% 24.0% 24.0%
30.0% 30.0% 30.0%
300.0% 300.0% 300.0%
360.0% 360.0% 360.0%
30
120
150
300
300
36
221
150
407
313
43
347
150
540
324
52
502
150
704
333
18.0% 18.0% 18.0%
110.7% 144.6% 174.2%
75.0% 62.5% 52.1%
203.7% 225.1% 244.3%
156.3% 134.9% 115.7%
Balance Sheet
Assets:
Cash & equivalents
Receivables
Inventories
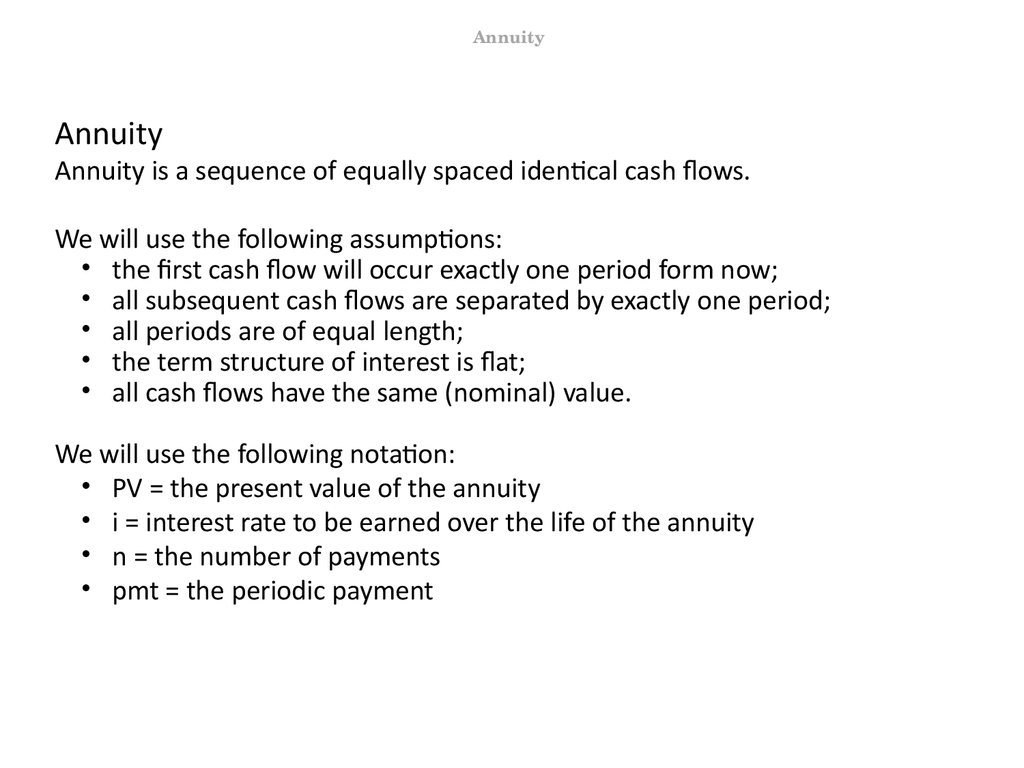
Property, Plant & equipment
Total Assets
Liabilities:
Payables
Short-term debt
Long-term debt
Total Liabilities
Shareholder's equity
16. 16. dia
Financial PlanningFinancial planning – First step
• We compare everything to sales since sales represents the outcome of the
main performance of the company.
• We see that costs of goods sold, gross margin and SGA expenses have a fixed
ratio to sales. (Obviously, in real life these ratios are not that stable.) As a
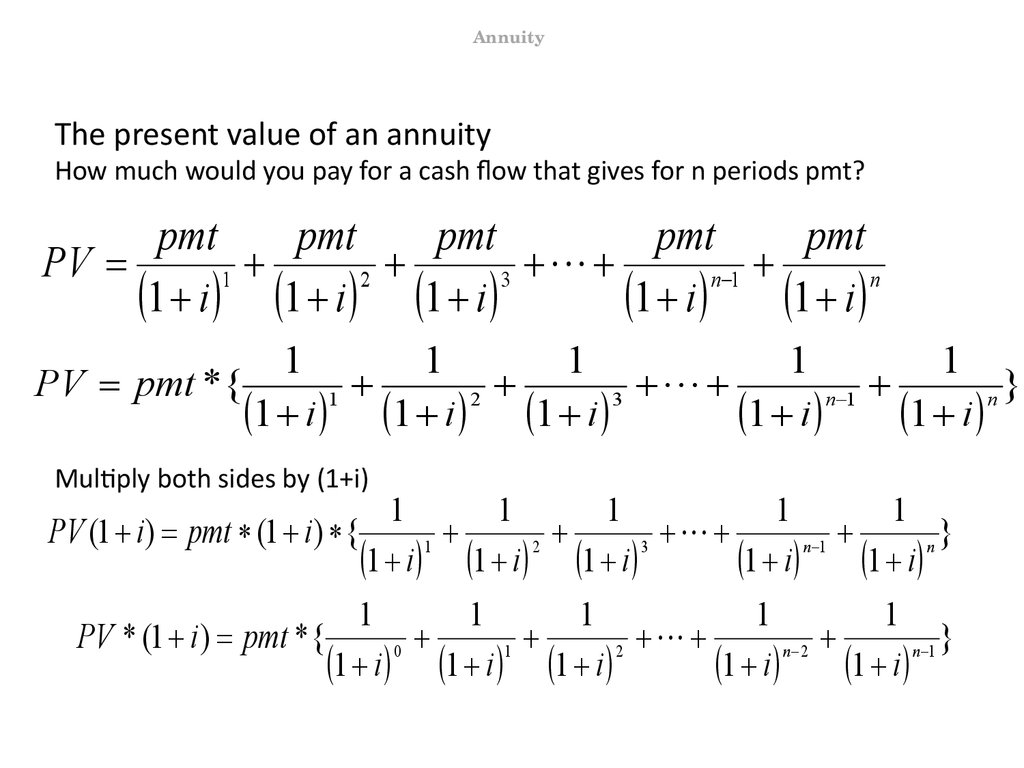
consequence, EBIT is also a stable share of sales. However, the share of
interest expenses is not stable.
• Similarly, all items of the asset side has a fixed ratio to sales. It is not the case
for liabilities as there only payables have a fixed ratio, while short-term and
long-term debt has an unstable relation to sales.
17. 17. dia
Financial PlanningFinancial planning – Second and third step
The second step is to forecast sales itself. We should use any information that
we have to make this forecast. Here we assume that as in the past two years it
will grow at 20% (240/200 and 288/240).
Once we have the forecast for sales, based on the fixed ratios we can forecast
the items with these fixed ratios.
For example, we have seen that costs of goods sold is 55% of sales. If we
expect sales to rise by 20% to 345.6 million dollars, then our projection
for costs of goods sold is 55%*345.6=190.08.
In the same vein, we have seen that total assets are 360% of sales. Thus, if
sales amount to 345.6 million dollars, then our forecast for total assets is
1244.16 million dollars.
We can do the same with all the items in the income statement and the
balance sheet that have a fixed ratio to sales.
If we do this step, then we will have the following tables.
18. 18. dia
Financial PlanningFinancial planning – Second and third step
• Note that there are still some numbers missing.
19. 19. dia
Financial PlanningFinancial planning – Second and third step
• Note that there are still some numbers missing.
20. 20. dia
Financial PlanningFinancial planning – Fourth step: completing the income statement
We need to fill in the missing numbers. To do so we use any information that
may help.
Note that we need to find out the interest rate expenses (and then we can
calculate also taxes) in the income statements. Interest is paid on debt that
appears on the liability side of the balance sheet.
Let us assume that interest rate on long-term debt is 8%, and on short-term debt is
15%. Since the outstanding short-term debt is 501.72 million dollars, and the
outstanding long-term debt is 150 million dollars, so the interest to be paid is
0.08*501.72 + 0.15*150 = 87.26. Hence, taxes 0.4*(103.68-87.26)=6.57 million dollars.
In fact, this information on interest rates is generally known.
Since the dividend pay-out ratio is given (30% of the net income), we can
compute it as well. Net income=103.86-87.26-6.57=9.85, so the dividend is
2.96.
The part of the net income that is not paid out as dividend increases the
shareholder’s equity, that is the wealth of the shareholders. In our case, it is
9.85-2.96=6.9 million dollars.
We have completed the income statement!
21. 21. dia
Financial PlanningFinancial planning – Fourth step: completed income statement
GPC Financial Statements, Years xxx1 - xxx3
(Nearest $ Million)
Year xxx0 xxx1 xxx2 xxx3 xxx4
Income Statement
Sales
Cost of goods sold
Gross margin
Selling, general & admin. expenses
EBIT
Interest expences
Taxes
Net income
Dividends
Change in shareholder's equity
200
110
90
30
60
30
12
18
5
13
240
132
108
36
72
45
11
16
5
11
288
158
130
43
86
64
9
13
4
9
346
190
156
52
104
87
7
10
3
7
22. 22. dia
Financial PlanningFinancial planning – Fourth step: completing the balance sheet
We have obtained the change in the shareholder’s equity so we can calculate
the shareholder’s equity in the balance sheet by adding this change to the last
years shareholder’s equity. That is, 333.24+6.9=340.14.
There are two missing numbers in the balance sheet: short-term and longterm debt.
We know that total asset = total liability + equity, so total liability= total asset –
equity, that is total liability= 1244.16 -340.14=904.02. From the liability items
we have forecasted already payables to be 62.21. Then, short-term debt +
long-term debt = total liabilites – payables = 904.02-62.21=841.41.
To see how much of this sum goes to these debts we need additional
assumptions. Assume that there is no change in long-term debt. Then, short-term
debt =$841.41 - 150 = $691.81 million.
We have completed the balance sheet! We have prepared a financial plan for
the next year.
23. 23. dia
Financial PlanningFinancial planning – Fourth step: completed the balance sheet
GPC Financial Statements, Years xxx1 - xxx3
(Nearest $ Million)
Year xxx0 xxx1 xxx2 xxx3 xxx4
Balance Sheet
Assets:
Cash & equivalents
Receivables
Inventories
Property, Plant & equipment
Total Assets
Liabilities:
Payables
Short-term debt
Long-term debt
Total Liabilities
Shareholder's equity
10
40
50
500
600
12
48
60
600
720
14
58
72
720
864
17
69
86
864
1037
21
83
104
1037
1244
30
120
150
300
300
36
221
150
407
313
43
347
150
540
324
52
502
150
704
333
62
692
150
904
340
24. 24. dia
Financial PlanningCan we do the same exercise with a real firm?
Here are some relevant numbers of Manchester United.
Open Day 2_Financial planning_MU.
25. 25. dia
Financial PlanningCan we do the same exercise with a real firm?
First step: we compare all items to revenues of the same year.
26. 26. dia
Financial PlanningCan we do the same exercise with a real firm?
Obviously, here the number are not as nice as before, but still we see some
quite stable ratios. Total operating expenses and operating profits are quite
stable, the do not vary much. Total operating expenses have possibly grown
compared to revenues as MU is not as successful as before, so has less
revenue, but still has to pay a lot to its star players. Operating profits are a bit
lower than the average due to the same reason. Total assets are also stable
around 300%.
Second step is to forecast revenues. It is easy to calculate the change in
revenues for the last years. These numbers are: 16% for 2011, -3% for 2012,
13% for 2013, 19% for 2014 and -9% for 2015. The average is about 7%. We
may implement this number with additional information. For instance, we
think that MU is not going to play in any international tournament next year,
leading to a 10% decrease in revenue! Then for 2016 we expect it to be
355660.2.
Now, based on the fixed ratios we can forecast the items with fixed ratios.
Which items do we consider to have a fixed ratio. On the next slide I also
represent the averages of the percentages.
27. 27. dia
Financial PlanningCan we do the same exercise with a real firm?
Fixed ratios?
28. 28. dia
Financial PlanningCan we do the same exercise with a real firm?
Fixed ratios?
As commented before, total operating expenses, the items related to
operating profit and total assets can be considered to have a stable ratio to
revenues. For these items, using the ratios and the forecasted revenue we can
calculate the forecasted amounts. We can modify them a bit as we expect that
MU will not play in any European tournament. It would increase the ratio of
total operating expenses (say, to 105%) and lower the ratio of operating profit
(say, to 5%). There is no clear modification for total assets, so there we use the
average of the last years.
Therefore, total operating expenses = 105%*355660.2=373443.2, operating
profit = 5%*355660.2=17783.01, total assets = 311%*355660.2= 1106140.
We were only able to fill in some slots, but we are advancing.
29. 29. dia
Financial PlanningCan we do the same exercise with a real firm?
30. 30. dia
Financial PlanningCan we do the same exercise with a real firm?
The next step is about finding the missing numbers.
Net finance costs are determined mostly by debt service. That is, MU has debt
and has to pay interests and pay back the principal amount. These costs can
be projected easily. Suppose that you have 1 million dollar of debt that
matures in 3 years and you have to pay 10% interest plus pay back the 1
million dollar in the last year. Then you know that in the next 3 years you have
to pay 100000$, 100000$ and 100000$ + 1000000$. For simplicity, we assume
that the net finance cost is 50000.
Tax is a certain percent of profits. (I do not understand why it varied so
drastically in previous years.) If we assume that it is x percent of profits, then
we can forecast it. Assume that the tax burden is 20%.
Now we can complete the income statement.
31. 31. dia
Financial PlanningCan we do the same exercise with a real firm?
32. 32. dia
Financial PlanningCan we do the same exercise with a real firm?
What about the balance sheet?
We leave aside cash and cash equivalents. The amount of this item is
determined by liquidity management considerations. Its forecast is not so
important.
Total liabilities and total equity have to add up to equal total assets. These
items changed quite in the last years. However, if we compare them to assets,
then we see the following:
33. 33. dia
Financial PlanningCan we do the same exercise with a real firm?
Hence, it seems that before liabilities made up 75% of the assets, the
remaining 25% being represented by equity, but it has changed and now the
new numbers are 60% and 40%.
It shows a change in the way Manchester United is financed. Before the
funding relied more heavily on external funds, but for some reason the
owners decided to increase internal funding.
The good news is that we can use these new numbers for our forecast.
We are ready with a real forecast.
34. 34. dia
Financial PlanningCan we do the same exercise with a real firm?
35. 35. dia
Assignment 2Financial Planning
Choose any company that has on its website the data (balance
sheet and income statement) that we used. Focus only on the
main items.
Income statement
• Revenue / sales
• Costs / expenses
• Profit before taxes
• Tax
• Profit
Balance sheet
• Total assets
• Total liabilities
• Total equity
Based on the numbers of the last years (at least 3 years) prepare
a financial plan.
36. 36. dia
Assignment 2Financial Planning
Choose wisely the company as you may need to come up with
assumptions as we did and those assumption should be justified.
(Hint: choose a big, well-known company.)
37. 37. dia
Financial PlanningGrowth and need for external finance
In the previous example we have seen that if the sales revenue of GPC is to
grow by 20% which can be seen as the target of the company, then the sum of
short-term and long-term debts of the company have to increase from 651.72
million dollars to 841.81. This is an increase of 190.09 million dollars.
This is the amount of exteral funding that the firm needs to meet its target.
The firm may decide to increase short-term debt or increase long-term debt or
issue new shares.
Let us see how this external funding depends on the growth of revenues! We
can compute the external funds needed directly.
Let
S1 be the sales in next year
S0 be the sales this year
A[S] be the assets that vary with sales
L[S] be the liabilities that vary with sales
d be the dividend pay-out ratio
t be the tax rate
38. 38. dia
Financial PlanningGrowth and need for external finance
Then,
S1 S 0
S1
EFN ( A[ S ] L[ S ])
(( EBIT0 Int )(1 t )(1 d )
S0
S0
(1036.80 51.84) * 0.2 ((86.40 * 1.2 87.26) * (1 0.40) * (1 0.30)
$190.0956 Million
EBIT refers to earnings before interest and taxes and Int represents interest
expenses.
This formula just succintly contains all the steps that we made before.
39. 39. dia
Financial PlanningGrowth and need for external finance
Using this formula we can calculate the external funding rate if we want
revenues to increase by any percent. I calculated the numbers for 0; 10; 20;
30; 50 and 100%. The results are the following:
Increase in sales
0%
10%
20%
30%
50%
100%
EFN
0.36
95.23
190.10
284.96
474.70
949.03
External funding need
1000.00
900.00
800.00
700.00
600.00
million $
500.00
EFN
400.00
300.00
200.00
100.00
0.00
0% 10% 20% 30% 40% 50% 60% 70% 80% 90% 100%
Increase in sales
40. 40. dia
Financial PlanningGrowth and need for external finance
Hence, the more the firm wants to grow, the more external funding it needs.
Often actually external funding is a main constraint. It may be difficult to find
investors willing to invest 190 million dollars in your firm. So we may reverse
the question and ask how the firm can grow if external finance is limited to a
certain amount.
A natural question is how fast can the firm grow if no external funding is
available, that is EFN=0. By subsituting EFN=0 in the equation on the previous
slide we can calculate the growth of sales that can be achieved with no
external funding. (Do not worry, you do not have to make such calculations!
Computers or accountants do it.)
growth No EF
( EBIT Int )(1 t )(1 d )
A[ S ] L[ S ] EBIT (1 t )(1 d )
If we do the maths, then the result is that S1/S0=0.999619. That is, without
external finance the firm will not grow in revenues. (More precisely, it will
decrease a bit.)
41. 41. dia
Financial PlanningSustainable rate of growth
The sustainable growth rate is a measure of how much a firm can grow
without borrowing more money. After the firm has passed this rate, it must
borrow
funds
from
another
source
to
facilitate
growth.
If there is no external finance, then the growth of the shareholders’ equity
constrains the growth of the firm. The growth of the equity is the amount of
profits not paid out to the shareholders.
The numerator of the previous formula is the earning (profit) of the firm once
interest expenses, taxes and dividend have been paid. This is the amount that
the shareholders equity is increasing. The higher is this amount, the more can
the firm grow.
The growth of the shareholders equity is determined by how profitably the
firm uses the equity which is measured by the return on equity (RoE). Hence,
the higher is RoE, the higher is the growth of the shareholders equity and in
turn the higher is the sustainable rate of growth.
42. 42. dia
Financial PlanningSustainable rate of growth
There is an easy formula to calculate sustainable growth:
Sustainable Rate of Growth = (1-d)*RoE
It just tells that the higher is the RoE (and hence the profits) and the higher
share of that profit is retained (that is the smaller d), the more can the firm
grow.
How is the sustainable growth of Manchester United?
In the last two years MU did not pay dividends, so d=0. The RoE of MU equals
-0.18%, so MU can grow without external finance at that rate. We have seen
that actually MU decreased more during 2015 (-9%).
43. 43. dia
Financial PlanningWorking Capital Management
An important part of financial planning and management is working capital
management.
In many instances companies need to spend money on costs before getting
some revenue from selling its product. Generally, you incur costs before the
revenues, e.g. you buy the raw material and ingredients of your product, you
make the product and only afterwards can you sell it.
Working capital measures this difference between short-term assets and
liabilities.
Working capital = Current assets - current liabilities
Remember that current assets are cash and other assets expected to be
converted to cash or consumed in a year. Receivables and inventory is also
part of current assets.
Current liabilities are reasonably expected to be liquidated within a year. They
usually include payables such as wages, accounts, taxes.
44. 44. dia
Financial PlanningWorking Capital Management
There is a problem if you have to pay a lot and for a long time before you have
revenues. It is even a problem if the revenues cover the costs. Thus, the big
task of working capital management is to find efficient ways to finance the
working of the company until revenues arrive.
In other words, a company may have a lot of profitable assets, but may be
unable to convert those assets into cash and have financing problems. For
instance, you may sell a lot of your products, but if your clients pay you later,
then you may be short of liquidity. Positive working capital is required to
ensure that a firm is able to continue its operations and that it has sufficient
funds to satisfy both maturing short-term debt and upcoming operational
expenses. The management of working capital involves managing inventories,
accounts receivable and payable, and cash.
Note that if you have a positive working capital, then you expect to have more
current asset (cash, receivables and inventory) than current liabilities (money
that you have to pay within a year) and then there is a good chance that you
will have enough money to settle those bills.
45. 45. dia
Financial PlanningEfficient Management of Working Capital Principle:
Minimize the investment in non-earning assets such as receivables and
inventories. Note that receivables (money that your customers owe you, but
have not paid yet) and inventory (products that you have produced but did
not sell yet) are resources and good for the company, but they need to be
converted into money that you can use to finance your operations. Thus,
regarding current assets a firm has to be careful with the items that are not
directly making money.
Maximizing the use of free credit such as prepayments by customers or
accounts payable. This free credit because for instance an account that is
payable means that you have the product, but you have not paid for it yet. So
you can use it for free.
The two advices help decrease the time between the selling of your product
and the arrival of money for it and therefore they reduce the working capital
need.
The amount of time it takes to turn the net current assets and current
liabilities into cash is called working capital cycle (or cash cycle time).
46. 46. dia
Financial PlanningWorking Capital Management
The longer the working capital cycle is, the longer a business is tying up capital
in its working capital without earning a return on it. Therefore, as already
mentioned companies strive to reduce their working capital cycle by collecting
receivables quicker or sometimes stretching accounts payable.
A positive working capital cycle balances incoming and outgoing payments to
minimize net working capital and maximize free cash flow. For example, a
company that pays its suppliers in 30 days but takes 60 days to collect its
receivables has a working capital cycle of 30 days. This 30 day cycle usually
needs to be funded through some way of funding, for instance a bank credit.
The interest on this financing is a cost that reduces the company's profitability.
Growing businesses require cash, and being able to free up cash by shortening
the working capital cycle is the most inexpensive way to grow.
47. 47. dia
Financial PlanningWorking Capital Management: Cash cycle
One way to consider if working capital management is efficient is to study the
cash cycle (or cash conversion cycle). It is the net number of days from the
outlay of cash for raw material to receiving payment from the customer. As a
management tool, this metric makes explicit the inter-relatedness of decisions
relating to inventories, accounts receivable and payable, and cash. Because
this number effectively corresponds to the time that the firm's cash is tied up
in operations and unavailable for other activities, management generally aims
at a low net count.
Cash Cycle Time = Inventory period + receivable period - payables period
48. 48. dia
Financial PlanningWorking Capital Management – Real Madrid FC
Proper working capital management is important for sport clubs as well. We
have seen that positive working capital helps to balance incoming and
outgoing payments. This is true also for sport clubs. However, check the
working capital of Real Madrid in the last years (taken from the 2013-2014
report).
It was negative! And it is clear that they are making efforts to improve it. In
the report the club attributes it to the nature of transactions. For example, if
you contract a star player, you have to pay for him first and only later will he
earn money for the club if he is successful.
49. 49. dia
Financial PlanningCash budgeting
(This section builds heavily on the chapter about working capital in Brealey –
Myers: Principles of Corporate Finance.)
We have seen the importance of working capital management. Concretely, we
have seen that it is of utmost importance to ensure that the company has
always enough money. Cash budgeting is about planning and forecasting
future sources and uses of cash.
These forecasts serve two purposes. First, they alert the financial manager to
future cash needs. Second, the cash-flow forecasts provide a standard, or
budget, against which subsequent performance can be judged.
There are three common steps to preparing a cash budget:
• Step 1. Forecast the sources of cash. The largest inflow of cash comes from
payments by the firm’s customers.
• Step 2. Forecast uses of cash.
• Step 3. Calculate whether the firm is facing a cash shortage or surplus.
50. 50. dia
Financial PlanningCash budgeting
The financial plan sets out a strategy for investing cash surpluses or
financing any deficit.
We will illustrate these issues by using the example of an imaginary firm called
Dynamic Mattress that sells mattresses. Open the excel Day 2_Cash
budgeting!
Here are the sale forecasts by quarter for the company for the next year.
As already told, unless customers pay cash on delivery, sales become accounts
receivable before they become cash. Cash flow comes from collections on
accounts receivable.
Most firms keep track of the average time it takes customers to pay their bills.
From this they can forecast what proportion of a quarter’s sales is likely to be
converted into cash in that quarter and what proportion is likely to be carried
over to the next quarter as accounts receivable.
51. 51. dia
Financial PlanningCash budgeting
This proportion depends on the lags with which customers pay their bills. For
example, if customers wait 1 month to pay their bills, then on average onethird of each quarter’s bills will not be paid until the following quarter. If the
payment delay is 2 months, then two-thirds of quarterly sales will be collected
in the following quarter.
Suppose that 80 percent of sales are collected in the immediate quarter
and the remaining 20 percent in the next. In the first quarter, for example,
collections from current sales are 80 percent of $87.5 million, or $70 million.
But the firm also collects 20 percent of the previous quarter’s sales, or 0.20 ×
$75 million = $15 million. Therefore, total collections are $70 million + $15
million = $85 million.
Dynamic started the first quarter with $30 million of accounts receivable. The
quarter’s sales of $87.5 million were added to accounts receivable, but $85
million of collections was subtracted. Therefore, Dynamic ended the quarter
with accounts receivable of $30 million + $87.5 million – $85 million = $32.5
million.
52. 52. dia
Financial PlanningCash budgeting – Sources of cash
The general formula is
Ending accounts receivable = beginning accounts receivable + sales –
collections
In the next table we have forecast sources of cash for Dynamic Mattress.
Collection of receivables is the main source but it is not the only one. Perhaps
the firm plans to dispose of some land. Such items are included as “other”
sources. It is also possible that you may raise additional capital by borrowing
or selling stock. We just assume that Dynamic will not raise further long-term
finance.
53. 53. dia
Cash budgetingFinancial Planning
The second section of the table shows how Dynamic expects to use cash. We
consider four categories:
1. Payments of accounts payable.
2. Labor, administrative, and other expenses.
3. Capital expenditures.
4. Taxes, interest, and dividend payments.
54. 54. dia
Financial PlanningCash budgeting – Uses of cash
Some details.
1. Payments of accounts payable. Dynamic has to pay its bills for raw
materials, parts, electricity, and so on. The cash-flow forecast assumes all
these bills are paid on time, although Dynamic could probably delay payment
to some extent. Delayed payment is sometimes called stretching your
payables. Stretching is one source of short-term financing, but for most firms
it is an expensive source, because by stretching they lose discounts given to
firms that pay promptly.
2. Labor, administrative, and other expenses. This category includes all other
regular business expenses.
3. Capital expenditures. Note that Dynamic Mattress plans a major outlay of
cash in the first quarter to pay for a long-term asset.
4. Taxes, interest, and dividend payments. This includes interest on currently
outstanding long-term debt and dividend payments to stockholders.
55. 55. dia
Financial PlanningCash budgeting – Cash balance
The forecast net inflow of cash (sources minus uses) is shown on the bottom
row of the table. This the cash balance.
Note the large negative figure for the first quarter: a $45 million forecast
outflow. There is a smaller forecast outflow in the second quarter, and then
substantial cash inflows in the second half of the year.
As mentioned, the financial plan sets out a strategy for investing cash
surpluses or financing any deficit.
The next table shows calculations about how much financing Dynamic will
have to raise if its cash-flow forecasts are right.
These calculations are done generally on computer with special softwares.
56. 56. dia
Financial PlanningCash budgeting – Cash balance
Dynamic starts the year with $5 million in cash. There is a $45 million cash
outflow in the first quarter, and so Dynamic will have to obtain at least $45
million – $5 million = $40 million of additional financing. This would leave the
firm with a forecast cash balance of exactly zero at the start of the second
quarter.
Most financial managers regard a planned cash balance of zero as driving too
close to the edge of the cliff. They establish a minimum operating cash
balance to absorb unexpected cash inflows and outflows. We will assume that
Dynamic’s minimum operating cash balance is $5 million. That means it will
have to raise $45 million instead of $40 million in the first quarter, and $15
million more in the second quarter. Thus its cumulative financing requirement
is $60 million in the second quarter. Fortunately, this is the peak; the
cumulative requirement declines in the third quarter when its $26 million net
cash inflow reduces its cumulative financing requirement to $34 million. In the
final quarter Dynamic is out of the woods. Its $35 million net cash inflow is
enough to eliminate short-term financing and actually increase cash balances
above the $5 million minimum acceptable balance.
57. 57. dia
Financial PlanningCash budgeting – Cash balance
Some remarks.
• The large cash outflows in the first two quarters do not necessarily spell
trouble for Dynamic Mattress. In part they reflect the capital investment made
in the first quarter: Dynamic is spending $32.5 million. The cash outflows also
reflect low sales in the first half of the year; sales recover in the second half. If
this is a predictable seasonal pattern, the firm should have no trouble
borrowing to help it get through the slow months. Note that this happens also
with sport clubs. For example, upfront collection of membership dues/season
passes means that a large portion of revenues comes in at a certain period of
the year and not spread out during the whole year. Or new players are
contracted also at a certain point in the year, meaning a big cash-outflow.
• In the table we use only a best guess about future cash flows. It is a good
idea to think about the uncertainty in your estimates. For example, you could
undertake a sensitivity analysis, in which you inspect how Dynamic’s cash
requirements would be affected by a shortfall in sales or by a delay in
collections.
58. 58. dia
Financial PlanningCash budgeting – Short-term financing plan
Our next step will be to develop a short-term financing plan that covers the
forecast requirements in the most economical way possible.
There are several options for short-term financing. Dynamic may consider
putting off paying its bills and thus increasing its accounts payable. In effect,
this is taking a loan from its suppliers. The financial manager believes that
Dynamic can defer the following amounts in each quarter:
That is, $52 million can be saved in the first quarter by not paying bills in that
quarter. If deferred, these payments must be made in the second quarter.
Similarly, $48 million of the second quarter’s bills can be deferred to the third
quarter and so on. Stretching payables is often costly, however, even if no ill
will is incurred. This is because many suppliers offer discounts for prompt
payment, so that Dynamic loses the discount if it pays late. Assume the lost
discount is 5 percent of the amount deferred. In other words, if a $52 million
payment is delayed in the first quarter, the firm must pay 5 percent more, or
$54.6 million in the next quarter. This is like borrowing at an annual interest
rate of over 20 percent (1.05 4 – 1 = .216, or 21.6%).
59. 59. dia
Financial PlanningCash budgeting – Short-term financing plan
Alternatively, Dynamic can borrow up to $40 million from the bank at an
interest cost of 8 percent per year or 2 percent per quarter.
With these two options, the short-term financing strategy is obvious: use the
lower cost bank loan first. Stretch payables only if you can’t borrow enough
from the bank.
The next table shows the resulting plan. The first panel (cash requirements)
sets out the cash that needs to be raised in each quarter. The second panel
(cash raised) describes the various sources of financing the firm plans to use.
The third and fourth panels describe how the firm will use net cash inflows
when they turn positive.
60. 60. dia
Financial PlanningCash budgeting – Short-term financing plan
61. 61. dia
Financial PlanningCash budgeting – Short-term financing plan
In the first quarter the plan calls for borrowing the full amount available from
the bank ($40 million). In addition, the firm sells the $5 million of marketable
securities it held at the end of the last year. Thus under this plan it raises the
necessary $45 million in the first quarter.
In the second quarter, an additional $15 million must be raised to cover the
net cash outflow predicted earlier. In addition, $0.8 million must be raised to
pay interest on the bank loan. Therefore, the plan calls for Dynamic to
maintain its bank borrowing and to stretch $15.8 million in payables. Notice
that in the first two quarters, when net cash flow from operations is negative,
the firm maintains its cash balance at the minimum acceptable level.
Additions to cash balances are zero. Similarly, repayments of outstanding
debt are zero. In fact outstanding debt rises in each of these quarters.
In the third and fourth quarters, the firm generates a cash-flow surplus, so the
plan calls for Dynamic to pay off its debt. First it pays off stretched payables, as
it is required to do, and then it uses any remaining cash-flow surplus to pay
down its bank loan. In the third quarter, all of the net cash inflow is used to
reduce outstanding short-term borrowing. In the fourth quarter, the firm pays
off its remaining short-term borrowing and uses the extra $3 million to
increase its cash balances.
62. 62. dia
Financial PlanningCash budgeting – Evaluation of the plan
Does the plan solve Dynamic’s short-term financing problem? The plan is
feasible, but Dynamic can probably do better. The most glaring weakness of
this plan is its reliance on stretching payables, an extremely expensive
financing device. Remember that it costs Dynamic 5 percent per quarter to
delay paying bills—20 percent per year at simple interest. This first plan
should merely stimulate the financial manager to search for cheaper sources
of short-term borrowing.
The financial manager would ask several other questions as well. For example:
1. Does Dynamic need a larger reserve of cash or marketable securities
to guard against, say, its customers stretching their payables (thus slowing
down collections on accounts receivable)?
2. Does the plan yield satisfactory current and quick ratios? Its bankers may be
worried if these ratios deteriorate.
3. Are there hidden costs to stretching payables? Will suppliers begin to doubt
Dynamic’s creditworthiness?
63. 63. dia
Financial PlanningCash budgeting – Evaluation of the plan
4. Should Dynamic try to arrange long-term financing for the major capital
expenditure in the first quarter? This seems sensible, following the rule of
thumb that long-term assets deserve long-term financing. It would also
dramatically reduce the need for short-term borrowing.
5. Perhaps the firm’s operating and investment plans can be adjusted to make
the short-term financing problem easier. Is there any easy way of deferring the
first quarter’s large cash outflow? For example, suppose that the large capital
investment in the first quarter is for new machinery to be delivered and
installed in the first half of the year. The new machines are not scheduled to
be ready for full-scale use until August. Perhaps the machine manufacturer
could be persuaded to accept 60 percent of the purchase price on delivery
and 40 percent when the machines are installed and operating satisfactorily.
64. 64. dia
Financial PlanningCash budgeting – Evaluation of the plan
4. Should Dynamic try to arrange long-term financing for the major capital
expenditure in the first quarter? This seems sensible, following the rule of
thumb that long-term assets deserve long-term financing. It would also
dramatically reduce the need for short-term borrowing.
5. Perhaps the firm’s operating and investment plans can be adjusted to make
the short-term financing problem easier. Is there any easy way of deferring the
first quarter’s large cash outflow? For example, suppose that the large capital
investment in the first quarter is for new machinery to be delivered and
installed in the first half of the year. The new machines are not scheduled to
be ready for full-scale use until August. Perhaps the machine manufacturer
could be persuaded to accept 60 percent of the purchase price on delivery
and 40 percent when the machines are installed and operating satisfactorily.
Important message: Short-term financing plans must be developed by trial
and error. You lay out one plan, think about it, then try again with different
assumptions on financing and investment alternatives. You continue until you
can think of no further improvements.
65. 65. dia
Financial PlanningCash budgeting – Sources of Short-Term Financing: Bank loans
Let us briefly consider alternative ways of short-term borrowing.
Bank loans
The simplest and most common source of short-term finance is an unsecured
loan from a bank. For example, Dynamic might have a standing arrangement
with its bank allowing it to borrow up to $40 million. The firm can borrow and
repay whenever it wants so long as it does not exceed the credit limit. This
kind of arrangement is called a line of credit.
Lines of credit are typically reviewed annually, and it is possible that the bank
may seek to cancel it if the firm’s creditworthiness deteriorates. If the firm
wants to be sure that it will be able to borrow, it can enter into a revolving
credit agreement with the bank. Revolving credit arrangements usually last for
a few years and formally commit the bank to lending up to the agreed limit. In
return the bank will require the firm to pay a commitment fee of around 0.25
percent on any unused amount.
Most bank loans have durations of only a few months. For example,
Dynamic may need a loan to cover a seasonal increase in inventories, and the
loan is then repaid as the goods are sold.
66. 66. dia
Financial PlanningCash budgeting – Sources of Short-Term Financing: Bank loans
However, banks also make term loans, which last for several years. These term
loans sometimes involve huge sums of money, and in this case they may be
parceled out among a syndicate of banks. For example, when Eurotunnel
needed to arrange more than $10 billion of borrowing to construct the tunnel
between Britain and France, a syndicate of more than 200 international banks
combined to provide the cash.
67. 67. dia
Financial PlanningCash budgeting – Sources of Short-Term Financing: Commercial Papers
Commercial papers
When banks lend money, they provide two services. They match up would-be
borrowers and lenders and they check that the borrower is likely to repay the
loan. Banks recover the costs of providing these services by charging
borrowers on average a higher interest rate than they pay to lenders. These
services are less necessary for large, well-known companies that regularly
need to raise large amounts of cash. These companies have increasingly found
it profitable to bypass the bank and to sell short-term debt, known as
commercial paper, directly to large investors.
Commercial paper has a maximum maturity of 9 months. Commercial paper is
not secured, but companies generally back their issue of paper by arranging a
special backup line of credit with a bank. This guarantees that they can find
the money to repay the paper, and the risk of default is therefore small.
68. 68. dia
Financial PlanningCash budgeting – Sources of Short-Term Financing: Secured loans
Secured loans
Many short-term loans are unsecured, but sometimes the company may offer
assets as security. Since the bank is lending on a short-term basis, the security
generally consists of liquid assets such as receivables, inventories, or
securities. For example, a firm may decide to borrow short-term money
secured by its accounts receivable. When its customers pay their bills, it can
use the cash collected to repay the loan. Banks will not usually lend the full
value of the assets that are used as security. For example, a firm that puts up
$100,000 of receivables as security may find that the bank is prepared to lend
only $75,000. The safety margin (or haircut, as it is called) is likely to be even
larger in the case of loans that are secured by inventory.
69. 69. dia
Financial PlanningConclusion – Financial planning
Hopefully, after this lesson you are convinced about the importance of
financial planning.
We carried out some simple financial planning. Although they were more
simple than planning in real life, but they contained the elements that you
need to know if you are to make a financial plan.
We have also seen how working capital management and cash budgeting
works. These complement and enhance financial planning and are essential
for the good working of any company.
70. 70. dia
The Time Value of MoneyIntroduction – The time value of money
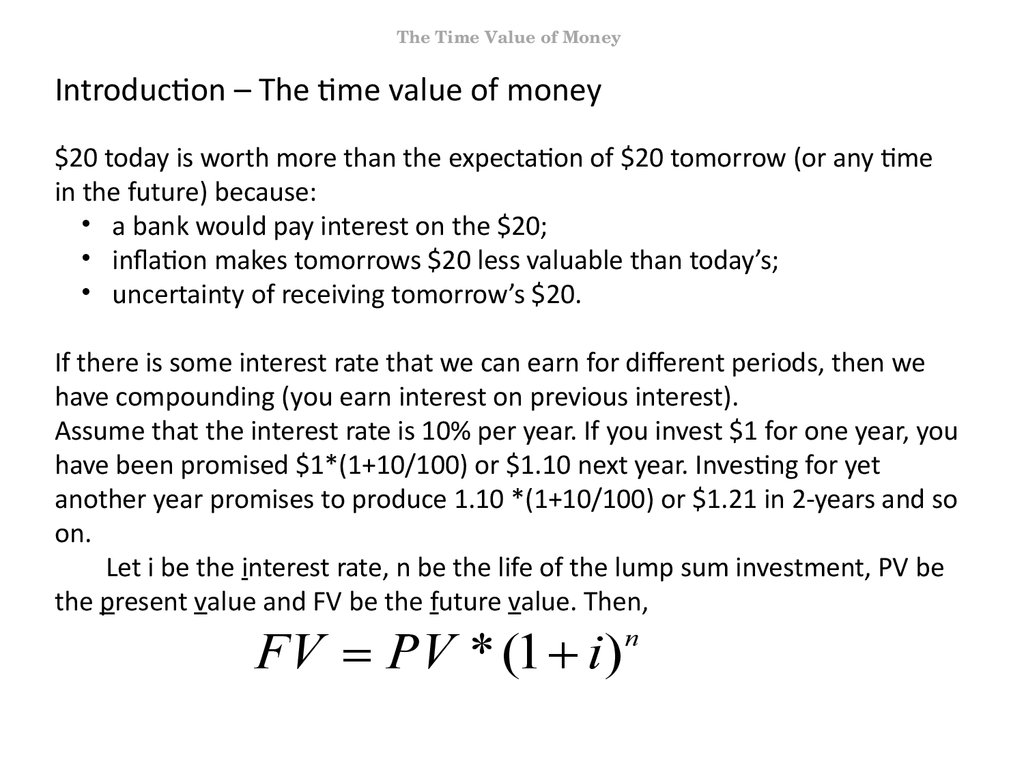
$20 today is worth more than the expectation of $20 tomorrow (or any time
in the future) because:
• a bank would pay interest on the $20;
• inflation makes tomorrows $20 less valuable than today’s;
• uncertainty of receiving tomorrow’s $20.
If there is some interest rate that we can earn for different periods, then we
have compounding (you earn interest on previous interest).
Assume that the interest rate is 10% per year. If you invest $1 for one year, you
have been promised $1*(1+10/100) or $1.10 next year. Investing for yet
another year promises to produce 1.10 *(1+10/100) or $1.21 in 2-years and so
on.
Let i be the interest rate, n be the life of the lump sum investment, PV be
the present value and FV be the future value. Then,
FV PV * (1 i )
n
71. 71. dia
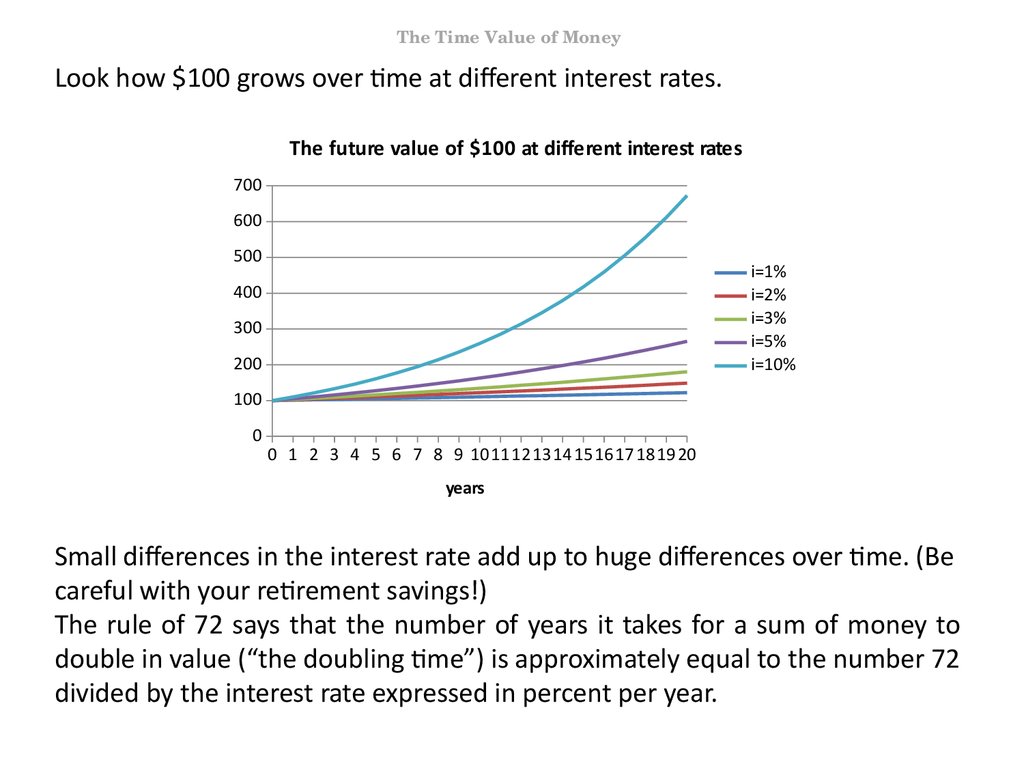
The Time Value of MoneyLook how $100 grows over time at different interest rates.
The future value of $100 at different interest rates
700
600
500
i=1%
i=2%
i=3%
i=5%
i=10%
400
300
200
100
0
0 1 2 3 4 5 6 7 8 9 1011121314 15 16171819 20
years
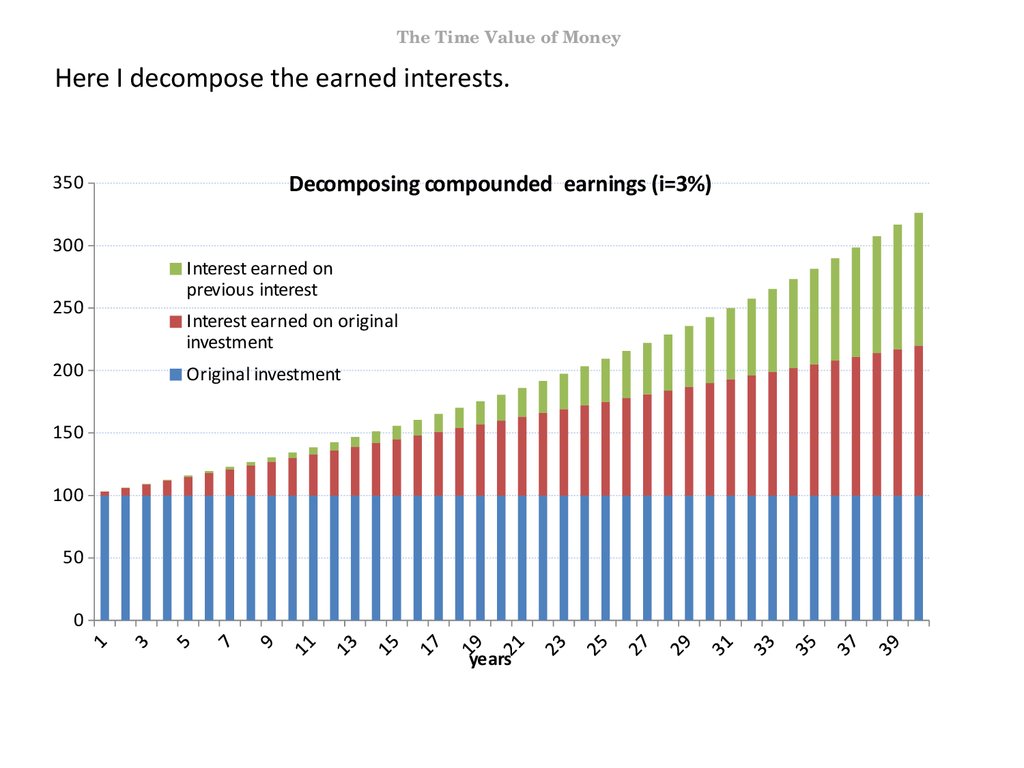
Small differences in the interest rate add up to huge differences over time. (Be
careful with your retirement savings!)
The rule of 72 says that the number of years it takes for a sum of money to
double in value (“the doubling time”) is approximately equal to the number 72
divided by the interest rate expressed in percent per year.
72. 72. dia
The Time Value of MoneyHere I decompose the earned interests.
350
300
250
200
Decomposing compounded earnings (i=3%)
Interest earned on
previous interest
Interest earned on original
investment
Original investment
150
100
50
0
years
73. The sale of Manhattan Island
The Time Value of MoneyThe sale of Manhattan Island
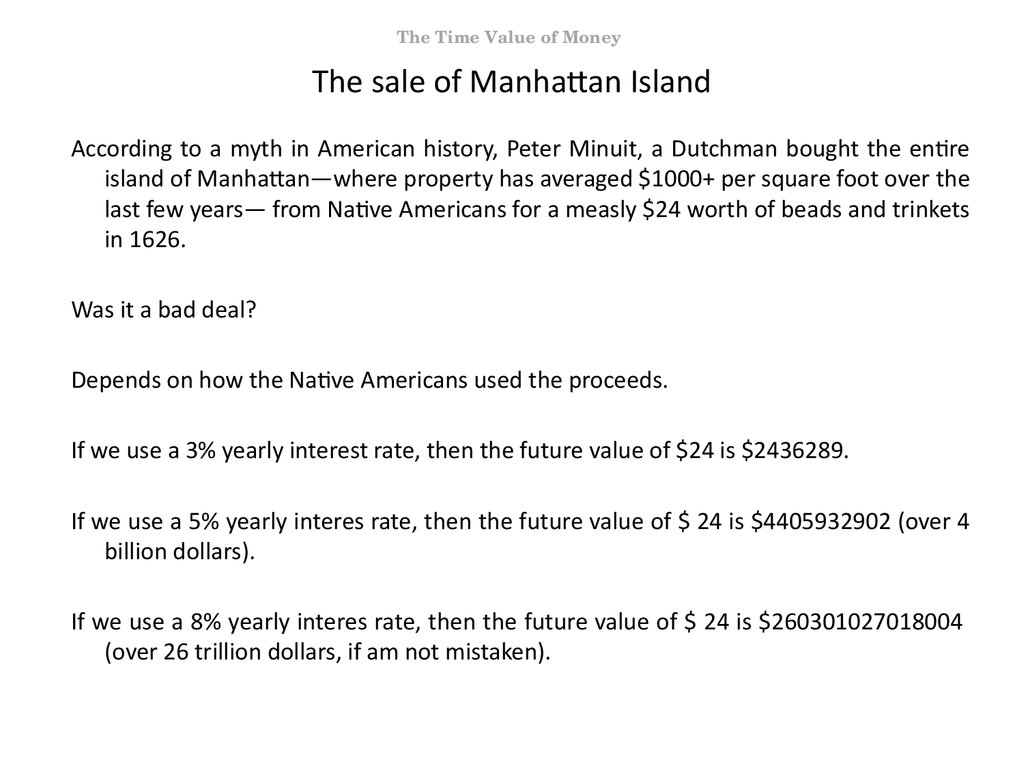
According to a myth in American history, Peter Minuit, a Dutchman bought the entire
island of Manhattan—where property has averaged $1000+ per square foot over the
last few years— from Native Americans for a measly $24 worth of beads and trinkets
in 1626.
Was it a bad deal?
Depends on how the Native Americans used the proceeds.
If we use a 3% yearly interest rate, then the future value of $24 is $2436289.
If we use a 5% yearly interes rate, then the future value of $ 24 is $4405932902 (over 4
billion dollars).
If we use a 8% yearly interes rate, then the future value of $ 24 is $260301027018004
(over 26 trillion dollars, if am not mistaken).
74. 74. dia
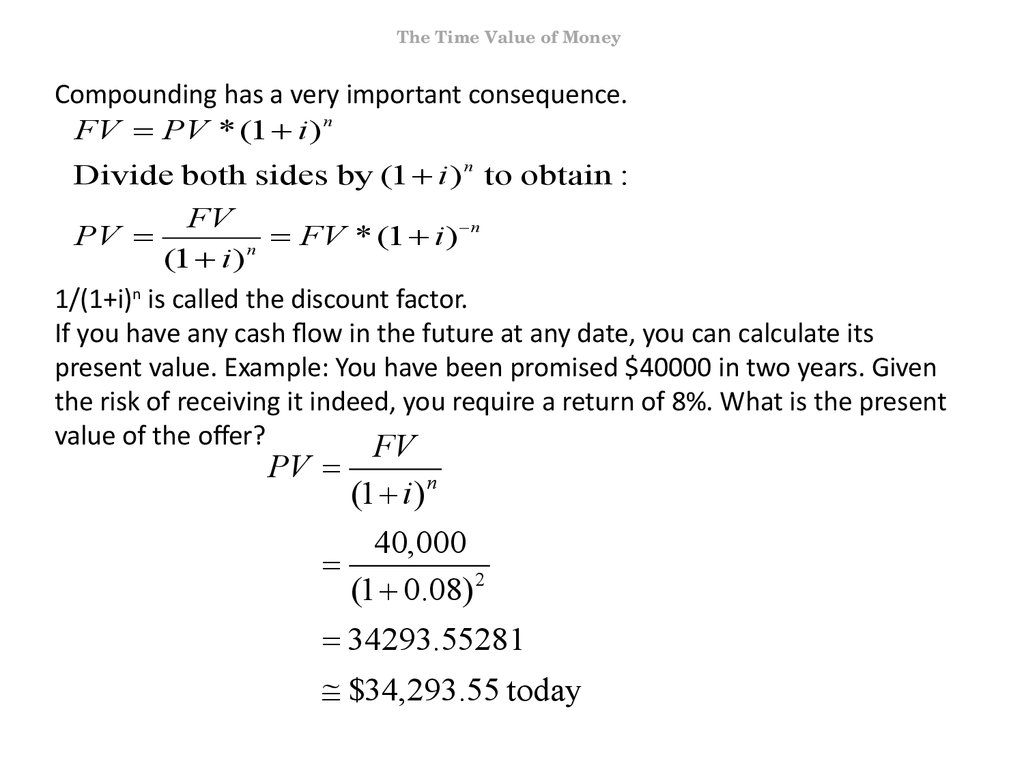
The Time Value of MoneyCompounding has a very important consequence.
FV PV * (1 i ) n
Divide both sides by (1 i ) n to obtain :
FV
n
FV
*
(
1
i
)
(1 i ) n
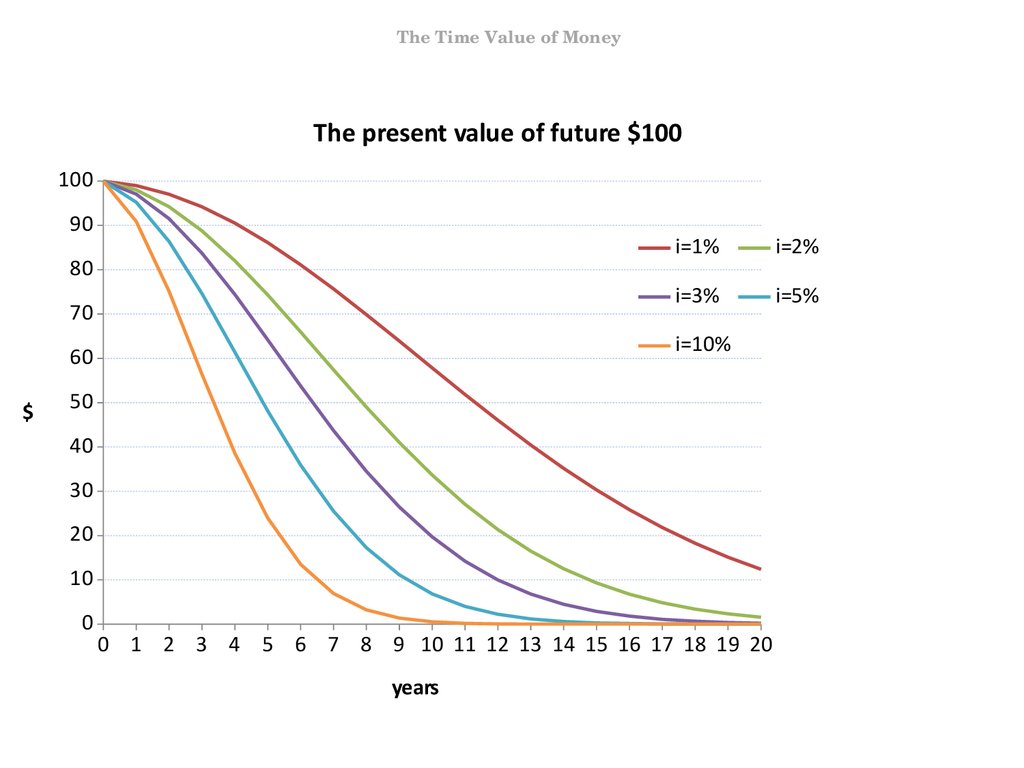
1/(1+i)n is called the discount factor.
If you have any cash flow in the future at any date, you can calculate its
present value. Example: You have been promised $40000 in two years. Given
the risk of receiving it indeed, you require a return of 8%. What is the present
value of the offer?
FV
PV
PV
(1 i ) n
40,000
(1 0.08) 2
34293.55281
$34,293.55 today
75. 75. dia
The Time Value of MoneyThe present value of future $100
100
90
80
70
i=2%
i=3%
i=5%
i=10%
60
$
i=1%
50
40
30
20
10
0
0 1 2 3 4 5 6 7 8 9 10 11 12 13 14 15 16 17 18 19 20
years
76. 76. dia
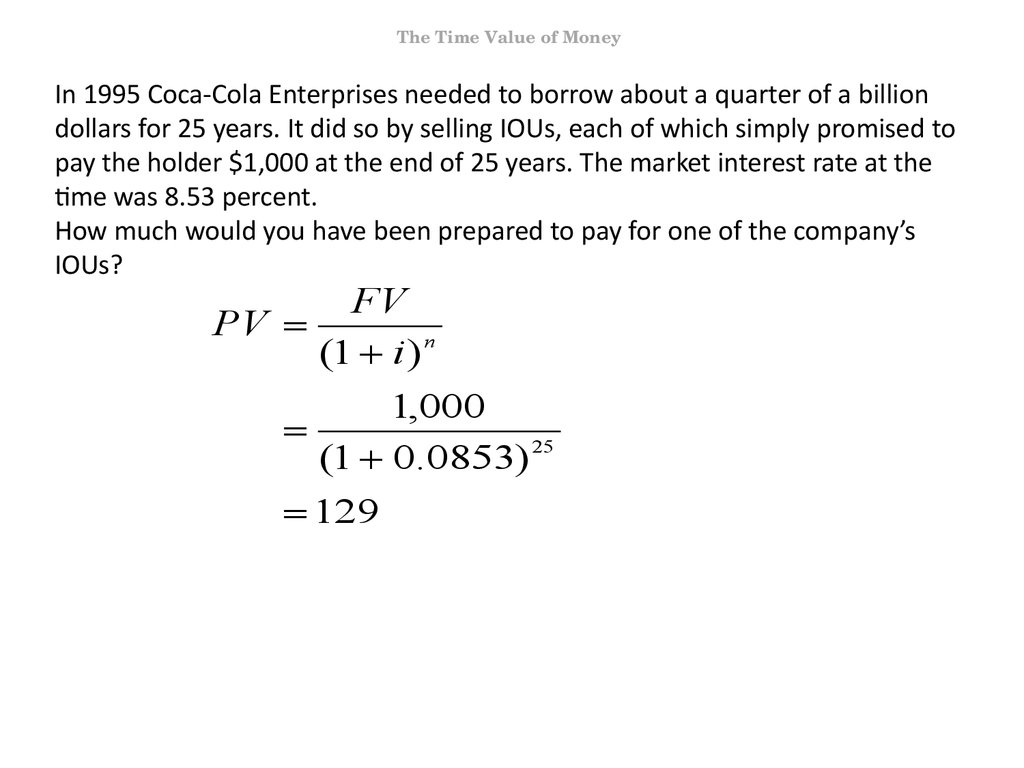
The Time Value of MoneyIn 1995 Coca-Cola Enterprises needed to borrow about a quarter of a billion
dollars for 25 years. It did so by selling IOUs, each of which simply promised to
pay the holder $1,000 at the end of 25 years. The market interest rate at the
time was 8.53 percent.
How much would you have been prepared to pay for one of the company’s
IOUs?
FV
PV
(1 i ) n
1,000
(1 0.0853) 25
129
77. 77. dia
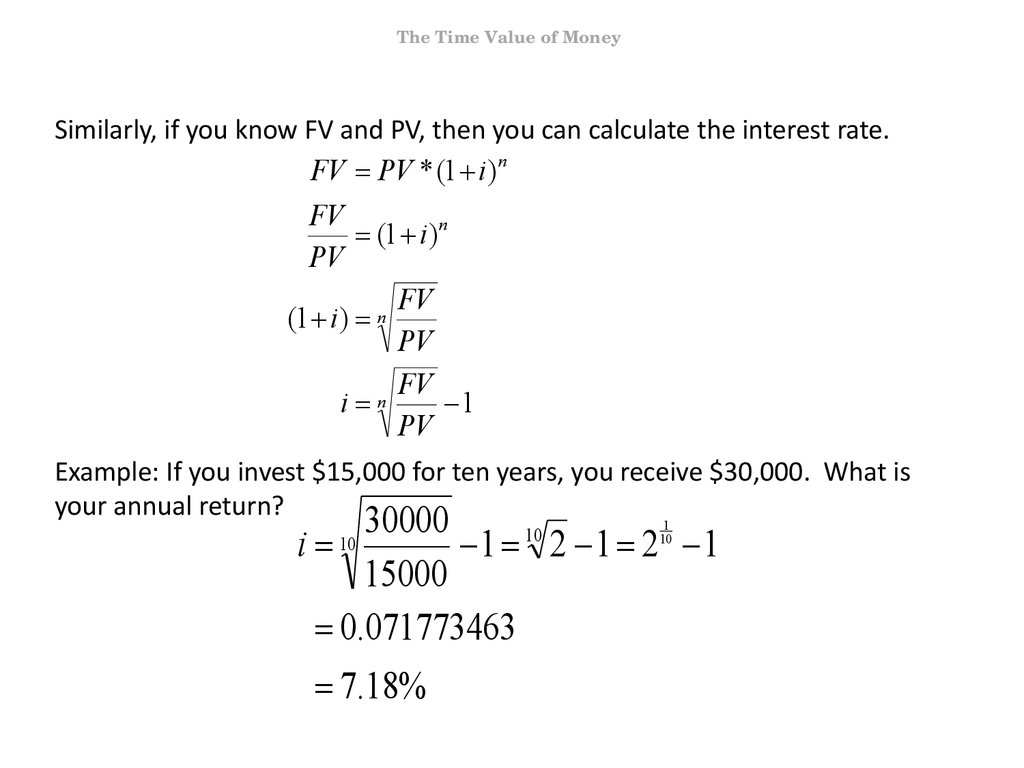
The Time Value of MoneySimilarly, if you know FV and PV, then you can calculate the interest rate.
FV PV * (1 i ) n
FV
(1 i ) n
PV
FV
(1 i ) n
PV
FV
i n
1
PV
Example: If you invest $15,000 for ten years, you receive $30,000. What is
your annual return?
30000
i
1 10 2 1 2 1
15000
0.071773463
7.18%
10
1
10
78. 78. dia
Famous Cash FlowsCash flows
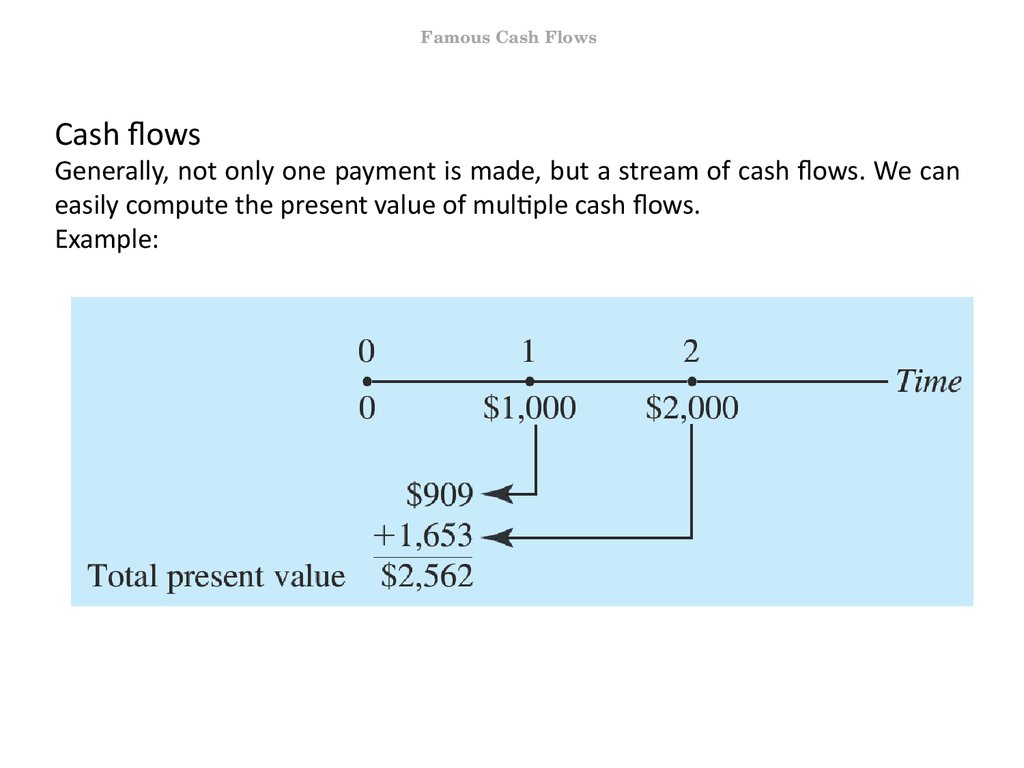
Generally, not only one payment is made, but a stream of cash flows. We can
easily compute the present value of multiple cash flows.
Example:
79. 79. dia
Famous Cash FlowsCash flows – an example
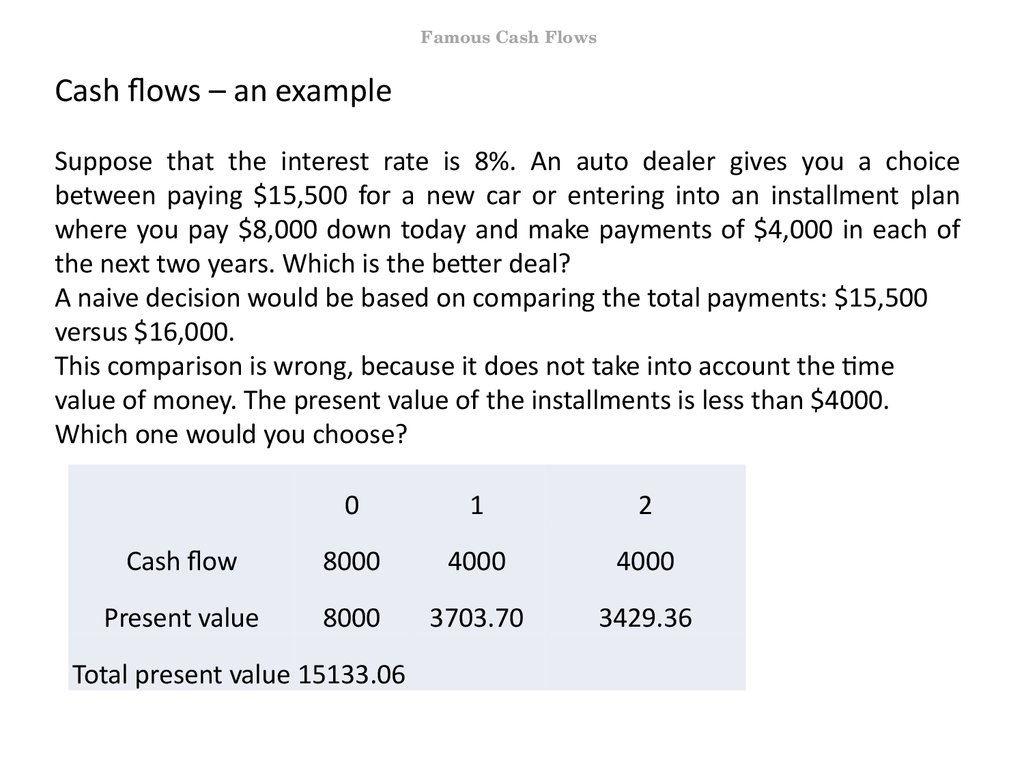
Suppose that the interest rate is 8%. An auto dealer gives you a choice
between paying $15,500 for a new car or entering into an installment plan
where you pay $8,000 down today and make payments of $4,000 in each of
the next two years. Which is the better deal?
A naive decision would be based on comparing the total payments: $15,500
versus $16,000.
This comparison is wrong, because it does not take into account the time
value of money. The present value of the installments is less than $4000.
Which one would you choose?
0
1
2
Cash flow
8000
4000
4000
Present value
8000
3703.70
3429.36
Total present value 15133.06
80. 80. dia
Famous Cash FlowsLevel cash flows
There are cash flows that feature very regular payments.
For example, a home mortgage might require the homeowner to make equal
monthly payments for the life of the loan. For a 30-year loan, this would result
in 360 equal payments.
We will consider now such cash flows. Due to the equal payments, there are
easy formulas to calculate the present value of such cash flows.
81. 81. dia
AnnuityAnnuity
Annuity is a sequence of equally spaced identical cash flows.
We will use the following assumptions:
• the first cash flow will occur exactly one period form now;
• all subsequent cash flows are separated by exactly one period;
• all periods are of equal length;
• the term structure of interest is flat;
• all cash flows have the same (nominal) value.
We will use the following notation:
• PV = the present value of the annuity
• i = interest rate to be earned over the life of the annuity
• n = the number of payments
• pmt = the periodic payment
82. 82. dia
AnnuityThe present value of an annuity
How much would you pay for a cash flow that gives for n periods pmt?
pmt
pmt
pmt
pmt
pmt
PV
1
2
3
n 1
n
1 i 1 i 1 i
1 i 1 i
1
1
1
1
1
PV pmt *{
1
2
3
n 1
n}
1 i 1 i 1 i
1 i
1 i
Multiply both sides by (1+i)
1
1
1
1
1
PV (1 i) pmt (1 i) {
}
1
2
3
n 1
n
1 i 1 i 1 i
1 i 1 i
1
1
1
1
1
PV * (1 i ) pmt * {
}
0
1
2
n 2
n 1
1 i 1 i 1 i
1 i 1 i
83. 83. dia
AnnuitySubstract from line 4 line 2
1
1
PV i pmt {
}
0
n
1 i 1 i
pmt
1
PV
{1
}
n
i
1 i
1-1/(1+i)n is called the annuity factor.
84. 84. dia
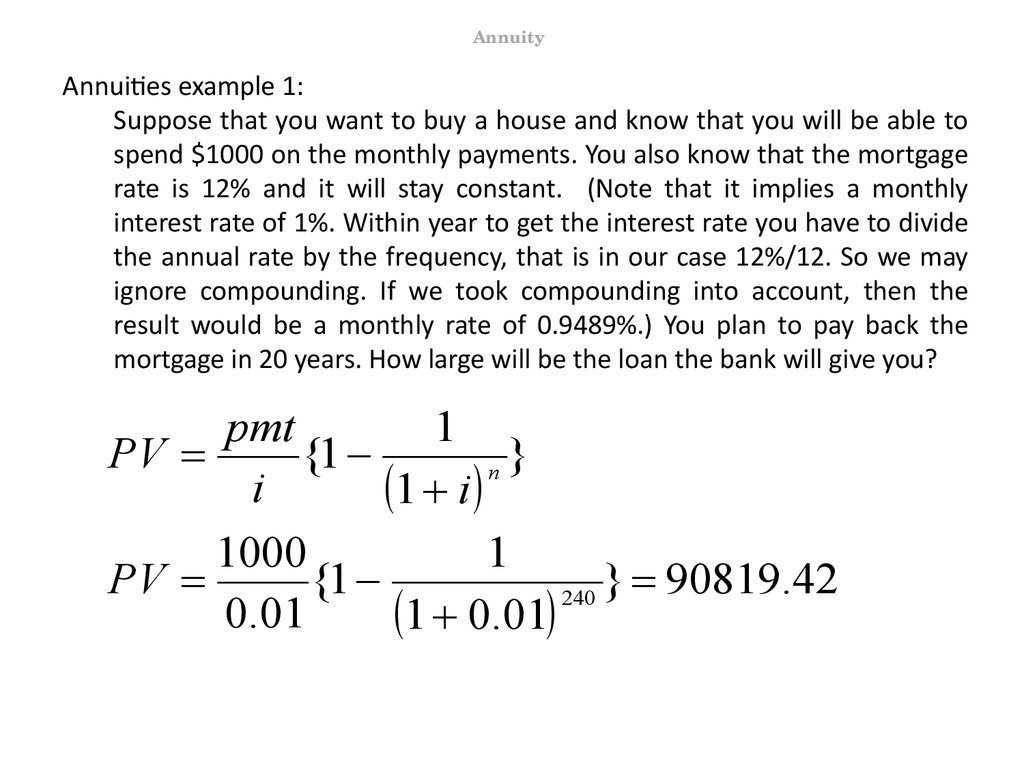
AnnuityAnnuities example 1:
Suppose that you want to buy a house and know that you will be able to
spend $1000 on the monthly payments. You also know that the mortgage
rate is 12% and it will stay constant. (Note that it implies a monthly
interest rate of 1%. Within year to get the interest rate you have to divide
the annual rate by the frequency, that is in our case 12%/12. So we may
ignore compounding. If we took compounding into account, then the
result would be a monthly rate of 0.9489%.) You plan to pay back the
mortgage in 20 years. How large will be the loan the bank will give you?
pmt
1
PV
{1
}
n
i
1 i
1000
1
PV
{1
} 90819.42
240
0.01
1 0.01
85. 85. dia
AnnuityAnnuities example 2:
Suppose that you want to buy a house and need $450000. You want a
mortgage for 30 years, that implies 360 monthly payments. Assume that
the annual mortgage interest rate is 6% and is constant over the 30 years.
Then the loan’s rate is a constant 1/2% per month. How large will be the
monthly payments?
pmt
1
PV
{1
}
n
i
1 i
pmt
1
450000
{1
}
360
0.005
1 0.005
0.005 450000
pmt
2697.977
1
{1
}
360
1 0.005
86. 86. dia
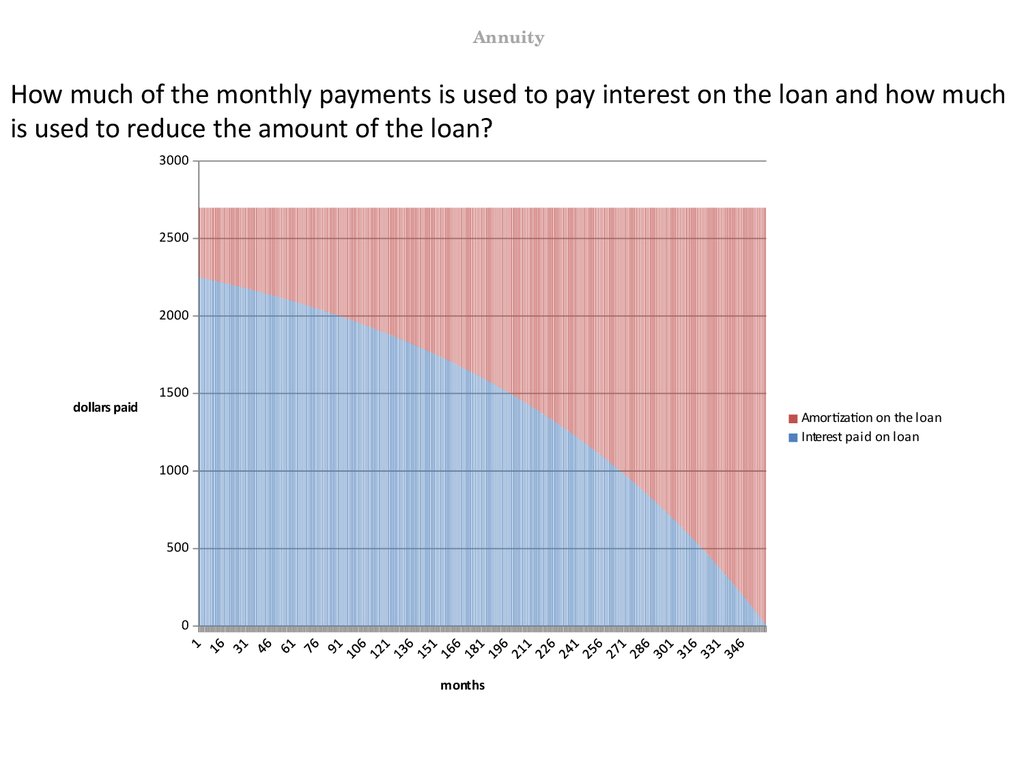
AnnuityHow much of the monthly payments is used to pay interest on the loan and how much
is used to reduce the amount of the loan?
3000
2500
2000
dollars paid
1500
Amortization on the loan
Interest paid on loan
1000
500
0
months
87. 87. dia
The retirement exampleThe retirement example
Let’s see how we can use knowing how „famous” cash flows are calculated to
figure out important questions.
Assume that you are currently 35 years old, expect to retire in 30 years at 65,
and then live for 15 more years until 80. Your real labor income is
$30,000/year until age 65. Interest rates exceed inflation by 3%/ year. Note
that we focus on real income and interest rate.
The big question is how much should you save and consume?
It depends on what your preferred level of consumption is when retired.
We consider two approaches:
• Target replacement rate of pre-retirement income.
• Maintain the same level of consumption spending.
88. 88. dia
The retirement exampleTarget replacement rate of pre-retirement income
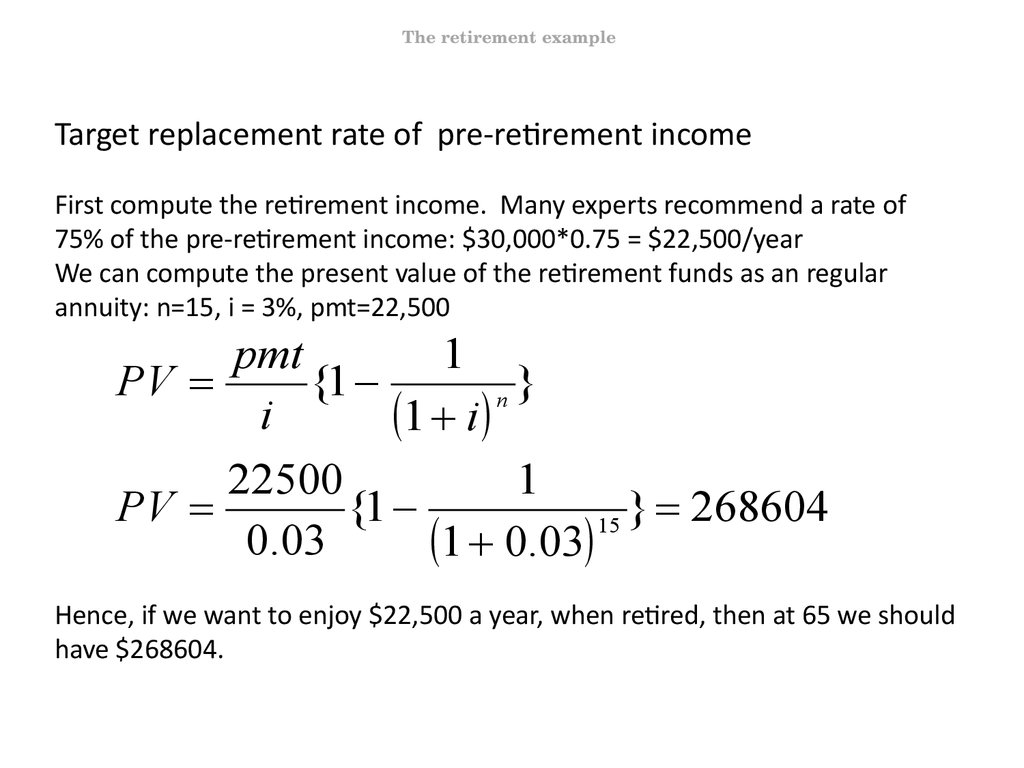
First compute the retirement income. Many experts recommend a rate of
75% of the pre-retirement income: $30,000*0.75 = $22,500/year
We can compute the present value of the retirement funds as an regular
annuity: n=15, i = 3%, pmt=22,500
pmt
1
PV
{1
}
n
i
1 i
22500
1
PV
{1
} 268604
15
0.03
1 0.03
Hence, if we want to enjoy $22,500 a year, when retired, then at 65 we should
have $268604.
89. 89. dia
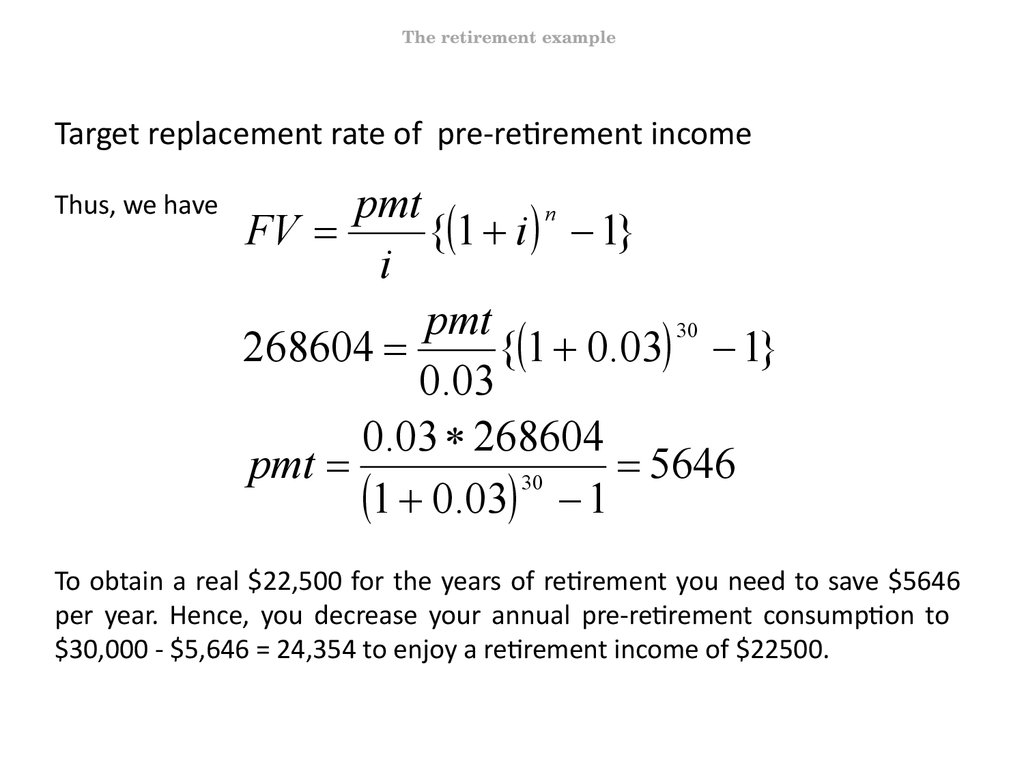
The retirement exampleTarget replacement rate of pre-retirement income
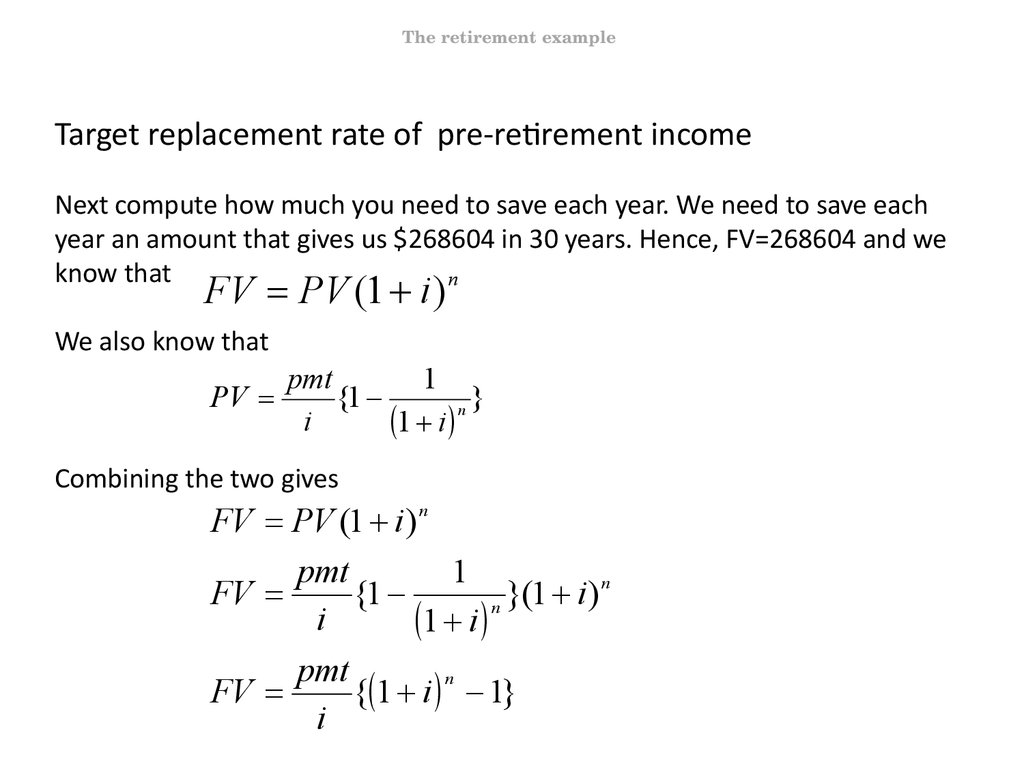
Next compute how much you need to save each year. We need to save each
year an amount that gives us $268604 in 30 years. Hence, FV=268604 and we
know that
n
FV PV (1 i )
We also know that
PV
pmt
1
{1
}
n
i
1 i
Combining the two gives
FV PV (1 i ) n
pmt
1
n
FV
{1
}(
1
i
)
i
1 i n
pmt
n
FV
{ 1 i 1}
i
90. 90. dia
The retirement exampleTarget replacement rate of pre-retirement income
Thus, we have
pmt
n
FV
{ 1 i 1}
i
pmt
30
268604
{ 1 0.03 1}
0.03
0.03 268604
pmt
5646
30
1 0.03 1
To obtain a real $22,500 for the years of retirement you need to save $5646
per year. Hence, you decrease your annual pre-retirement consumption to
$30,000 - $5,646 = 24,354 to enjoy a retirement income of $22500.
91. 91. dia
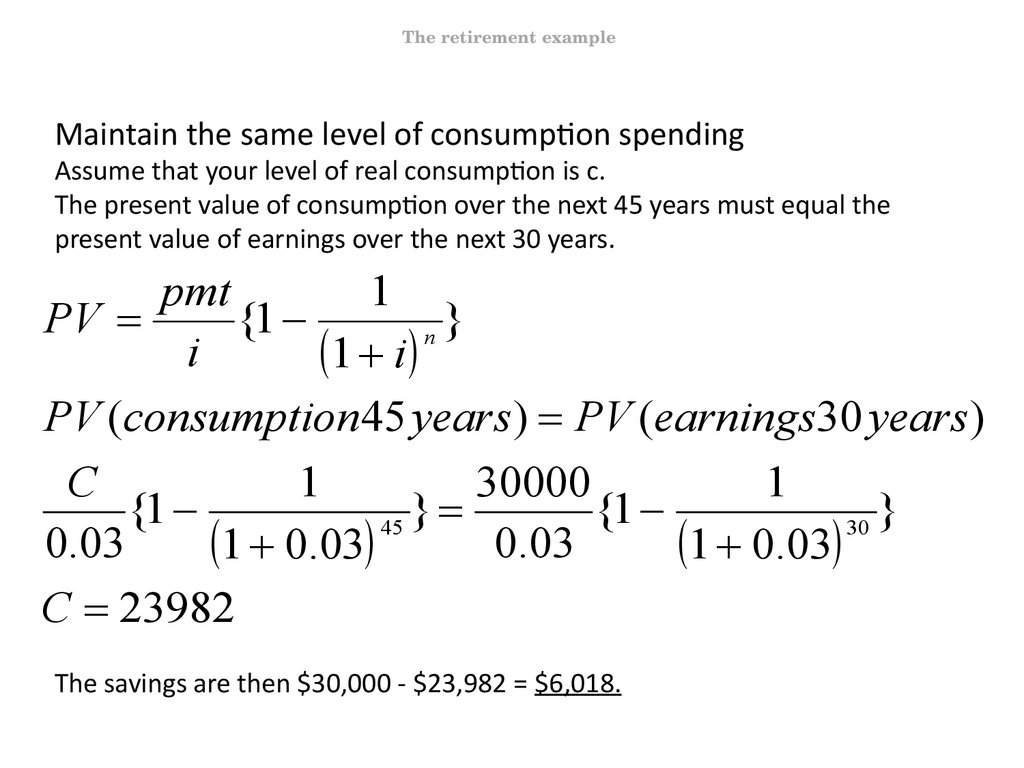
The retirement exampleMaintain the same level of consumption spending
Assume that your level of real consumption is c.
The present value of consumption over the next 45 years must equal the
present value of earnings over the next 30 years.
pmt
1
PV
{1
}
n
i
1 i
PV (consumption 45 years) PV (earnings30 years)
C
1
30000
1
{1
}
{1
}
45
30
0.03
0.03
1 0.03
1 0.03
C 23982
The savings are then $30,000 - $23,982 = $6,018.
92. 92. dia
InflationTaking care of inflation
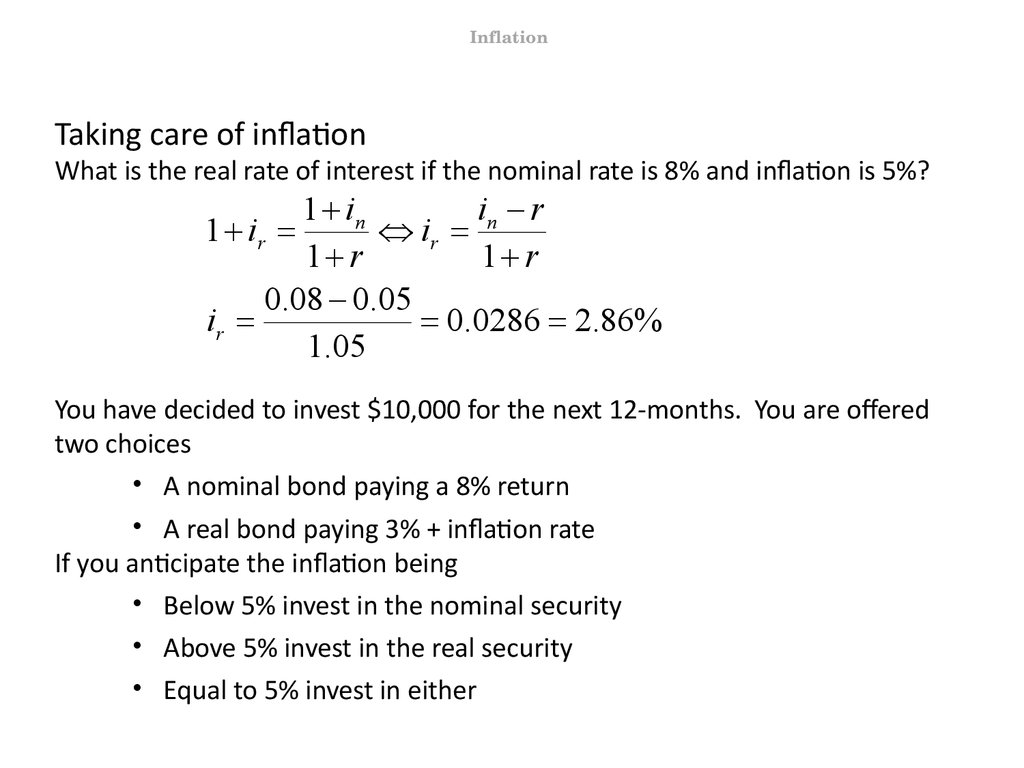
Generally, prices and rates are nominal, that is they are expressed in terms of
currency. But we are interested in real prices and interest rates, that are the
prices and rates expressed in terms of purchasing power. (I do not care really if
a kilo of bread costs $10 or $1, but I am interested how many breads I can buy
using my income.)
The relationship between nominal and real interest rates is the following:
(1 NominalRate) (1 RealRate) * (1 InflationRate)
NominalRate InflationRate
RealRate
1 InflationRate
We will use the notation
In the rate of interest in nominal terms
Ir the rate of interest in real terms
r the rate of inflation
93. 93. dia
InflationTaking care of inflation
What is the real rate of interest if the nominal rate is 8% and inflation is 5%?
1 in
in r
1 ir
ir
1 r
1 r
0.08 0.05
ir
0.0286 2.86%
1.05
You have decided to invest $10,000 for the next 12-months. You are offered
two choices
• A nominal bond paying a 8% return
• A real bond paying 3% + inflation rate
If you anticipate the inflation being
• Below 5% invest in the nominal security
• Above 5% invest in the real security
• Equal to 5% invest in either
94. 94. dia
Evaluating investment projectsEvaluating investment opportunities
We can use discounted cash flow analysis to make decisions such as:
• Whether to enter a new line of business
• Whether to invest in equipment to reduce costs
To evaluate investment projects we use the net present value (NPV) rule.
A project’s net present value is the amount by which the project is expected to
increase the wealth of the firm’s current shareholders.
The rule just says: Invest in proposed projects with positive NPV.
NPV = PV – required investment
The following tables show the computation of NPV. To show the affect of the
discount rate, three tables are shown based on different rates
95. 95. dia
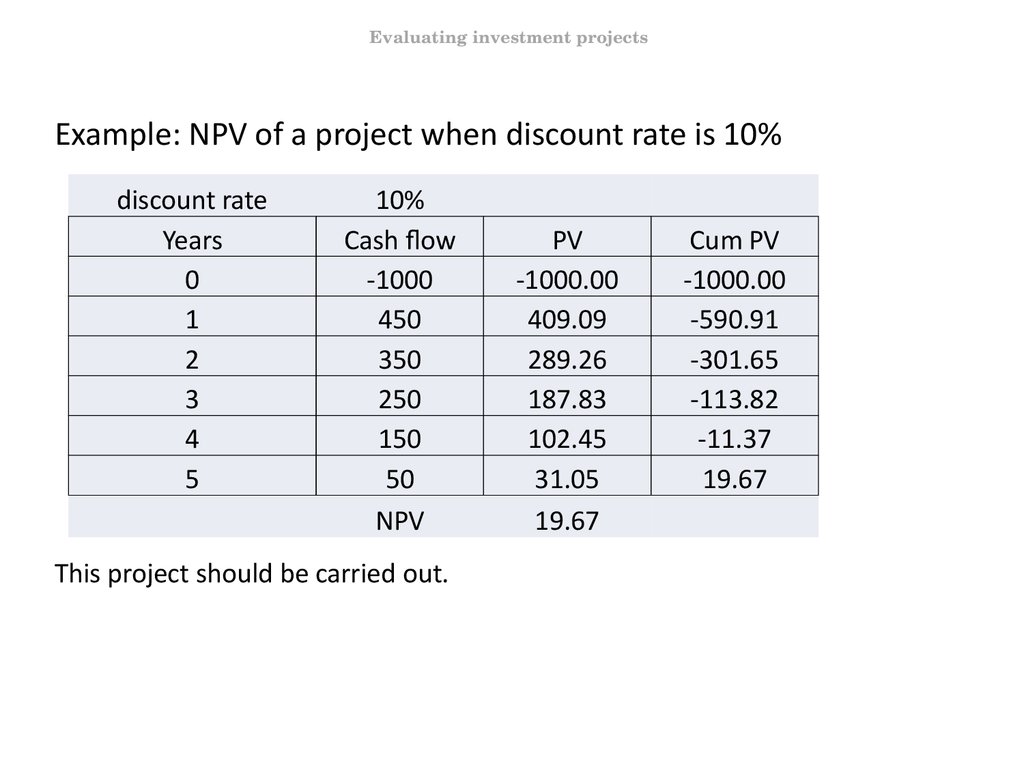
Evaluating investment projectsExample: NPV of a project when discount rate is 10%
discount rate
Years
0
1
2
3
4
5
10%
Cash flow
-1000
450
350
250
150
50
NPV
This project should be carried out.
PV
-1000.00
409.09
289.26
187.83
102.45
31.05
19.67
Cum PV
-1000.00
-590.91
-301.65
-113.82
-11.37
19.67
96. 96. dia
Evaluating investment projectsExample: NPV of a project when discount rate is 15%
We consider the same project, but with a different discount rate. (We may
consider the cash flows more risky and expect a higher rate of return.)
discount rate
15%
Years
Cash flow
PV
Cum PV
0
-1000
-1000.00
-1000.00
1
450
391.30
-608.70
2
350
264.65
-344.05
3
250
164.38
-179.67
4
150
85.76
-93.90
5
50
24.86
-69.04
NPV
-69.04
The project should not be carried out.
97. 97. dia
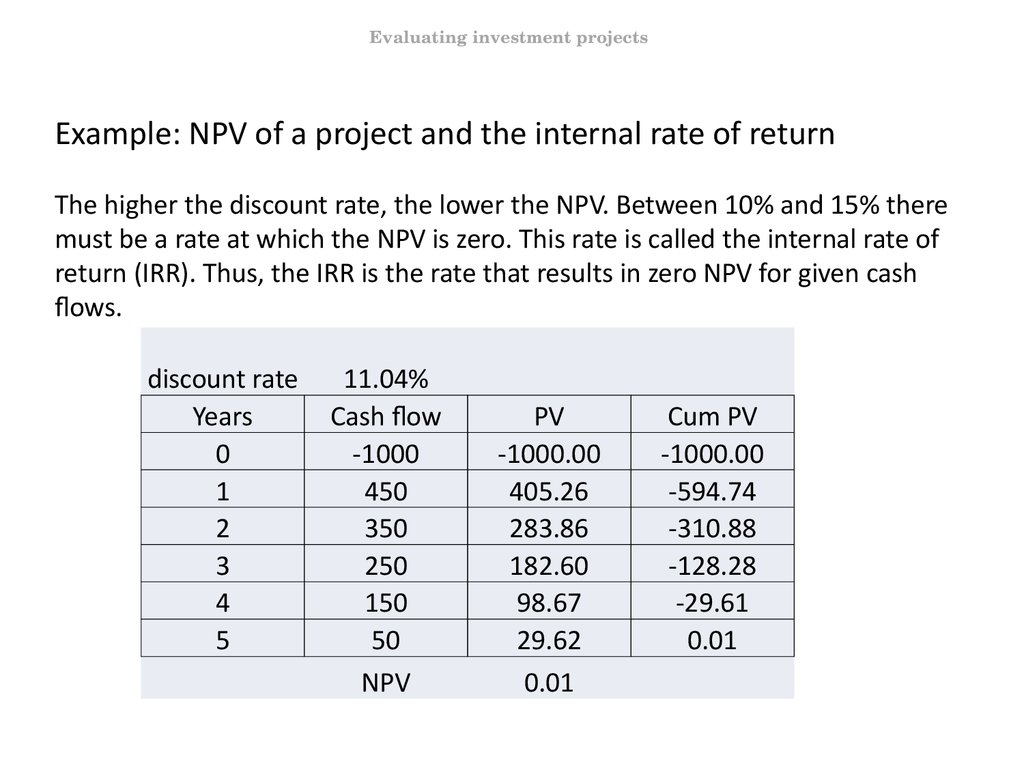
Evaluating investment projectsExample: NPV of a project and the internal rate of return
The higher the discount rate, the lower the NPV. Between 10% and 15% there
must be a rate at which the NPV is zero. This rate is called the internal rate of
return (IRR). Thus, the IRR is the rate that results in zero NPV for given cash
flows.
discount rate
Years
0
1
2
3
4
5
11.04%
Cash flow
-1000
450
350
250
150
50
NPV
PV
-1000.00
405.26
283.86
182.60
98.67
29.62
0.01
Cum PV
-1000.00
-594.74
-310.88
-128.28
-29.61
0.01
98. 98. dia
Evaluating investment projectsNPV and the internal rate of return
From the previous example we can conclude the following:
If the discount rate used to evaluate a project is lower than the IRR, then it has
a positive NPV and should be carried out.
If the discount rate used to evaluate a project is higher than the IRR, then it
has a negative NPV and should not be carried out.
But what is the proper discount rate? You should consider what else you
could do with your money. It is often called the opportunity cost of capital,
because it is the return that is being given up by investing in the project.
Importantly, discount rates also take into account risk. It is still proper to
discount the payoff by the rate of return offered by a comparable investment.
99. 99. dia
Evaluating investment projectsExample (taken from Brealey-Myers):
Obsolete Technologies is considering the purchase of a new computer system
to help handle its warehouse inventories. The system costs $50,000, is
expected to last 4 years, and should reduce the cost of managing inventories
by $22,000 a year. The opportunity cost of capital is 10 percent. Should
Obsolete go ahead?
Note that the computer system does not generate any sales, but if the
expected cost savings are realized, the company’s cash flows will be $22,000 a
year higher as a result of buying the computer. Thus we can say that the
computer increases cash flows by $22,000 a year for each of 4 years.
To calculate present value, we can simply discount each of these cash flows by
10 percent. However, it is smarter to recognize that the cash flows are level
and therefore you can use the annuity formula to calculate the present value:
100. 100. dia
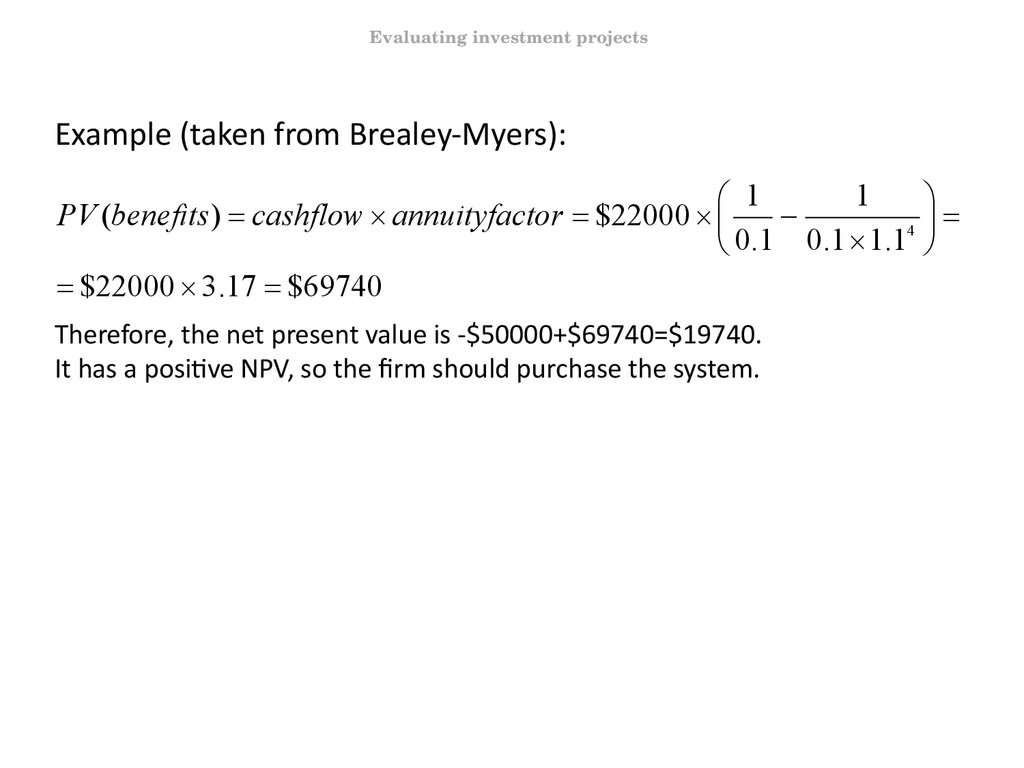
Evaluating investment projectsExample (taken from Brealey-Myers):
1
1
PV (benefits ) cashflow annuityfactor $22000
4
0.1 0.1 1.1
$22000 3.17 $69740
Therefore, the net present value is -$50000+$69740=$19740.
It has a positive NPV, so the firm should purchase the system.
101. 101. dia
Evaluating investment projectsMutually exclusive projects
We speak about mutually exclusive projects if there are two or more projects
that cannot be pursued simultaneously. Examples:
• You could build an apartment block on a vacant site or build an office block.
• You could build a 5-story office block or a 50-story one.
• You could heat it with oil or with natural gas.
• You could build it today, or wait a year to start construction.
When you have to choose between mutually exclusive projects, then calculate
the NPV of each project and choose the one whose NPV is highest.
102. 102. dia
Evaluating investment projectsMutually exclusive projects - example
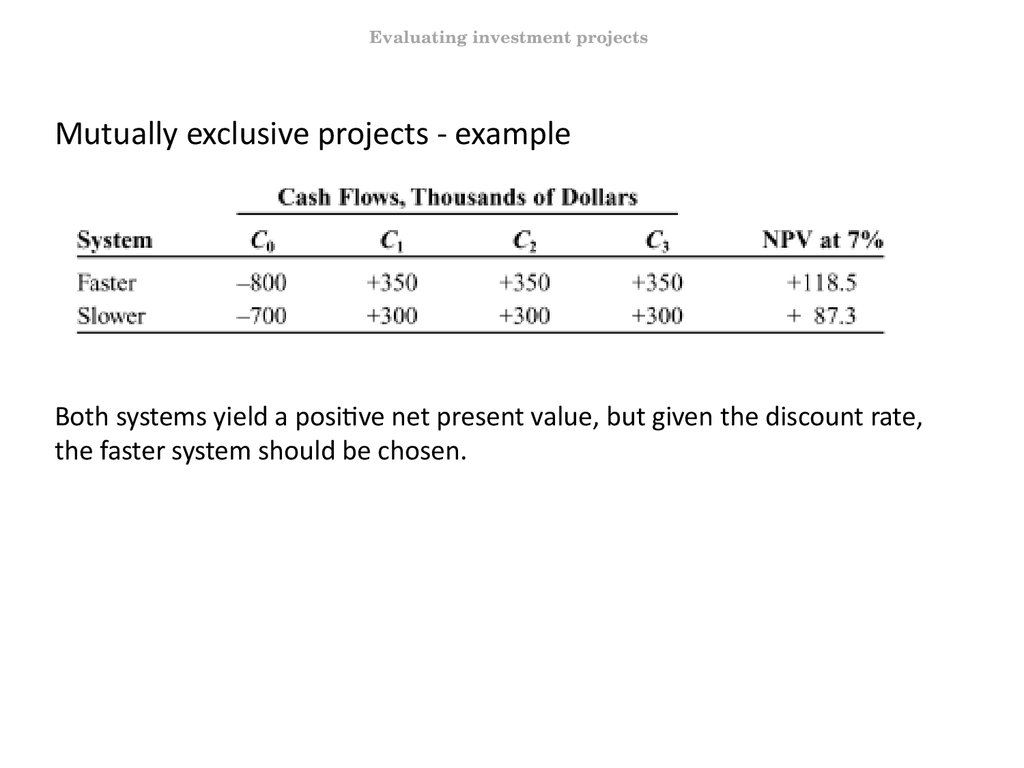
You are offered two competing softwares to use in your firm to manage
orders. Both have an expected useful life of 3 years, at which point it will be
time for another upgrade. One proposal is for an expensive cutting-edge
system, which will cost $800,000 and increase firm cash flows by $350,000 a
year through increased productivity. The other proposal is for a cheaper,
somewhat slower sy








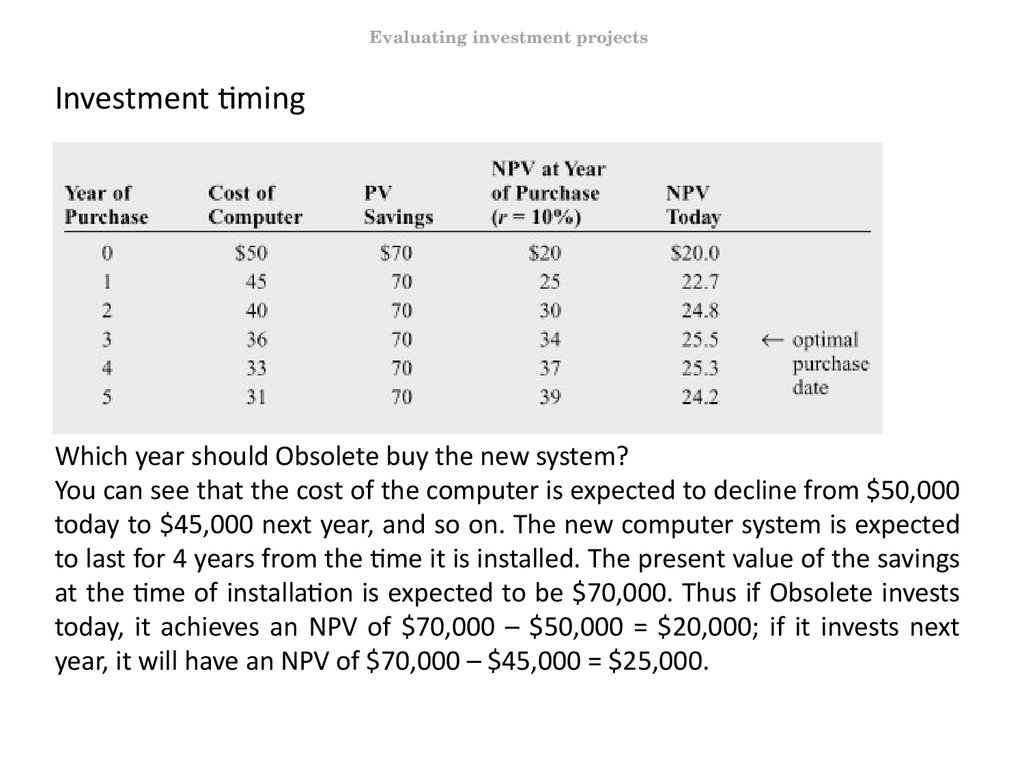


 Финансы
 Английский язык


