

 Образование
Похожие презентации:


Data and data representation (lecture 1)
1.
2.
Module Aims:• To foster in students confidence to cope with the processing
and analyzing of quantitative information.
• To provide an appreciation of numerical and statistical concepts
relevant to the business environment.
3.
Learning outcomes:• apply numerical skills to business and/or engineering problems
• present statistical data in a variety of formats, including
electronic means
• apply basic rules of algebra and calculus
• using spreadsheets summarize numerical data into averages
and deviations and apply them to a variety of business
problems.
4.
In brief, you will learn how ...:• To appreciate benefit of numerical data for businesses
• To make decisions based on the numerical data
• To interpret and represent numerical data in a most appropriate
way depending on your aims
• To solve statistics and calculus problems using various
quantitative methods
• Note: You can find out more about module content in module
syllabus and 12-week teaching schedule.
5.
Teaching methods:• 1-hour online lecture each week (online)
• 2-hour tutorial each week (offline)
• 1-hour workshop each week (offline)
You will learn the theory and its application
6.
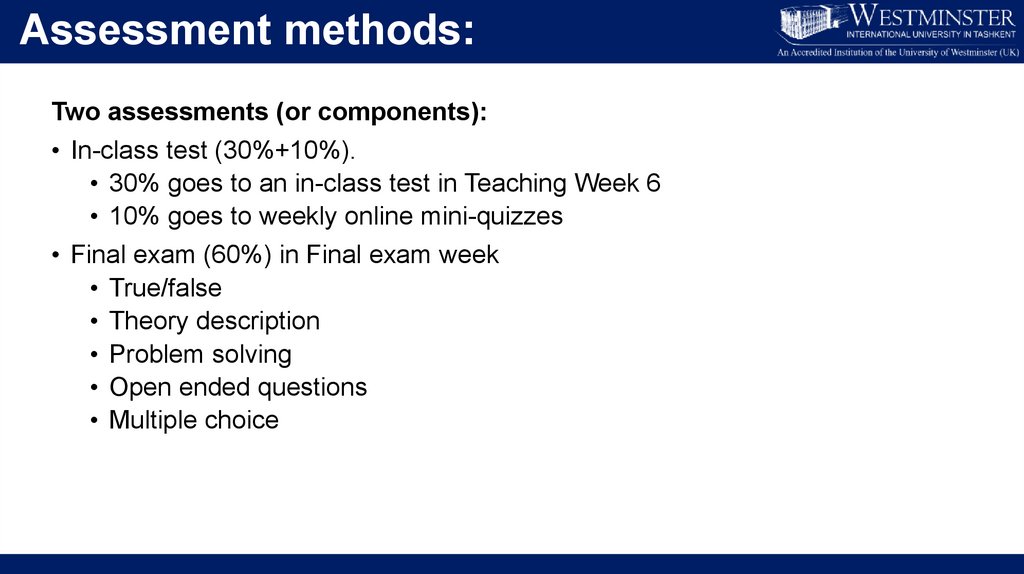
Assessment methods:Two assessments (or components):
• In-class test (30%+10%).
• 30% goes to an in-class test in Teaching Week 6
• 10% goes to weekly online mini-quizzes
• Final exam (60%) in Final exam week
• True/false
• Theory description
• Problem solving
• Open ended questions
• Multiple choice
7.
LECTURE 1DATA & DATA REPRESENTATION
Temur Makhkamov
Indira Khadjieva
QM Module Leaders
tmakhkamov@wiut.uz
i.khadjieva@wiut.uz
Office hours: by appointment
Room IB 205
EXT: 546
8.
Lecture outlineDATA
the meaning and types of data
sources of data
the scales of measurements for data
DATA REPRESENTATION TECHNIQUES AND TOOLS
analyze the quantitative and qualitative data;
display data in the form of table;
display data in the form of graph.
9.
What is data? (1)• Data –
• the facts and figures that are collected, analyzed and summarized.
Examples: data about people, countries, employees
nature, universities, number of products sold, costs, prices,
movies, cars, hospitals, registration numbers, tax codes etc
10.
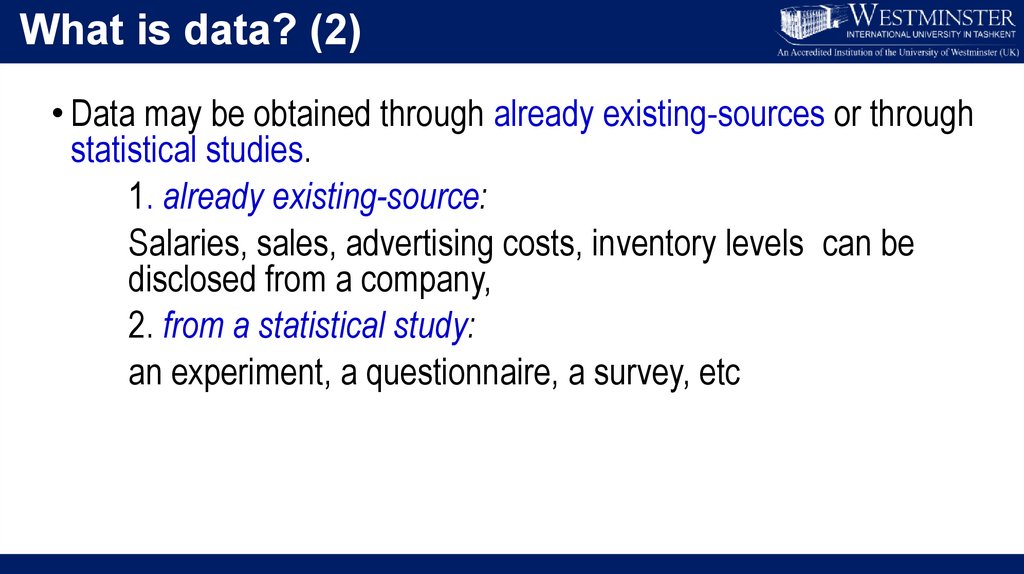
What is data? (2)• Data may be obtained through already existing-sources or through
statistical studies.
1. already existing-source:
Salaries, sales, advertising costs, inventory levels can be
disclosed from a company,
2. from a statistical study:
an experiment, a questionnaire, a survey, etc
11.
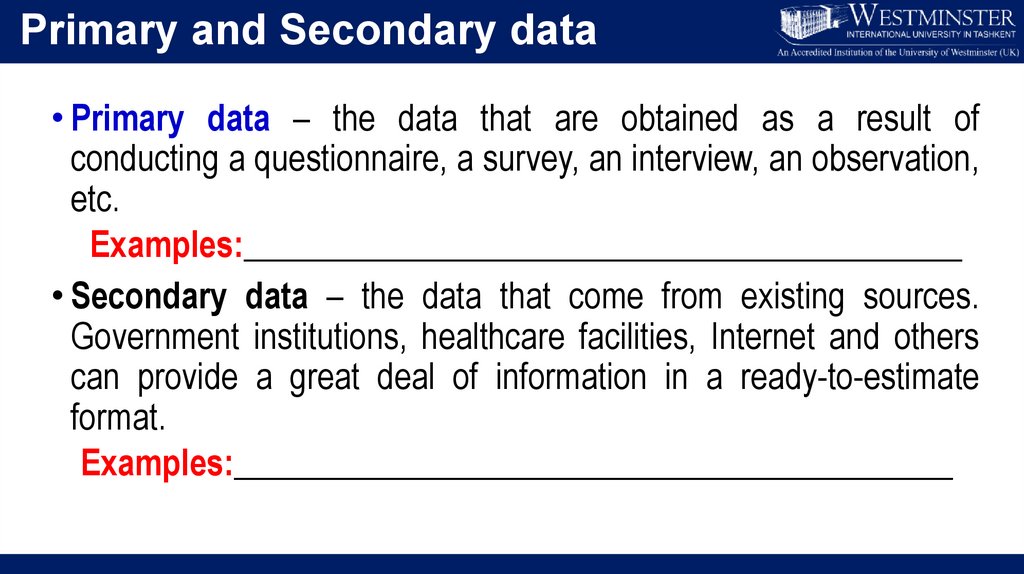
Primary and Secondary data• Primary data – the data that are obtained as a result of
conducting a questionnaire, a survey, an interview, an observation,
etc.
Examples:__________________________________________
• Secondary data – the data that come from existing sources.
Government institutions, healthcare facilities, Internet and others
can provide a great deal of information in a ready-to-estimate
format.
Examples:__________________________________________
12.
Questions:What data is more costly (expensive):
primary or secondary?
What data is more reliable (trustworthy):
primary or secondary?
13.
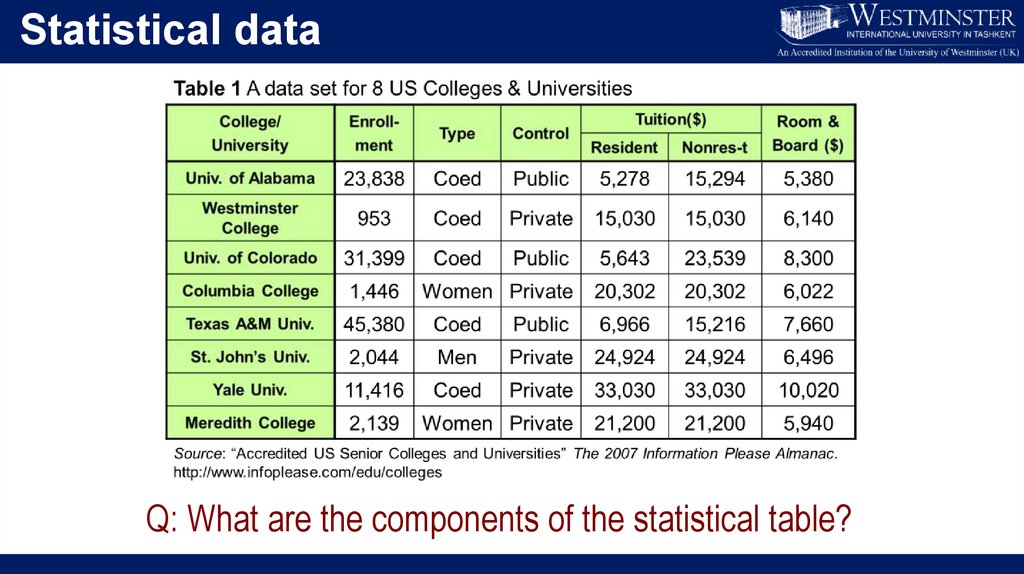
Statistical dataQ: What are the components of the statistical table?
14.
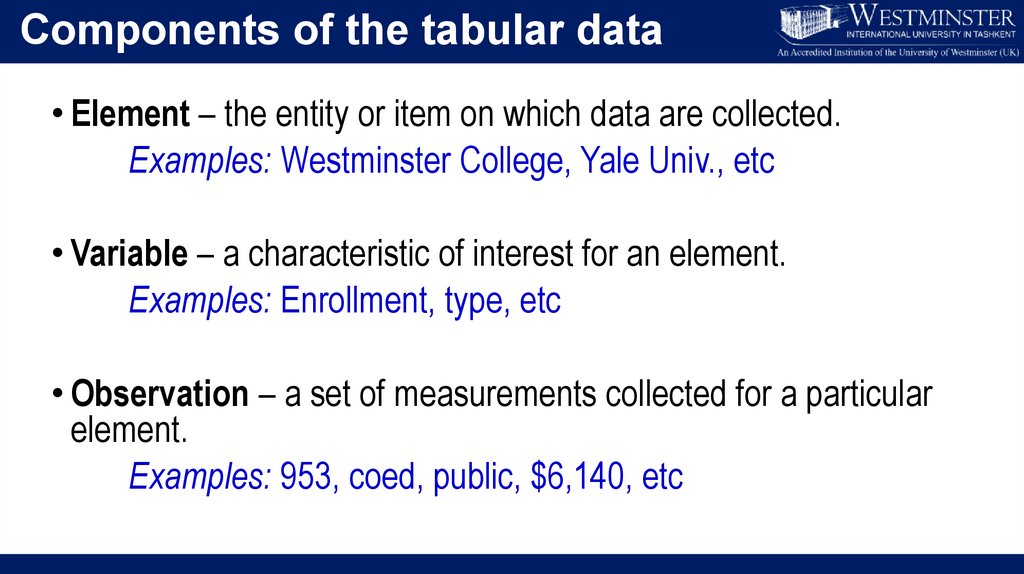
Components of the tabular data• Element – the entity or item on which data are collected.
Examples: Westminster College, Yale Univ., etc
• Variable – a characteristic of interest for an element.
Examples: Enrollment, type, etc
• Observation – a set of measurements collected for a particular
element.
Examples: 953, coed, public, $6,140, etc
15.
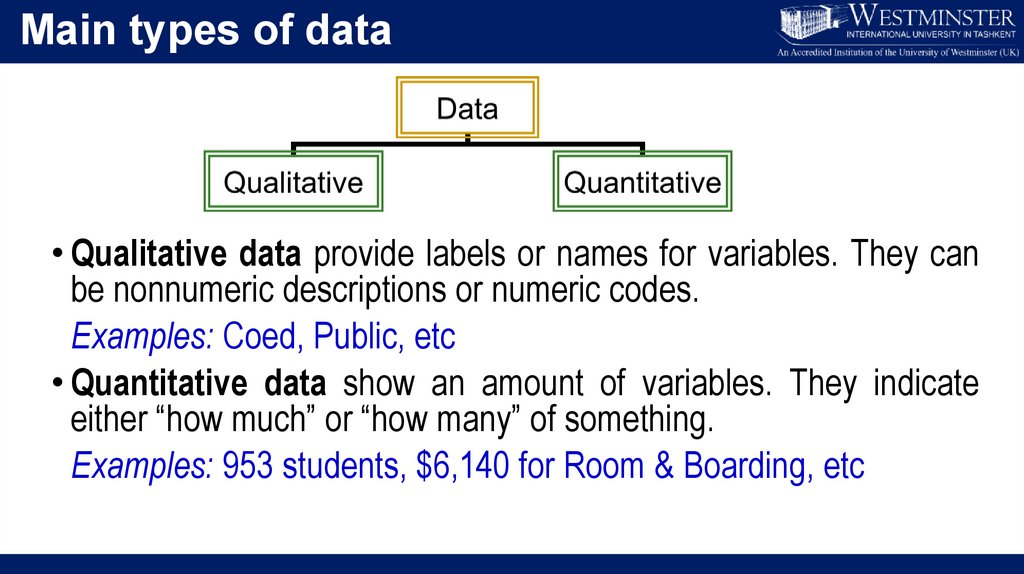
Main types of data• Qualitative data provide labels or names for variables. They can
be nonnumeric descriptions or numeric codes.
Examples: Coed, Public, etc
• Quantitative data show an amount of variables. They indicate
either “how much” or “how many” of something.
Examples: 953 students, $6,140 for Room & Boarding, etc
16.
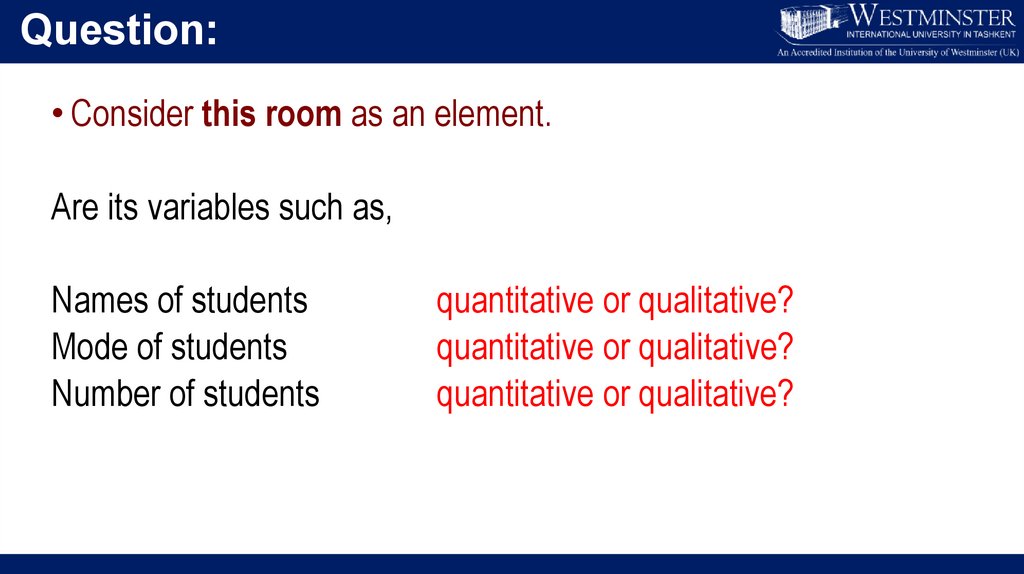
Question:• Consider this room as an element.
Are its variables such as,
Names of students
Mode of students
Number of students
quantitative or qualitative?
quantitative or qualitative?
quantitative or qualitative?
17.
Quantitative DataQuantitative
Data
Discrete
Continuous
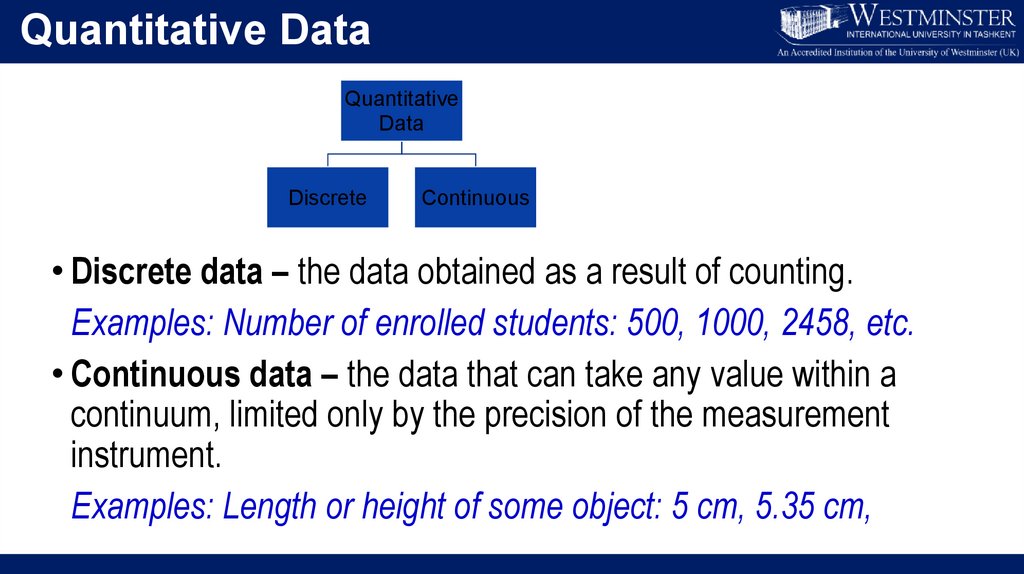
• Discrete data – the data obtained as a result of counting.
Examples: Number of enrolled students: 500, 1000, 2458, etc.
• Continuous data – the data that can take any value within a
continuum, limited only by the precision of the measurement
instrument.
Examples: Length or height of some object: 5 cm, 5.35 cm,
18.
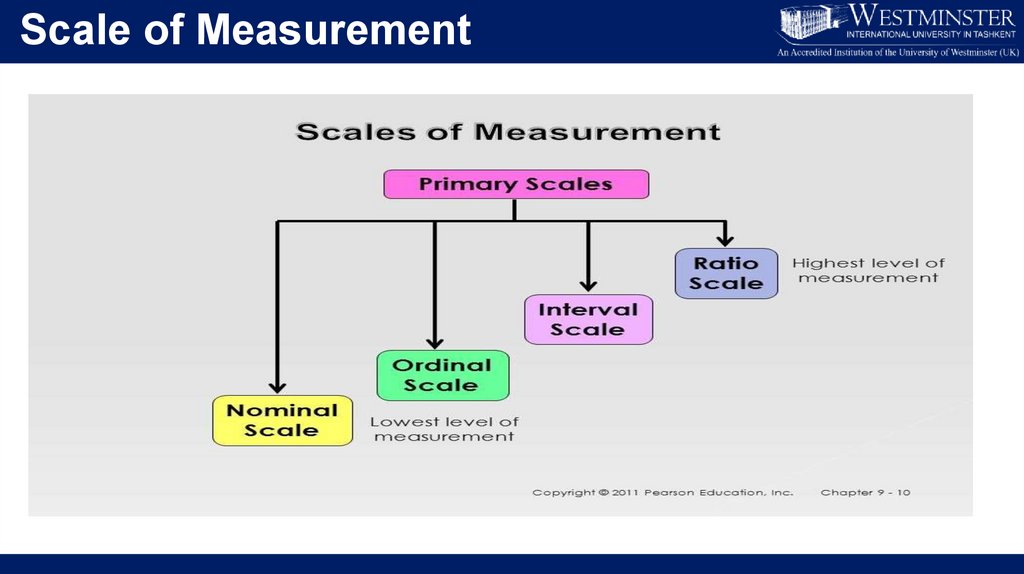
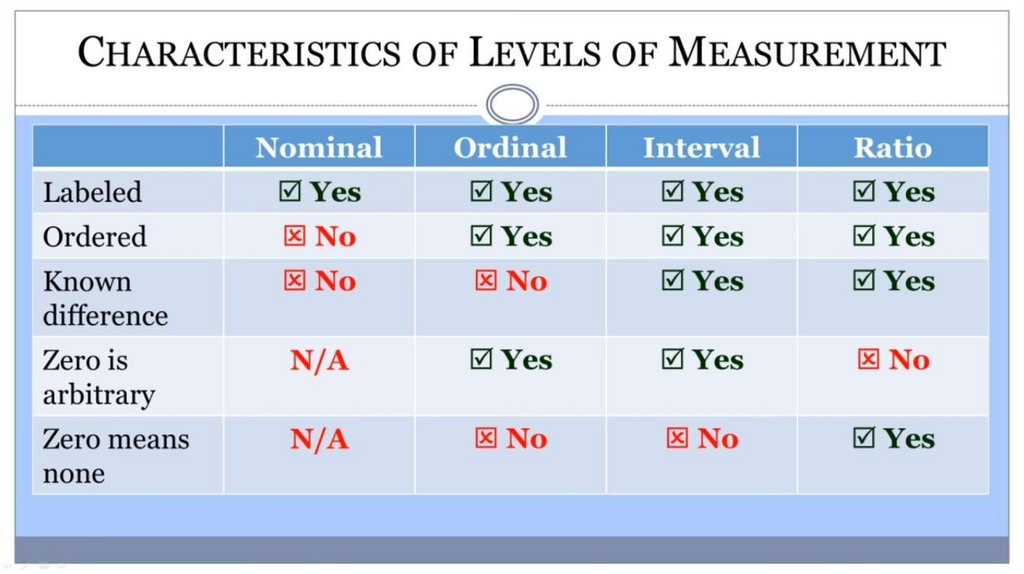
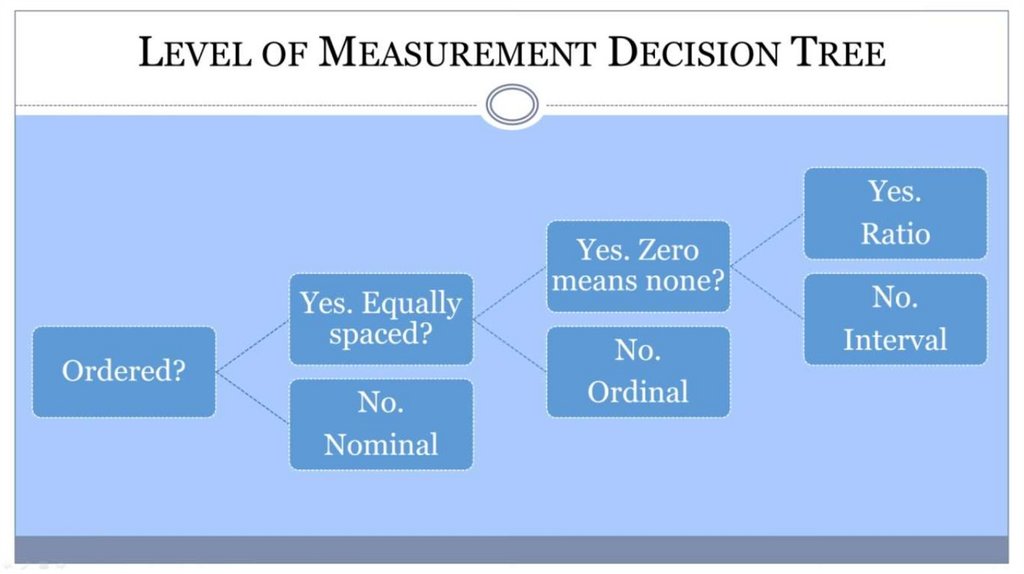
Scale of Measurement19.
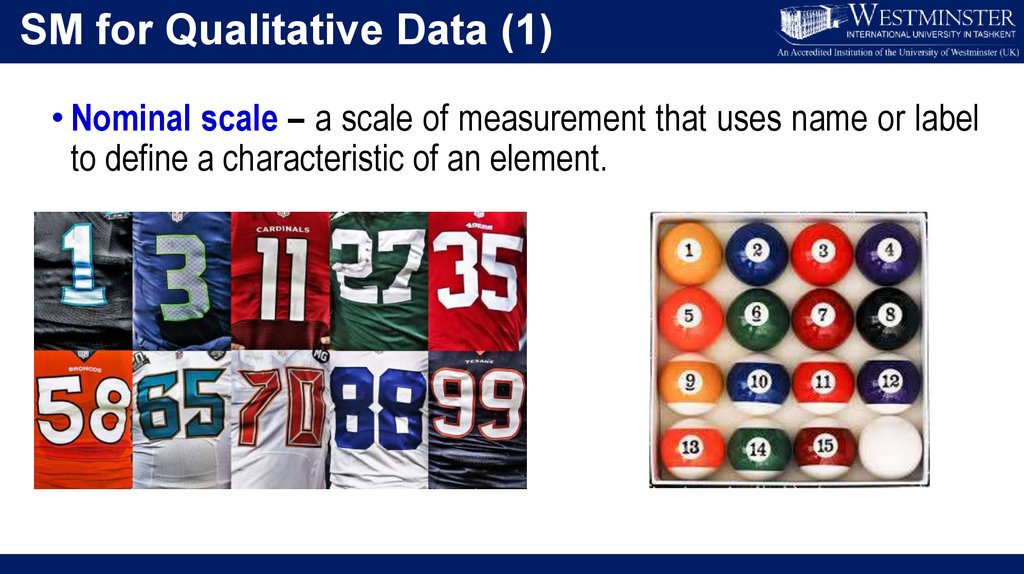
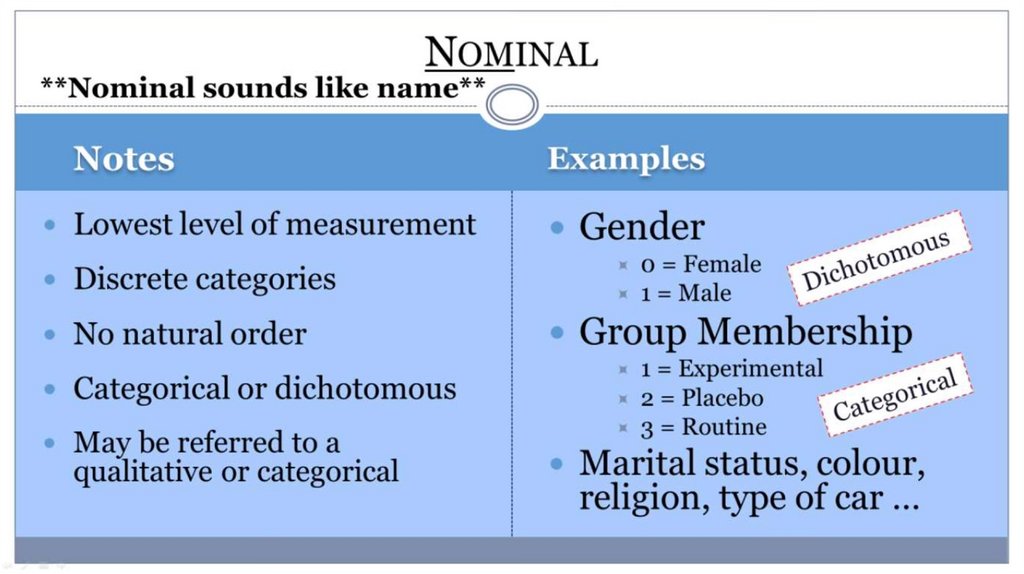
SM for Qualitative Data (1)• Nominal scale – a scale of measurement that uses name or label
to define a characteristic of an element.
20.
21.
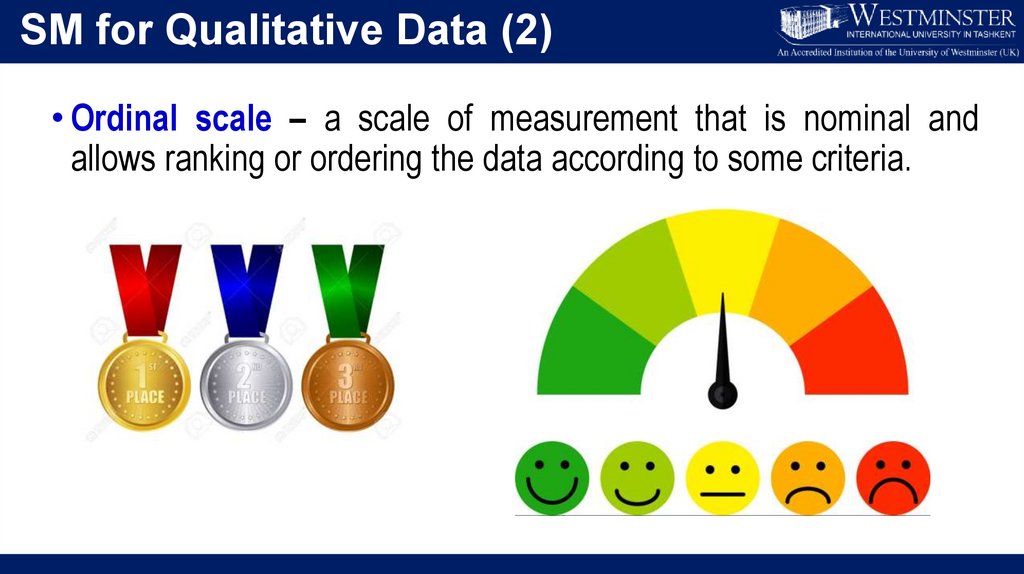
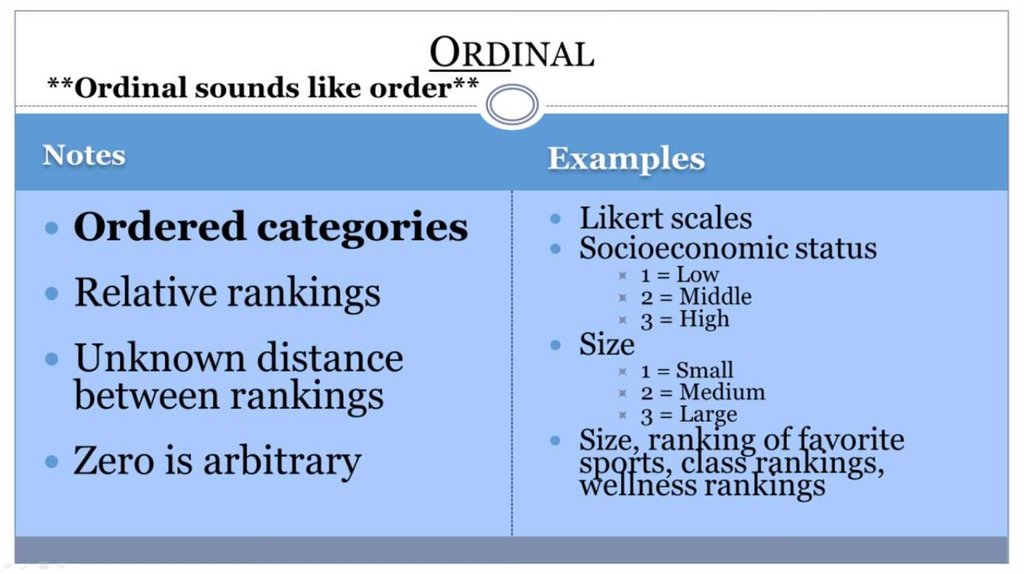
SM for Qualitative Data (2)• Ordinal scale – a scale of measurement that is nominal and
allows ranking or ordering the data according to some criteria.
22.
23.
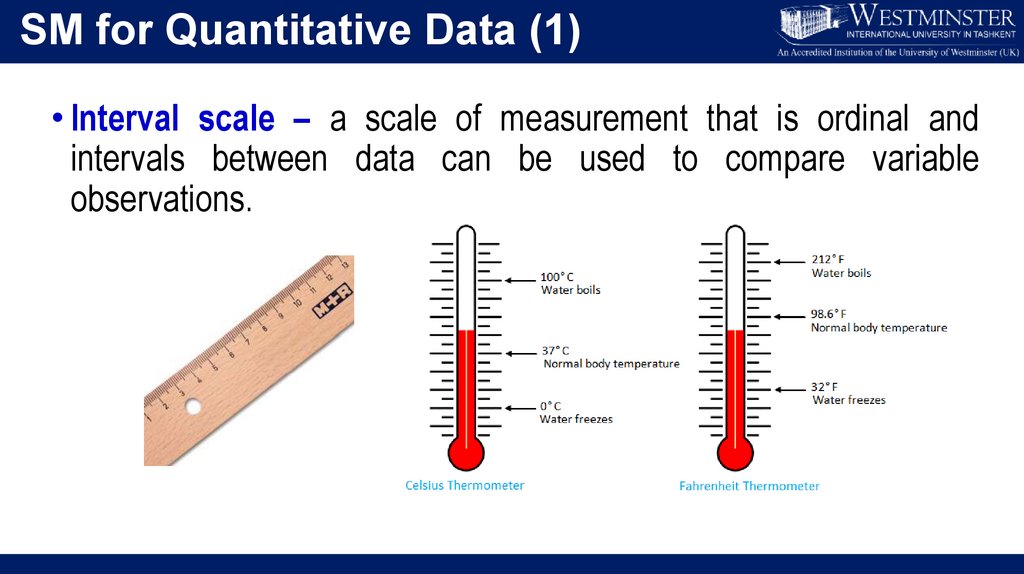
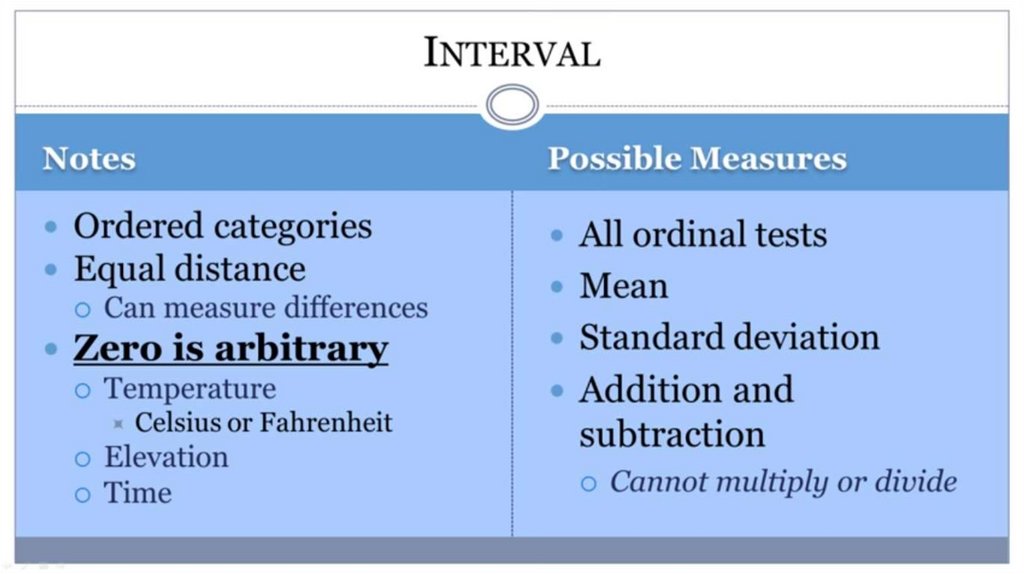
SM for Quantitative Data (1)• Interval scale – a scale of measurement that is ordinal and
intervals between data can be used to compare variable
observations.
24.
25.
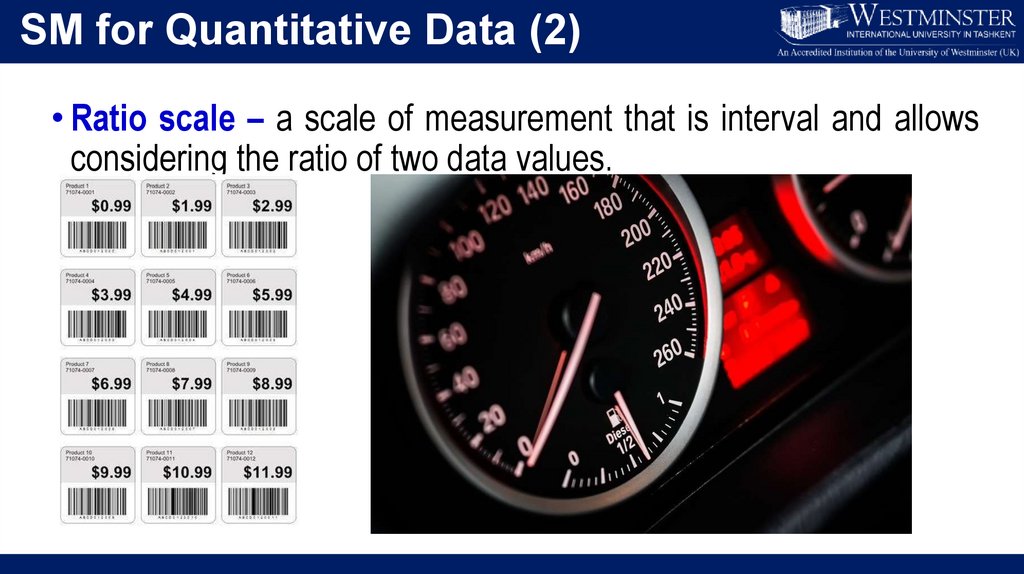
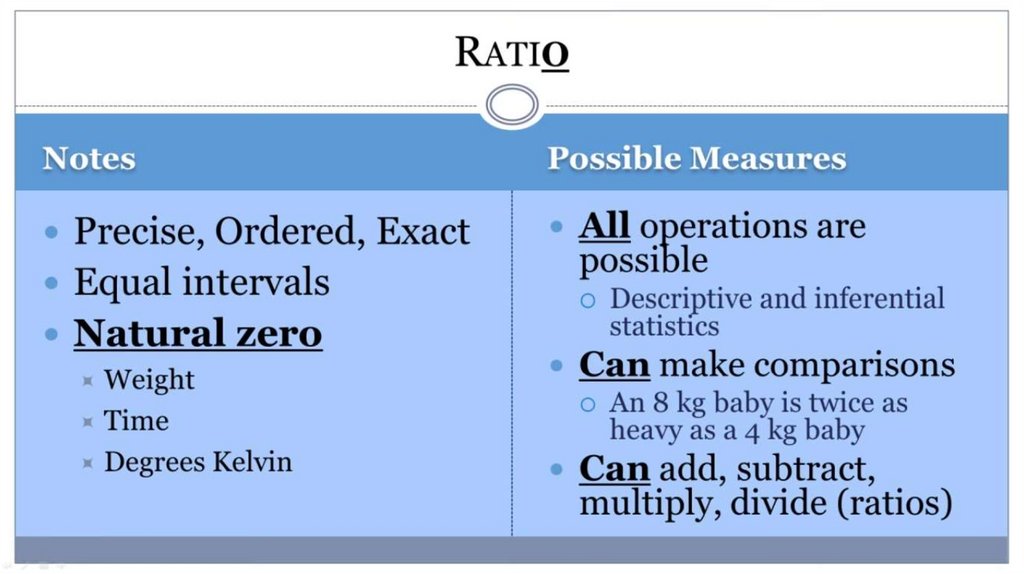
SM for Quantitative Data (2)• Ratio scale – a scale of measurement that is interval and allows
considering the ratio of two data values.
26.
27.
28.
29.
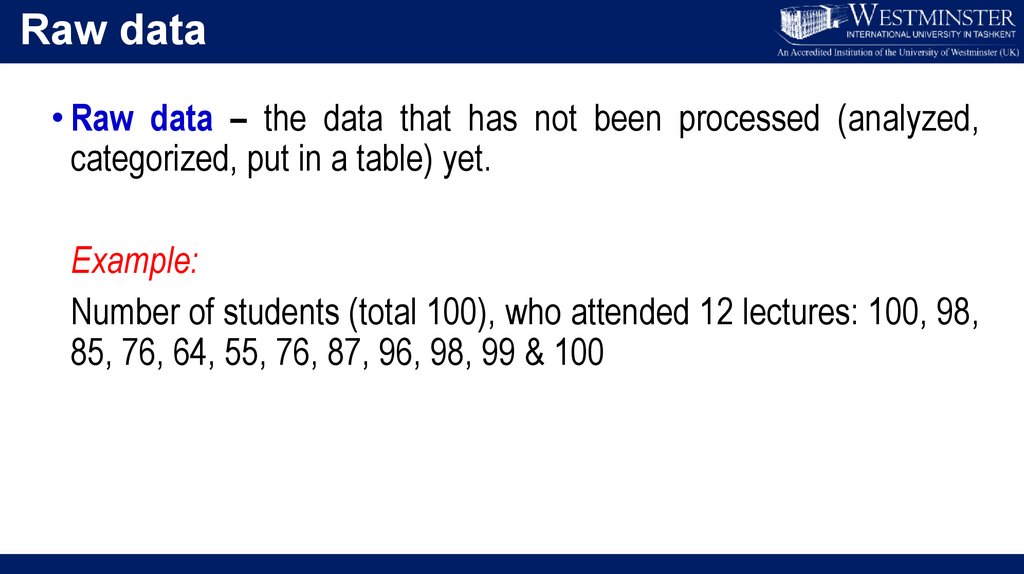
Raw data• Raw data – the data that has not been processed (analyzed,
categorized, put in a table) yet.
Example:
Number of students (total 100), who attended 12 lectures: 100, 98,
85, 76, 64, 55, 76, 87, 96, 98, 99 & 100
30.
Aggregate data• Aggregate data – the data that has already been processed to
serve one’s goal.
Example:
On four lectures, the attendance of students was lower than 80
and on other eight lectures it was greater or equal to 80.
(the raw data above have been analyzed).
31.
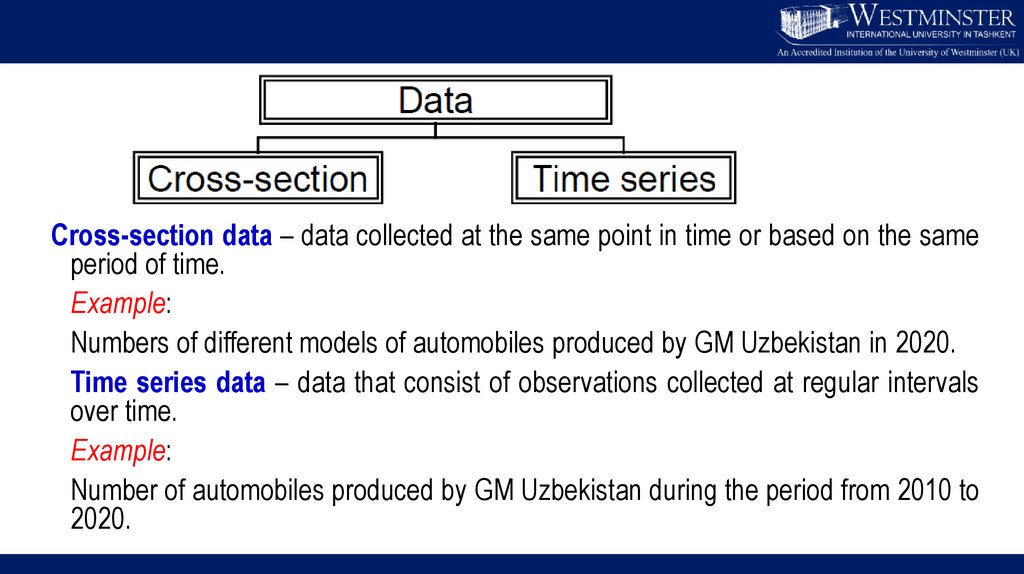
Cross-section data – data collected at the same point in time or based on the sameperiod of time.
Example:
Numbers of different models of automobiles produced by GM Uzbekistan in 2020.
Time series data – data that consist of observations collected at regular intervals
over time.
Example:
Number of automobiles produced by GM Uzbekistan during the period from 2010 to
2020.
32.
Population and Sample• Population – a collection of all elements of interest in a particular
study.
• Sample – a subset of the population
Example:
All University students vs CIFS students
CIFS students vs 3CIFS1 group
Note: Data about a large group of elements are difficult
to collect due to various restrictions,
therefore only a small part of the group is considered.
33.
Part 2. Data representationPART II. Data representation tools and
techniques
34.
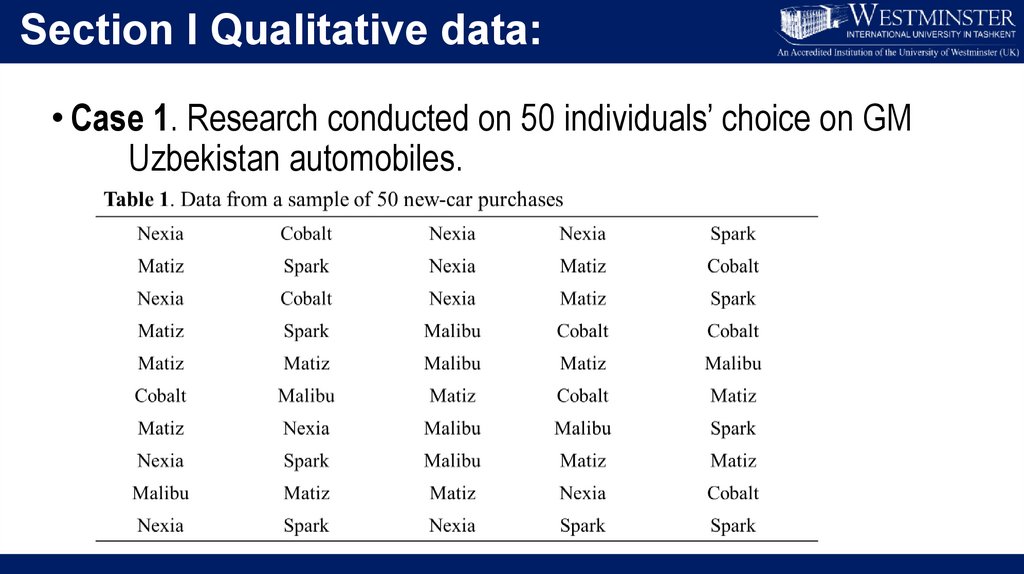
Section I Qualitative data:• Case 1. Research conducted on 50 individuals’ choice on GM
Uzbekistan automobiles.
35.
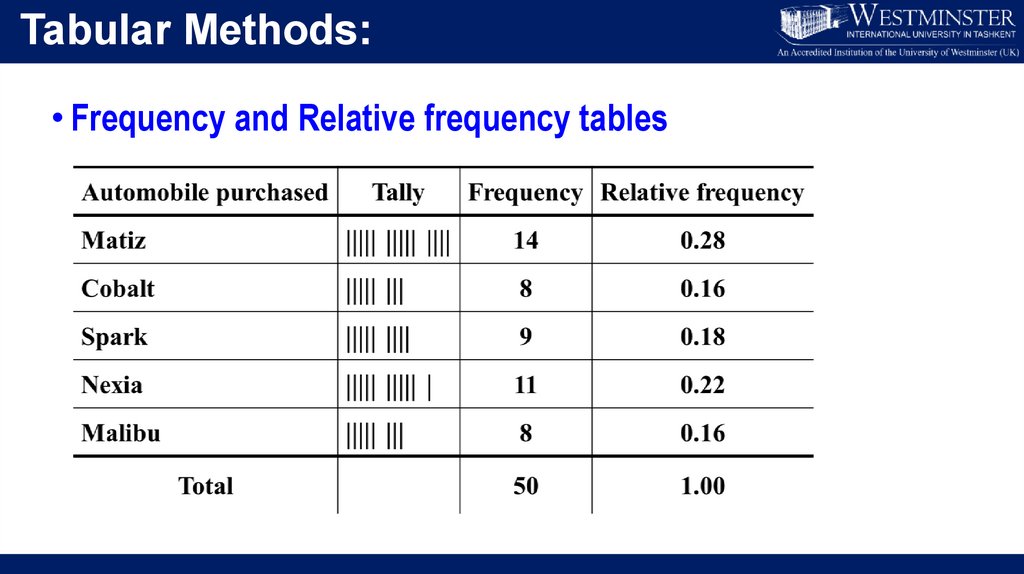
Tabular Methods:• Frequency and Relative frequency tables
36.
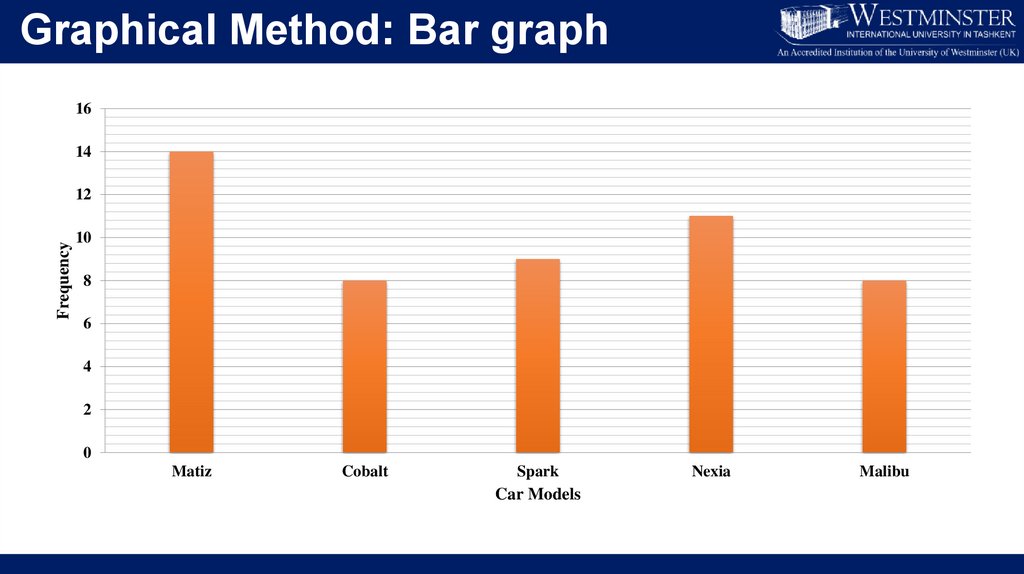
Graphical Method: Bar graph16
14
Frequency
12
10
8
6
4
2
0
Matiz
Cobalt
Spark
Car Models
Nexia
Malibu
37.
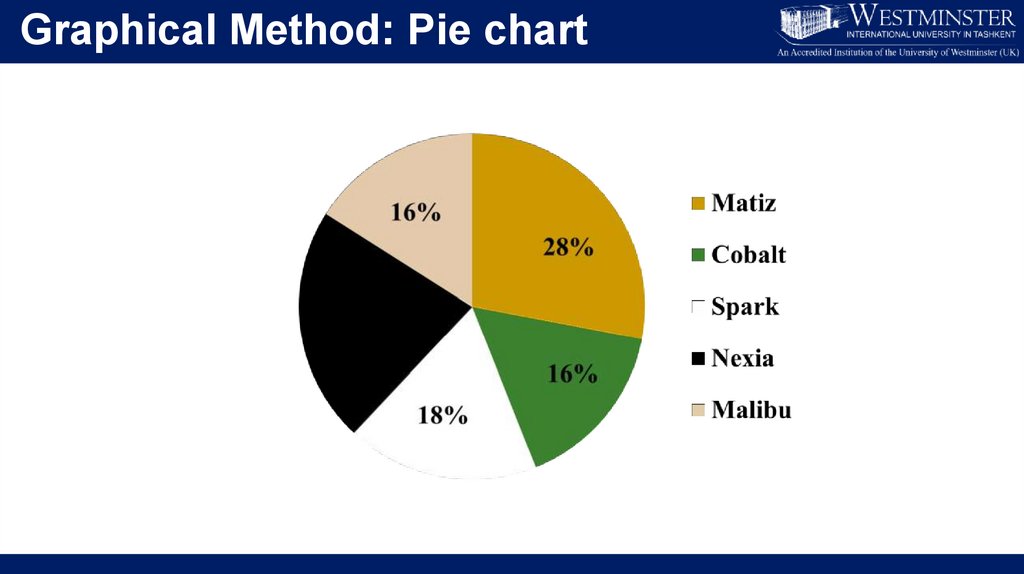
Graphical Method: Pie chart38.
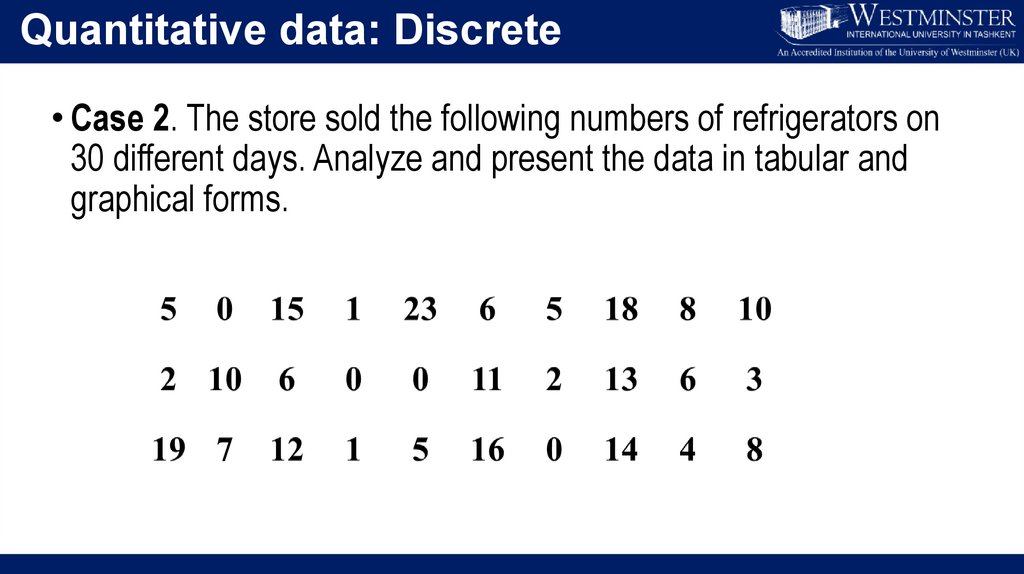
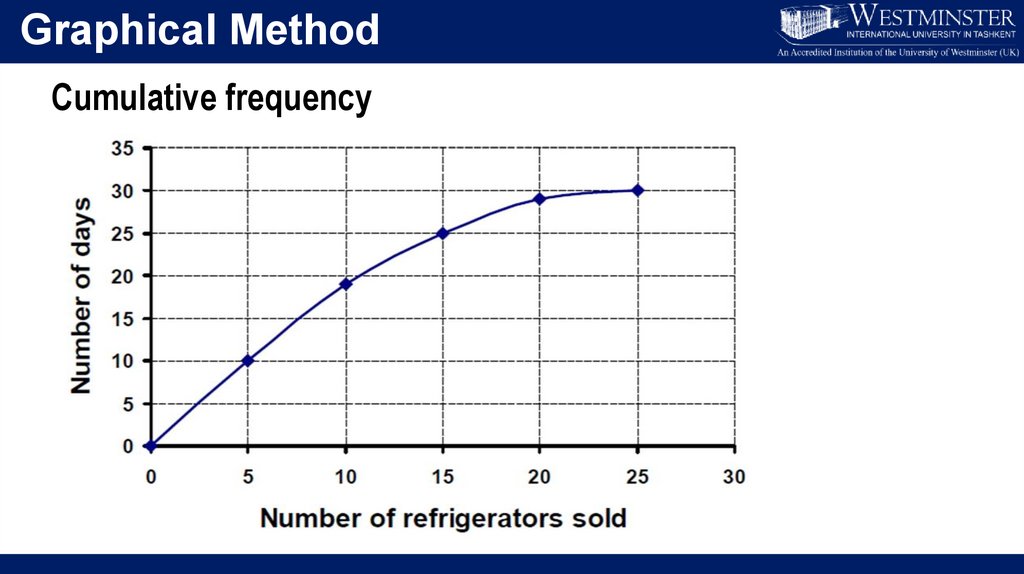
Quantitative data: Discrete• Case 2. The store sold the following numbers of refrigerators on
30 different days. Analyze and present the data in tabular and
graphical forms.
39.
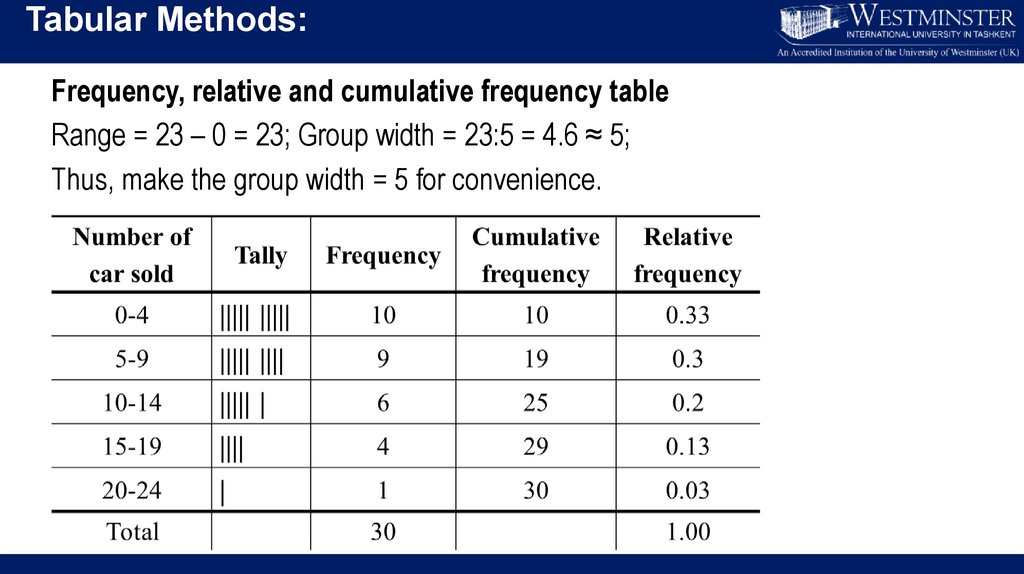
Tabular Methods:Frequency, relative and cumulative frequency table
Range = 23 – 0 = 23; Group width = 23:5 = 4.6 ≈ 5;
Thus, make the group width = 5 for convenience.
40.
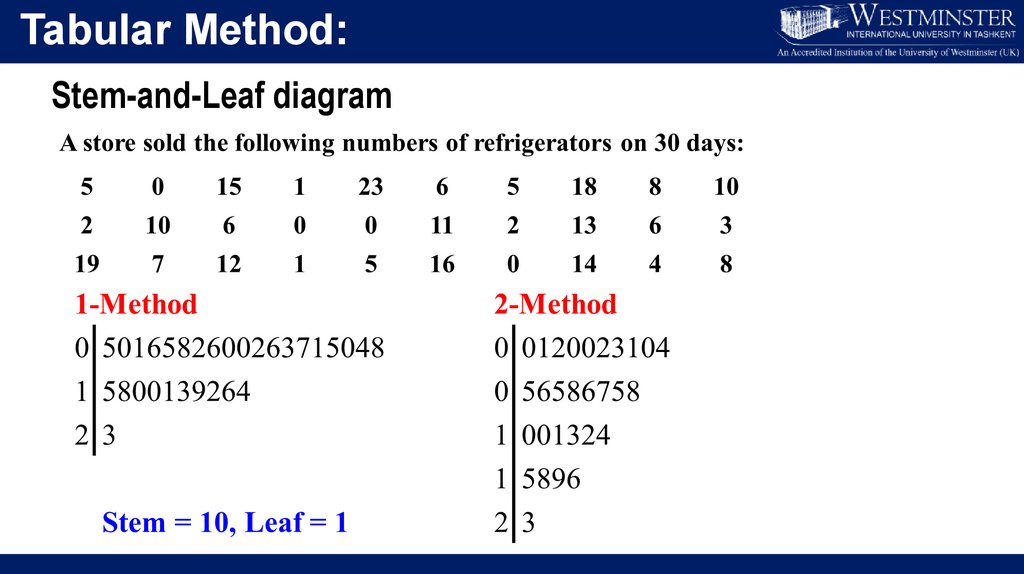
Tabular Method:Stem-and-Leaf diagram
41.
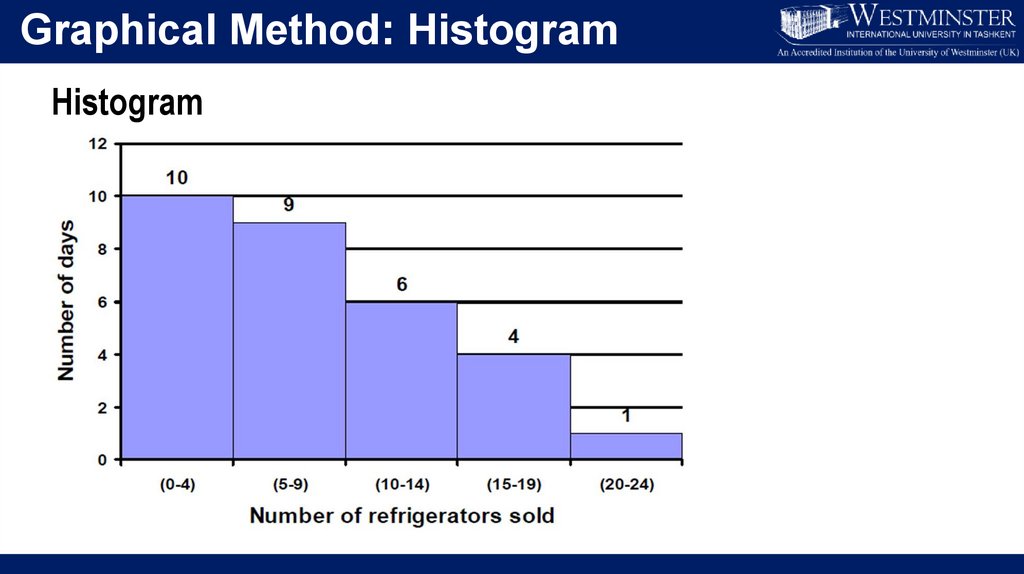
Graphical Method: HistogramHistogram
42.
Graphical MethodCumulative frequency
43.
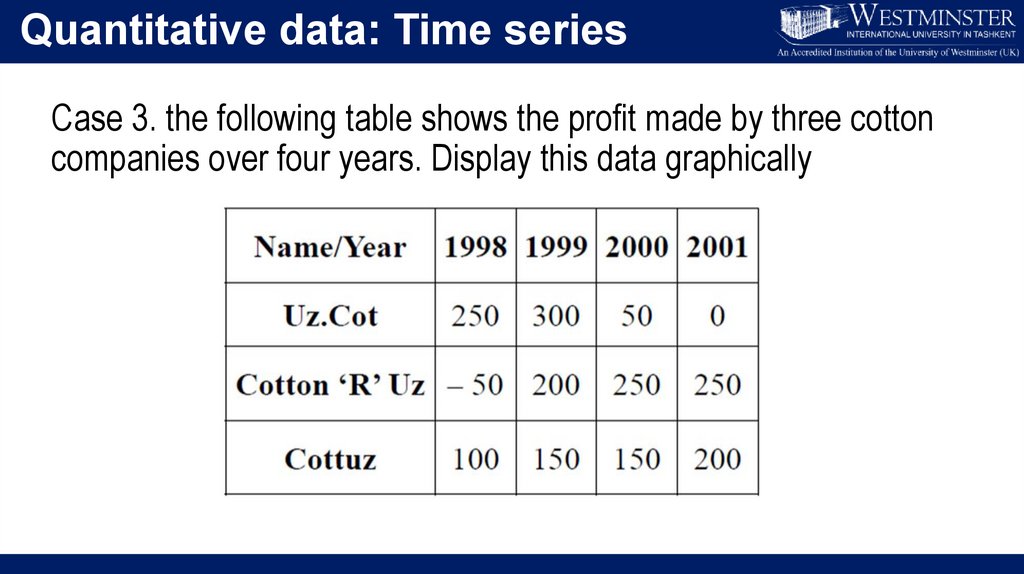
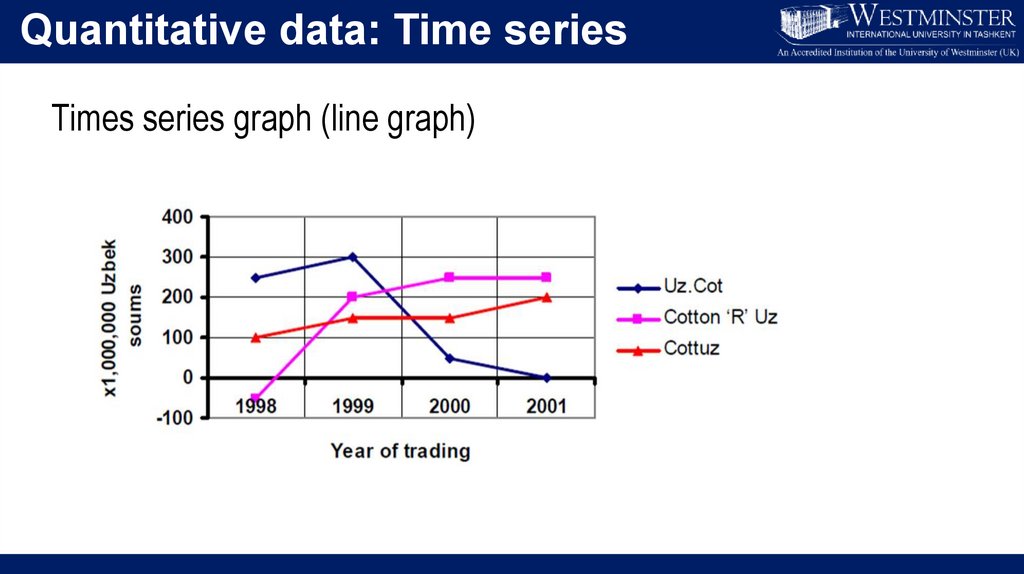
Quantitative data: Time seriesCase 3. the following table shows the profit made by three cotton
companies over four years. Display this data graphically
44.
Quantitative data: Time seriesTimes series graph (line graph)
45.
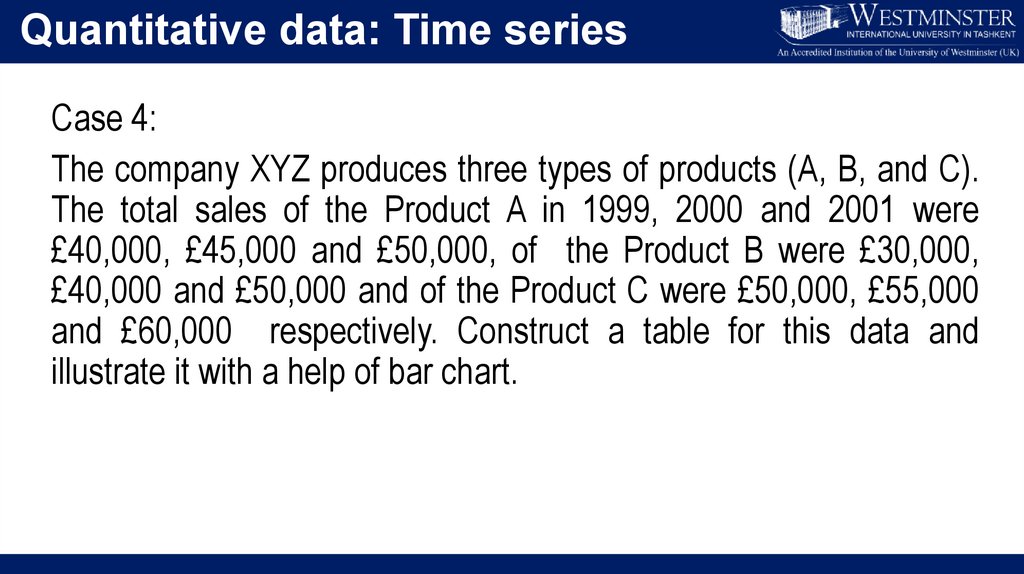
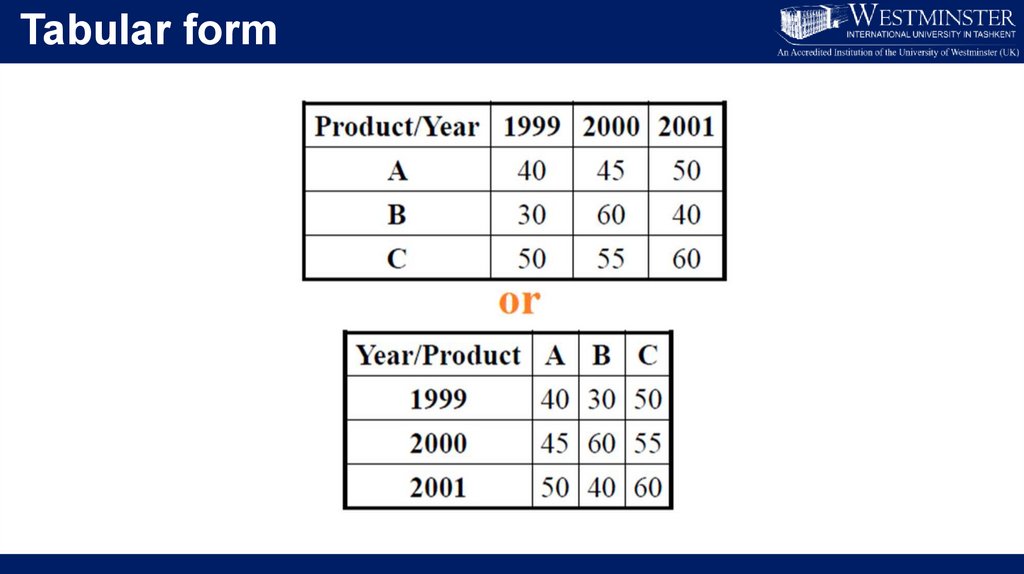
Quantitative data: Time seriesCase 4:
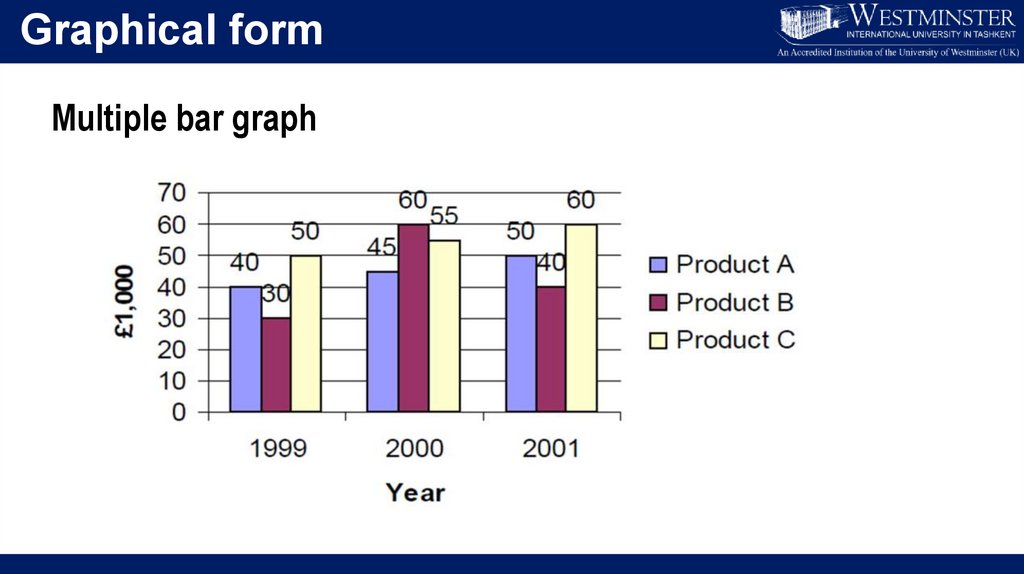
The company XYZ produces three types of products (A, B, and C).
The total sales of the Product A in 1999, 2000 and 2001 were
£40,000, £45,000 and £50,000, of the Product B were £30,000,
£40,000 and £50,000 and of the Product C were £50,000, £55,000
and £60,000 respectively. Construct a table for this data and
illustrate it with a help of bar chart.
46.
Tabular form47.
Graphical formComponent bar graph
48.
Graphical formMultiple bar graph
49.
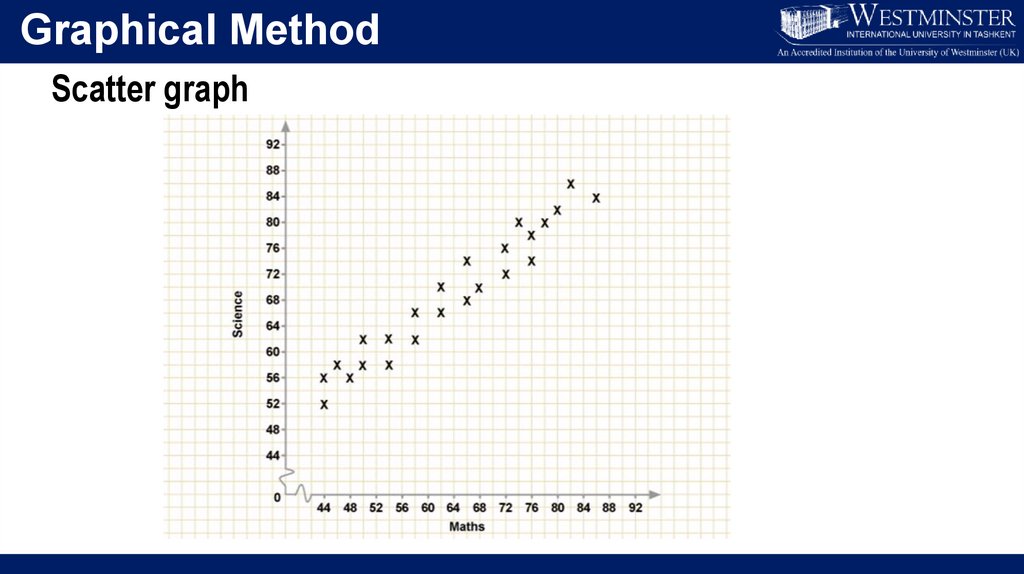
Graphical MethodScatter graph
50.
Concluding remarks:Today, you learnt:
a) The components of statistical table;
b) The main types of data;
c) The scales of measurement of the data
d) analyze statistical data;
e) use tabular methods to display data
f) use graphical methods to display data
51.
Essential readings (Part 1)Jon Curwin…, “Quantitative Methods…”, Chapters 1-2
Glyn Burton…, “Quantitative Methods…”, Chapter 1
Richard Thomas, “Quantitative Methods…”, Chapter 1.1
Mik Wisniewski…, “Foundation Quantitative…”, Chapter 3
Clare Morris, “Quantitative Approaches…”, Chapter 3
52.
Essential readings (Part 2):Jon Curwin…, “Quantitative methods…”, Chapter 4
Glyn Burton…, “Quantitative methods…”, Chapter 1
Richard Thomas, “Quantitative methods…”, Chapter 1.2-1.4
Mik Wisniewski…, “Foundation Quantitative…”, Chapters 5-6
Clare Morris, “Quantitative Approaches…”, Chapter 5
Louise Swift “Quantitative methods…”, Chapter DD1.