


 Медицина
Похожие презентации:


 309и")


Coronavirus (COVID-19) in Japan
1.
Coronavirus (COVID-19) in Japan2.
CORONAVIRUS (COVID-19) IN JAPANTable of Contents
3.
Table of Contents01
02
03
Overview
Total confirmed cases of COVID-19 Japan 2022
02
Confirmed cases of COVID-19 Japan 2022, by place of infection
03
Number of COVID-19 patients Japan 2022, by state of health
04
Patient profile of COVID-19 cases Japan 2022, by age group
05
New confirmed cases of COVID-19 by day Japan 2022
06
Number of people undergoing COVID-19 tests Japan 2022, by type of patients
07
Cases by prefecture
COVID-19 patients and number of death Japan 2022, by prefecture
09
Bed occupancy rate of COVID-19 inpatients Japan 2022, by prefecture
10
Patients with COVID-19 in Tokyo Japan 2022, by state of health
11
New confirmed cases of COVID-19 by day in Tokyo, Japan 2022
12
Vaccination
4.
Table of Contents04
05
Cumulative number of administered COVID-19 vaccinations Japan 2022
14
COVID-19 vaccination rate Japan 2022
15
COVID-19 vaccination rate Japan 2022, by age group
16
COVID-19 vaccination rate Japan 2022, by prefecture
17
Economic impact
Real GDP growth rate Japan Q1 2017-Q4 2021
19
Monthly Nikkei 225 development Japan 2019-2022
20
Monthly TOPIX development Japan 2019-2022
21
Monthly number of foreign visitors to Japan 2018-2021
22
Government measures
Coronavirus (COVID-19) economic relief package in April Japan 2020, by operation
24
Coronavirus (COVID-19) economic relief package in December Japan 2020, by operation
25
Coronavirus (COVID-19) economic relief package in November Japan 2021, by operation
26
5.
Table of Contents06
07
General account budget reserved for COVID-19 countermeasures Japan FY 2020-2021
27
Approved value of employment adjustment subsidies amid COVID-19 Japan 2022
28
Affected business
Business conditions DI of business enterprises Japan 2018-2021, by company size
30
Business conditions DI of business enterprises Japan 2021, by industry
31
Share of companies experiencing an impact of COVID-19 on business Japan 2022
32
Effect of COVID-19 on monthly sales growth of small-to-medium companies Japan 2022
33
Share of companies potentially closing down due to COVID-19 Japan 2022, by size
34
Impact of COVID-19 pandemic on business of foreign affiliates in Japan 2020
35
Bankruptcy and dismissal
Number of corporate bankruptcies Japan 2013-2021
37
Number of corporate bankruptcies Japan 2021, by industry
38
Number of bankruptcies due to the impact of COVID-19 Japan 2022, by prefecture
39
6.
Table of Contents08
Number of bankruptcies in the travel business in Japan 2011-2020
40
Businesses with an employment adjustment possibility due to COVID-19 Japan 2022
41
Cumulative number of workers to be fired due to COVID-19 Japan 2022, by industry
42
Public opinion
Share of companies that implemented remote work due to COVID-19 Japan 2021
44
Change in revenue of artist groups during COVID-19 pandemic in Japan 2020
45
Share of office workers feeling mentally unstable amid COVID-19 Japan 2021
46
Consumers with food expense decrease during COVID-19 in Japan 2021, by channel
47
7.
CORONAVIRUS (COVID-19) IN JAPANOverview
8.
Feb 10 '20Mar 18 '20
Mar 30 '20
Apr 11 '20
Apr 23 '20
May 5 '20
May 17 '20
May 29 '20
Jun 10 '20
Jun 22 '20
Jul 4 '20
Jul 16 '20
Jul 28 '20
Aug 9 '20
Aug 21 '20
Sep 2 '20
Sep 14 '20
Sep 26 '20
Oct 8 '20
Oct 20 '20
Nov 1 '20
Nov 13 '20
Nov 25 '20
Dec 7 '20
Dec 19 '20
Dec 31 '20
Jan 12 '21
Jan 24 '21
Feb 5 '21
Feb 17 '21
Mar 1 '21
Mar 13 '21
Mar 25 '21
Apr 6 '21
Apr 18 '21
Apr 30 '21
May 12 '21
May 24 '21
Jun 5 '21
Jun 17 '21
Jun 29 '21
Jul 11 '21
Jul 23 '21
Aug 4 '21
Aug 16 '21
Aug 28 '21
Sep 9 '21
Sep 21 '21
Oct 3 '21
Oct 15 '21
Oct 27 '21
Nov 8 '21
Nov 20 '21
Dec 2 '21
Dec 14 '21
Dec 26 '21
Jan 7 '22
Jan 19 '22
Jan 31 '22
Feb 12 '22
Feb 24 '22
Mar 8 '22
Number of patients
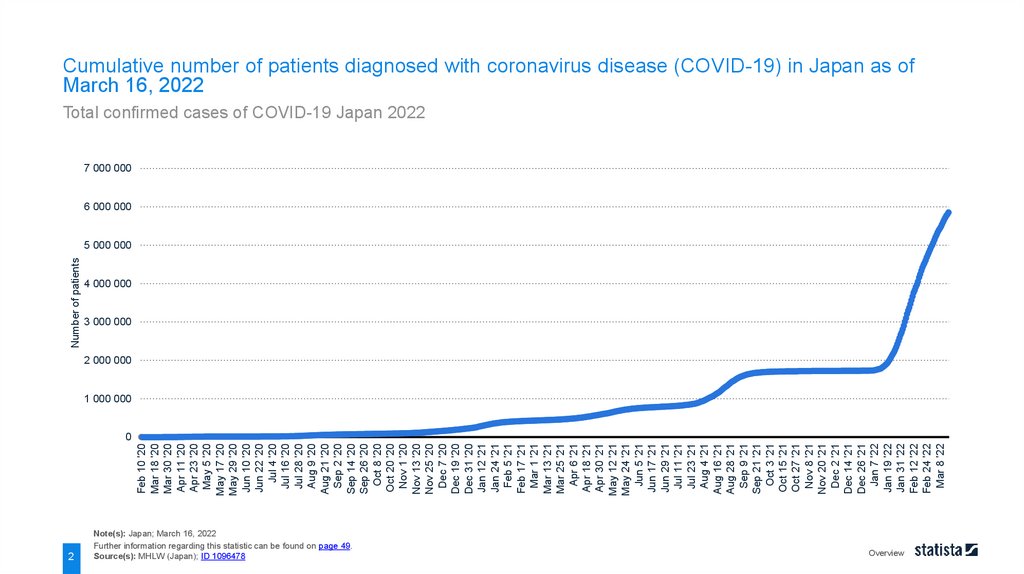
Cumulative number of patients diagnosed with coronavirus disease (COVID-19) in Japan as of
March 16, 2022
Total confirmed cases of COVID-19 Japan 2022
7 000 000
6 000 000
5 000 000
2
4 000 000
3 000 000
2 000 000
1 000 000
0
Note(s): Japan; March 16, 2022
Further information regarding this statistic can be found on page 49.
Source(s): MHLW (Japan); ID 1096478
Overview
9.
Feb 12 '20Mar 20 '20
Apr 1 '20
Apr 13 '20
Apr 25 '20
May 7 '20
May 19 '20
May 31 '20
Jun 12 '20
Jun 24 '20
Jul 6 '20
Jul 18 '20
Jul 30 '20
Aug 11 '20
Aug 23 '20
Sep 4 '20
Sep 16 '20
Sep 28 '20
Oct 10 '20
Oct 22 '20
Nov 3 '20
Nov 15 '20
Nov 27 '20
Dec 9 '20
Dec 21 '20
Jan 2 '21
Jan 14 '21
Jan 26 '21
Feb 7 '21
Feb 19 '21
Mar 3 '21
Mar 15 '21
Mar 27 '21
Apr 8 '21
Apr 20 '21
May 2 '21
May 14 '21
May 26 '21
Jun 7 '21
Jun 19 '21
Jul 1 '21
Jul 13 '21
Jul 25 '21
Aug 6 '21
Aug 18 '21
Aug 30 '21
Sep 11 '21
Sep 23 '21
Oct 5 '21
Oct 17 '21
Oct 29 '21
Nov 10 '21
Nov 22 '21
Dec 4 '21
Dec 16 '21
Dec 28 '21
Jan 9 '22
Jan 21 '22
Feb 2 '22
Feb 14 '22
Feb 26 '22
Mar 10 '22
Number of patients
Cumulative number of patients diagnosed with coronavirus (COVID-19) in Japan as of March 18,
2022, by place of infection
Confirmed cases of COVID-19 Japan 2022, by place of infection
Patients within Japan
3
Note(s): Japan; March 18, 2022
Further information regarding this statistic can be found on page 50.
Source(s): MHLW (Japan); ID 1100172
Airport quarantine
Returnees from Hunan on government charter flights
7 000 000
6 000 000
5 000 000
4 000 000
3 000 000
2 000 000
1 000 000
0
Overview
10.
Feb 12 '20Mar 19 '20
Mar 31 '20
Apr 12 '20
Apr 24 '20
May 6 '20
May 18 '20
May 30 '20
Jun 11 '20
Jun 23 '20
Jul 5 '20
Jul 17 '20
Jul 29 '20
Aug 10 '20
Aug 22 '20
Sep 3 '20
Sep 15 '20
Sep 27 '20
Oct 9 '20
Oct 21 '20
Nov 2 '20
Nov 14 '20
Nov 26 '20
Dec 8 '20
Dec 20 '20
Jan 1 '21
Jan 13 '21
Jan 25 '21
Feb 6 '21
Feb 18 '21
Mar 2 '21
Mar 14 '21
Mar 26 '21
Apr 7 '21
Apr 19 '21
May 1 '21
May 13 '21
May 25 '21
Jun 6 '21
Jun 18 '21
Jun 30 '21
Jul 12 '21
Jul 24 '21
Aug 5 '21
Aug 17 '21
Aug 29 '21
Sep 10 '21
Sep 22 '21
Oct 4 '21
Oct 16 '21
Oct 28 '21
Nov 9 '21
Nov 21 '21
Dec 3 '21
Dec 15 '21
Dec 27 '21
Jan 8 '22
Jan 20 '22
Feb 1 '22
Feb 13 '22
Feb 25 '22
Mar 9 '22
Number of patients
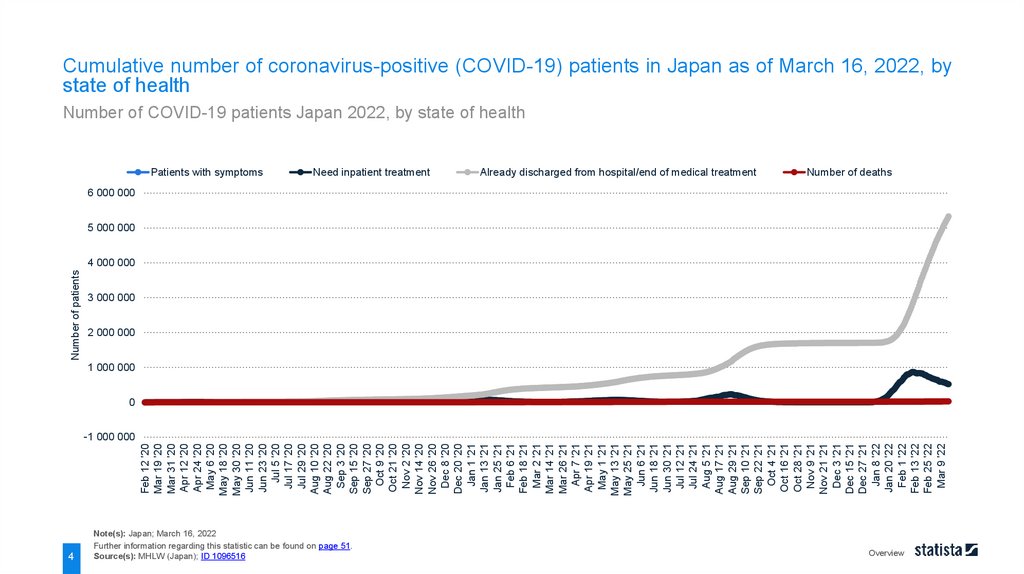
Cumulative number of coronavirus-positive (COVID-19) patients in Japan as of March 16, 2022, by
state of health
Number of COVID-19 patients Japan 2022, by state of health
Patients with symptoms
4
Need inpatient treatment
Note(s): Japan; March 16, 2022
Further information regarding this statistic can be found on page 51.
Source(s): MHLW (Japan); ID 1096516
Already discharged from hospital/end of medical treatment
Number of deaths
6 000 000
5 000 000
4 000 000
3 000 000
2 000 000
1 000 000
0
-1 000 000
Overview
11.
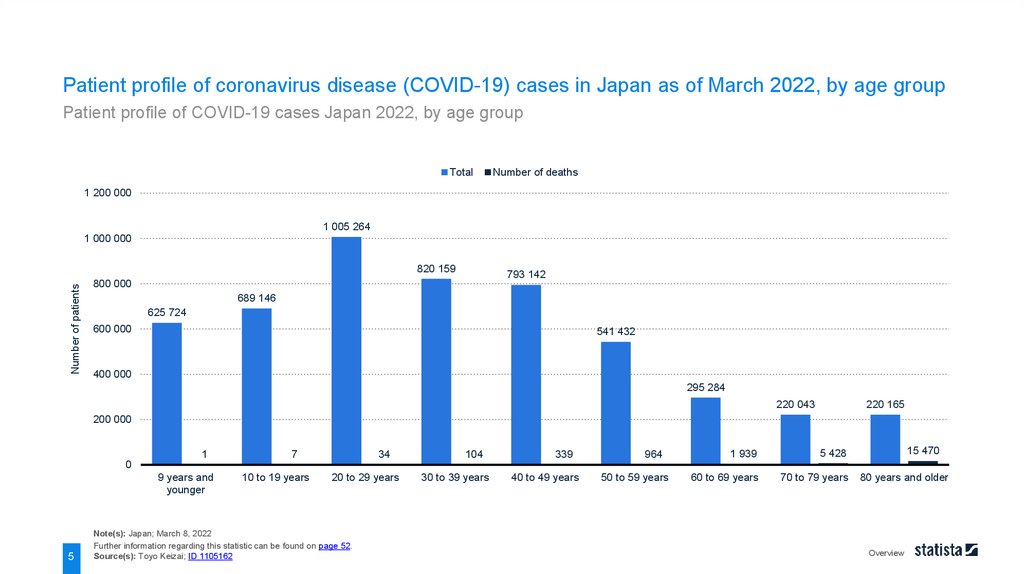
Patient profile of coronavirus disease (COVID-19) cases in Japan as of March 2022, by age groupPatient profile of COVID-19 cases Japan 2022, by age group
Total
Number of deaths
1 200 000
1 005 264
1 000 000
Number of patients
820 159
793 142
800 000
689 146
625 724
600 000
541 432
400 000
295 284
220 165
220 043
200 000
1
7
34
104
339
964
1 939
5 428
60 to 69 years
70 to 79 years
15 470
0
9 years and
younger
5
10 to 19 years
20 to 29 years
Note(s): Japan; March 8, 2022
Further information regarding this statistic can be found on page 52.
Source(s): Toyo Keizai; ID 1105162
30 to 39 years
40 to 49 years
50 to 59 years
80 years and older
Overview
12.
Jan 16 '20Jan 28 '20
Feb 9 '20
Feb 21 '20
Mar 4 '20
Mar 16 '20
Mar 28 '20
Apr 9 '20
Apr 21 '20
May 3 '20
May 15 '20
May 27 '20
Jun 8 '20
Jun 20 '20
Jul 2 '20
Jul 14 '20
Jul 26 '20
Aug 7 '20
Aug 19 '20
Aug 31 '20
Sep 12 '20
Sep 24 '20
Oct 6 '20
Oct 18 '20
Oct 30 '20
Nov 11 '20
Nov 23 '20
Dec 5 '20
Dec 17 '20
Dec 29 '20
Jan 10 '21
Jan 22 '21
Feb 3 '21
Feb 15 '21
Feb 27 '21
Mar 11 '21
Mar 23 '21
Apr 4 '21
Apr 16 '21
Apr 28 '21
May 10 '21
May 22 '21
Jun 3 '21
Jun 15 '21
Jun 27 '21
Jul 9 '21
Jul 21 '21
Aug 2 '21
Aug 14 '21
Aug 26 '21
Sep 7 '21
Sep 19 '21
Oct 1 '21
Oct 13 '21
Oct 25 '21
Nov 6 '21
Nov 18 '21
Nov 30 '21
Dec 12 '21
Dec 24 '21
Jan 5 '22
Jan 17 '22
Jan 29 '22
Feb 10 '22
Feb 22 '22
Mar 6 '22
Number of patients
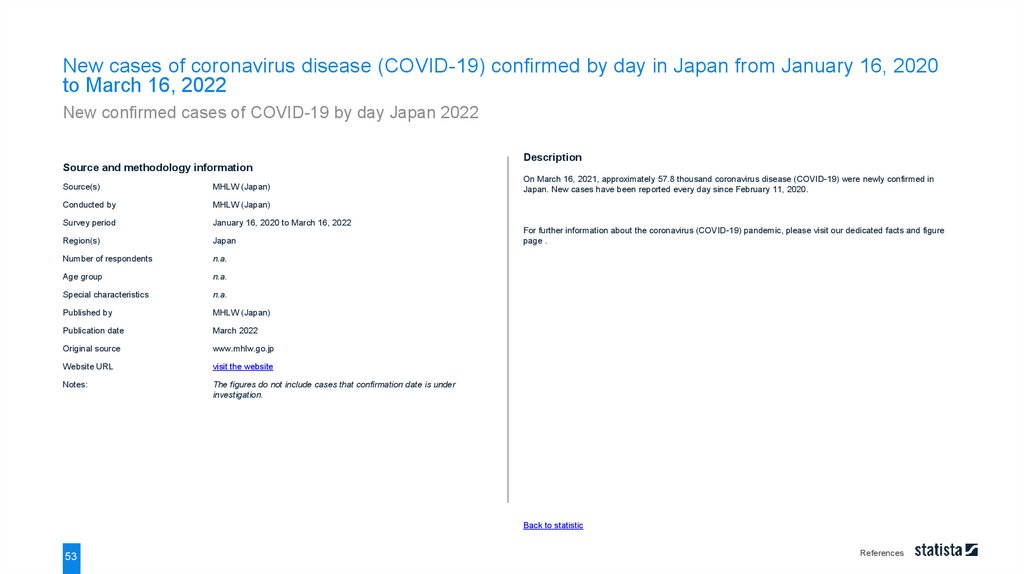
New cases of coronavirus disease (COVID-19) confirmed by day in Japan from January 16, 2020
to March 16, 2022
New confirmed cases of COVID-19 by day Japan 2022
130 000
110 000
90 000
6
70 000
50 000
30 000
10 000
-10 000
-30 000
-50 000
Note(s): Japan; January 16, 2020 to March 16, 2022
Further information regarding this statistic can be found on page 53.
Source(s): MHLW (Japan); ID 1105032
Overview
13.
Feb 12 '20Mar 19 '20*
Apr 4 '20
Apr 15 '20
Apr 26 '20
May 7 '20
May 18 '20
May 29 '20
Jun 9 '20
Jun 20 '20
Jul 1 '20
Jul 12 '20
Jul 23 '20
Aug 3 '20
Aug 14 '20
Aug 25 '20
Sep 5 '20
Sep 16 '20
Sep 27 '20
Oct 8 '20
Oct 19 '20
Oct 30 '20
Nov 10 '20
Nov 21 '20
Dec 2 '20
Dec 13 '20
Dec 24 '20
Jan 4 '21
Jan 15 '21
Jan 26 '21
Feb 6 '21
Feb 17 '21
Feb 28 '21
Mar 11 '21
Mar 22 '21
Apr 2 '21
Apr 13 '21
Apr 24 '21
May 5 '21
May 16 '21
May 27 '21
Jun 7 '21
Jun 18 '21
Jun 29 '21
Jul 10 '21
Jul 21 '21
Aug 1 '21
Aug 12 '21
Aug 23 '21
Sep 3 '21
Sep 14 '21
Sep 25 '21
Oct 6 '21
Oct 17 '21
Oct 28 '21
Nov 8 '21
Nov 19 '21
Nov 30 '21
Dec 11 '21
Dec 22 '21
Jan 2 '22
Jan 13 '22
Jan 24 '22
Feb 4 '22
Feb 15 '22
Feb 26 '22
Mar 9 '22
Number of patients
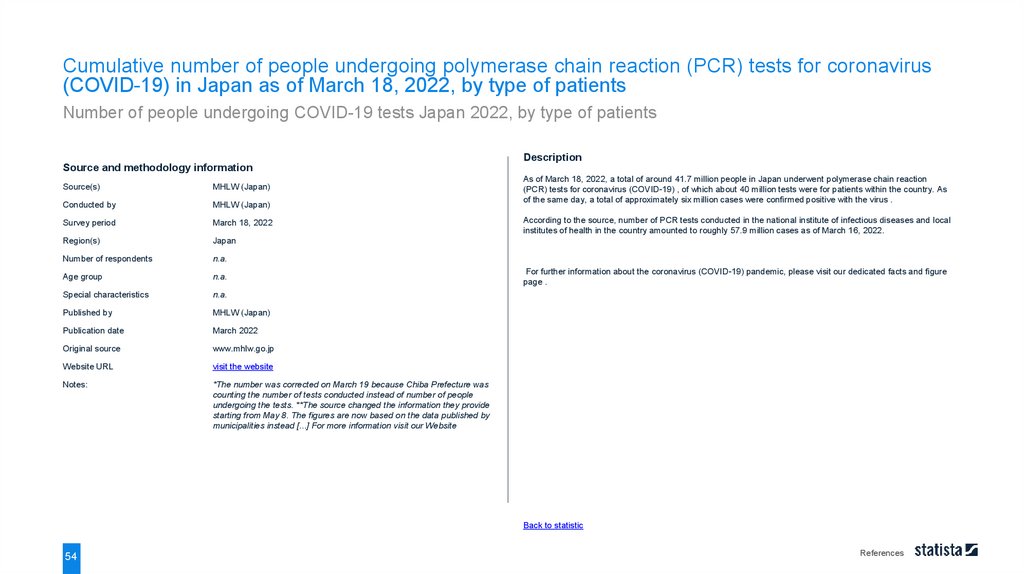
Cumulative number of people undergoing polymerase chain reaction (PCR) tests for coronavirus
(COVID-19) in Japan as of March 18, 2022, by type of patients
Number of people undergoing COVID-19 tests Japan 2022, by type of patients
Total
7
Patients in Japan
Note(s): Japan; March 18, 2022
Further information regarding this statistic can be found on page 54.
Source(s): MHLW (Japan); ID 1100135
Airport quarantine
Returnees from China on government charter flights
45 000 000
40 000 000
35 000 000
30 000 000
25 000 000
20 000 000
15 000 000
10 000 000
5 000 000
0
Overview
14.
CORONAVIRUS (COVID-19) IN JAPANCases by prefecture
15.
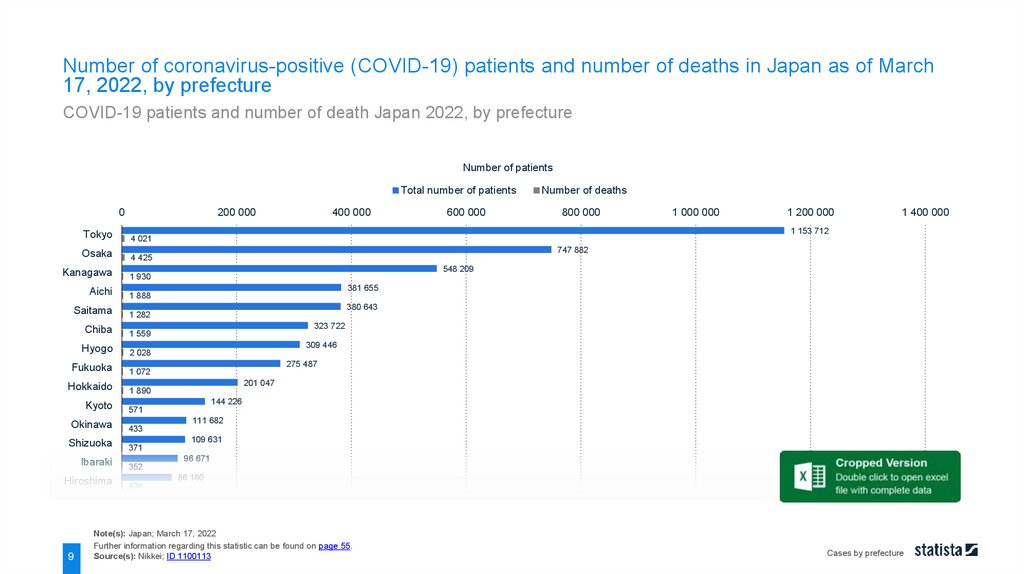
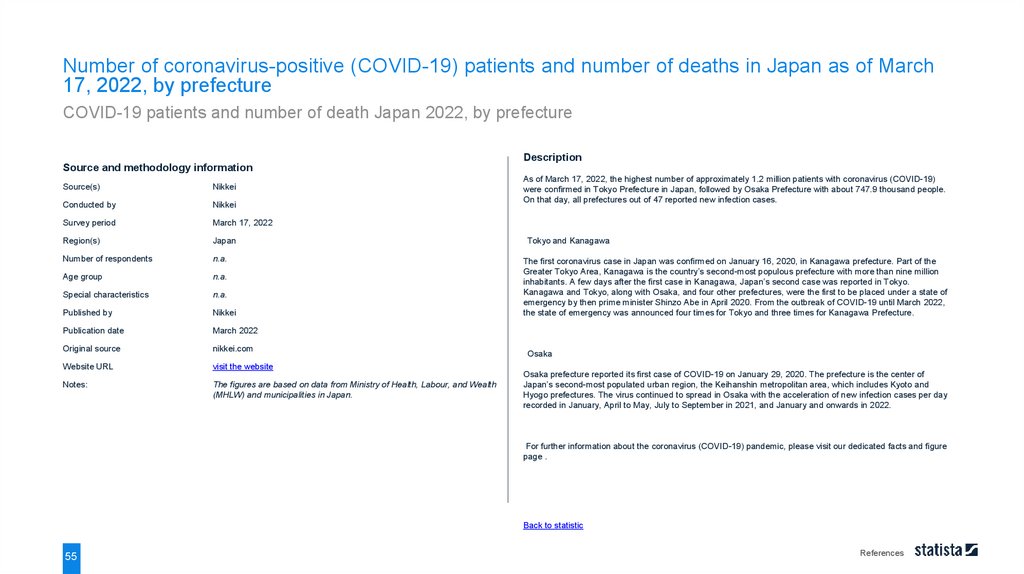
Number of coronavirus-positive (COVID-19) patients and number of deaths in Japan as of March17, 2022, by prefecture
COVID-19 patients and number of death Japan 2022, by prefecture
Number of patients
Total number of patients
0
200 000
600 000
800 000
1 000 000
1 200 000
1 400 000
1 153 712
Tokyo
4 021
Osaka
4 425
Kanagawa
1 930
Aichi
1 888
Saitama
1 282
Chiba
1 559
Hyogo
2 028
Fukuoka
1 072
Hokkaido
1 890
747 882
548 209
381 655
380 643
323 722
309 446
275 487
201 047
144 226
Kyoto
571
Okinawa
433
Shizuoka
371
Ibaraki
352
Hiroshima
434
9
400 000
Number of deaths
111 682
109 631
96 671
86 160
Note(s): Japan; March 17, 2022
Further information regarding this statistic can be found on page 55.
Source(s): Nikkei; ID 1100113
Cases by prefecture
16.
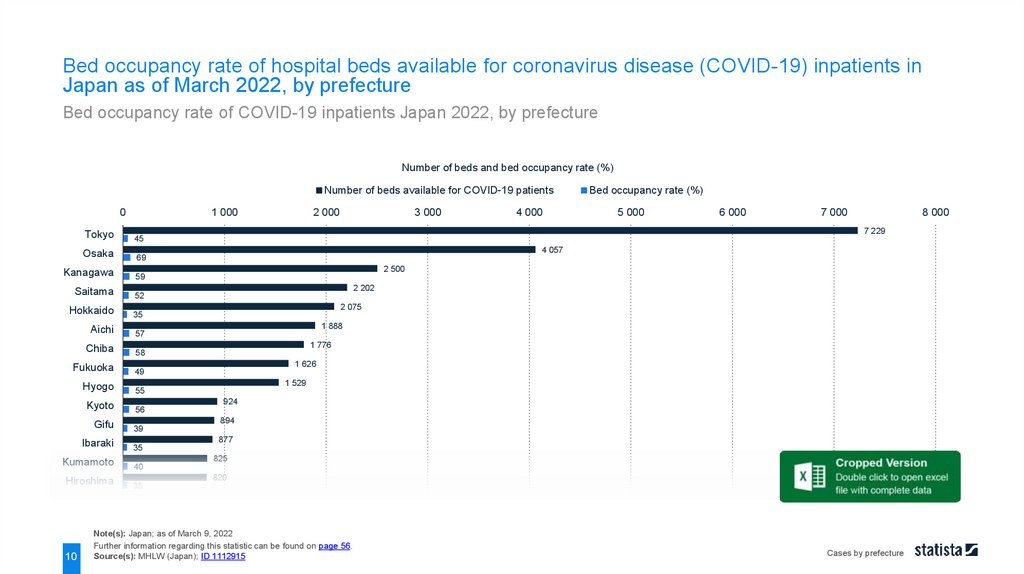
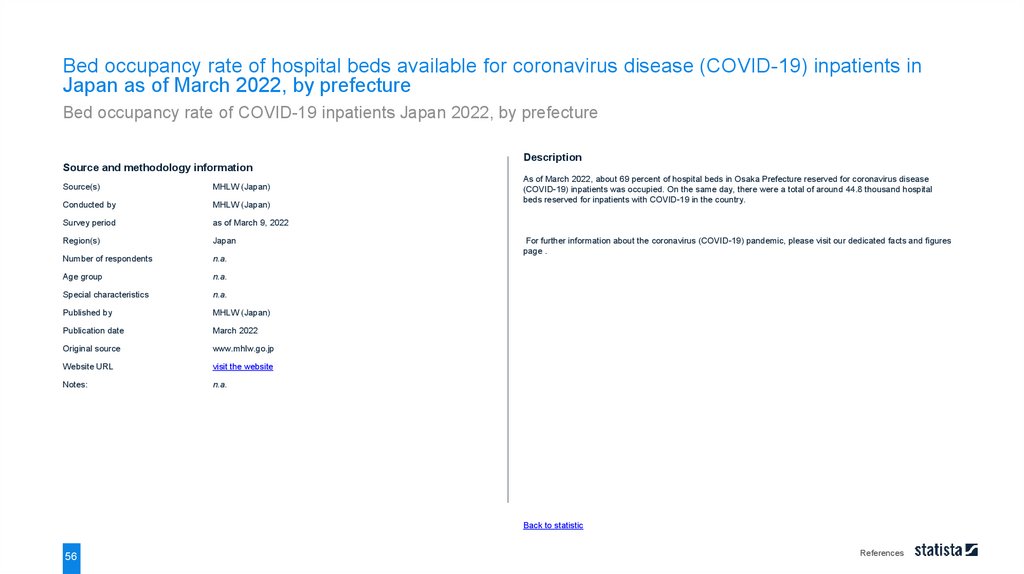
Bed occupancy rate of hospital beds available for coronavirus disease (COVID-19) inpatients inJapan as of March 2022, by prefecture
Bed occupancy rate of COVID-19 inpatients Japan 2022, by prefecture
Number of beds and bed occupancy rate (%)
Number of beds available for COVID-19 patients
0
1 000
3 000
4 000
5 000
6 000
7 000
8 000
7 229
Tokyo
45
Osaka
69
Kanagawa
59
Saitama
52
Hokkaido
35
Aichi
57
Chiba
58
Fukuoka
49
Hyogo
55
Kyoto
56
Gifu
39
Ibaraki
35
Kumamoto
40
Hiroshima
35
10
2 000
Bed occupancy rate (%)
4 057
2 500
2 202
2 075
1 888
1 776
1 626
1 529
924
894
877
825
820
Note(s): Japan; as of March 9, 2022
Further information regarding this statistic can be found on page 56.
Source(s): MHLW (Japan); ID 1112915
Cases by prefecture
17.
Feb 28 '20Mar 11 '20
Mar 23 '20
Apr 4 '20
Apr 16 '20
Apr 28 '20
May 10 '20
May 22 '20
Jun 3 '20
Jun 15 '20
Jun 27 '20
Jul 9 '20
Jul 21 '20
Aug 2 '20
Aug 14 '20
Aug 26 '20
Sep 7 '20
Sep 19 '20
Oct 1 '20
Oct 13 '20
Oct 25 '20
Nov 6 '20
Nov 18 '20
Nov 30 '20
Dec 12 '20
Dec 24 '20
Jan 5 '21
Jan 17 '21
Jan 29 '21
Feb 10 '21
Feb 22 '21
Mar 6 '21
Mar 18 '21
Mar 30 '21
Apr 11 '21
Apr 23 '21
May 5 '21
May 17 '21
May 29 '21
Jun 10 '21
Jun 22 '21
Jul 4 '21
Jul 16 '21
Jul 28 '21
Aug 9 '21
Aug 21 '21
Sep 2 '21
Sep 14 '21
Sep 26 '21
Oct 8 '21
Oct 20 '21
Nov 1 '21
Nov 13 '21
Nov 25 '21
Dec 7 '21
Dec 19 '21
Dec 31 '21
Jan 12 '22
Jan 24 '22
Feb 5 '22
Feb 17 '22
Mar 1 '22
Mar 13 '22
Number of patients
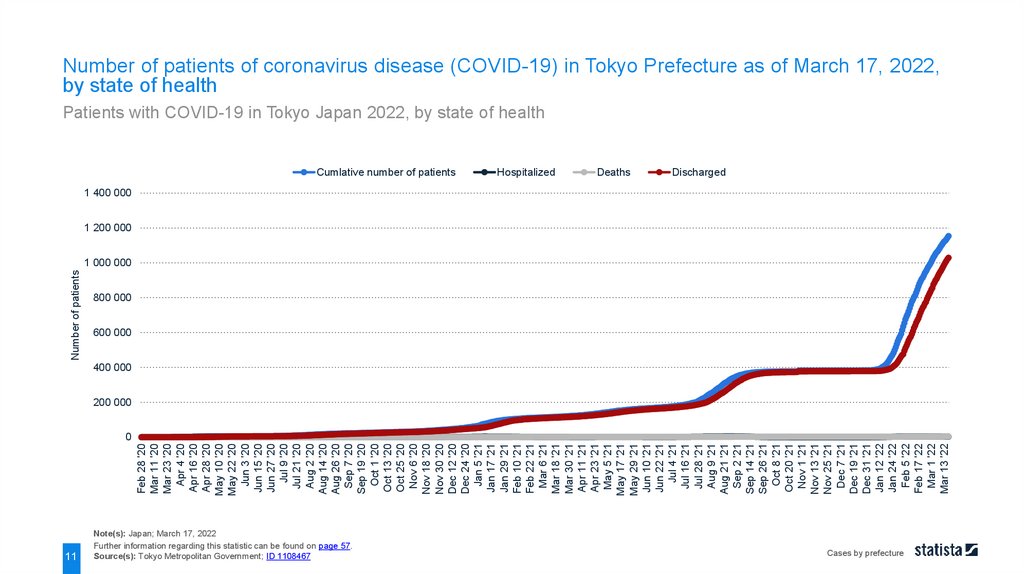
Number of patients of coronavirus disease (COVID-19) in Tokyo Prefecture as of March 17, 2022,
by state of health
Patients with COVID-19 in Tokyo Japan 2022, by state of health
Cumlative number of patients
11
Note(s): Japan; March 17, 2022
Further information regarding this statistic can be found on page 57.
Source(s): Tokyo Metropolitan Government; ID 1108467
Hospitalized
Deaths
Discharged
1 400 000
1 200 000
1 000 000
800 000
600 000
400 000
200 000
0
Cases by prefecture
18.
Jan 14 '20Jan 26 '20
Feb 7 '20
Feb 19 '20
Mar 2 '20
Mar 14 '20
Mar 26 '20
Apr 7 '20
Apr 19 '20
May 1 '20
May 13 '20
May 25 '20
Jun 6 '20
Jun 18 '20
Jun 30 '20
Jul 12 '20
Jul 24 '20
Aug 5 '20
Aug 17 '20
Aug 29 '20
Sep 10 '20
Sep 22 '20
Oct 4 '20
Oct 16 '20
Oct 28 '20
Nov 9 '20
Nov 21 '20
Dec 3 '20
Dec 15 '20
Dec 27 '20
Jan 8 '21
Jan 20 '21
Feb 1 '21
Feb 13 '21
Feb 25 '21
Mar 9 '21
Mar 21 '21
Apr 2 '21
Apr 14 '21
Apr 26 '21
May 8 '21
May 20 '21
Jun 1 '21
Jun 13 '21
Jun 25 '21
Jul 7 '21
Jul 19 '21
Jul 31 '21
Aug 12 '21
Aug 24 '21
Sep 5 '21
Sep 17 '21
Sep 29 '21
Oct 11 '21
Oct 23 '21
Nov 4 '21
Nov 16 '21
Nov 28 '21
Dec 10 '21
Dec 22 '21
Jan 3 '22
Jan 15 '22
Jan 27 '22
Feb 8 '22
Feb 20 '22
Mar 4 '22
Number of patients
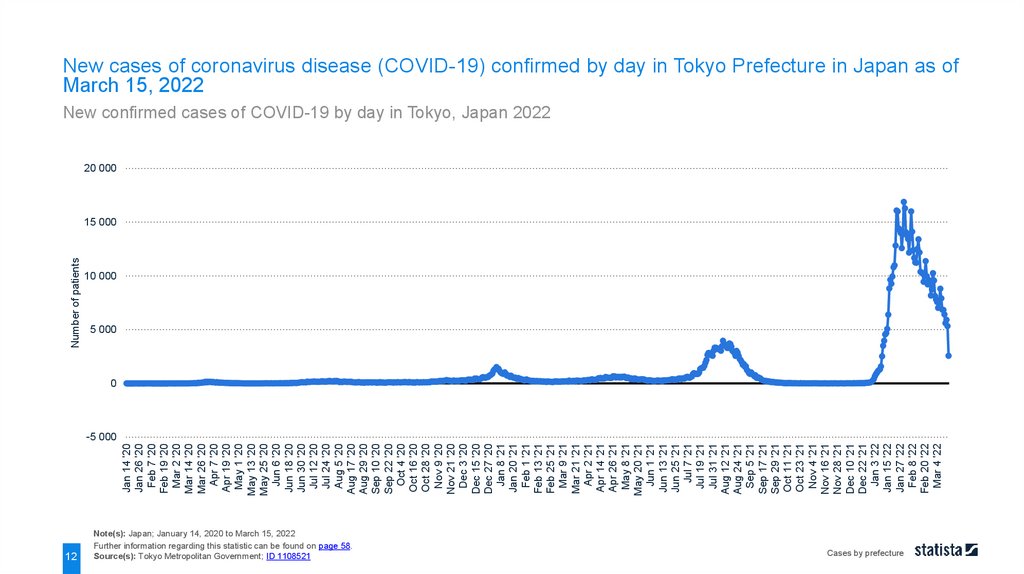
New cases of coronavirus disease (COVID-19) confirmed by day in Tokyo Prefecture in Japan as of
March 15, 2022
New confirmed cases of COVID-19 by day in Tokyo, Japan 2022
20 000
15 000
12
10 000
5 000
0
-5 000
Note(s): Japan; January 14, 2020 to March 15, 2022
Further information regarding this statistic can be found on page 58.
Source(s): Tokyo Metropolitan Government; ID 1108521
Cases by prefecture
19.
CORONAVIRUS (COVID-19) IN JAPANVaccination
20.
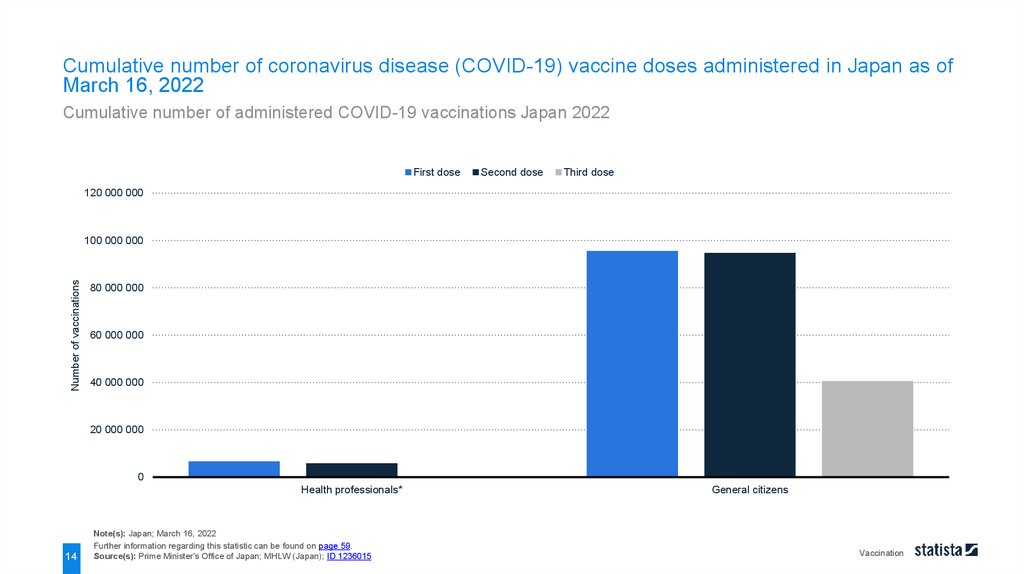
Cumulative number of coronavirus disease (COVID-19) vaccine doses administered in Japan as ofMarch 16, 2022
Cumulative number of administered COVID-19 vaccinations Japan 2022
First dose
Second dose
Third dose
120 000 000
Number of vaccinations
100 000 000
80 000 000
60 000 000
40 000 000
20 000 000
0
Health professionals*
14
Note(s): Japan; March 16, 2022
Further information regarding this statistic can be found on page 59.
Source(s): Prime Minister's Office of Japan; MHLW (Japan); ID 1236015
General citizens
Vaccination
21.
Apr 12 '21Apr 17 '21
Apr 22 '21
Apr 27 '21
May 2 '21
May 7 '21
May 12 '21
May 17 '21
May 22 '21
May 27 '21
Jun 1 '21
Jun 6 '21
Jun 11 '21
Jun 16 '21
Jun 21 '21
Jun 26 '21
Jul 1 '21
Jul 6 '21
Jul 11 '21
Jul 16 '21
Jul 21 '21
Jul 26 '21
Jul 31 '21
Aug 5 '21
Aug 10 '21
Aug 15 '21
Aug 20 '21
Aug 25 '21
Aug 30 '21
Sep 4 '21
Sep 9 '21
Sep 14 '21
Sep 19 '21
Sep 24 '21
Sep 29 '21
Oct 4 '21
Oct 9 '21
Oct 14 '21
Oct 19 '21
Oct 24 '21
Oct 29 '21
Nov 3 '21
Nov 8 '21
Nov 13 '21
Nov 18 '21
Nov 23 '21
Nov 28 '21
Dec 3 '21
Dec 8 '21
Dec 13 '21
Dec 18 '21
Dec 23 '21
Dec 28 '21
Jan 2 '22
Jan 7 '22
Jan 12 '22
Jan 17 '22
Jan 22 '22
Jan 27 '22
Feb 1 '22
Feb 6 '22
Feb 11 '22
Feb 16 '22
Feb 21 '22
Feb 26 '22
Mar 3 '22
Mar 8 '22
Mar 13 '22
Vaccination rate
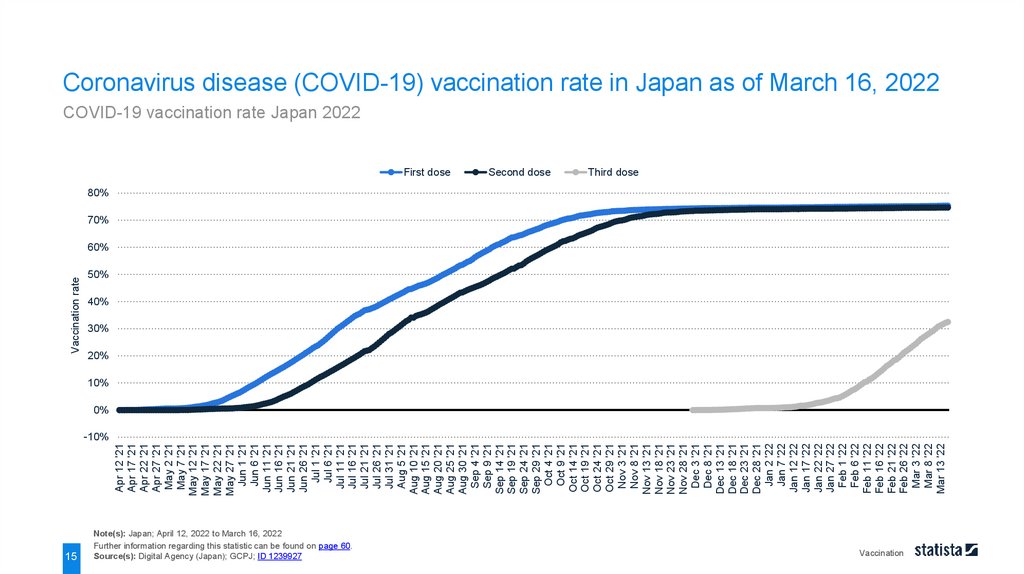
Coronavirus disease (COVID-19) vaccination rate in Japan as of March 16, 2022
COVID-19 vaccination rate Japan 2022
First dose
15
Note(s): Japan; April 12, 2022 to March 16, 2022
Further information regarding this statistic can be found on page 60.
Source(s): Digital Agency (Japan); GCPJ; ID 1239927
Second dose
Third dose
80%
70%
60%
50%
40%
30%
20%
10%
0%
-10%
Vaccination
22.
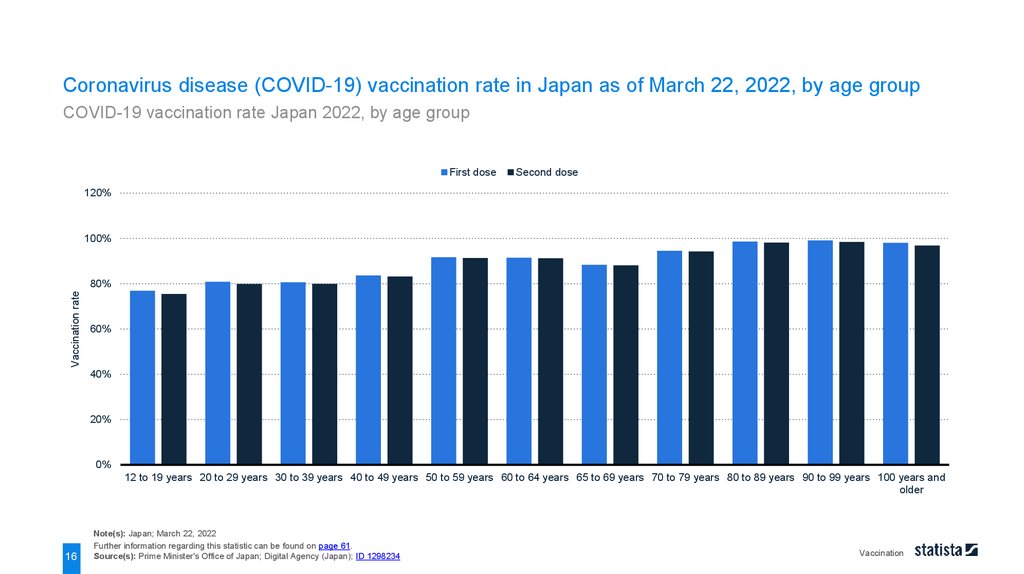
Coronavirus disease (COVID-19) vaccination rate in Japan as of March 22, 2022, by age groupCOVID-19 vaccination rate Japan 2022, by age group
First dose
Second dose
120%
100%
Vaccination rate
80%
60%
40%
20%
0%
12 to 19 years 20 to 29 years 30 to 39 years 40 to 49 years 50 to 59 years 60 to 64 years 65 to 69 years 70 to 79 years 80 to 89 years 90 to 99 years 100 years and
older
16
Note(s): Japan; March 22, 2022
Further information regarding this statistic can be found on page 61.
Source(s): Prime Minister's Office of Japan; Digital Agency (Japan); ID 1298234
Vaccination
23.
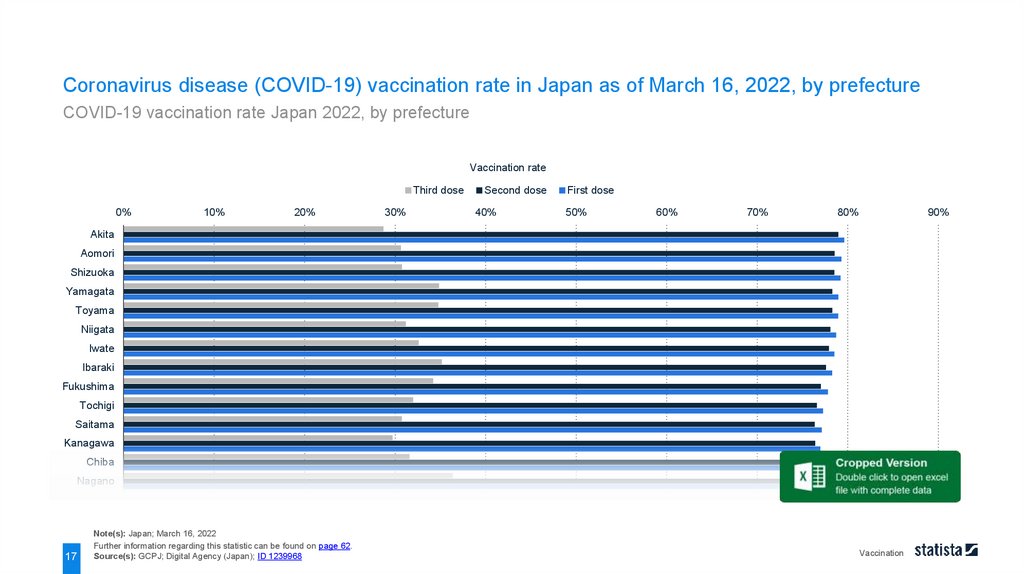
Coronavirus disease (COVID-19) vaccination rate in Japan as of March 16, 2022, by prefectureCOVID-19 vaccination rate Japan 2022, by prefecture
Vaccination rate
Third dose
0%
10%
20%
30%
Second dose
40%
First dose
50%
60%
70%
80%
90%
Akita
Aomori
Shizuoka
Yamagata
Toyama
Niigata
Iwate
Ibaraki
Fukushima
Tochigi
Saitama
Kanagawa
Chiba
Nagano
17
Note(s): Japan; March 16, 2022
Further information regarding this statistic can be found on page 62.
Source(s): GCPJ; Digital Agency (Japan); ID 1239968
Vaccination
24.
CORONAVIRUS (COVID-19) IN JAPANEconomic impact
25.
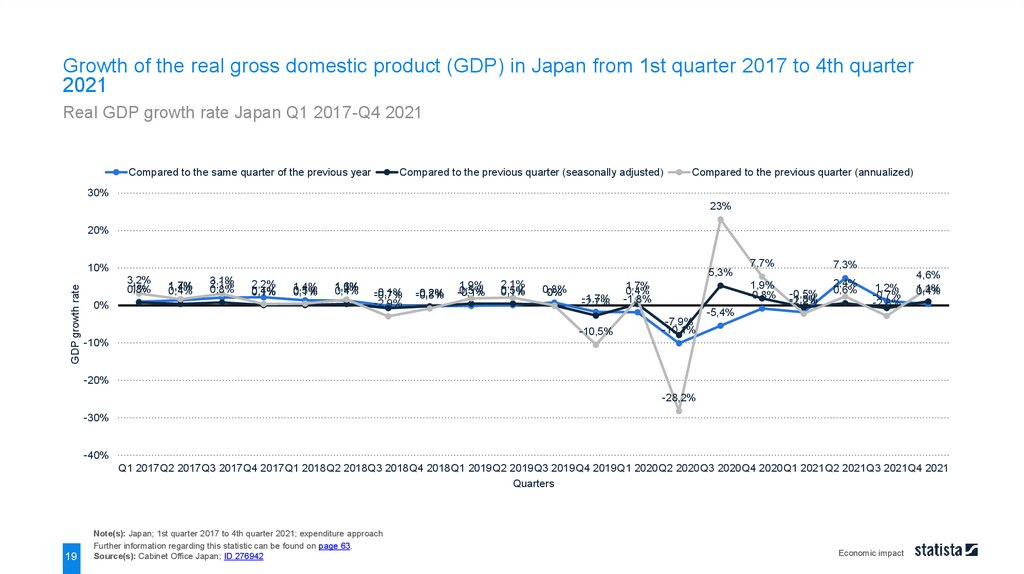
Growth of the real gross domestic product (GDP) in Japan from 1st quarter 2017 to 4th quarter2021
Real GDP growth rate Japan Q1 2017-Q4 2021
Compared to the same quarter of the previous year
Compared to the previous quarter (seasonally adjusted)
Compared to the previous quarter (annualized)
30%
23%
20%
GDP growth rate
10%
3,2%
1%
0,8%
0%
1,7%
1,4%
0,4%
3,1%
2,1%
0,8%
5,3%
2,2%
0,4%
0,1%
1,4%
0,5%
0,1%
1,6%
1,3%
0,4%
-0,1%
-0,7%
-2,9%
-0,2%
-0,8%
1,9%
0,5%
-0,1%
2,1%
0,5%
0,1%
0,8%
0%
-1,7%
-2,7%
-10,5%
1,7%
0,4%
-1,8%
-7,9%
-10,1%
-5,4%
7,7%
7,3%
1,9%
-0,8%
2,4%
0,6%
-0,5%
-1,8%
-2,2%
1,2%
-0,7%
-2,8%
4,6%
1,1%
0,4%
-10%
-20%
-28,2%
-30%
-40%
Q1 2017Q2 2017Q3 2017Q4 2017Q1 2018Q2 2018Q3 2018Q4 2018Q1 2019Q2 2019Q3 2019Q4 2019Q1 2020Q2 2020Q3 2020Q4 2020Q1 2021Q2 2021Q3 2021Q4 2021
Quarters
19
Note(s): Japan; 1st quarter 2017 to 4th quarter 2021; expenditure approach
Further information regarding this statistic can be found on page 63.
Source(s): Cabinet Office Japan; ID 276942
Economic impact
26.
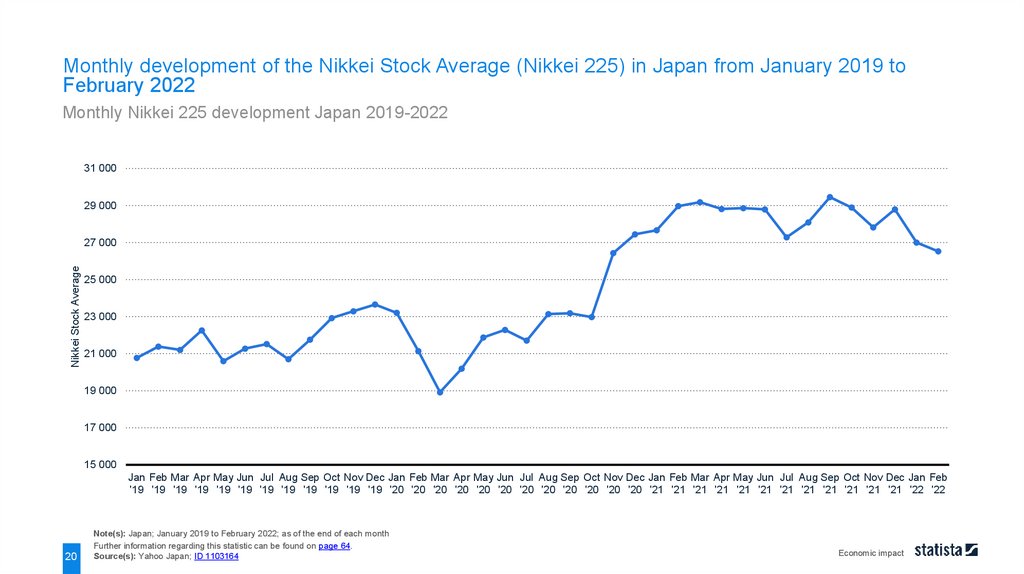
Monthly development of the Nikkei Stock Average (Nikkei 225) in Japan from January 2019 toFebruary 2022
Monthly Nikkei 225 development Japan 2019-2022
31 000
29 000
Nikkei Stock Average
27 000
25 000
23 000
21 000
19 000
17 000
15 000
Jan Feb Mar Apr May Jun Jul Aug Sep Oct Nov Dec Jan Feb Mar Apr May Jun Jul Aug Sep Oct Nov Dec Jan Feb Mar Apr May Jun Jul Aug Sep Oct Nov Dec Jan Feb
'19 '19 '19 '19 '19 '19 '19 '19 '19 '19 '19 '19 '20 '20 '20 '20 '20 '20 '20 '20 '20 '20 '20 '20 '21 '21 '21 '21 '21 '21 '21 '21 '21 '21 '21 '21 '22 '22
20
Note(s): Japan; January 2019 to February 2022; as of the end of each month
Further information regarding this statistic can be found on page 64.
Source(s): Yahoo Japan; ID 1103164
Economic impact
27.
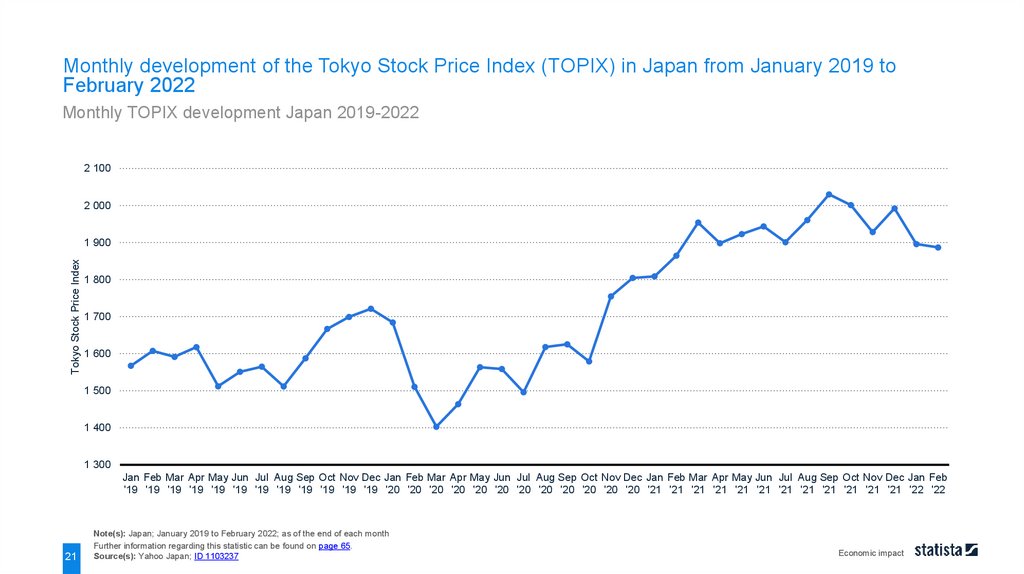
Monthly development of the Tokyo Stock Price Index (TOPIX) in Japan from January 2019 toFebruary 2022
Monthly TOPIX development Japan 2019-2022
2 100
2 000
Tokyo Stock Price Index
1 900
1 800
1 700
1 600
1 500
1 400
1 300
Jan Feb Mar Apr May Jun Jul Aug Sep Oct Nov Dec Jan Feb Mar Apr May Jun Jul Aug Sep Oct Nov Dec Jan Feb Mar Apr May Jun Jul Aug Sep Oct Nov Dec Jan Feb
'19 '19 '19 '19 '19 '19 '19 '19 '19 '19 '19 '19 '20 '20 '20 '20 '20 '20 '20 '20 '20 '20 '20 '20 '21 '21 '21 '21 '21 '21 '21 '21 '21 '21 '21 '21 '22 '22
21
Note(s): Japan; January 2019 to February 2022; as of the end of each month
Further information regarding this statistic can be found on page 65.
Source(s): Yahoo Japan; ID 1103237
Economic impact
28.
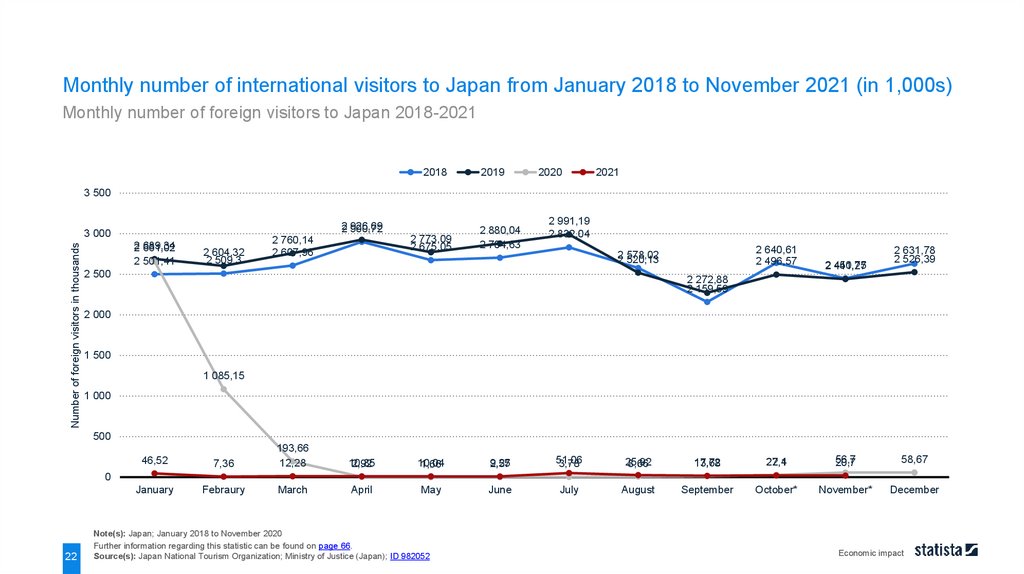
Monthly number of international visitors to Japan from January 2018 to November 2021 (in 1,000s)Monthly number of foreign visitors to Japan 2018-2021
2018
2019
2020
2021
3 500
2 926,69
900,72
Number of foreign visitors in thousands
3 000
2
2 689,34
661,02
2 501,41
2 604,32
2 509,3
2 773,09
2 675,05
2 760,14
2 607,96
2 880,04
2 704,63
2 991,19
2 832,04
2
2 578,02
520,13
2 500
2 640,61
2 496,57
450,75
2 441,27
2 631,78
2 526,39
2 272,88
2 159,59
2 000
1 500
1 085,15
1 000
500
46,52
January
7,36
193,66
12,28
10,85
2,92
10,04
1,66
9,25
2,57
51,06
3,78
25,92
8,66
17,72
13,68
27,4
22,1
56,7
20,7
58,67
Febraury
March
April
May
June
July
August
September
October*
November*
December
0
22
Note(s): Japan; January 2018 to November 2020
Further information regarding this statistic can be found on page 66.
Source(s): Japan National Tourism Organization; Ministry of Justice (Japan); ID 982052
Economic impact
29.
CORONAVIRUS (COVID-19) IN JAPANGovernment measures
30.
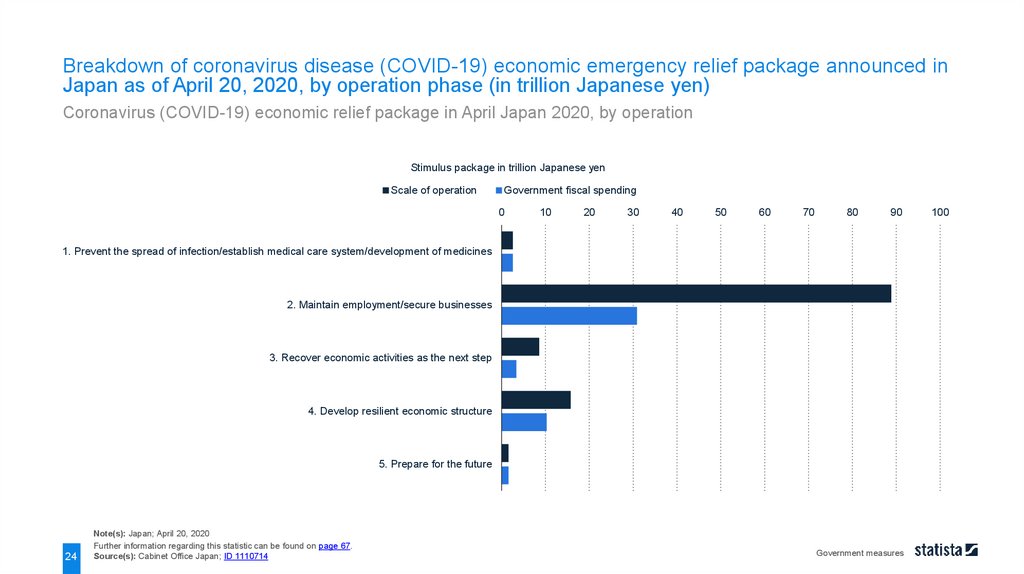
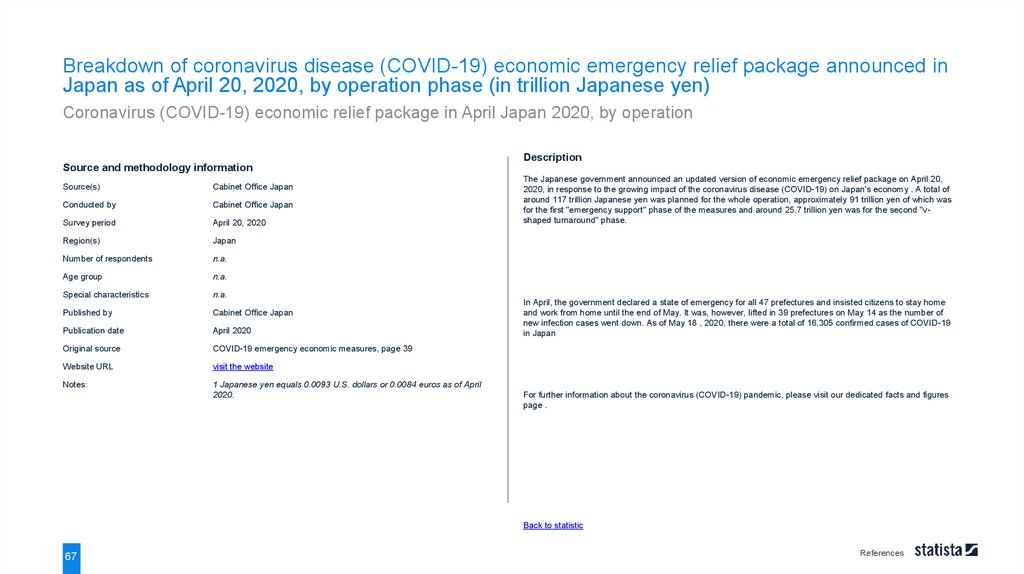
Breakdown of coronavirus disease (COVID-19) economic emergency relief package announced inJapan as of April 20, 2020, by operation phase (in trillion Japanese yen)
Coronavirus (COVID-19) economic relief package in April Japan 2020, by operation
Stimulus package in trillion Japanese yen
Scale of operation
Government fiscal spending
0
10
20
30
40
50
60
70
80
90
1. Prevent the spread of infection/establish medical care system/development of medicines
2. Maintain employment/secure businesses
3. Recover economic activities as the next step
4. Develop resilient economic structure
5. Prepare for the future
24
Note(s): Japan; April 20, 2020
Further information regarding this statistic can be found on page 67.
Source(s): Cabinet Office Japan; ID 1110714
Government measures
100
31.
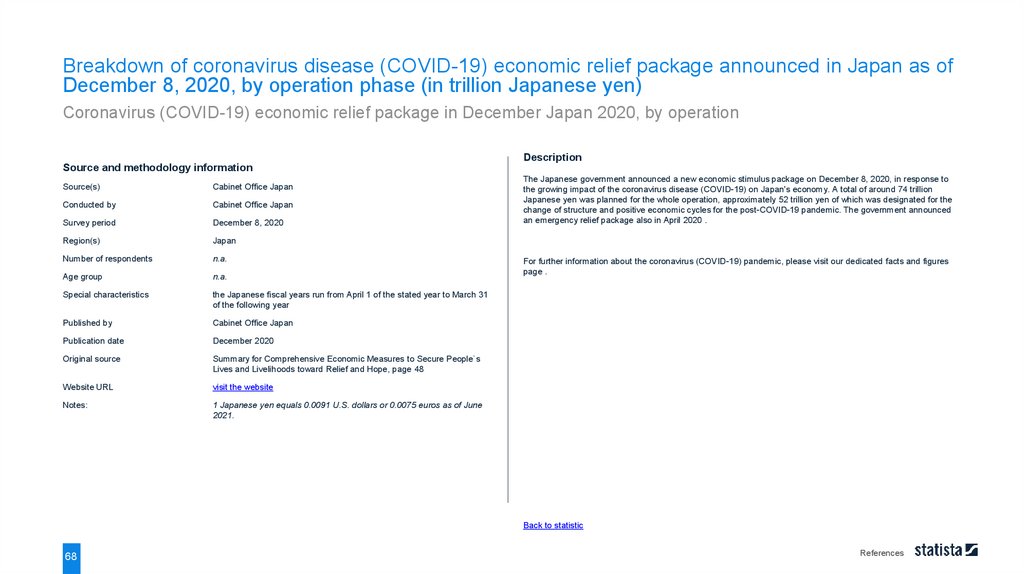
Breakdown of coronavirus disease (COVID-19) economic relief package announced in Japan as ofDecember 8, 2020, by operation phase (in trillion Japanese yen)
Coronavirus (COVID-19) economic relief package in December Japan 2020, by operation
Stimulus package in trillion Japanese yen
Scale of operation
Government fiscal spending
0
10
20
30
40
50
60
6
1. Containment measures for COVID-19
5,9
51,7
2. Promoting structural change and positive economic cycles for post pandemic
18,4
5,9
3. Securing safety and relief with respect to disaster management
5,6
5
4.1 Proper and timely implementation of reserve fund (in fiscal 2020)
5
5
4.2 Proper and timely implementation of reserve fund (in fiscal 2021)
5
25
Note(s): Japan; December 8, 2020; the Japanese fiscal years run from April 1 of the stated year to March 31 of the following year
Further information regarding this statistic can be found on page 68.
Source(s): Cabinet Office Japan; ID 1245915
Government measures
32.
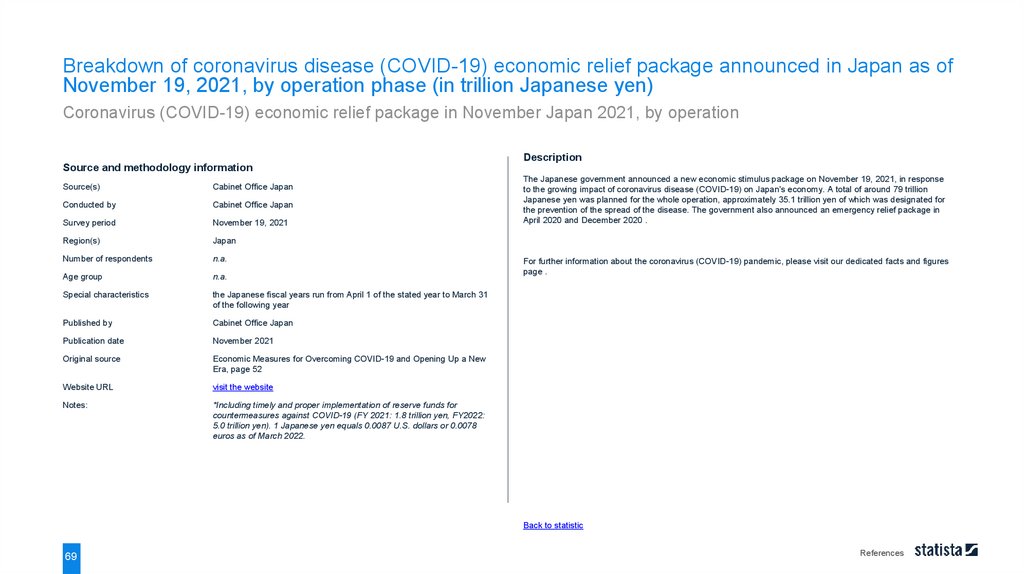
Breakdown of coronavirus disease (COVID-19) economic relief package announced in Japan as ofNovember 19, 2021, by operation phase (in trillion Japanese yen)
Coronavirus (COVID-19) economic relief package in November Japan 2021, by operation
Stimulus package in trillion Japanese yen
Scale of operation
Government fiscal spending
0
5
10
15
20
25
30
35
40
35,1
1. Preventing the spread of COVID-19
22,1
10,7
2, Resuming socio-economic activities in the "coexisting with COVID-19" environment and
preparing for the next crisis*
9,2
28,2
3. Launching "New Form of Capitalism" to open up a future society
19,8
4. Ensuring safety and security through promotion of disaster risk reduction and
enhancement of national resilience, etc
26
5
4,6
Note(s): Japan; November 19, 2021; the Japanese fiscal years run from April 1 of the stated year to March 31 of the following year
Further information regarding this statistic can be found on page 69.
Source(s): Cabinet Office Japan; ID 1297987
Government measures
33.
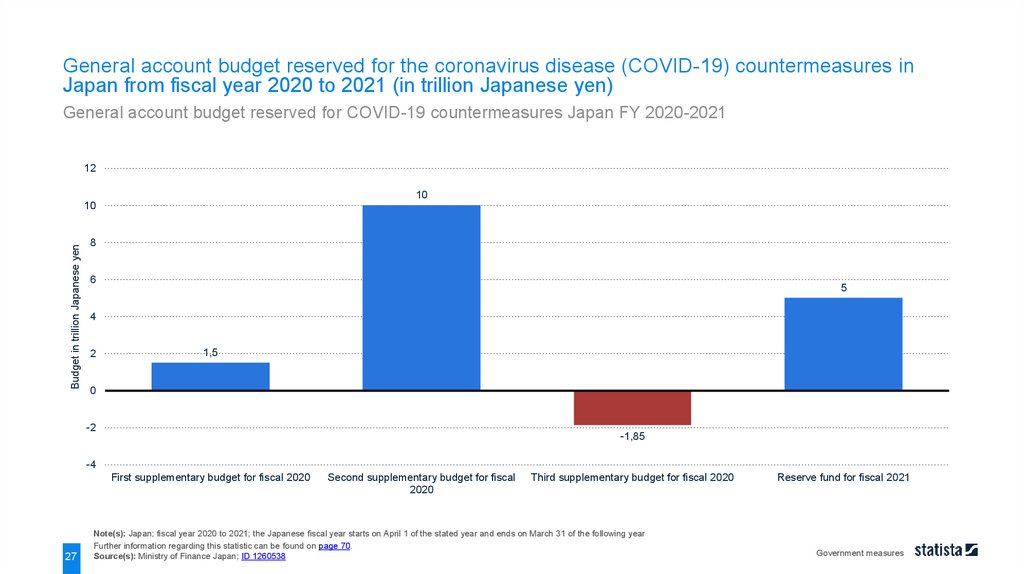
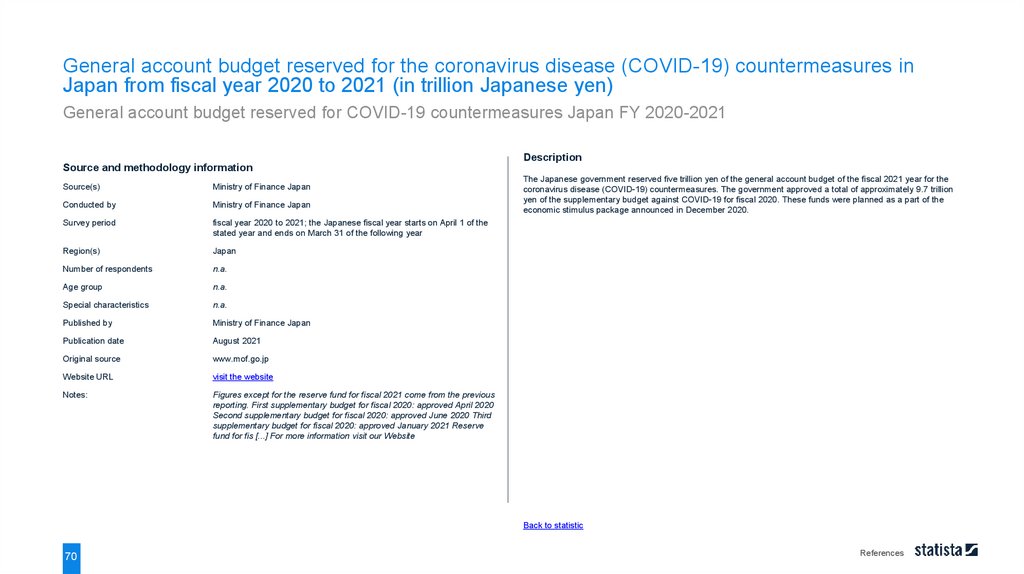
General account budget reserved for the coronavirus disease (COVID-19) countermeasures inJapan from fiscal year 2020 to 2021 (in trillion Japanese yen)
General account budget reserved for COVID-19 countermeasures Japan FY 2020-2021
12
10
Budget in trillion Japanese yen
10
8
6
5
4
2
1,5
0
-2
-1,85
-4
First supplementary budget for fiscal 2020
27
Second supplementary budget for fiscal
2020
Third supplementary budget for fiscal 2020
Note(s): Japan; fiscal year 2020 to 2021; the Japanese fiscal year starts on April 1 of the stated year and ends on March 31 of the following year
Further information regarding this statistic can be found on page 70.
Source(s): Ministry of Finance Japan; ID 1260538
Reserve fund for fiscal 2021
Government measures
34.
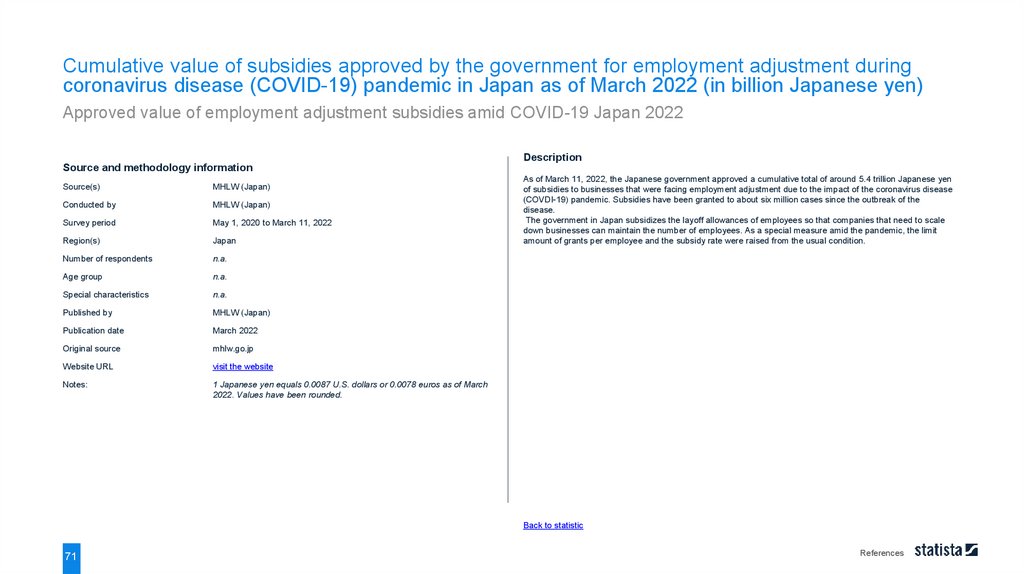
Cumulative value of subsidies approved by the government for employment adjustment duringcoronavirus disease (COVID-19) pandemic in Japan as of March 2022 (in billion Japanese yen)
Approved value of employment adjustment subsidies amid COVID-19 Japan 2022
28
Note(s): Japan; May 1, 2020 to March 11, 2022
Further information regarding this statistic can be found on page 71.
Source(s): MHLW (Japan); ID 1245395
Government measures
Mar 4 '22
Feb 18 '22
Feb 4 '22
Jan 21 '22
Jan 7 '22
Dec 24 '21
Dec 10 '21
Nov 26 '21
Nov 12 '21
Oct 29 '21
Oct 15 '21
Oct 1 '21
Sep 17 '21
Sep 3 '21
Aug 20 '21
Aug 6 '21
Jul 23 '21
Jul 9 '21
Jun 25 '21
Jun 11 '21
May 28 '21
Apr 30 '21
May 14 '21
Apr 16 '21
Mar 31 '21
Mar 19 '21
Mar 5 '21
Feb 19 '21
Feb 5 '21
Jan 22 '21
Jan 8 '21
Dec 25 '20
Dec 11 '20
Nov 27 '20
Nov 13 '20
Oct 30 '20
Oct 16 '20
Oct 2 '20
Sep 18 '20
Sep 4 '20
Aug 21 '20
Aug 7 '20
Jul 24 '20
Jul 10 '20
Jun 26 '20
Jun 12 '20
May 29 '20
May 15 '20
444,12
5
416,35
5
391,15
5
372,33
5
347,01
5
322,14
5
289,81
5
256,37
5187,5
219,78
5
5
153,77
5
133,74
5
087,69
5
046,25
4
993,48
4
941,37
4
904,97
4
851,37
4
799,48
4
754,6
4
709,11
5 000
4
653,99
4
600,16
4
550,95
4
498,06
4
465,44
4
406,55
4
348,14
4
286,11
4
232,38
4
173,45
4
124,56
4012,5
070,59
4
3
982,58
3
929,64
3
882,58
3
836,16
3
782,63
3
727,66
4 000
3
666,93
3
601,28
3
529,06
3
461,18
3
399,34
3
368,64
3
317,37
3
261,71
3
216,74
3 155,5
3
127,17
3
079,05
027,88
23 968
2
919,79
2
878,27
2
820,98
2
765,83
2
710,66
3 000
2
656,87
2
604,17
2
573,29
2
517,48
2
509,32
2
463,72
2
400,61
2
352,54
2
296,56
2
256,16
2
189,23
2
105,04
2
035,93
1
948,88
1
861,66
1
757,09
2 000
1
641,34
1
526,56
1
448,31
1
344,59
1 236,04
1 091,46
994,13
861,55
739,98
1 000
585,18
423,57
350,38
256,57
180,99
136,25
92,35
56,35
32,51
,11
1,064918,37
0,28
0
May 1 '20
Subsidies in billion Japanese yen
6 000
35.
CORONAVIRUS (COVID-19) IN JAPANAffected business
36.
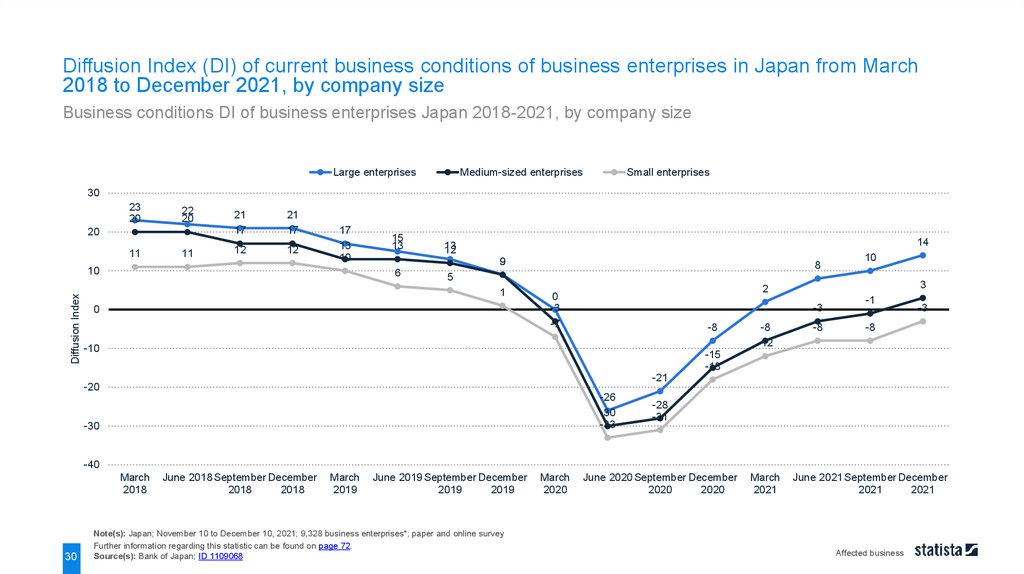
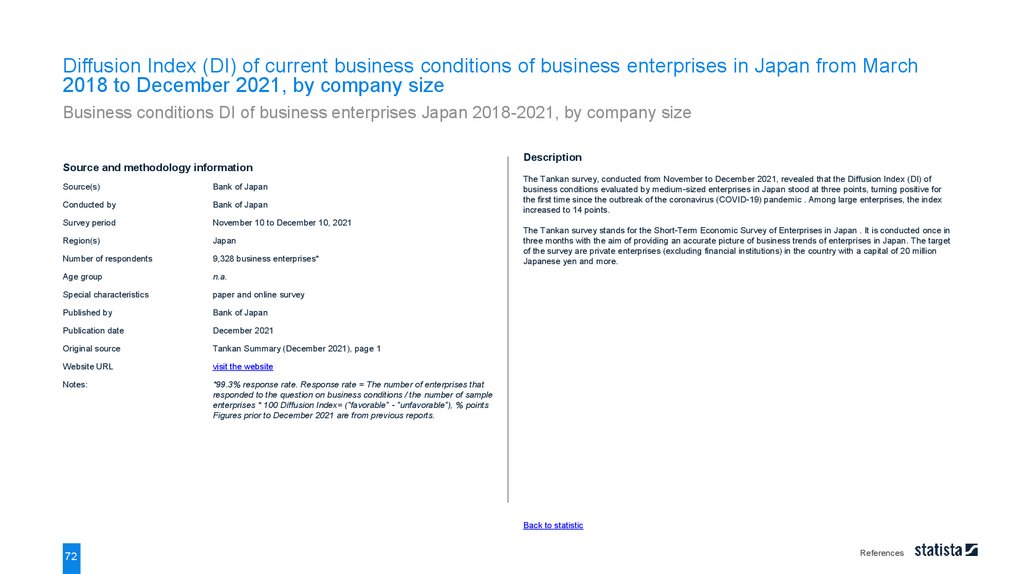
Diffusion Index (DI) of current business conditions of business enterprises in Japan from March2018 to December 2021, by company size
Business conditions DI of business enterprises Japan 2018-2021, by company size
Large enterprises
Medium-sized enterprises
Small enterprises
30
23
20
22
20
20
11
11
21
17
21
17
12
12
17
13
10
Diffusion Index
10
15
13
14
13
12
9
6
8
10
5
1
0
3
2
0
-3
-7
-3
-8
-10
-8
-12
-8
-1
-3
-8
-15
-18
-21
-20
-26
-30
-33
-30
-28
-31
-40
March
2018
30
June 2018 September December
2018
2018
March
2019
June 2019 September December
2019
2019
Note(s): Japan; November 10 to December 10, 2021; 9,328 business enterprises*; paper and online survey
Further information regarding this statistic can be found on page 72.
Source(s): Bank of Japan; ID 1109068
March
2020
June 2020 September December
2020
2020
March
2021
June 2021 September December
2021
2021
Affected business
37.
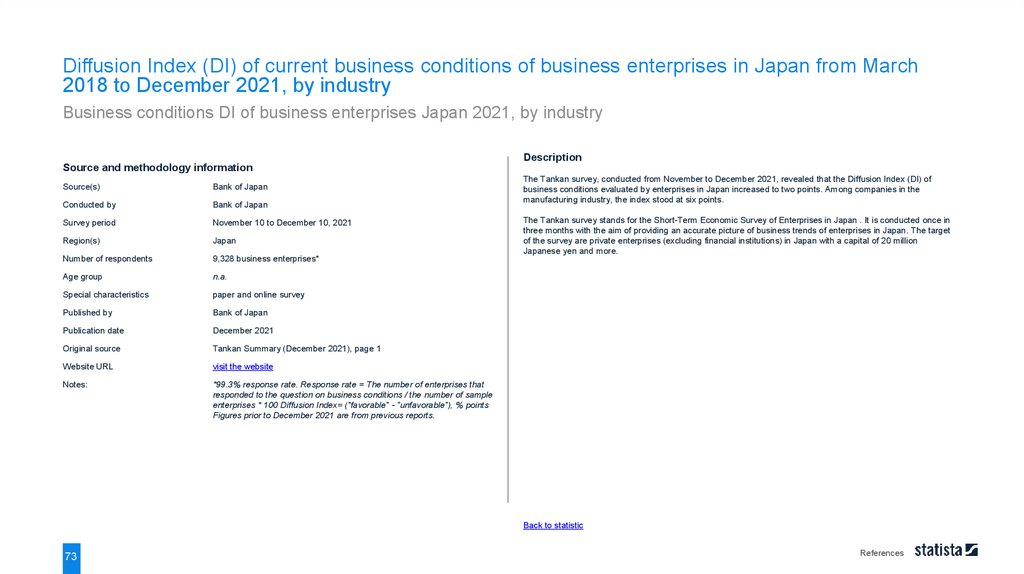
Diffusion Index (DI) of current business conditions of business enterprises in Japan from March2018 to December 2021, by industry
Business conditions DI of business enterprises Japan 2021, by industry
All industries
Manufacturing
Nonmanufacturing
30
20
18
17
15
17
16
15
16
15
14
16
15
15
12
14
10
7
10
14
11
8
Diffusion Index
2
1
-1
0
5
4
3
-4
-4
-11
-15
-12
-10
-21
-20
-6
-8
-9
-3
-7
-2
6
2
0
-7
-20
-25
-28
-31
-30
-39
-37
-40
-50
March
2018
31
June 2018 September December
2018
2018
March
2019
June 2019 September December
2019
2019
Note(s): Japan; November 10 to December 10, 2021; 9,328 business enterprises*; paper and online survey
Further information regarding this statistic can be found on page 73.
Source(s): Bank of Japan; ID 1108981
March
2020
June 2020 September December
2020
2020
March
2021
June 2021 September December
2021
2021
Affected business
38.
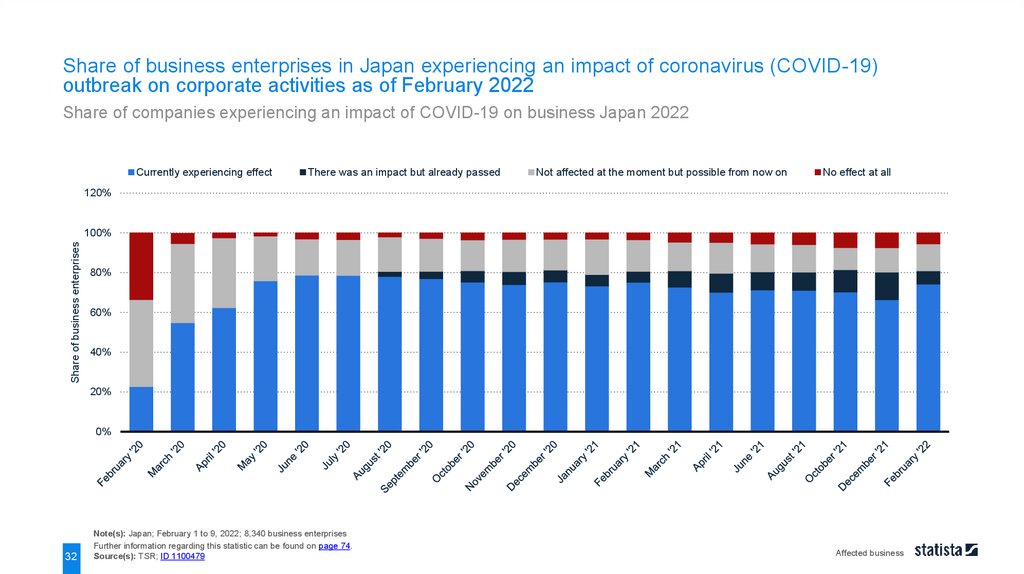
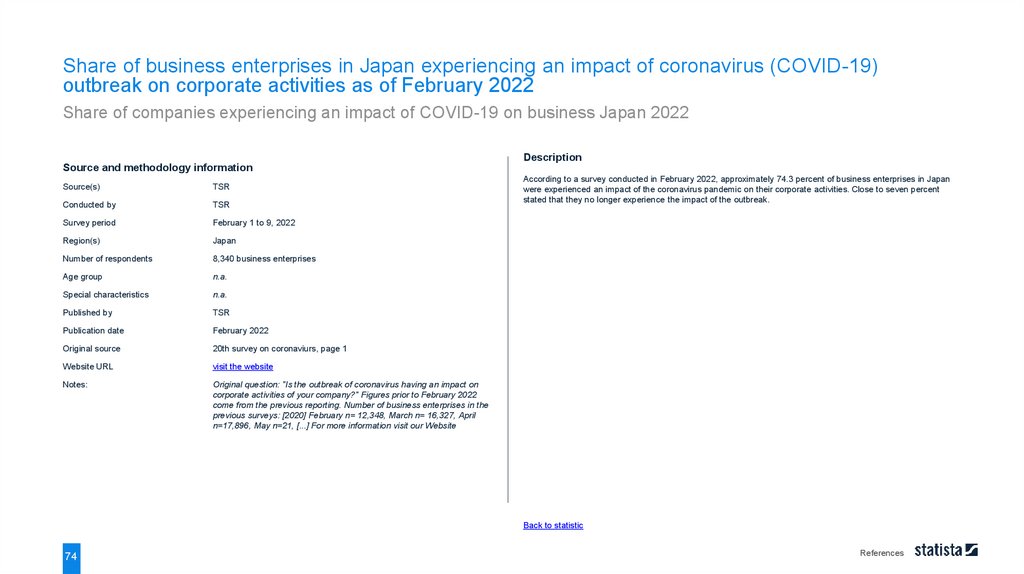
Share of business enterprises in Japan experiencing an impact of coronavirus (COVID-19)outbreak on corporate activities as of February 2022
Share of companies experiencing an impact of COVID-19 on business Japan 2022
Currently experiencing effect
There was an impact but already passed
Not affected at the moment but possible from now on
No effect at all
120%
Share of business enterprises
100%
80%
60%
40%
20%
0%
32
Note(s): Japan; February 1 to 9, 2022; 8,340 business enterprises
Further information regarding this statistic can be found on page 74.
Source(s): TSR; ID 1100479
Affected business
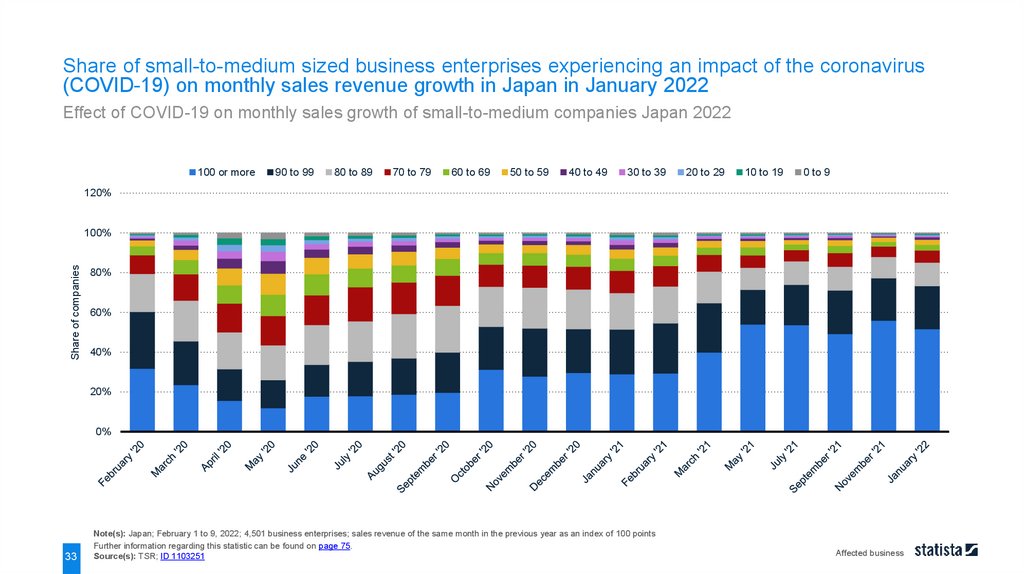
39.
Share of small-to-medium sized business enterprises experiencing an impact of the coronavirus(COVID-19) on monthly sales revenue growth in Japan in January 2022
Effect of COVID-19 on monthly sales growth of small-to-medium companies Japan 2022
100 or more
90 to 99
80 to 89
70 to 79
60 to 69
50 to 59
40 to 49
30 to 39
20 to 29
10 to 19
0 to 9
120%
Share of companies
100%
80%
60%
40%
20%
0%
33
Note(s): Japan; February 1 to 9, 2022; 4,501 business enterprises; sales revenue of the same month in the previous year as an index of 100 points
Further information regarding this statistic can be found on page 75.
Source(s): TSR; ID 1103251
Affected business
40.
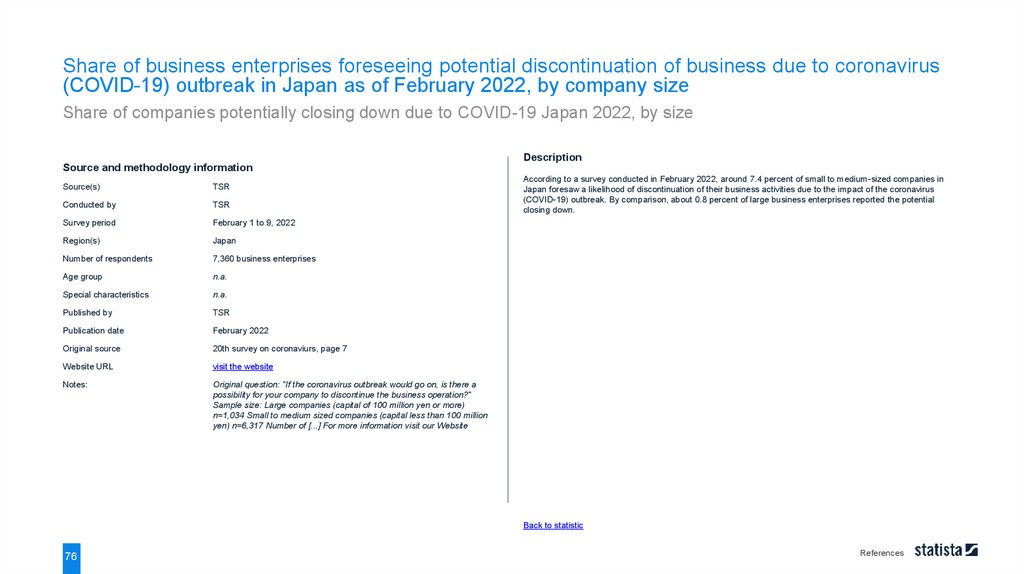
Share of business enterprises foreseeing potential discontinuation of business due to coronavirus(COVID-19) outbreak in Japan as of February 2022, by company size
Share of companies potentially closing down due to COVID-19 Japan 2022, by size
Large companies
Small to medium sized companies
All companies
10,0%
9,0%
8,51%
8,82%
8,62%
8,08%
8,0%
7,31%
7,54%
7,39%
6,58%
Share of companies
7,0%
8,28%
8,13%
7,81%
7,69%
6,86%
6,96%
7,31%
6,77%
6,86%
7,63%
7,36%
7,17%
6,59%
6,35%
6,85%
6,44%
5,88%
6,0%
6,42%
5,88%
5,51%
5,0%
4,0%
3,0%
2,0%
1,07%
1,24%
1,06%
0,95%
1,0%
0,74%
1,06%
1,11%
1,44%
1,01%
0,88%
1,19%
0,77%
1,05%
0,76%
0,0%
August '20 September October '20 November December January '21 February
'20
'20
'20
'21
34
Note(s): Japan; February 1 to 9, 2022; 7,360 business enterprises
Further information regarding this statistic can be found on page 76.
Source(s): TSR; ID 1209483
March '21
April '21
June '21
August '21 October '21 December
'21
February
'22
Affected business
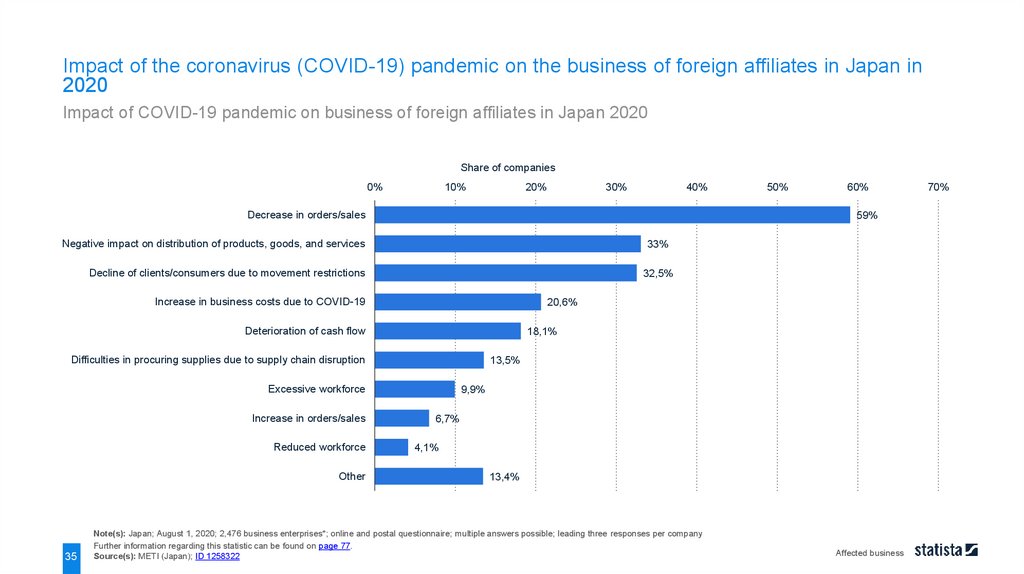
41.
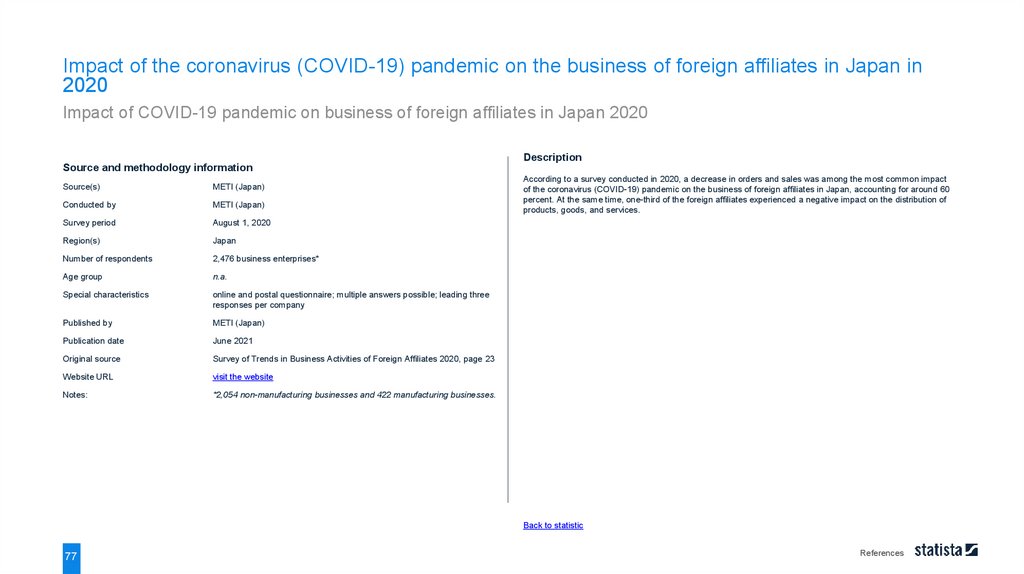
Impact of the coronavirus (COVID-19) pandemic on the business of foreign affiliates in Japan in2020
Impact of COVID-19 pandemic on business of foreign affiliates in Japan 2020
Share of companies
0%
10%
20%
30%
40%
Decrease in orders/sales
33%
Decline of clients/consumers due to movement restrictions
32,5%
Increase in business costs due to COVID-19
20,6%
Deterioration of cash flow
18,1%
Difficulties in procuring supplies due to supply chain disruption
13,5%
Excessive workforce
Reduced workforce
Other
35
60%
59%
Negative impact on distribution of products, goods, and services
Increase in orders/sales
50%
9,9%
6,7%
4,1%
13,4%
Note(s): Japan; August 1, 2020; 2,476 business enterprises*; online and postal questionnaire; multiple answers possible; leading three responses per company
Further information regarding this statistic can be found on page 77.
Source(s): METI (Japan); ID 1258322
Affected business
70%
42.
CORONAVIRUS (COVID-19) IN JAPANBankruptcy and dismissal
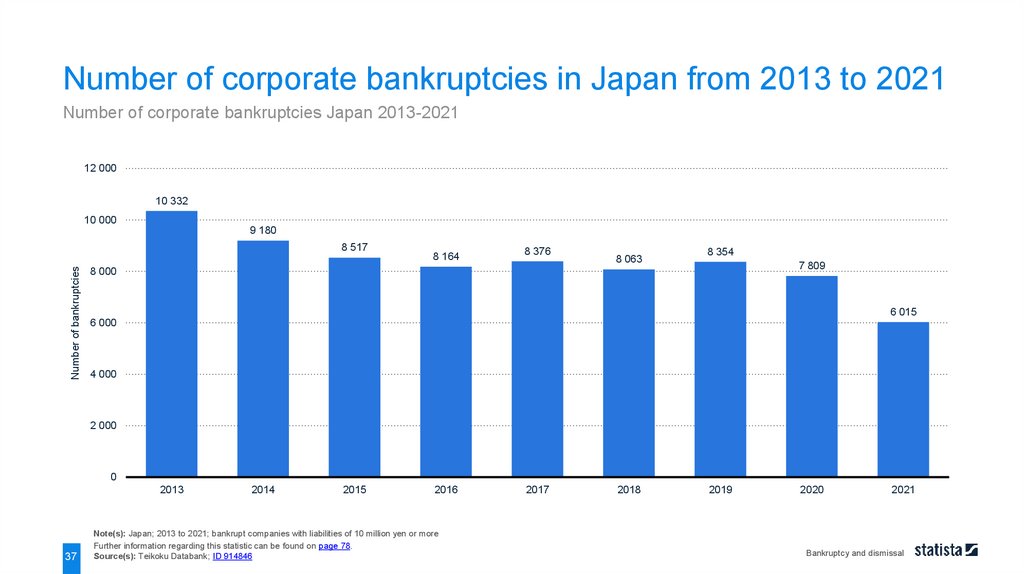
43.
Number of corporate bankruptcies in Japan from 2013 to 2021Number of corporate bankruptcies Japan 2013-2021
12 000
10 332
10 000
9 180
Number of bankruptcies
8 517
8 164
8 376
8 063
8 354
7 809
8 000
6 015
6 000
4 000
2 000
0
2013
37
2014
2015
2016
Note(s): Japan; 2013 to 2021; bankrupt companies with liabilities of 10 million yen or more
Further information regarding this statistic can be found on page 78.
Source(s): Teikoku Databank; ID 914846
2017
2018
2019
2020
2021
Bankruptcy and dismissal
44.
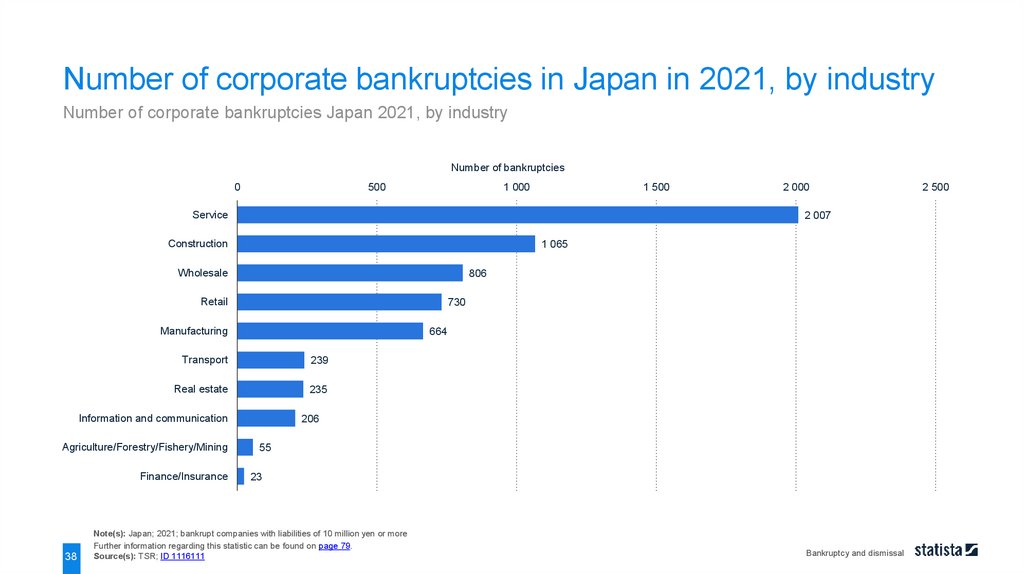
Number of corporate bankruptcies in Japan in 2021, by industryNumber of corporate bankruptcies Japan 2021, by industry
Number of bankruptcies
0
500
1 000
1 500
Service
2 007
Construction
1 065
Wholesale
806
Retail
730
Manufacturing
664
Transport
239
Real estate
235
Information and communication
Agriculture/Forestry/Fishery/Mining
Finance/Insurance
38
2 000
206
55
23
Note(s): Japan; 2021; bankrupt companies with liabilities of 10 million yen or more
Further information regarding this statistic can be found on page 79.
Source(s): TSR; ID 1116111
Bankruptcy and dismissal
2 500
45.
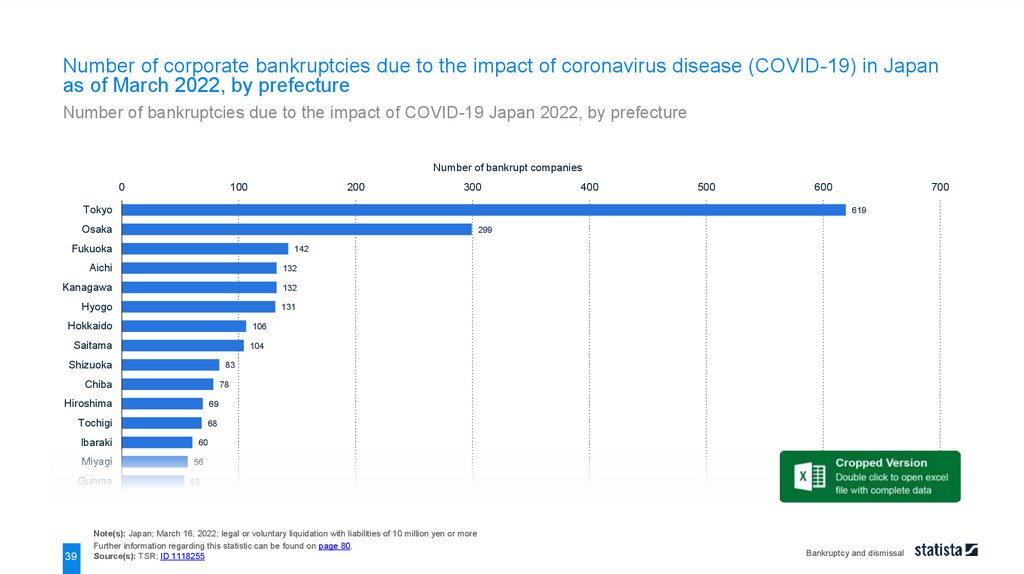
Number of corporate bankruptcies due to the impact of coronavirus disease (COVID-19) in Japanas of March 2022, by prefecture
Number of bankruptcies due to the impact of COVID-19 Japan 2022, by prefecture
Number of bankrupt companies
0
100
200
300
Tokyo
132
Kanagawa
132
Hyogo
131
Hokkaido
106
Saitama
104
Shizuoka
83
Chiba
78
Hiroshima
69
Tochigi
68
39
700
142
Aichi
Gunma
600
299
Fukuoka
Miyagi
500
619
Osaka
Ibaraki
400
60
56
53
Note(s): Japan; March 16, 2022; legal or voluntary liquidation with liabilities of 10 million yen or more
Further information regarding this statistic can be found on page 80.
Source(s): TSR; ID 1118255
Bankruptcy and dismissal
46.
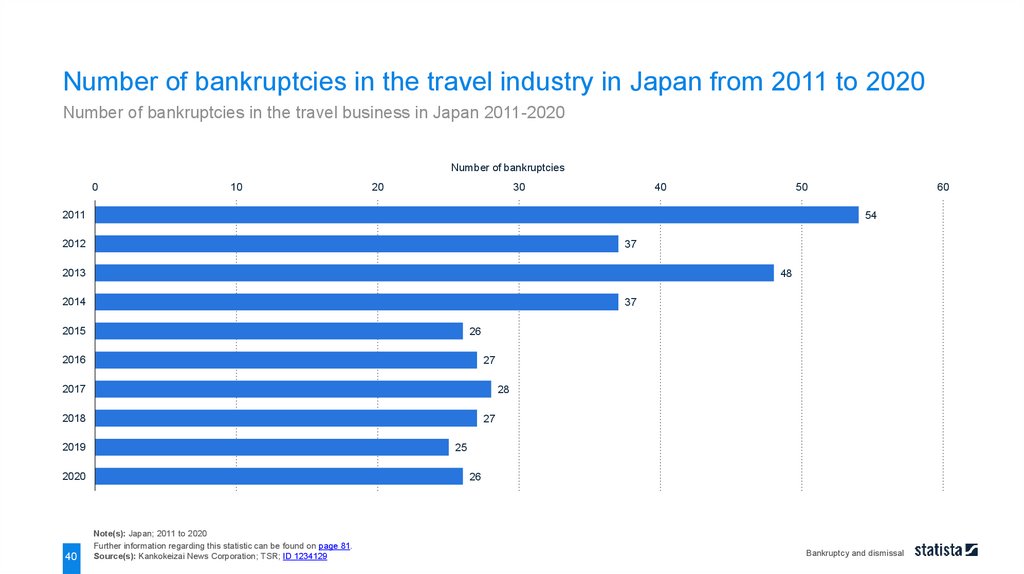
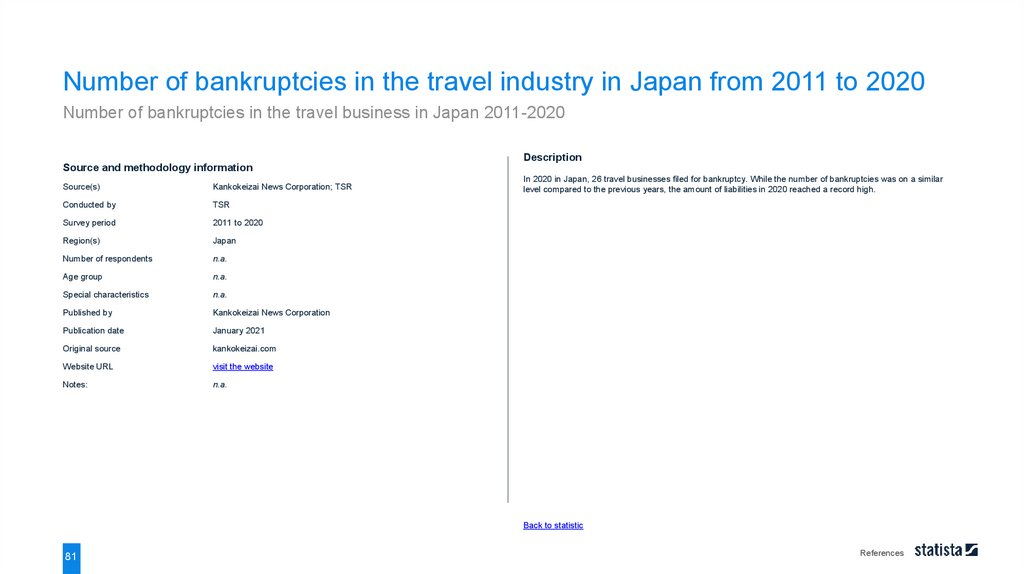
Number of bankruptcies in the travel industry in Japan from 2011 to 2020Number of bankruptcies in the travel business in Japan 2011-2020
Number of bankruptcies
0
10
20
30
40
50
2011
54
2012
37
2013
48
2014
37
2015
26
2016
27
2017
28
2018
27
2019
25
2020
40
60
26
Note(s): Japan; 2011 to 2020
Further information regarding this statistic can be found on page 81.
Source(s): Kankokeizai News Corporation; TSR; ID 1234129
Bankruptcy and dismissal
47.
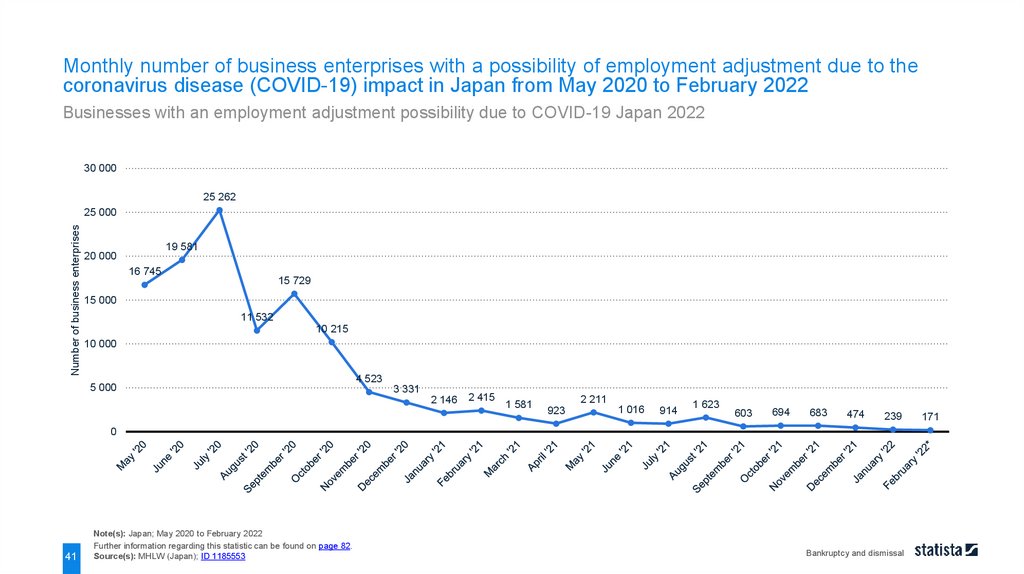
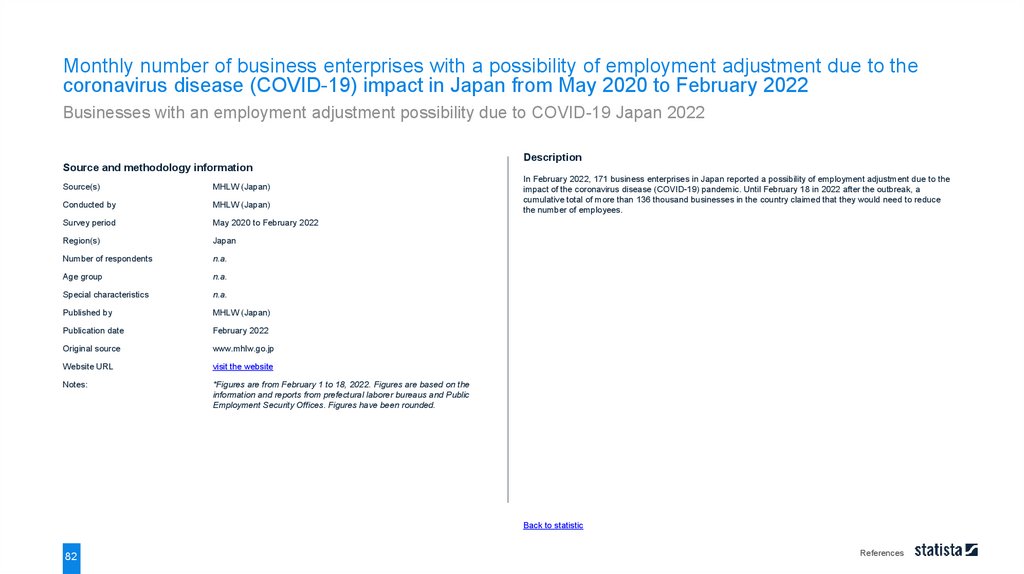
Monthly number of business enterprises with a possibility of employment adjustment due to thecoronavirus disease (COVID-19) impact in Japan from May 2020 to February 2022
Businesses with an employment adjustment possibility due to COVID-19 Japan 2022
30 000
25 262
Number of business enterprises
25 000
19 581
20 000
16 745
15 729
15 000
11 532
10 215
10 000
5 000
4 523
3 331
2 146
2 415
1 581
2 211
923
1 016
914
1 623
603
694
683
474
239
0
41
Note(s): Japan; May 2020 to February 2022
Further information regarding this statistic can be found on page 82.
Source(s): MHLW (Japan); ID 1185553
Bankruptcy and dismissal
171
48.
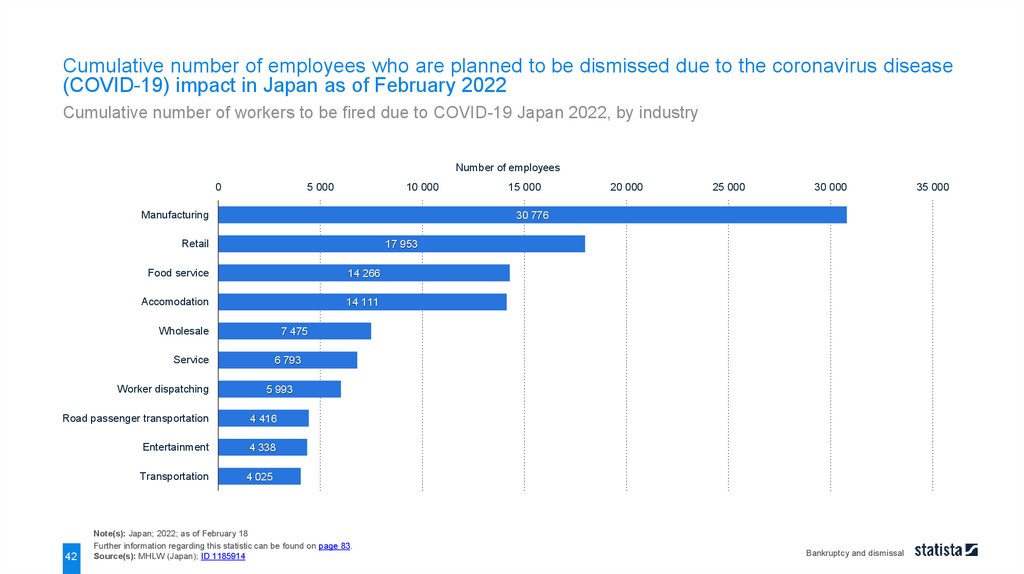
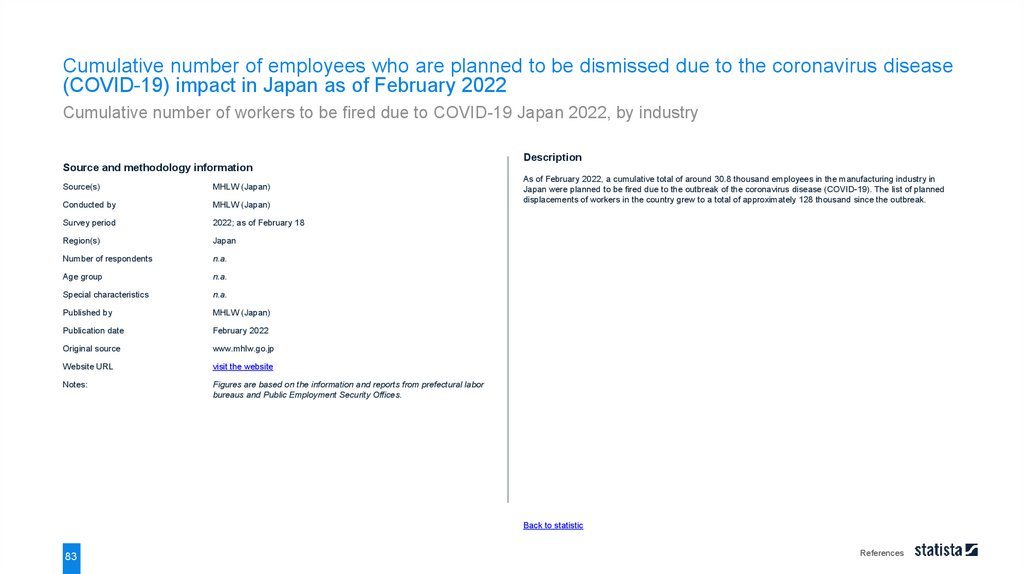
Cumulative number of employees who are planned to be dismissed due to the coronavirus disease(COVID-19) impact in Japan as of February 2022
Cumulative number of workers to be fired due to COVID-19 Japan 2022, by industry
Number of employees
0
5 000
10 000
Manufacturing
25 000
30 000
17 953
Food service
14 266
Accomodation
14 111
Wholesale
7 475
Service
6 793
5 993
Road passenger transportation
4 416
Entertainment
4 338
Transportation
4 025
42
20 000
30 776
Retail
Worker dispatching
15 000
Note(s): Japan; 2022; as of February 18
Further information regarding this statistic can be found on page 83.
Source(s): MHLW (Japan); ID 1185914
Bankruptcy and dismissal
35 000
49.
CORONAVIRUS (COVID-19) IN JAPANPublic opinion
50.
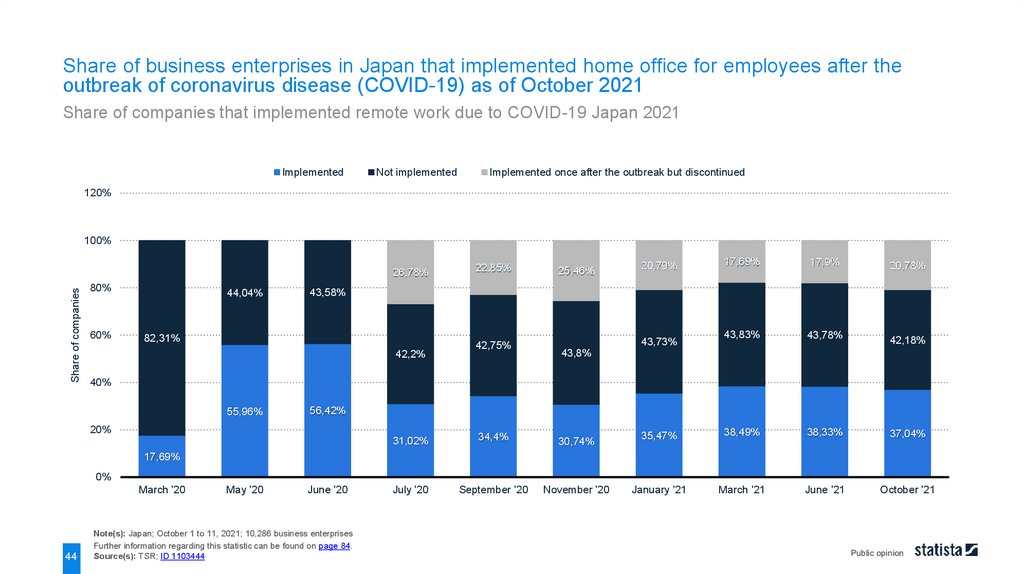
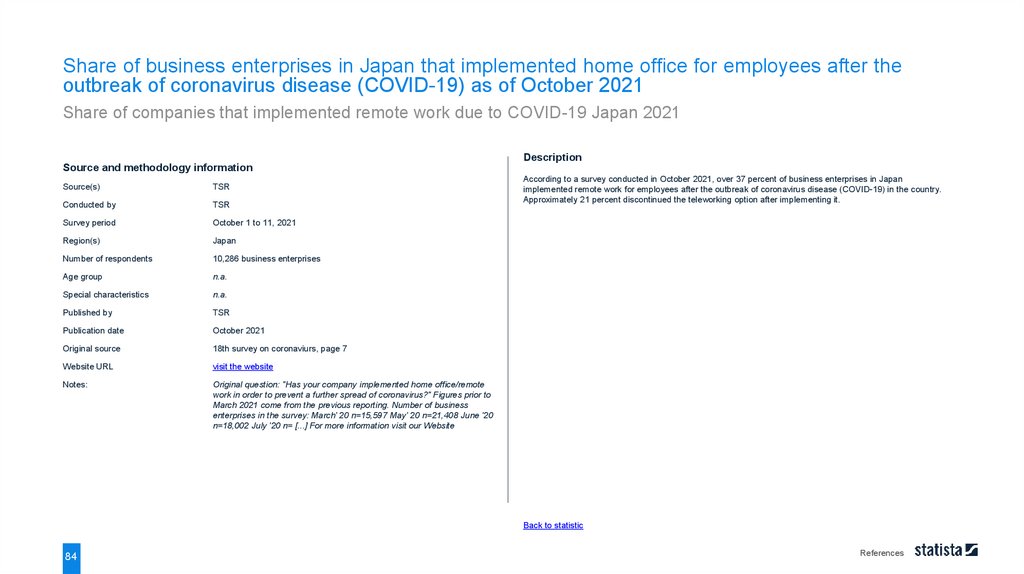
Share of business enterprises in Japan that implemented home office for employees after theoutbreak of coronavirus disease (COVID-19) as of October 2021
Share of companies that implemented remote work due to COVID-19 Japan 2021
Implemented
Not implemented
Implemented once after the outbreak but discontinued
120%
100%
Share of companies
26,78%
80%
60%
44,04%
22,85%
25,46%
17,69%
17,9%
20,78%
43,83%
43,78%
42,18%
35,47%
38,49%
38,33%
37,04%
January '21
March '21
June '21
October '21
20,79%
43,58%
82,31%
42,2%
42,75%
43,73%
43,8%
40%
55,96%
56,42%
20%
31,02%
34,4%
30,74%
July '20
September '20
November '20
17,69%
0%
March '20
44
May '20
June '20
Note(s): Japan; October 1 to 11, 2021; 10,286 business enterprises
Further information regarding this statistic can be found on page 84.
Source(s): TSR; ID 1103444
Public opinion
51.
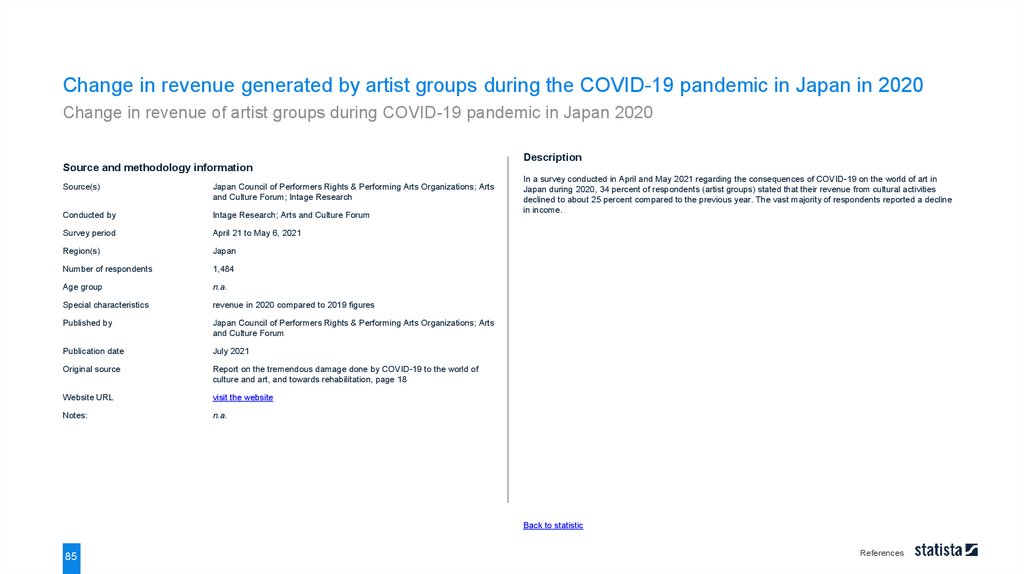
Change in revenue generated by artist groups during the COVID-19 pandemic in Japan in 2020Change in revenue of artist groups during COVID-19 pandemic in Japan 2020
40%
34%
35%
31,2%
Share of respondents
30%
25%
20%
16%
15%
10,9%
10%
5,9%
5%
2%
0%
Revenue from cultural
activities increased
45
Revenue from cultural
activities did not really
change
Revenue from cultural
activities declined to about
75 percent
Revenue from cultural
activities declined to about
50 percent
Note(s): Japan; April 21 to May 6, 2021; 1,484 respondents; revenue in 2020 compared to 2019 figures
Further information regarding this statistic can be found on page 85.
Source(s): Japan Council of Performers Rights & Performing Arts Organizations; Arts and Culture Forum; Intage Research; ID 1276562
Revenue from cultural
activities declined to about
25 percent
Revenue from cultural
activities was close to zero
Public opinion
52.
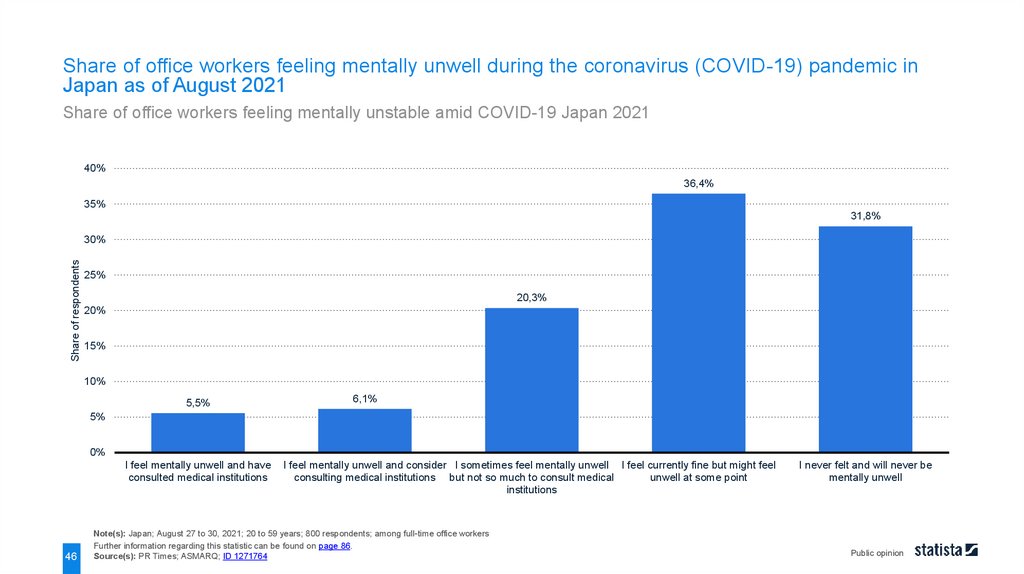
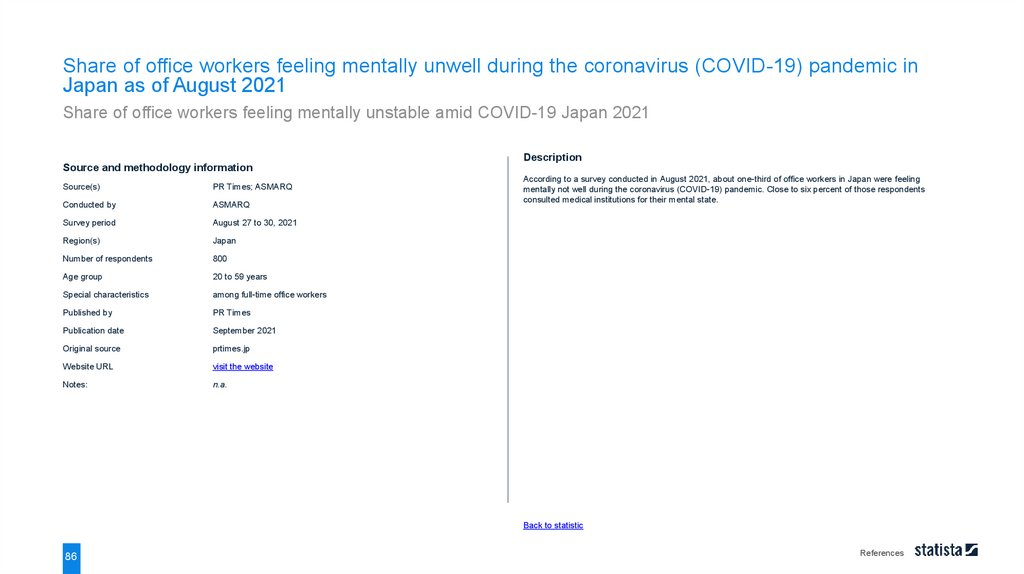
Share of office workers feeling mentally unwell during the coronavirus (COVID-19) pandemic inJapan as of August 2021
Share of office workers feeling mentally unstable amid COVID-19 Japan 2021
40%
36,4%
35%
31,8%
Share of respondents
30%
25%
20,3%
20%
15%
10%
5,5%
6,1%
5%
0%
I feel mentally unwell and have
consulted medical institutions
46
I feel mentally unwell and consider I sometimes feel mentally unwell I feel currently fine but might feel
consulting medical institutions but not so much to consult medical
unwell at some point
institutions
Note(s): Japan; August 27 to 30, 2021; 20 to 59 years; 800 respondents; among full-time office workers
Further information regarding this statistic can be found on page 86.
Source(s): PR Times; ASMARQ; ID 1271764
I never felt and will never be
mentally unwell
Public opinion
53.
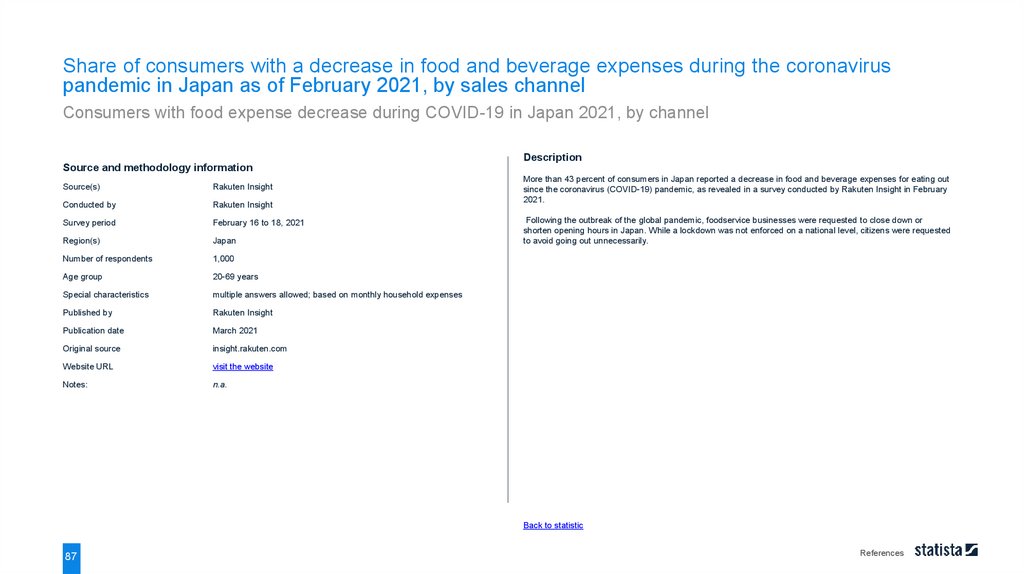
Share of consumers with a decrease in food and beverage expenses during the coronaviruspandemic in Japan as of February 2021, by sales channel
Consumers with food expense decrease during COVID-19 in Japan 2021, by channel
Share of respondents
0%
5%
10%
15%
20%
25%
30%
35%
Eating out
32,7%
Supermarkets and foodservice
7,8%
Takeout (alcohol)
6,2%
Takeout
5,6%
Supermarkets and foodservice (alcohol)
Delivery
47
45%
43,6%
Eating out (alcohol)
Delivery (alcohol)
40%
4,4%
2,8%
2,3%
Online (alcohol)
1,9%
Online
1,8%
Note(s): Japan; February 16 to 18, 2021; 20-69 years; 1,000 respondents; multiple answers allowed; based on monthly household expenses
Further information regarding this statistic can be found on page 87.
Source(s): Rakuten Insight; ID 1226358
Public opinion
50%
54.
CORONAVIRUS (COVID-19) IN JAPANReferences
55.
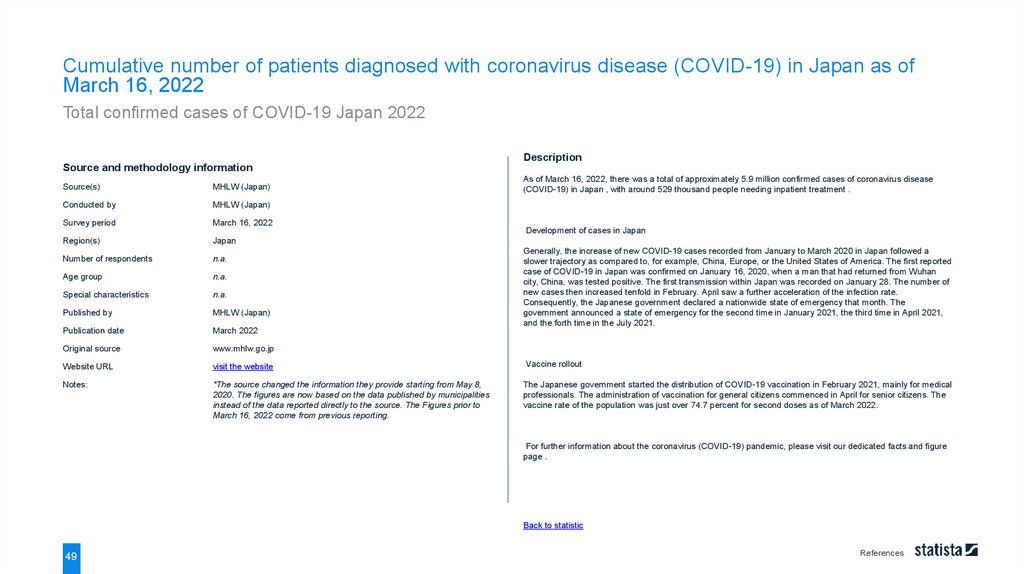
Cumulative number of patients diagnosed with coronavirus disease (COVID-19) in Japan as ofMarch 16, 2022
Total confirmed cases of COVID-19 Japan 2022
Description
Source and methodology information
As of March 16, 2022, there was a total of approximately 5.9 million confirmed cases of coronavirus disease
(COVID-19) in Japan , with around 529 thousand people needing inpatient treatment .
Source(s)
MHLW (Japan)
Conducted by
MHLW (Japan)
Survey period
March 16, 2022
Region(s)
Japan
Number of respondents
n.a.
Age group
n.a.
Special characteristics
n.a.
Published by
MHLW (Japan)
Publication date
March 2022
Original source
www.mhlw.go.jp
Website URL
visit the website
Vaccine rollout
Notes:
*The source changed the information they provide starting from May 8,
2020. The figures are now based on the data published by municipalities
instead of the data reported directly to the source. The Figures prior to
March 16, 2022 come from previous reporting.
The Japanese government started the distribution of COVID-19 vaccination in February 2021, mainly for medical
professionals. The administration of vaccination for general citizens commenced in April for senior citizens. The
vaccine rate of the population was just over 74.7 percent for second doses as of March 2022.
Development of cases in Japan
Generally, the increase of new COVID-19 cases recorded from January to March 2020 in Japan followed a
slower trajectory as compared to, for example, China, Europe, or the United States of America. The first reported
case of COVID-19 in Japan was confirmed on January 16, 2020, when a man that had returned from Wuhan
city, China, was tested positive. The first transmission within Japan was recorded on January 28. The number of
new cases then increased tenfold in February. April saw a further acceleration of the infection rate.
Consequently, the Japanese government declared a nationwide state of emergency that month. The
government announced a state of emergency for the second time in January 2021, the third time in April 2021,
and the forth time in the July 2021.
For further information about the coronavirus (COVID-19) pandemic, please visit our dedicated facts and figure
page .
Back to statistic
49
References
56.
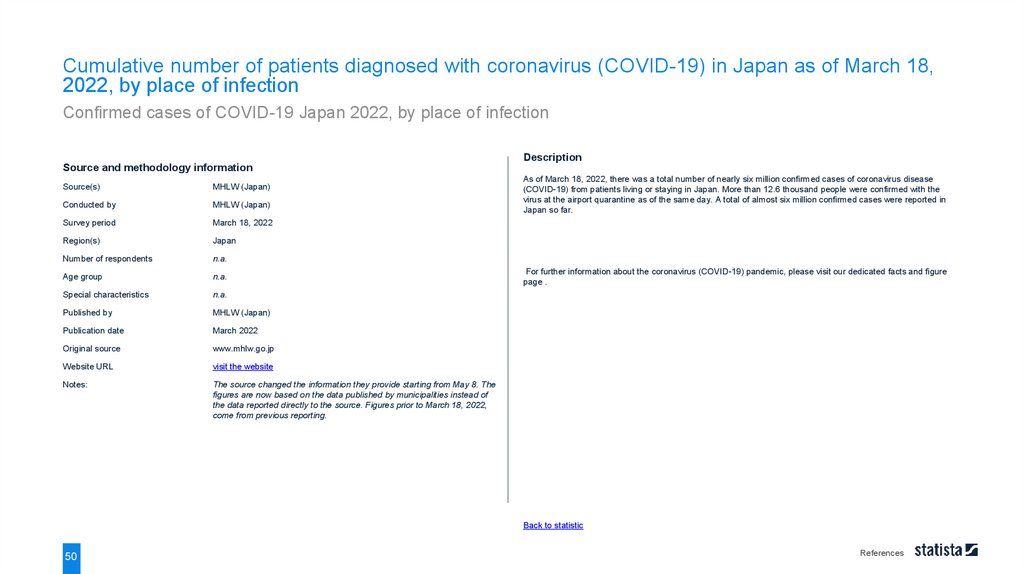
Cumulative number of patients diagnosed with coronavirus (COVID-19) in Japan as of March 18,2022, by place of infection
Confirmed cases of COVID-19 Japan 2022, by place of infection
Description
Source and methodology information
Source(s)
MHLW (Japan)
Conducted by
MHLW (Japan)
Survey period
March 18, 2022
Region(s)
Japan
Number of respondents
n.a.
Age group
n.a.
Special characteristics
n.a.
Published by
MHLW (Japan)
Publication date
March 2022
Original source
www.mhlw.go.jp
Website URL
visit the website
Notes:
The source changed the information they provide starting from May 8. The
figures are now based on the data published by municipalities instead of
the data reported directly to the source. Figures prior to March 18, 2022,
come from previous reporting.
As of March 18, 2022, there was a total number of nearly six million confirmed cases of coronavirus disease
(COVID-19) from patients living or staying in Japan. More than 12.6 thousand people were confirmed with the
virus at the airport quarantine as of the same day. A total of almost six million confirmed cases were reported in
Japan so far.
For further information about the coronavirus (COVID-19) pandemic, please visit our dedicated facts and figure
page .
Back to statistic
50
References
57.
Cumulative number of coronavirus-positive (COVID-19) patients in Japan as of March 16, 2022, bystate of health
Number of COVID-19 patients Japan 2022, by state of health
Description
Source and methodology information
Source(s)
MHLW (Japan)
Conducted by
MHLW (Japan)
Survey period
March 16, 2022
Region(s)
Japan
Number of respondents
n.a.
Age group
n.a.
Special characteristics
n.a.
Published by
MHLW (Japan)
Publication date
March 2022
Original source
covid19.mhlw.go.jp
Website URL
visit the website
Notes:
*The source changed the information they provide starting from May 8,
2020. The figures are now based on the data published by municipalities
instead of the data reported directly to the source. **Figures of "need
inpatient treatment" from March 29 to May 8, 2020 included cases which
were still unde [...] For more information visit our Website
As of March 16, 2022, around 522 thousand patients in Japan with coronavirus disease (COVID-19) were being
hospitalized or waiting to be hospitalized, while the total number of death reached nearly 26.6 thousand. On the
same day, the total number of confirmed cases with the virus in the country amounted to around 5.9 million.
For further information about the coronavirus (COVID-19) pandemic, please visit our dedicated facts and figure
page .
Back to statistic
51
References
58.
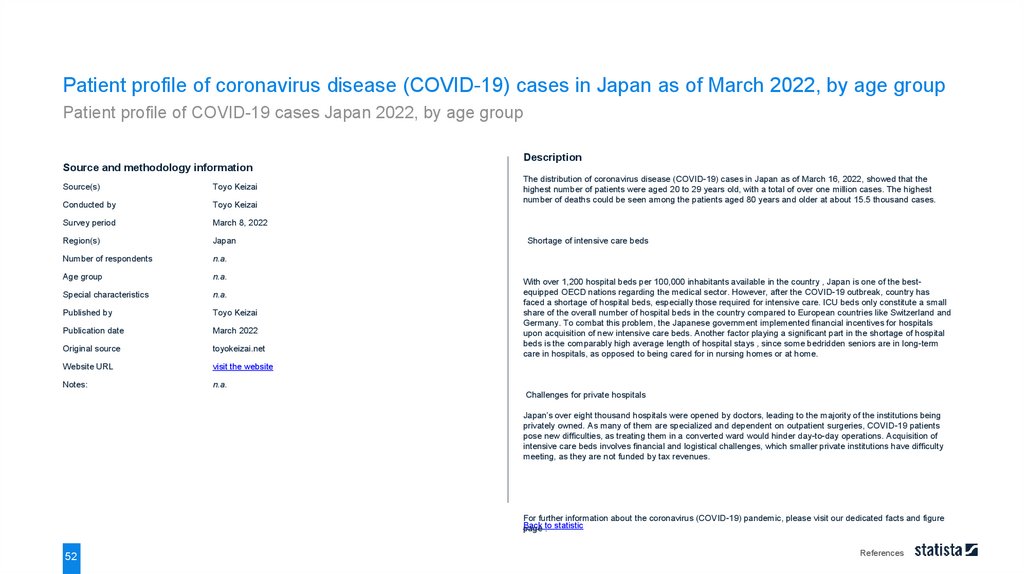
Patient profile of coronavirus disease (COVID-19) cases in Japan as of March 2022, by age groupPatient profile of COVID-19 cases Japan 2022, by age group
Description
Source and methodology information
Source(s)
Toyo Keizai
Conducted by
Toyo Keizai
Survey period
March 8, 2022
Region(s)
Japan
Number of respondents
n.a.
Age group
n.a.
Special characteristics
n.a.
Published by
Toyo Keizai
Publication date
March 2022
Original source
toyokeizai.net
Website URL
visit the website
Notes:
n.a.
The distribution of coronavirus disease (COVID-19) cases in Japan as of March 16, 2022, showed that the
highest number of patients were aged 20 to 29 years old, with a total of over one million cases. The highest
number of deaths could be seen among the patients aged 80 years and older at about 15.5 thousand cases.
Shortage of intensive care beds
With over 1,200 hospital beds per 100,000 inhabitants available in the country , Japan is one of the bestequipped OECD nations regarding the medical sector. However, after the COVID-19 outbreak, country has
faced a shortage of hospital beds, especially those required for intensive care. ICU beds only constitute a small
share of the overall number of hospital beds in the country compared to European countries like Switzerland and
Germany. To combat this problem, the Japanese government implemented financial incentives for hospitals
upon acquisition of new intensive care beds. Another factor playing a significant part in the shortage of hospital
beds is the comparably high average length of hospital stays , since some bedridden seniors are in long-term
care in hospitals, as opposed to being cared for in nursing homes or at home.
Challenges for private hospitals
Japan’s over eight thousand hospitals were opened by doctors, leading to the majority of the institutions being
privately owned. As many of them are specialized and dependent on outpatient surgeries, COVID-19 patients
pose new difficulties, as treating them in a converted ward would hinder day-to-day operations. Acquisition of
intensive care beds involves financial and logistical challenges, which smaller private institutions have difficulty
meeting, as they are not funded by tax revenues.
For further information about the coronavirus (COVID-19) pandemic, please visit our dedicated facts and figure
Back
page to
. statistic
52
References
59.
New cases of coronavirus disease (COVID-19) confirmed by day in Japan from January 16, 2020to March 16, 2022
New confirmed cases of COVID-19 by day Japan 2022
Description
Source and methodology information
Source(s)
MHLW (Japan)
Conducted by
MHLW (Japan)
Survey period
January 16, 2020 to March 16, 2022
Region(s)
Japan
Number of respondents
n.a.
Age group
n.a.
Special characteristics
n.a.
Published by
MHLW (Japan)
Publication date
March 2022
Original source
www.mhlw.go.jp
Website URL
visit the website
Notes:
The figures do not include cases that confirmation date is under
investigation.
On March 16, 2021, approximately 57.8 thousand coronavirus disease (COVID-19) were newly confirmed in
Japan. New cases have been reported every day since February 11, 2020.
For further information about the coronavirus (COVID-19) pandemic, please visit our dedicated facts and figure
page .
Back to statistic
53
References
60.
Cumulative number of people undergoing polymerase chain reaction (PCR) tests for coronavirus(COVID-19) in Japan as of March 18, 2022, by type of patients
Number of people undergoing COVID-19 tests Japan 2022, by type of patients
Description
Source and methodology information
Source(s)
MHLW (Japan)
Conducted by
MHLW (Japan)
Survey period
March 18, 2022
Region(s)
Japan
Number of respondents
n.a.
Age group
n.a.
Special characteristics
n.a.
Published by
MHLW (Japan)
Publication date
March 2022
Original source
www.mhlw.go.jp
Website URL
visit the website
Notes:
*The number was corrected on March 19 because Chiba Prefecture was
counting the number of tests conducted instead of number of people
undergoing the tests. **The source changed the information they provide
starting from May 8. The figures are now based on the data published by
municipalities instead [...] For more information visit our Website
As of March 18, 2022, a total of around 41.7 million people in Japan underwent polymerase chain reaction
(PCR) tests for coronavirus (COVID-19) , of which about 40 million tests were for patients within the country. As
of the same day, a total of approximately six million cases were confirmed positive with the virus .
According to the source, number of PCR tests conducted in the national institute of infectious diseases and local
institutes of health in the country amounted to roughly 57.9 million cases as of March 16, 2022.
For further information about the coronavirus (COVID-19) pandemic, please visit our dedicated facts and figure
page .
Back to statistic
54
References
61.
Number of coronavirus-positive (COVID-19) patients and number of deaths in Japan as of March17, 2022, by prefecture
COVID-19 patients and number of death Japan 2022, by prefecture
Description
Source and methodology information
Source(s)
Nikkei
Conducted by
Nikkei
Survey period
March 17, 2022
Region(s)
Japan
Number of respondents
n.a.
Age group
n.a.
Special characteristics
n.a.
Published by
Nikkei
Publication date
March 2022
Original source
nikkei.com
Website URL
visit the website
Notes:
The figures are based on data from Ministry of Health, Labour, and Wealth
(MHLW) and municipalities in Japan.
As of March 17, 2022, the highest number of approximately 1.2 million patients with coronavirus (COVID-19)
were confirmed in Tokyo Prefecture in Japan, followed by Osaka Prefecture with about 747.9 thousand people.
On that day, all prefectures out of 47 reported new infection cases.
Tokyo and Kanagawa
The first coronavirus case in Japan was confirmed on January 16, 2020, in Kanagawa prefecture. Part of the
Greater Tokyo Area, Kanagawa is the country’s second-most populous prefecture with more than nine million
inhabitants. A few days after the first case in Kanagawa, Japan’s second case was reported in Tokyo.
Kanagawa and Tokyo, along with Osaka, and four other prefectures, were the first to be placed under a state of
emergency by then prime minister Shinzo Abe in April 2020. From the outbreak of COVID-19 until March 2022,
the state of emergency was announced four times for Tokyo and three times for Kanagawa Prefecture.
Osaka
Osaka prefecture reported its first case of COVID-19 on January 29, 2020. The prefecture is the center of
Japan’s second-most populated urban region, the Keihanshin metropolitan area, which includes Kyoto and
Hyogo prefectures. The virus continued to spread in Osaka with the acceleration of new infection cases per day
recorded in January, April to May, July to September in 2021, and January and onwards in 2022.
For further information about the coronavirus (COVID-19) pandemic, please visit our dedicated facts and figure
page .
Back to statistic
55
References
62.
Bed occupancy rate of hospital beds available for coronavirus disease (COVID-19) inpatients inJapan as of March 2022, by prefecture
Bed occupancy rate of COVID-19 inpatients Japan 2022, by prefecture
Description
Source and methodology information
Source(s)
MHLW (Japan)
Conducted by
MHLW (Japan)
Survey period
as of March 9, 2022
Region(s)
Japan
Number of respondents
n.a.
Age group
n.a.
Special characteristics
n.a.
Published by
MHLW (Japan)
Publication date
March 2022
Original source
www.mhlw.go.jp
Website URL
visit the website
Notes:
n.a.
As of March 2022, about 69 percent of hospital beds in Osaka Prefecture reserved for coronavirus disease
(COVID-19) inpatients was occupied. On the same day, there were a total of around 44.8 thousand hospital
beds reserved for inpatients with COVID-19 in the country.
For further information about the coronavirus (COVID-19) pandemic, please visit our dedicated facts and figures
page .
Back to statistic
56
References
63.
Number of patients of coronavirus disease (COVID-19) in Tokyo Prefecture as of March 17, 2022,by state of health
Patients with COVID-19 in Tokyo Japan 2022, by state of health
Description
Source and methodology information
Source(s)
Tokyo Metropolitan Government
Conducted by
Tokyo Metropolitan Government
Survey period
March 17, 2022
Region(s)
Japan
Number of respondents
n.a.
Age group
n.a.
Special characteristics
n.a.
Published by
Tokyo Metropolitan Government
Publication date
March 2022
Original source
catalog.data.metro.tokyo.lg.jp
Website URL
visit the website
Notes:
The source provides the following information: 1. figures exclude the
returnees on charter flights and the Diamond Princess cruise ship
passengers. 2. "discharged" includes patients who are in a recuperation
period. 3. it takes a certain period of time to grasp the number of hospital
discharges, and [...] For more information visit our Website
As of March 17, 2022, a cumulative total of approximately 1.2 million people in Tokyo Prefecture tested positive
for the coronavirus (COVID-19) . Among them, 2,736 patients were still hospitalized, roughly one million patients
were discharged already, and over four thousand patients passed away. Tokyo recorded an accelerated
development of new cases per day
again from January 2022 and onwards.
For further information about the coronavirus (COVID-19) pandemic, please visit our dedicated facts and figure
page .
Back to statistic
57
References
64.
New cases of coronavirus disease (COVID-19) confirmed by day in Tokyo Prefecture in Japan as ofMarch 15, 2022
New confirmed cases of COVID-19 by day in Tokyo, Japan 2022
Description
Source and methodology information
Source(s)
Tokyo Metropolitan Government
Conducted by
Tokyo Metropolitan Government
Survey period
January 14, 2020 to March 15, 2022
Region(s)
Japan
Number of respondents
n.a.
Age group
n.a.
Special characteristics
n.a.
Published by
Tokyo Metropolitan Government
Publication date
March 2022
Original source
stopcovid19.metro.lg.jp.jp
Website URL
visit the website
Notes:
Excluding the returnees on charter flights or the cruise ship passengers.
On March 15, 2022, 2,578 cases of coronavirus disease (COVID-19) were confirmed in Tokyo Prefecture. The
number peaked at around 16.9 thousand on January 31, 2022. Following the accelerated development of cases
in the prefecture, the Tokyo prefectural government rose the alert status of the infection level to the highest out
of four levels.
Government measures
Since the outbreak of the disease in the nation in January 2020, the Japanese government has announced the
state of emergency four times for respective prefectures. Tokyo Prefecture was one of the prefectures that were
under the state of emergency all four times. To ease the strain on medical facilities, Tokyo prefectural
government added about 1,000 beds for COVID-19 patients in private facilities such as sports centers. As of
March 2022, over 7,200 beds were designated for patients with the disease in the prefecture.
Tokyo Olympics and Paralympics
As a direct impact of COVID-19, the Tokyo 2020 Summer Olympic and Paralympic Games were postponed to
2021. Consequently, the games took place from July to September 2021, one year after the original plan. The
games were held without any overseas audience, and initially anticipated economic growth from outbound
tourism in the nation did not materialize.
For further information about the coronavirus (COVID-19) pandemic, please visit our dedicated facts and figure
page .
Back to statistic
58
References
65.
Cumulative number of coronavirus disease (COVID-19) vaccine doses administered in Japan as ofMarch 16, 2022
Cumulative number of administered COVID-19 vaccinations Japan 2022
Description
Source and methodology information
Source(s)
Prime Minister's Office of Japan; MHLW (Japan)
Conducted by
Prime Minister's Office of Japan; MHLW (Japan)
Survey period
March 16, 2022
Region(s)
Japan
Number of respondents
n.a.
Age group
n.a.
Special characteristics
n.a.
Published by
Prime Minister's Office of Japan
Publication date
March 2022
Original source
www.kantei.go.jp
Website URL
visit the website
Notes:
*Data as of July 30, 2021.
As of March 16, 2022, a total of around 40 million general citizens were vaccinated with the third dose. As of July
30, 2021, a total number of about 5.8 million health professionals in Japan received the second dose of
coronavirus disease (COVID-19) vaccinations. The priority administration of the vaccine for health professionals
ended at the end of the month.
The supply of vaccination in Japan has begun on February 17, 2021, mainly for health professionals. On April
12, 2021, the government started the vaccine administration for citizens aged 65 and older.
Back to statistic
59
References
66.
Coronavirus disease (COVID-19) vaccination rate in Japan as of March 16, 2022COVID-19 vaccination rate Japan 2022
Description
Source and methodology information
Source(s)
Digital Agency (Japan); GCPJ
Conducted by
Digital Agency (Japan); GCPJ
Survey period
April 12, 2022 to March 16, 2022
Region(s)
Japan
Number of respondents
n.a.
Age group
n.a.
Special characteristics
n.a.
Published by
Digital Agency (Japan)
Publication date
March 2022
Original source
info.vrs.digital.go.jp
Website URL
visit the website
Notes:
The calculation excludes the number of vaccinations administered to
health professionals.
As of March 16, 2022, around 74.7 percent of the population in Japan received the second dose of coronavirus
disease (COVID-19) vaccination. At the same time, approximately 33 percent of the population received a
booster shot.
The distribution of COVID-19 vaccination in Japan has begun on February 17, 2021, mainly for health
professionals. On April 12, 2021, the government started the vaccine administration for citizens aged 65 and
older.
Back to statistic
60
References
67.
Coronavirus disease (COVID-19) vaccination rate in Japan as of March 22, 2022, by age groupCOVID-19 vaccination rate Japan 2022, by age group
Description
Source and methodology information
Source(s)
Prime Minister's Office of Japan; Digital Agency (Japan)
Conducted by
Prime Minister's Office of Japan; Digital Agency (Japan)
Survey period
March 22, 2022
Region(s)
Japan
Number of respondents
n.a.
Age group
n.a.
Special characteristics
n.a.
Published by
Prime Minister's Office of Japan
Publication date
March 2022
Original source
kantei.go.jp
Website URL
visit the website
Notes:
n.a.
As of March 22, 2022, about 98.3 percent of citizens aged 80 to 89 years in Japan received the second dose of
coronavirus disease (COVID-19) vaccinations. The overall share of around 74.8 percent of inhabitants in Japan
was vaccinated with the second dose as of the same day.
Back to statistic
61
References
68.
Coronavirus disease (COVID-19) vaccination rate in Japan as of March 16, 2022, by prefectureCOVID-19 vaccination rate Japan 2022, by prefecture
Description
Source and methodology information
Source(s)
GCPJ; Digital Agency (Japan)
Conducted by
GCPJ; Digital Agency (Japan)
Survey period
March 16, 2022
Region(s)
Japan
Number of respondents
n.a.
Age group
n.a.
Special characteristics
n.a.
Published by
Digital Agency (Japan)
Publication date
March 2022
Original source
info.vrs.digital.go.jp
Website URL
visit the website
Notes:
The calculation excludes the number of vaccinations administered to
health professionals.
As of March 16, 2022, close to 79 percent of inhabitants in Akita Prefecture received the second dose of
coronavirus disease (COVID-19) vaccination, the highest vaccination rate among all 47 prefectures in Japan. In
terms of the booster shot, Yamaguchi Prefecture recorded at around 40.6 percent.
The distribution of COVID-19 vaccination in Japan has begun on February 17, 2021, mainly for health
professionals. On April 12, 2021, the government started the vaccine administration for citizens aged 65 and
older.
Back to statistic
62
References
69.
Growth of the real gross domestic product (GDP) in Japan from 1st quarter 2017 to 4th quarter2021
Real GDP growth rate Japan Q1 2017-Q4 2021
Description
Source and methodology information
Source(s)
Cabinet Office Japan
Conducted by
Cabinet Office Japan
Survey period
1st quarter 2017 to 4th quarter 2021
Region(s)
Japan
Number of respondents
n.a.
Age group
n.a.
Special characteristics
expenditure approach
Published by
Cabinet Office Japan
Publication date
March 2022
Original source
Quarterly Estimates of GDP: October - December 2021(The Second
Preliminary), page 2, 5, 7
Website URL
visit the website
Notes:
n.a.
According to the second preliminary announcement in March 2022, the real gross domestic product (GDP) of
Japan in the fourth quarter of 2021 grew by 1.1 percent (seasonally adjusted) and 4.6 percent (annualized)
compared to the previous quarter. The figures recovered from the sharpest decline in the second quarter in
2020.
GDP refers to the total market value of all goods and services that are produced within a country. Real GDP is
adjusted for price changes and is therefore regarded as a key indicator for the economic well-being of a country.
Back to statistic
63
References
70.
Monthly development of the Nikkei Stock Average (Nikkei 225) in Japan from January 2019 toFebruary 2022
Monthly Nikkei 225 development Japan 2019-2022
Description
Source and methodology information
Source(s)
Yahoo Japan
Conducted by
Yahoo Japan
Survey period
January 2019 to February 2022; as of the end of each month
Region(s)
Japan
Number of respondents
n.a.
Age group
n.a.
Special characteristics
n.a.
Published by
Yahoo Japan
Publication date
March 2022
Original source
info.finance.yahoo.co.jp
Website URL
visit the website
Notes:
The figures are closing prices of each month. The source does not provide
an exact publication date. Date given here is the day of data access.
The Nikkei Stock Average (Nikkei 225) closed at 26,526.82 points in February 2022. In November 2020, the
index had reached 26,000 points for the first time since 1991. Due to the global coronavirus (COVID-19)
pandemic , the value reached its lowest point during the surveyed period in March 2020.
Back to statistic
64
References
71.
Monthly development of the Tokyo Stock Price Index (TOPIX) in Japan from January 2019 toFebruary 2022
Monthly TOPIX development Japan 2019-2022
Description
Source and methodology information
Source(s)
Yahoo Japan
Conducted by
Yahoo Japan
Survey period
January 2019 to February 2022; as of the end of each month
Region(s)
Japan
Number of respondents
n.a.
Age group
n.a.
Special characteristics
n.a.
Published by
Yahoo Japan
Publication date
March 2022
Original source
info.finance.yahoo.co.jp
Website URL
visit the website
Notes:
The figures are from the end of month closing prices. The source does not
provide an exact publication date. Date given here is the day of data
access.
The Tokyo Stock Price Index (TOPIX) closed at 1,886.93 points in February 2022. In March 2020, the index had
dropped to its lowest point in the surveyed period. This was mainly caused by the global coronavirus disease
(COVID-19) pandemic .
Back to statistic
65
References
72.
Monthly number of international visitors to Japan from January 2018 to November 2021 (in 1,000s)Monthly number of foreign visitors to Japan 2018-2021
Description
Source and methodology information
Source(s)
Japan National Tourism Organization; Ministry of Justice (Japan)
Conducted by
Japan National Tourism Organization; Ministry of Justice (Japan)
Survey period
January 2018 to November 2020
Region(s)
Japan
Number of respondents
n.a.
Age group
n.a.
Special characteristics
n.a.
Published by
Japan National Tourism Organization
Publication date
December 2021
Original source
jnto.go.jp
Website URL
visit the website
Notes:
*Preliminary figures. Figures have been rounded.
In November 2021, the number of foreign visitors to Japan was still low at an estimated 20.7 thousand people.
Since March 2020 and the advent of the COVID-19 pandemic in Japan, inbound visitor numbers were at a
fraction of what they had been in previous years.
Back to statistic
66
References
73.
Breakdown of coronavirus disease (COVID-19) economic emergency relief package announced inJapan as of April 20, 2020, by operation phase (in trillion Japanese yen)
Coronavirus (COVID-19) economic relief package in April Japan 2020, by operation
Description
Source and methodology information
Source(s)
Cabinet Office Japan
Conducted by
Cabinet Office Japan
Survey period
April 20, 2020
Region(s)
Japan
Number of respondents
n.a.
Age group
n.a.
Special characteristics
n.a.
Published by
Cabinet Office Japan
Publication date
April 2020
Original source
COVID-19 emergency economic measures, page 39
Website URL
visit the website
Notes:
1 Japanese yen equals 0.0093 U.S. dollars or 0.0084 euros as of April
2020.
The Japanese government announced an updated version of economic emergency relief package on April 20,
2020, in response to the growing impact of the coronavirus disease (COVID-19) on Japan's economy . A total of
around 117 trillion Japanese yen was planned for the whole operation, approximately 91 trillion yen of which was
for the first "emergency support" phase of the measures and around 25.7 trillion yen was for the second "vshaped turnaround" phase.
In April, the government declared a state of emergency for all 47 prefectures and insisted citizens to stay home
and work from home until the end of May. It was, however, lifted in 39 prefectures on May 14 as the number of
new infection cases went down. As of May 18 , 2020, there were a total of 16,305 confirmed cases of COVID-19
in Japan
For further information about the coronavirus (COVID-19) pandemic, please visit our dedicated facts and figures
page .
Back to statistic
67
References
74.
Breakdown of coronavirus disease (COVID-19) economic relief package announced in Japan as ofDecember 8, 2020, by operation phase (in trillion Japanese yen)
Coronavirus (COVID-19) economic relief package in December Japan 2020, by operation
Description
Source and methodology information
Source(s)
Cabinet Office Japan
Conducted by
Cabinet Office Japan
Survey period
December 8, 2020
Region(s)
Japan
Number of respondents
n.a.
Age group
n.a.
Special characteristics
the Japanese fiscal years run from April 1 of the stated year to March 31
of the following year
Published by
Cabinet Office Japan
Publication date
December 2020
Original source
Summary for Comprehensive Economic Measures to Secure People`s
Lives and Livelihoods toward Relief and Hope, page 48
Website URL
visit the website
Notes:
1 Japanese yen equals 0.0091 U.S. dollars or 0.0075 euros as of June
2021.
The Japanese government announced a new economic stimulus package on December 8, 2020, in response to
the growing impact of the coronavirus disease (COVID-19) on Japan's economy. A total of around 74 trillion
Japanese yen was planned for the whole operation, approximately 52 trillion yen of which was designated for the
change of structure and positive economic cycles for the post-COVID-19 pandemic. The government announced
an emergency relief package also in April 2020 .
For further information about the coronavirus (COVID-19) pandemic, please visit our dedicated facts and figures
page .
Back to statistic
68
References
75.
Breakdown of coronavirus disease (COVID-19) economic relief package announced in Japan as ofNovember 19, 2021, by operation phase (in trillion Japanese yen)
Coronavirus (COVID-19) economic relief package in November Japan 2021, by operation
Description
Source and methodology information
Source(s)
Cabinet Office Japan
Conducted by
Cabinet Office Japan
Survey period
November 19, 2021
Region(s)
Japan
Number of respondents
n.a.
Age group
n.a.
Special characteristics
the Japanese fiscal years run from April 1 of the stated year to March 31
of the following year
Published by
Cabinet Office Japan
Publication date
November 2021
Original source
Economic Measures for Overcoming COVID-19 and Opening Up a New
Era, page 52
Website URL
visit the website
Notes:
*Including timely and proper implementation of reserve funds for
countermeasures against COVID-19 (FY 2021: 1.8 trillion yen, FY2022:
5.0 trillion yen). 1 Japanese yen equals 0.0087 U.S. dollars or 0.0078
euros as of March 2022.
The Japanese government announced a new economic stimulus package on November 19, 2021, in response
to the growing impact of coronavirus disease (COVID-19) on Japan's economy. A total of around 79 trillion
Japanese yen was planned for the whole operation, approximately 35.1 trillion yen of which was designated for
the prevention of the spread of the disease. The government also announced an emergency relief package in
April 2020 and December 2020 .
For further information about the coronavirus (COVID-19) pandemic, please visit our dedicated facts and figures
page .
Back to statistic
69
References
76.
General account budget reserved for the coronavirus disease (COVID-19) countermeasures inJapan from fiscal year 2020 to 2021 (in trillion Japanese yen)
General account budget reserved for COVID-19 countermeasures Japan FY 2020-2021
Description
Source and methodology information
Source(s)
Ministry of Finance Japan
Conducted by
Ministry of Finance Japan
Survey period
fiscal year 2020 to 2021; the Japanese fiscal year starts on April 1 of the
stated year and ends on March 31 of the following year
Region(s)
Japan
Number of respondents
n.a.
Age group
n.a.
Special characteristics
n.a.
Published by
Ministry of Finance Japan
Publication date
August 2021
Original source
www.mof.go.jp
Website URL
visit the website
Notes:
Figures except for the reserve fund for fiscal 2021 come from the previous
reporting. First supplementary budget for fiscal 2020: approved April 2020
Second supplementary budget for fiscal 2020: approved June 2020 Third
supplementary budget for fiscal 2020: approved January 2021 Reserve
fund for fis [...] For more information visit our Website
The Japanese government reserved five trillion yen of the general account budget of the fiscal 2021 year for the
coronavirus disease (COVID-19) countermeasures. The government approved a total of approximately 9.7 trillion
yen of the supplementary budget against COVID-19 for fiscal 2020. These funds were planned as a part of the
economic stimulus package announced in December 2020.
Back to statistic
70
References
77.
Cumulative value of subsidies approved by the government for employment adjustment duringcoronavirus disease (COVID-19) pandemic in Japan as of March 2022 (in billion Japanese yen)
Approved value of employment adjustment subsidies amid COVID-19 Japan 2022
Description
Source and methodology information
Source(s)
MHLW (Japan)
Conducted by
MHLW (Japan)
Survey period
May 1, 2020 to March 11, 2022
Region(s)
Japan
Number of respondents
n.a.
Age group
n.a.
Special characteristics
n.a.
Published by
MHLW (Japan)
Publication date
March 2022
Original source
mhlw.go.jp
Website URL
visit the website
Notes:
1 Japanese yen equals 0.0087 U.S. dollars or 0.0078 euros as of March
2022. Values have been rounded.
As of March 11, 2022, the Japanese government approved a cumulative total of around 5.4 trillion Japanese yen
of subsidies to businesses that were facing employment adjustment due to the impact of the coronavirus disease
(COVDI-19) pandemic. Subsidies have been granted to about six million cases since the outbreak of the
disease.
The government in Japan subsidizes the layoff allowances of employees so that companies that need to scale
down businesses can maintain the number of employees. As a special measure amid the pandemic, the limit
amount of grants per employee and the subsidy rate were raised from the usual condition.
Back to statistic
71
References
78.
Diffusion Index (DI) of current business conditions of business enterprises in Japan from March2018 to December 2021, by company size
Business conditions DI of business enterprises Japan 2018-2021, by company size
Description
Source and methodology information
Source(s)
Bank of Japan
Conducted by
Bank of Japan
Survey period
November 10 to December 10, 2021
Region(s)
Japan
Number of respondents
9,328 business enterprises*
Age group
n.a.
Special characteristics
paper and online survey
Published by
Bank of Japan
Publication date
December 2021
Original source
Tankan Summary (December 2021), page 1
Website URL
visit the website
Notes:
*99.3% response rate. Response rate = The number of enterprises that
responded to the question on business conditions / the number of sample
enterprises * 100 Diffusion Index= ("favorable" - "unfavorable"), % points
Figures prior to December 2021 are from previous reports.
The Tankan survey, conducted from November to December 2021, revealed that the Diffusion Index (DI) of
business conditions evaluated by medium-sized enterprises in Japan stood at three points, turning positive for
the first time since the outbreak of the coronavirus (COVID-19) pandemic . Among large enterprises, the index
increased to 14 points.
The Tankan survey stands for the Short-Term Economic Survey of Enterprises in Japan . It is conducted once in
three months with the aim of providing an accurate picture of business trends of enterprises in Japan. The target
of the survey are private enterprises (excluding financial institutions) in the country with a capital of 20 million
Japanese yen and more.
Back to statistic
72
References
79.
Diffusion Index (DI) of current business conditions of business enterprises in Japan from March2018 to December 2021, by industry
Business conditions DI of business enterprises Japan 2021, by industry
Description
Source and methodology information
Source(s)
Bank of Japan
Conducted by
Bank of Japan
Survey period
November 10 to December 10, 2021
Region(s)
Japan
Number of respondents
9,328 business enterprises*
Age group
n.a.
Special characteristics
paper and online survey
Published by
Bank of Japan
Publication date
December 2021
Original source
Tankan Summary (December 2021), page 1
Website URL
visit the website
Notes:
*99.3% response rate. Response rate = The number of enterprises that
responded to the question on business conditions / the number of sample
enterprises * 100 Diffusion Index= ("favorable" - "unfavorable"), % points
Figures prior to December 2021 are from previous reports.
The Tankan survey, conducted from November to December 2021, revealed that the Diffusion Index (DI) of
business conditions evaluated by enterprises in Japan increased to two points. Among companies in the
manufacturing industry, the index stood at six points.
The Tankan survey stands for the Short-Term Economic Survey of Enterprises in Japan . It is conducted once in
three months with the aim of providing an accurate picture of business trends of enterprises in Japan. The target
of the survey are private enterprises (excluding financial institutions) in Japan with a capital of 20 million
Japanese yen and more.
Back to statistic
73
References
80.
Share of business enterprises in Japan experiencing an impact of coronavirus (COVID-19)outbreak on corporate activities as of February 2022
Share of companies experiencing an impact of COVID-19 on business Japan 2022
Description
Source and methodology information
Source(s)
TSR
Conducted by
TSR
Survey period
February 1 to 9, 2022
Region(s)
Japan
Number of respondents
8,340 business enterprises
Age group
n.a.
Special characteristics
n.a.
Published by
TSR
Publication date
February 2022
Original source
20th survey on coronaviurs, page 1
Website URL
visit the website
Notes:
Original question: "Is the outbreak of coronavirus having an impact on
corporate activities of your company?" Figures prior to February 2022
come from the previous reporting. Number of business enterprises in the
previous surveys: [2020] February n= 12,348, March n= 16,327, April
n=17,896, May n=21, [...] For more information visit our Website
According to a survey conducted in February 2022, approximately 74.3 percent of business enterprises in Japan
were experienced an impact of the coronavirus pandemic on their corporate activities. Close to seven percent
stated that they no longer experience the impact of the outbreak.
Back to statistic
74
References
81.
Share of small-to-medium sized business enterprises experiencing an impact of the coronavirus(COVID-19) on monthly sales revenue growth in Japan in January 2022
Effect of COVID-19 on monthly sales growth of small-to-medium companies Japan 2022
Description
Source and methodology information
Source(s)
TSR
Conducted by
TSR
Survey period
February 1 to 9, 2022
Region(s)
Japan
Number of respondents
4,501 business enterprises
Age group
n.a.
Special characteristics
sales revenue of the same month in the previous year as an index of 100
points
Published by
TSR
Publication date
February 2022
Original source
20th survey on coronaviurs, page 2
Website URL
visit the website
Notes:
Original question: "To what degree did the sales of your company change,
if the same month in the previous year were to be indexed at 100?"
Figures may not add up to 100 percent due to rounding by the source.
Figures prior to January 2022 come from the previous reporting. Number
of business enterpri [...] For more information visit our Website
According to a survey conducted in February 2022 in Japan, the majority of small-to-medium-sized business
enterprises in Japan reported an increase in monthly sales in January compared to the previous year. At the
same time, about 21.7 percent of small-to-medium companies reported a sales decline of 1 to 10 percent in
January 2022, compared to the same period in 2021.
Back to statistic
75
References
82.
Share of business enterprises foreseeing potential discontinuation of business due to coronavirus(COVID-19) outbreak in Japan as of February 2022, by company size
Share of companies potentially closing down due to COVID-19 Japan 2022, by size
Description
Source and methodology information
Source(s)
TSR
Conducted by
TSR
Survey period
February 1 to 9, 2022
Region(s)
Japan
Number of respondents
7,360 business enterprises
Age group
n.a.
Special characteristics
n.a.
Published by
TSR
Publication date
February 2022
Original source
20th survey on coronaviurs, page 7
Website URL
visit the website
Notes:
Original question: "If the coronavirus outbreak would go on, is there a
possibility for your company to discontinue the business operation?"
Sample size: Large companies (capital of 100 million yen or more)
n=1,034 Small to medium sized companies (capital less than 100 million
yen) n=6,317 Number of [...] For more information visit our Website
According to a survey conducted in February 2022, around 7.4 percent of small to medium-sized companies in
Japan foresaw a likelihood of discontinuation of their business activities due to the impact of the coronavirus
(COVID-19) outbreak. By comparison, about 0.8 percent of large business enterprises reported the potential
closing down.
Back to statistic
76
References
83.
Impact of the coronavirus (COVID-19) pandemic on the business of foreign affiliates in Japan in2020
Impact of COVID-19 pandemic on business of foreign affiliates in Japan 2020
Description
Source and methodology information
Source(s)
METI (Japan)
Conducted by
METI (Japan)
Survey period
August 1, 2020
Region(s)
Japan
Number of respondents
2,476 business enterprises*
Age group
n.a.
Special characteristics
online and postal questionnaire; multiple answers possible; leading three
responses per company
Published by
METI (Japan)
Publication date
June 2021
Original source
Survey of Trends in Business Activities of Foreign Affiliates 2020, page 23
Website URL
visit the website
Notes:
*2,054 non-manufacturing businesses and 422 manufacturing businesses.
According to a survey conducted in 2020, a decrease in orders and sales was among the most common impact
of the coronavirus (COVID-19) pandemic on the business of foreign affiliates in Japan, accounting for around 60
percent. At the same time, one-third of the foreign affiliates experienced a negative impact on the distribution of
products, goods, and services.
Back to statistic
77
References
84.
Number of corporate bankruptcies in Japan from 2013 to 2021Number of corporate bankruptcies Japan 2013-2021
Description
Source and methodology information
Source(s)
Teikoku Databank
Conducted by
Teikoku Databank
Survey period
2013 to 2021
Region(s)
Japan
Number of respondents
n.a.
Age group
n.a.
Special characteristics
bankrupt companies with liabilities of 10 million yen or more
Published by
Teikoku Databank
Publication date
March 2022
Original source
Bankruptcy Information 2020
Website URL
visit the website
Notes:
Figures prior to 2021 come previous reporting. The source does not
provide an exact publication date. Date given here is the day of data
access.
In 2021, the number of bankruptcies of companies in Japan amounted to more than six thousand. The number
peaked in 2013 recording over 10.3 thousand bankruptcies. The total liabilities of the bankrupt companies
amounted to around 1.2 trillion yen in 2021.
Back to statistic
78
References
85.
Number of corporate bankruptcies in Japan in 2021, by industryNumber of corporate bankruptcies Japan 2021, by industry
Description
Source and methodology information
Source(s)
TSR
Conducted by
TSR
Survey period
2021
Region(s)
Japan
Number of respondents
n.a.
Age group
n.a.
Special characteristics
bankrupt companies with liabilities of 10 million yen or more
Published by
TSR
Publication date
January 2022
Original source
tsr-net.co.jp
Website URL
visit the website
Notes:
n.a.
In 2021, the service industry recorded the highest number of bankruptcies among industries in Japan, with over
two thousand cases. It was followed by the construction industry with more than one thousand cases. The
breakdown by prefectures showed that Tokyo Prefecture counted the highest number of bankruptcies during that
year.
Back to statistic
79
References
86.
Number of corporate bankruptcies due to the impact of coronavirus disease (COVID-19) in Japanas of March 2022, by prefecture
Number of bankruptcies due to the impact of COVID-19 Japan 2022, by prefecture
Description
Source and methodology information
Source(s)
TSR
Conducted by
TSR
Survey period
March 16, 2022
Region(s)
Japan
Number of respondents
n.a.
Age group
n.a.
Special characteristics
legal or voluntary liquidation with liabilities of 10 million yen or more
Published by
TSR
Publication date
March 2022
Original source
tsr-net.co.jp
Website URL
visit the website
Notes:
The number includes bankruptcies that were already officially announced
and the ones that were still in the process of legal procedures.
As of March 16 in 2022, the number of bankruptcies in Japan directly related to the impact of the coronavirus
disease (COVID-19) amounted to 619 cases in Tokyo Prefecture. In total, 2,920 business enterprises in the
country went bankrupt after the outbreak of the virus.
For further information about the coronavirus (COVID-19) pandemic, please visit our dedicated facts and figures
page .
Back to statistic
80
References
87.
Number of bankruptcies in the travel industry in Japan from 2011 to 2020Number of bankruptcies in the travel business in Japan 2011-2020
Description
Source and methodology information
Source(s)
Kankokeizai News Corporation; TSR
Conducted by
TSR
Survey period
2011 to 2020
Region(s)
Japan
Number of respondents
n.a.
Age group
n.a.
Special characteristics
n.a.
Published by
Kankokeizai News Corporation
Publication date
January 2021
Original source
kankokeizai.com
Website URL
visit the website
Notes:
n.a.
In 2020 in Japan, 26 travel businesses filed for bankruptcy. While the number of bankruptcies was on a similar
level compared to the previous years, the amount of liabilities in 2020 reached a record high.
Back to statistic
81
References
88.
Monthly number of business enterprises with a possibility of employment adjustment due to thecoronavirus disease (COVID-19) impact in Japan from May 2020 to February 2022
Businesses with an employment adjustment possibility due to COVID-19 Japan 2022
Description
Source and methodology information
Source(s)
MHLW (Japan)
Conducted by
MHLW (Japan)
Survey period
May 2020 to February 2022
Region(s)
Japan
Number of respondents
n.a.
Age group
n.a.
Special characteristics
n.a.
Published by
MHLW (Japan)
Publication date
February 2022
Original source
www.mhlw.go.jp
Website URL
visit the website
Notes:
*Figures are from February 1 to 18, 2022. Figures are based on the
information and reports from prefectural laborer bureaus and Public
Employment Security Offices. Figures have been rounded.
In February 2022, 171 business enterprises in Japan reported a possibility of employment adjustment due to the
impact of the coronavirus disease (COVID-19) pandemic. Until February 18 in 2022 after the outbreak, a
cumulative total of more than 136 thousand businesses in the country claimed that they would need to reduce
the number of employees.
Back to statistic
82
References
89.
Cumulative number of employees who are planned to be dismissed due to the coronavirus disease(COVID-19) impact in Japan as of February 2022
Cumulative number of workers to be fired due to COVID-19 Japan 2022, by industry
Description
Source and methodology information
Source(s)
MHLW (Japan)
Conducted by
MHLW (Japan)
Survey period
2022; as of February 18
Region(s)
Japan
Number of respondents
n.a.
Age group
n.a.
Special characteristics
n.a.
Published by
MHLW (Japan)
Publication date
February 2022
Original source
www.mhlw.go.jp
Website URL
visit the website
Notes:
Figures are based on the information and reports from prefectural labor
bureaus and Public Employment Security Offices.
As of February 2022, a cumulative total of around 30.8 thousand employees in the manufacturing industry in
Japan were planned to be fired due to the outbreak of the coronavirus disease (COVID-19). The list of planned
displacements of workers in the country grew to a total of approximately 128 thousand since the outbreak.
Back to statistic
83
References
90.
Share of business enterprises in Japan that implemented home office for employees after theoutbreak of coronavirus disease (COVID-19) as of October 2021
Share of companies that implemented remote work due to COVID-19 Japan 2021
Description
Source and methodology information
Source(s)
TSR
Conducted by
TSR
Survey period
October 1 to 11, 2021
Region(s)
Japan
Number of respondents
10,286 business enterprises
Age group
n.a.
Special characteristics
n.a.
Published by
TSR
Publication date
October 2021
Original source
18th survey on coronaviurs, page 7
Website URL
visit the website
Notes:
Original question: "Has your company implemented home office/remote
work in order to prevent a further spread of coronavirus?" Figures prior to
March 2021 come from the previous reporting. Number of business
enterprises in the survey: March' 20 n=15,597 May' 20 n=21,408 June '20
n=18,002 July '20 n= [...] For more information visit our Website
According to a survey conducted in October 2021, over 37 percent of business enterprises in Japan
implemented remote work for employees after the outbreak of coronavirus disease (COVID-19) in the country.
Approximately 21 percent discontinued the teleworking option after implementing it.
Back to statistic
84
References
91.
Change in revenue generated by artist groups during the COVID-19 pandemic in Japan in 2020Change in revenue of artist groups during COVID-19 pandemic in Japan 2020
Description
Source and methodology information
Source(s)
Japan Council of Performers Rights & Performing Arts Organizations; Arts
and Culture Forum; Intage Research
Conducted by
Intage Research; Arts and Culture Forum
Survey period
April 21 to May 6, 2021
Region(s)
Japan
Number of respondents
1,484
Age group
n.a.
Special characteristics
revenue in 2020 compared to 2019 figures
Published by
Japan Council of Performers Rights & Performing Arts Organizations; Arts
and Culture Forum
Publication date
July 2021
Original source
Report on the tremendous damage done by COVID-19 to the world of
culture and art, and towards rehabilitation, page 18
Website URL
visit the website
Notes:
n.a.
In a survey conducted in April and May 2021 regarding the consequences of COVID-19 on the world of art in
Japan during 2020, 34 percent of respondents (artist groups) stated that their revenue from cultural activities
declined to about 25 percent compared to the previous year. The vast majority of respondents reported a decline
in income.
Back to statistic
85
References
92.
Share of office workers feeling mentally unwell during the coronavirus (COVID-19) pandemic inJapan as of August 2021
Share of office workers feeling mentally unstable amid COVID-19 Japan 2021
Description
Source and methodology information
Source(s)
PR Times; ASMARQ
Conducted by
ASMARQ
Survey period
August 27 to 30, 2021
Region(s)
Japan
Number of respondents
800
Age group
20 to 59 years
Special characteristics
among full-time office workers
Published by
PR Times
Publication date
September 2021
Original source
prtimes.jp
Website URL
visit the website
Notes:
n.a.
According to a survey conducted in August 2021, about one-third of office workers in Japan were feeling
mentally not well during the coronavirus (COVID-19) pandemic. Close to six percent of those respondents
consulted medical institutions for their mental state.
Back to statistic
86
References
93.
Share of consumers with a decrease in food and beverage expenses during the coronaviruspandemic in Japan as of February 2021, by sales channel
Consumers with food expense decrease during COVID-19 in Japan 2021, by channel
Description
Source and methodology information
Source(s)
Rakuten Insight
Conducted by
Rakuten Insight
Survey period
February 16 to 18, 2021
Region(s)
Japan
Number of respondents
1,000
Age group
20-69 years
Special characteristics
multiple answers allowed; based on monthly household expenses
Published by
Rakuten Insight
Publication date
March 2021
Original source
insight.rakuten.com
Website URL
visit the website
Notes:
n.a.
More than 43 percent of consumers in Japan reported a decrease in food and beverage expenses for eating out
since the coronavirus (COVID-19) pandemic, as revealed in a survey conducted by Rakuten Insight in February
2021.
Following the outbreak of the global pandemic, foodservice businesses were requested to close down or
shorten opening hours in Japan. While a lockdown was not enforced on a national level, citizens were requested
to avoid going out unnecessarily.
Back to statistic
87
References