


 Английский язык
Похожие презентации:


")


")
Competitive Pricing
1.
FIN 30210:Managerial Economics
Competitive Pricing
Techniques
2.
Basic pathway for a product to get to theconsumer
Distributor
Manufacturer
Retailer
Consumer
3.
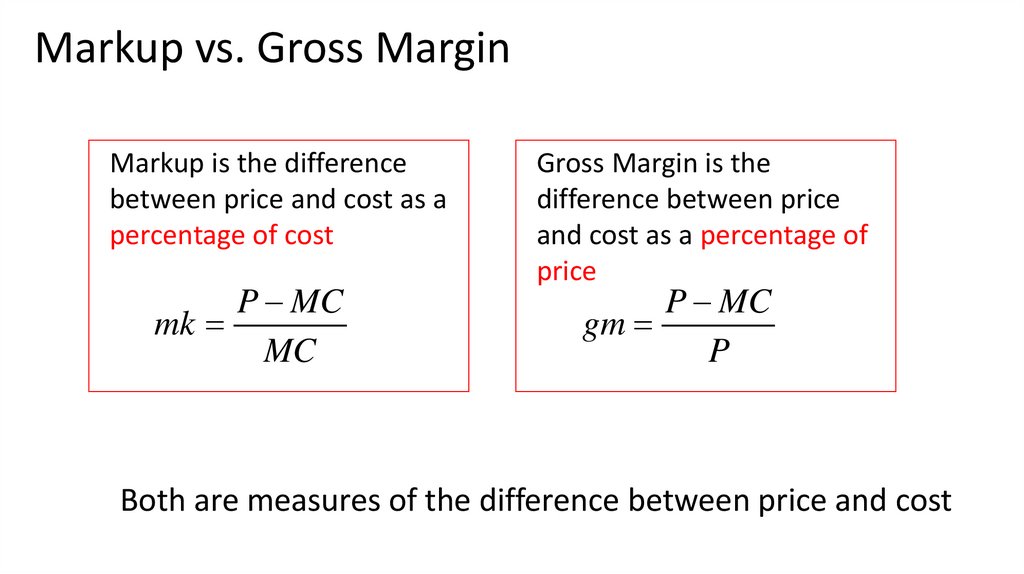
Markup vs. Gross MarginMarkup is the difference
between price and cost as a
percentage of cost
P MC
mk
MC
Gross Margin is the
difference between price
and cost as a percentage of
price
P MC
gm
P
Both are measures of the difference between price and cost
4.
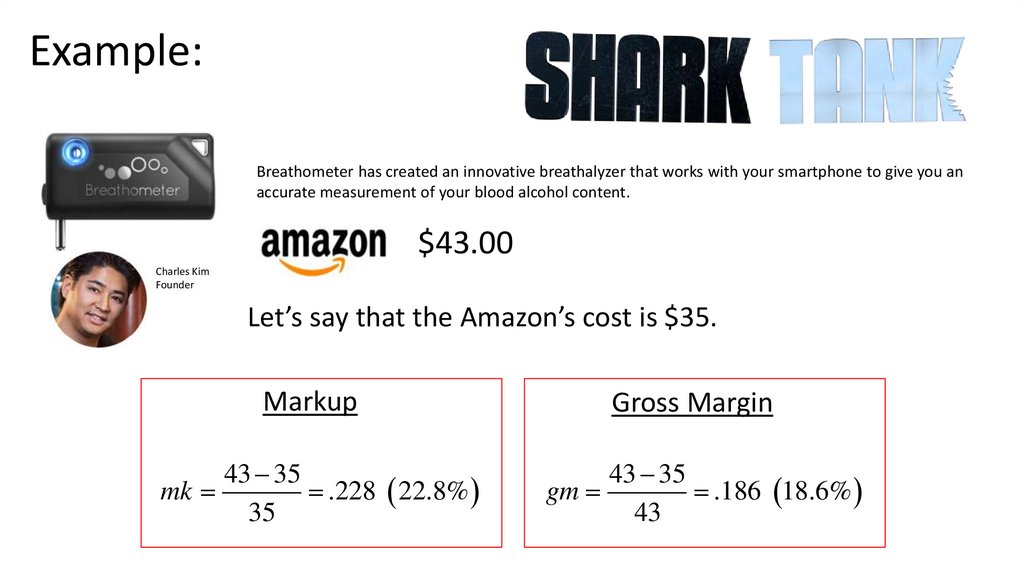
Example:Breathometer has created an innovative breathalyzer that works with your smartphone to give you an
accurate measurement of your blood alcohol content.
$43.00
Charles Kim
Founder
Let’s say that the Amazon’s cost is $35.
Markup
43 35
mk
.228 22.8%
35
Gross Margin
43 35
gm
.186 18.6%
43
5.
All 5 sharks invested inCharles’ idea - $1,000,000
for 30% of the company.
With $3,000,000 what price does Charles need to set to make a “reasonable”
rate of return?
Markup
Marginal Cost: $15
Fixed Cost: $50,000
25 15
mk
.66
p $25
Projected Annual Sales: 20,000
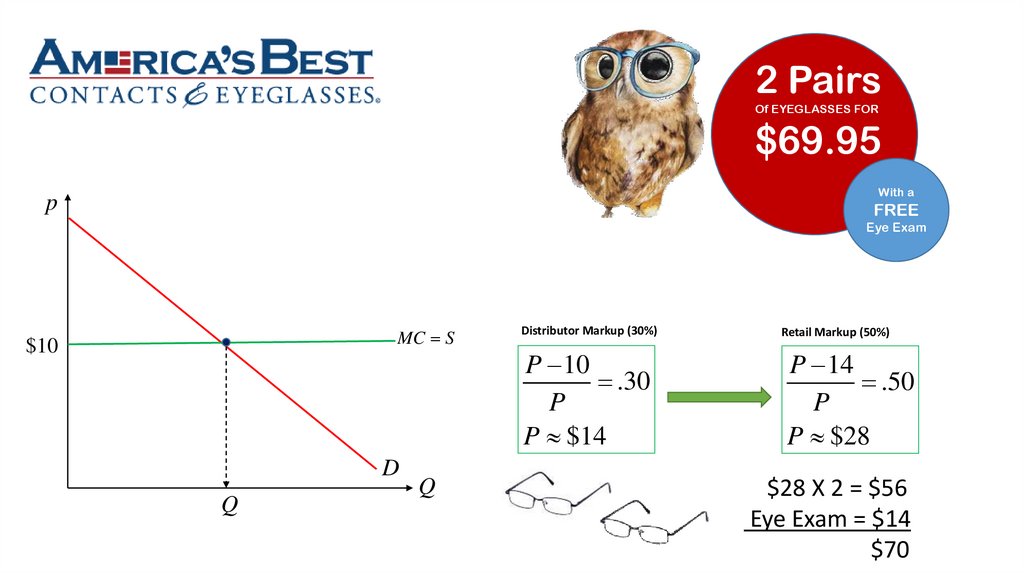
15
Gross Margin
Projected Annual Profits
profit 25 15 20, 000 50, 000 $150, 000
Projected Return on Investment
$150, 000
$3, 000, 000 100 5%
Is this a reasonable rate of return?
gm
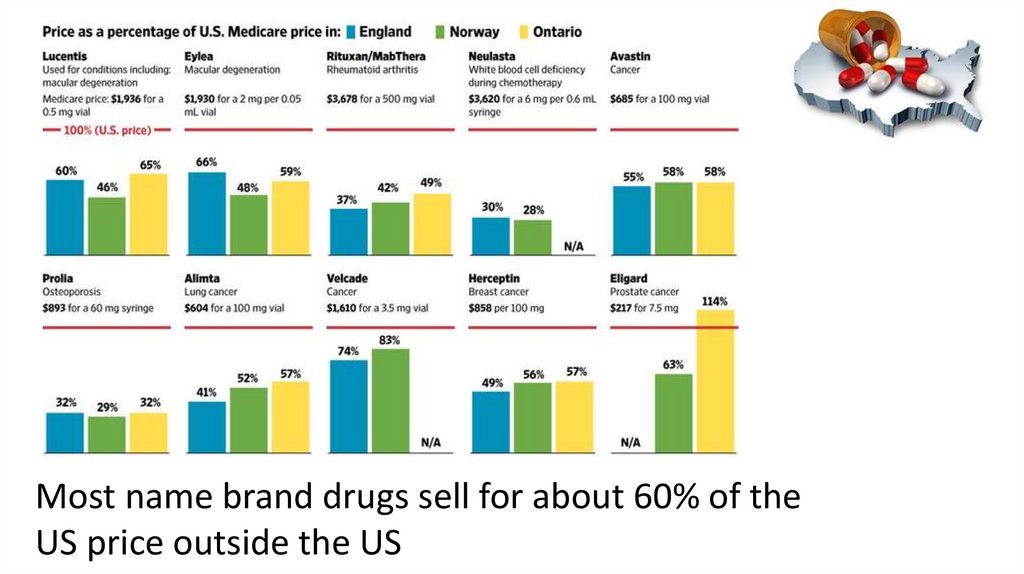
25 15
.40
25
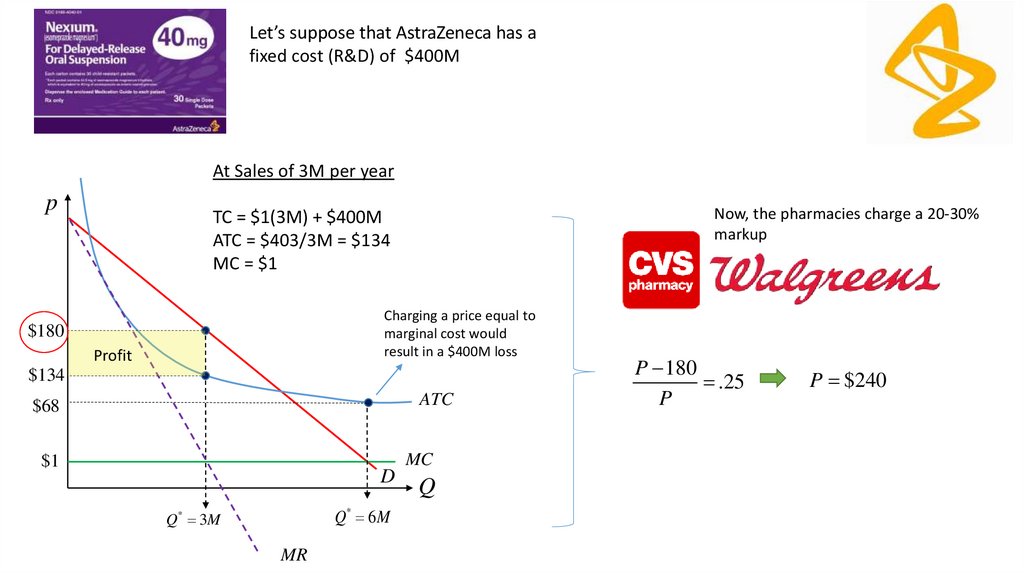
6.
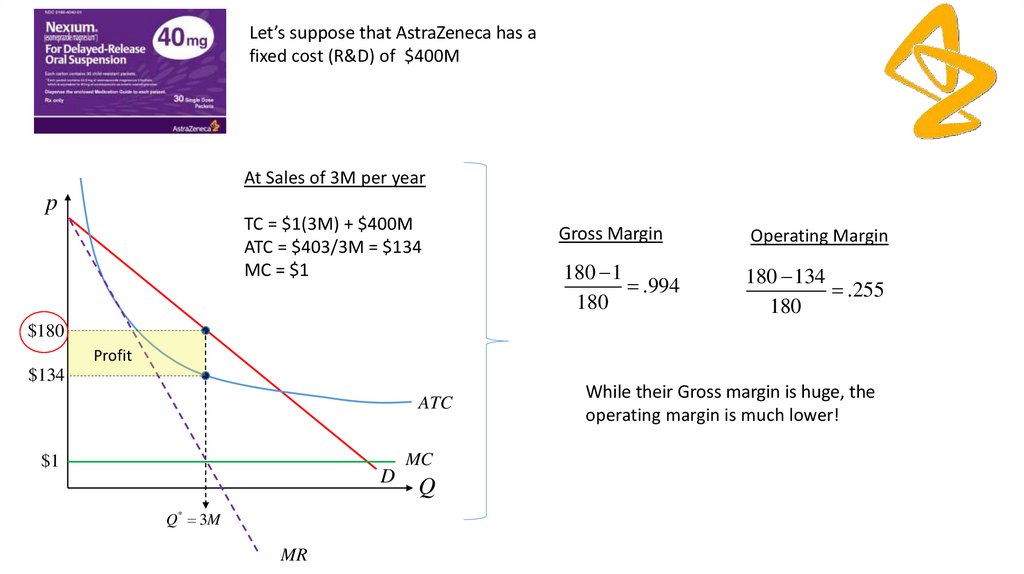
All 5 sharks invested inCharles’ idea - $1,000,000
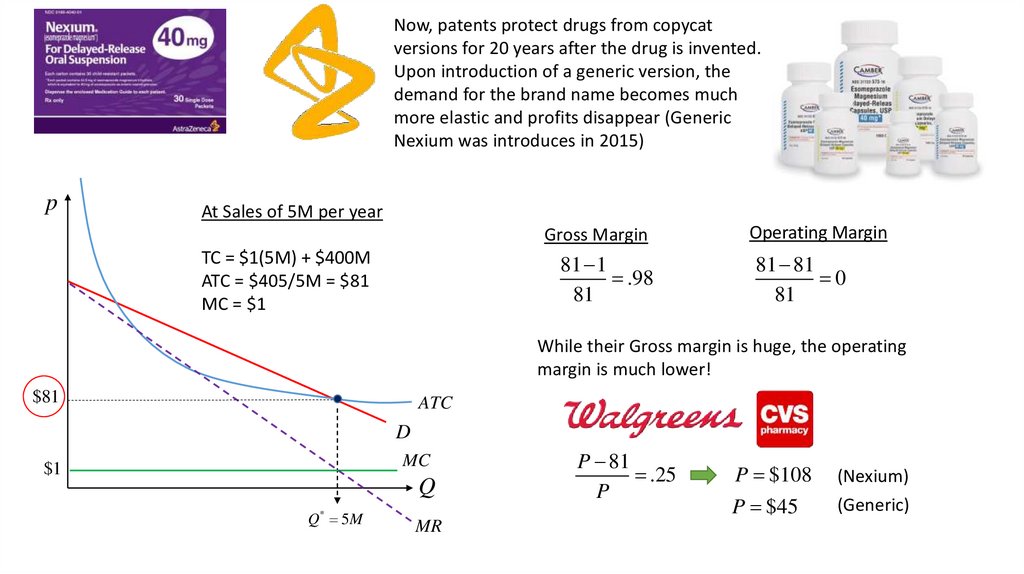
for 30% of the company.
With $3,000,000 investment, Charles needs to earn $300,000 a year to get a
10% return
$300, 000
Marginal Cost: $15
$3, 000, 000 100 10%
Fixed Cost: $50,000
Projected Annual Sales: 20,000
profit P 15 20, 000 50, 000 $300, 000
P $32.50
Gross Margin
Markup
mk
32.50 15
1.17
15
(117%)
gm
32.50 15
.54
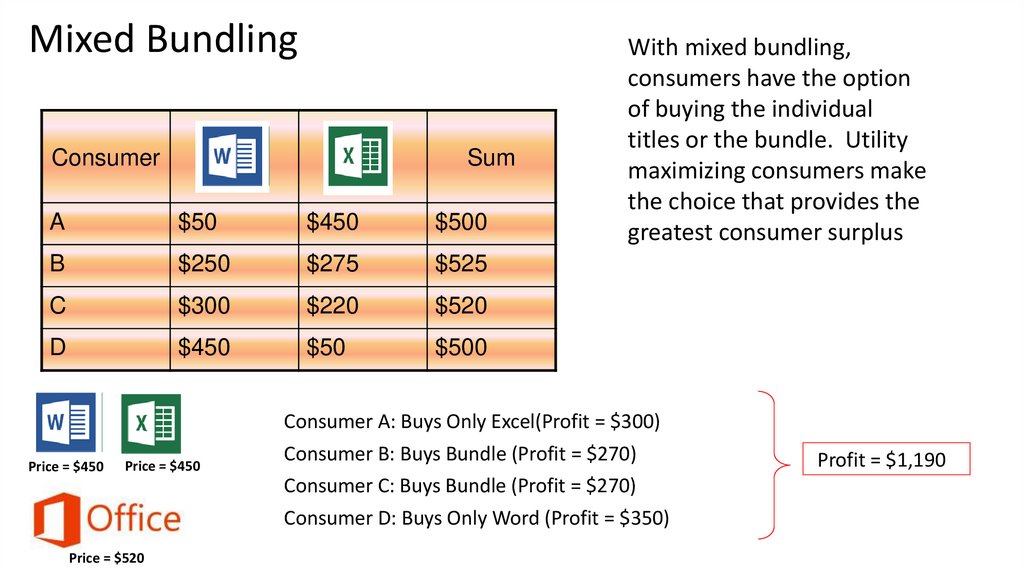
32.50
(54%)
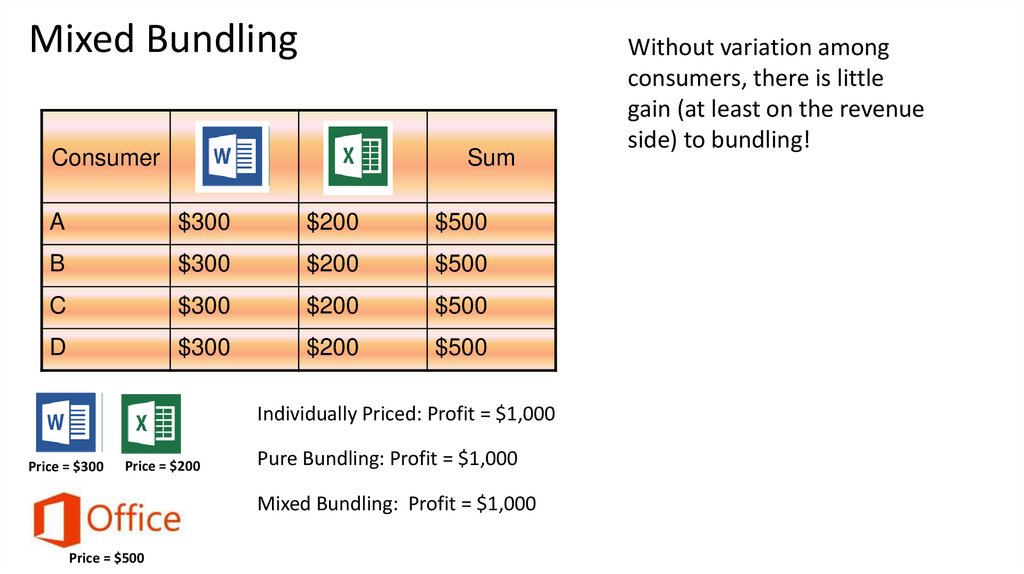
7.
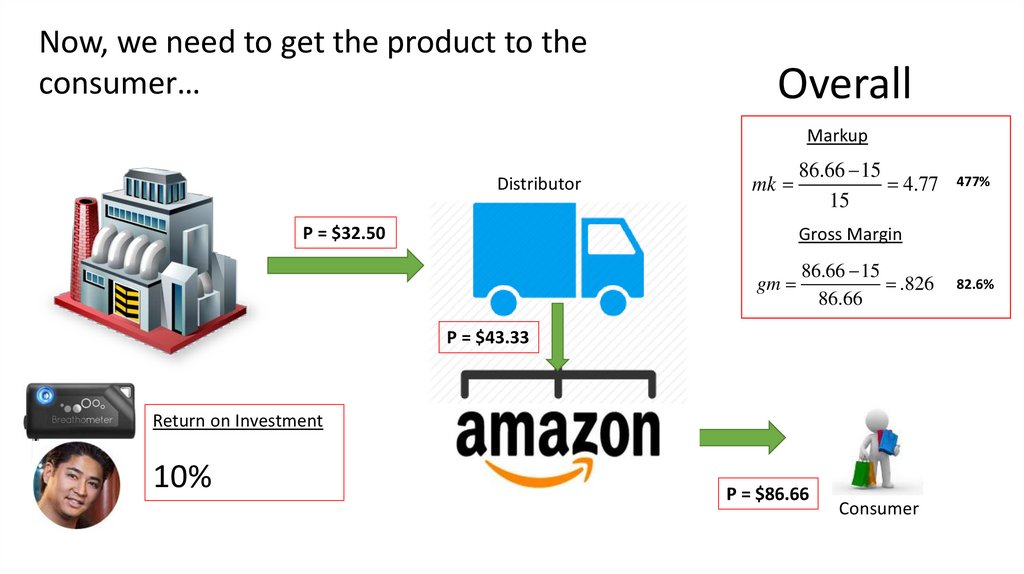
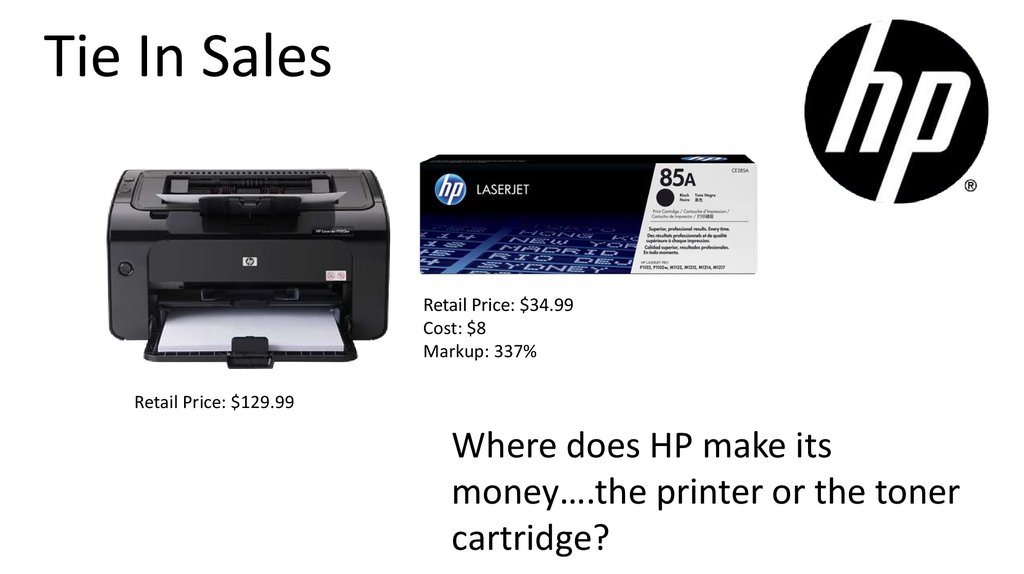
Now, we need to get the product to theconsumer…
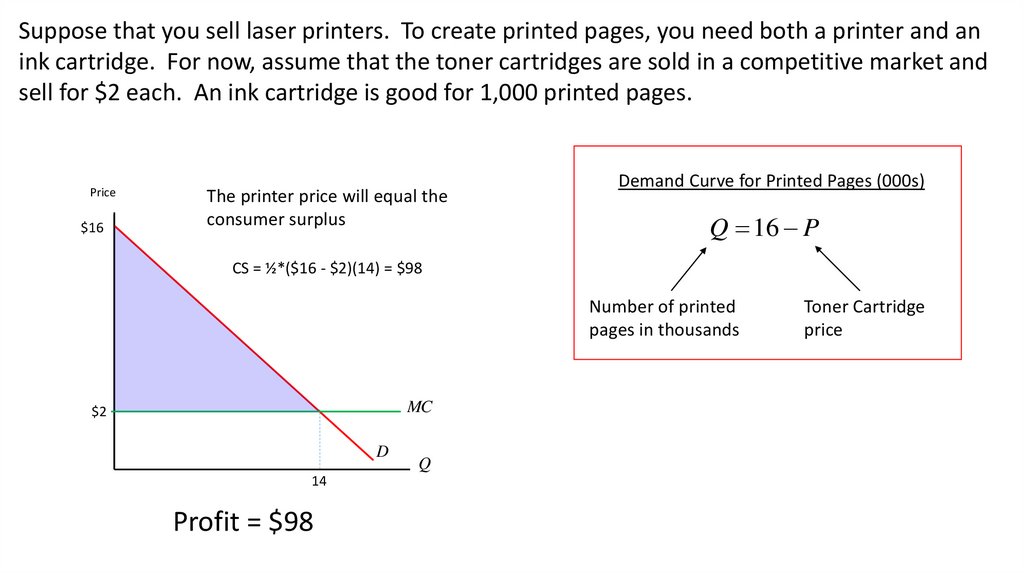
Distributor
P = $32.50
Distributors will generally get
20-30% gross margin
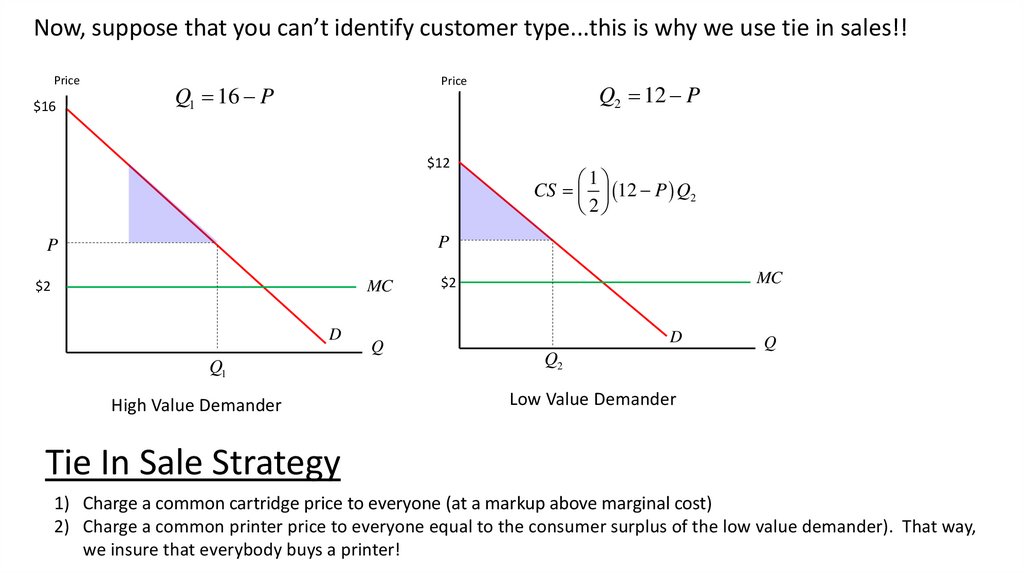
P 32.5
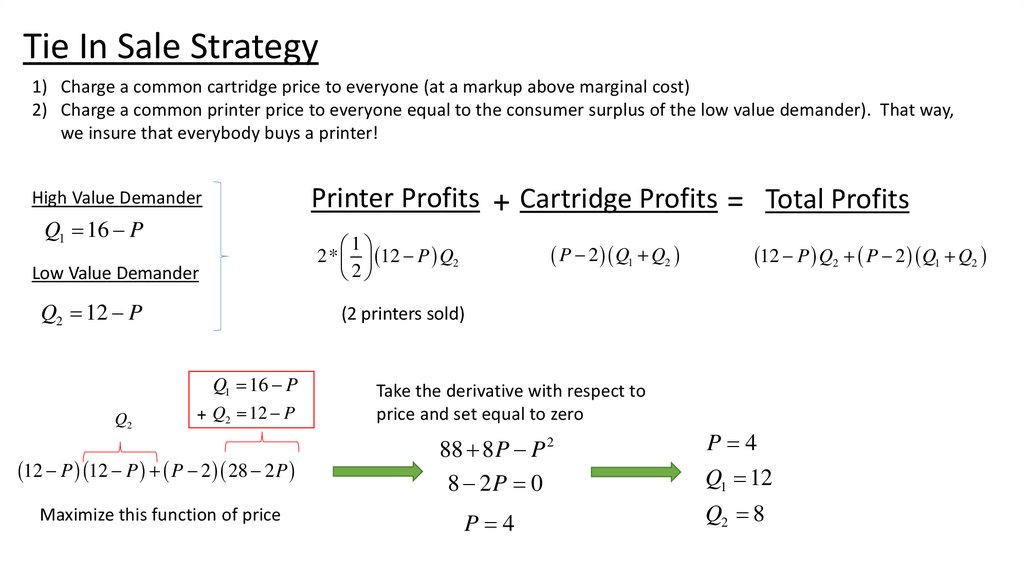
.25
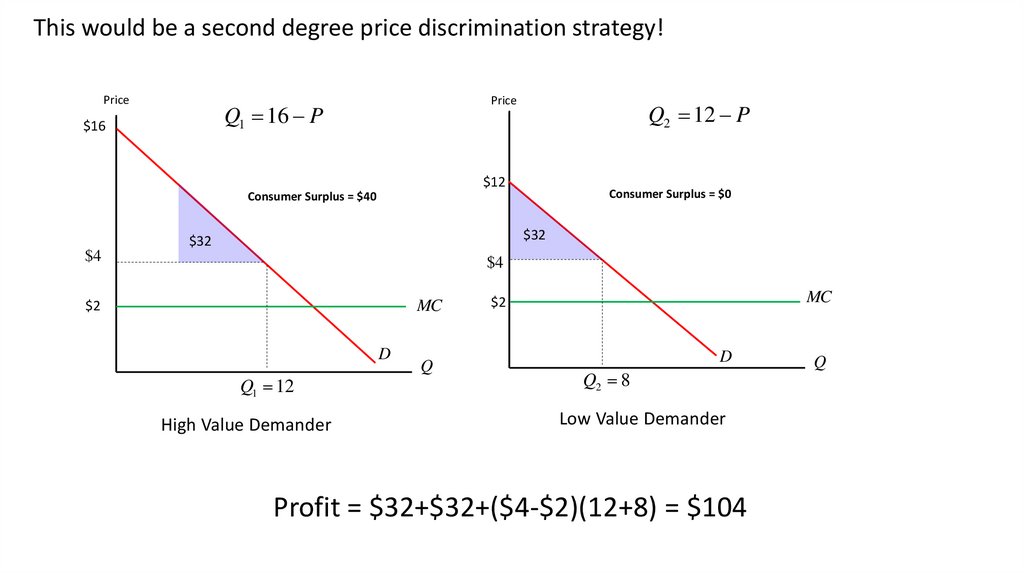
P
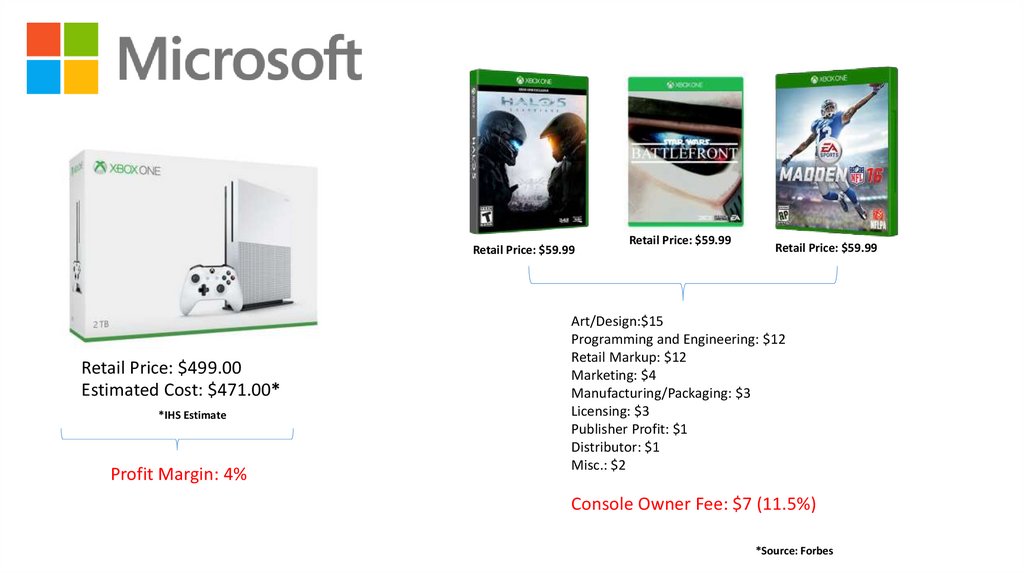
P $43.33
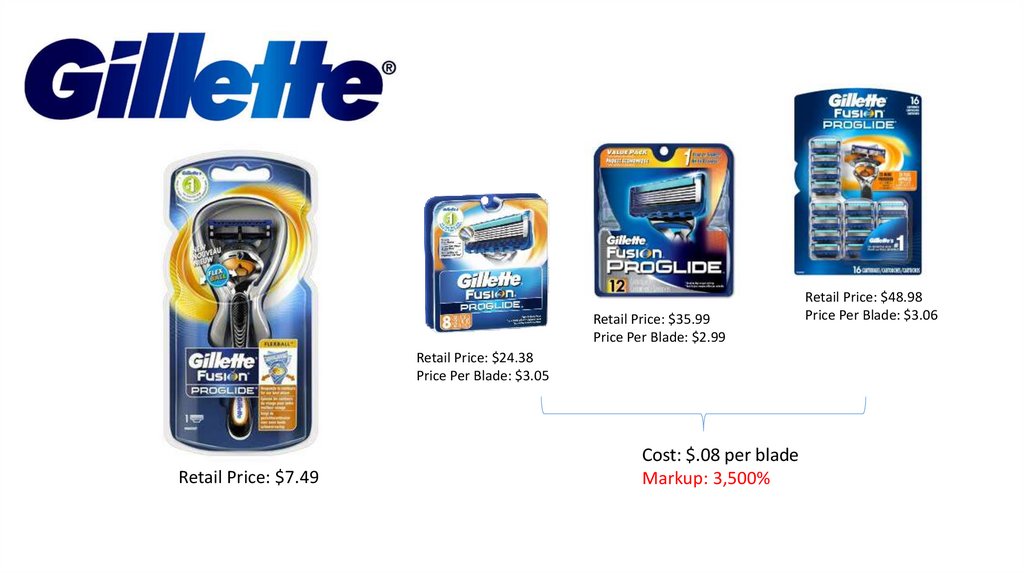
The “Keystone Margin” of
50% gross margin is the
standard for retailers
P = $43.33
P 43.33
.50
P
P $86.66
P = $86.66
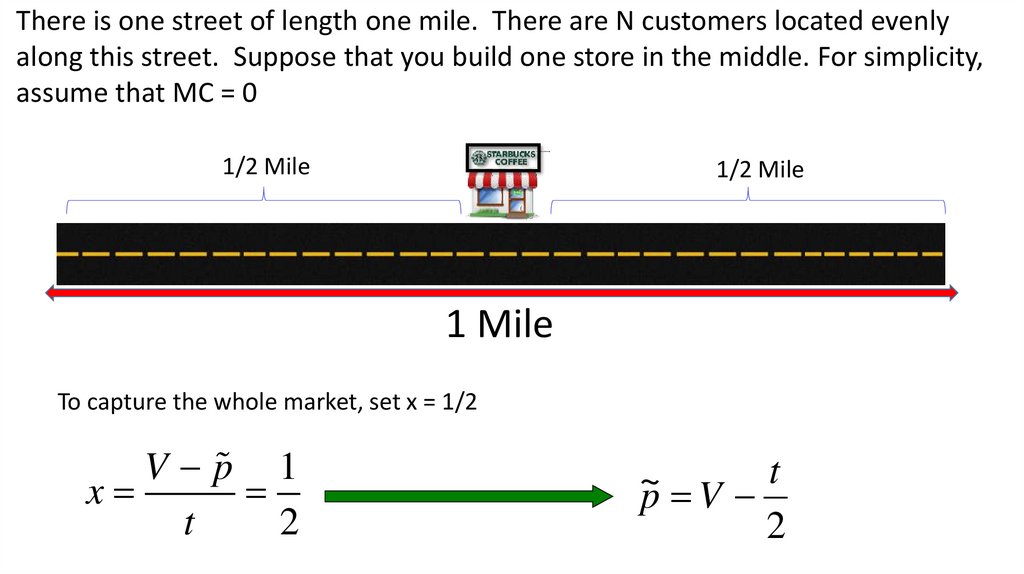
Consumer
8.
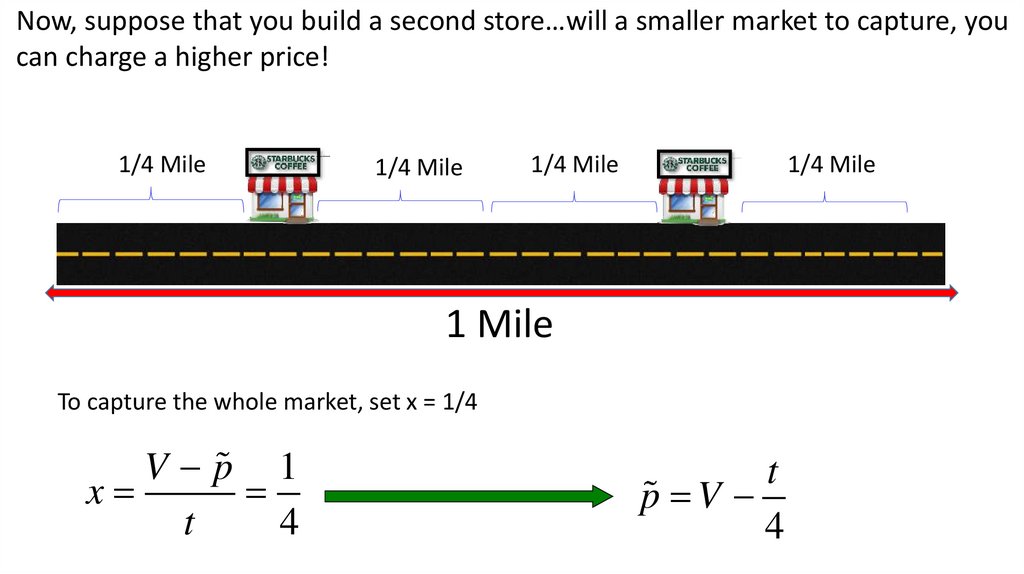
Now, we need to get the product to theconsumer…
Overall
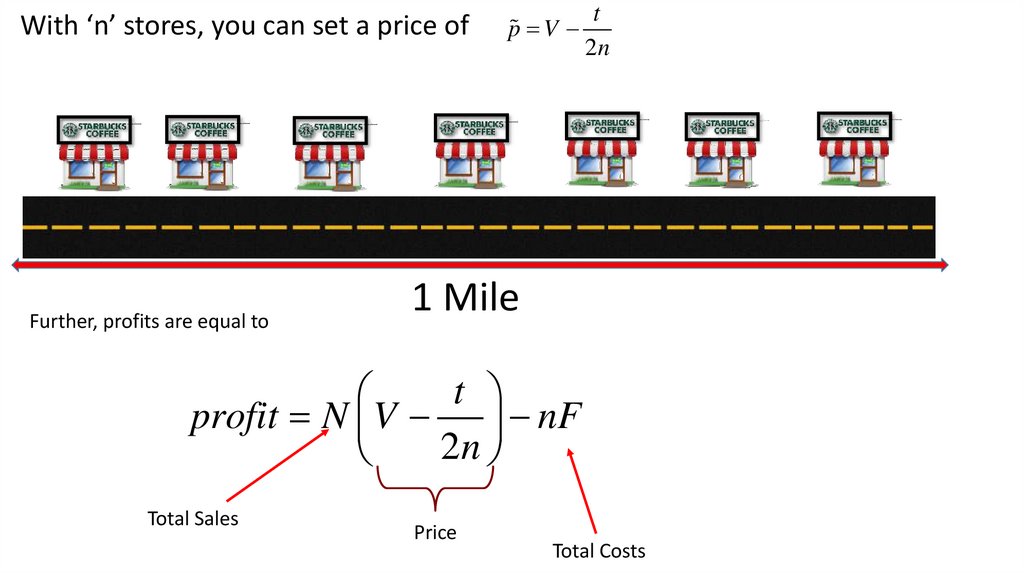
Markup
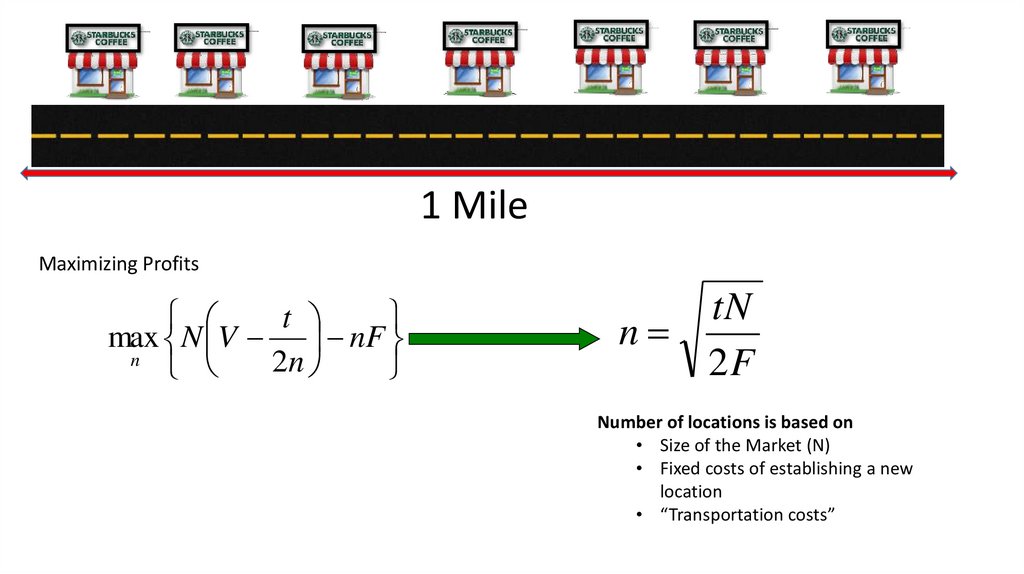
Distributor
mk
P = $32.50
86.66 15
4.77
15
Gross Margin
gm
86.66 15
.826
86.66
P = $43.33
Return on Investment
10%
477%
P = $86.66
Consumer
82.6%
9.
Retail markup data obtained from dealhack – anonline marketplace that brings together coupon
codes, promo codes and sales for hundreds of
online stores.
“The mysteries surrounding pricing have largely been eroded by the
increased access to information consumers have via the internet.
Yet, we still pay WAY TOO MUCH for certain products.”
10.
Services6,300%
5,900%
3,900%
300%
Valet Parking
490%
Lawn Services
Snow Removal
House Cleaning
Interior Painting
11.
Health Care4,500%
2,000%
1,400%
300%
MRI
500%
Overnight Hospital Stay Coronary Bypass Surgery
Brand Name Drugs
Prozac
12.
3,000%900%
1,300%
1,300%
Class Ring
Eyeglass Frames
1,000%
160%
Textbook
TI-83 Calculator
Cap and Gown
SAT Prep Class
13.
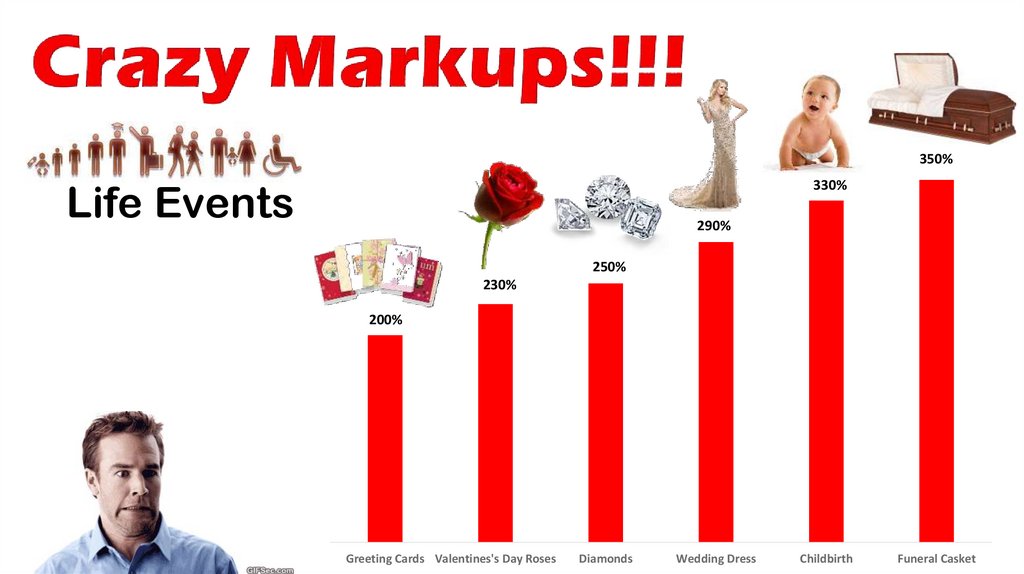
350%Life Events
330%
290%
250%
230%
200%
Greeting Cards Valentines's Day Roses
Diamonds
Wedding Dress
Childbirth
Funeral Casket
14.
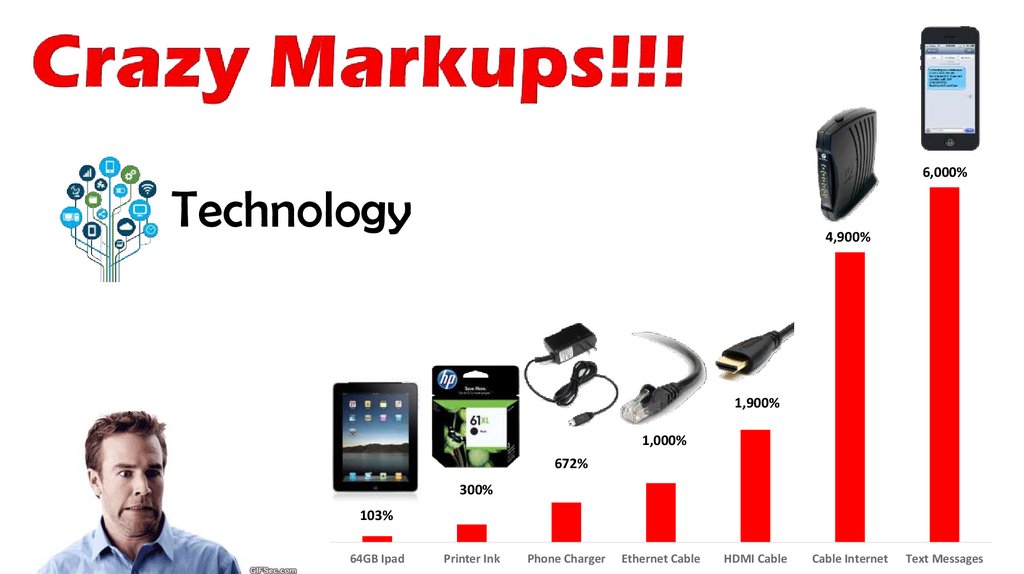
6,000%Technology
4,900%
1,900%
1,000%
672%
300%
103%
64GB Ipad
Printer Ink
Phone Charger
Ethernet Cable
HDMI Cable
Cable Internet
Text Messages
15.
1,500%1,250%
1,200%
400%
300%
200%
Movie Tickets
Coffee to Go
Restaurant Wine
Restaurant Soda
Movie Popcorn
Yankees Tickets
16.
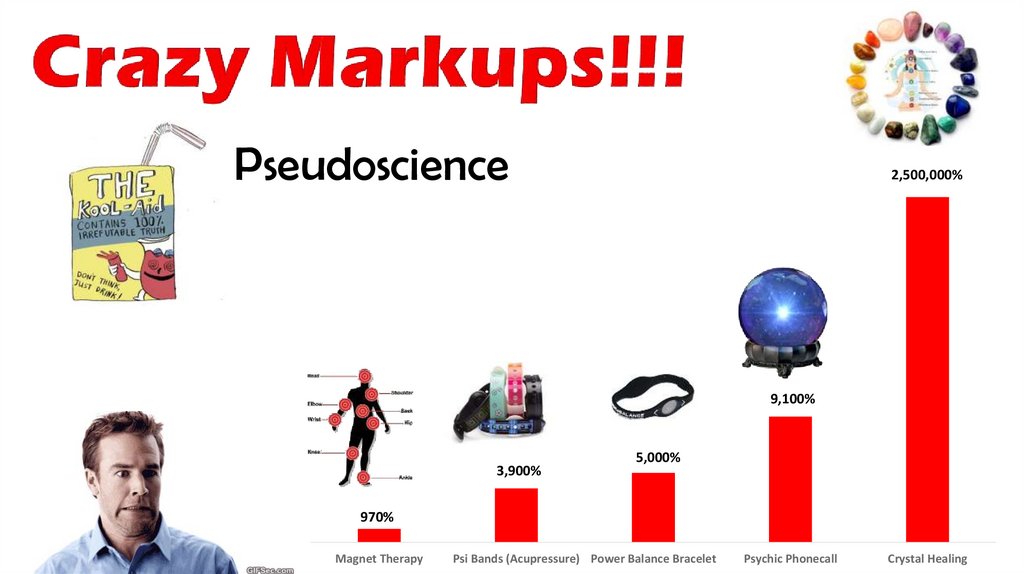
Pseudoscience2,500,000%
9,100%
3,900%
5,000%
970%
Magnet Therapy
Psi Bands (Acupressure) Power Balance Bracelet
Psychic Phonecall
Crystal Healing
17.
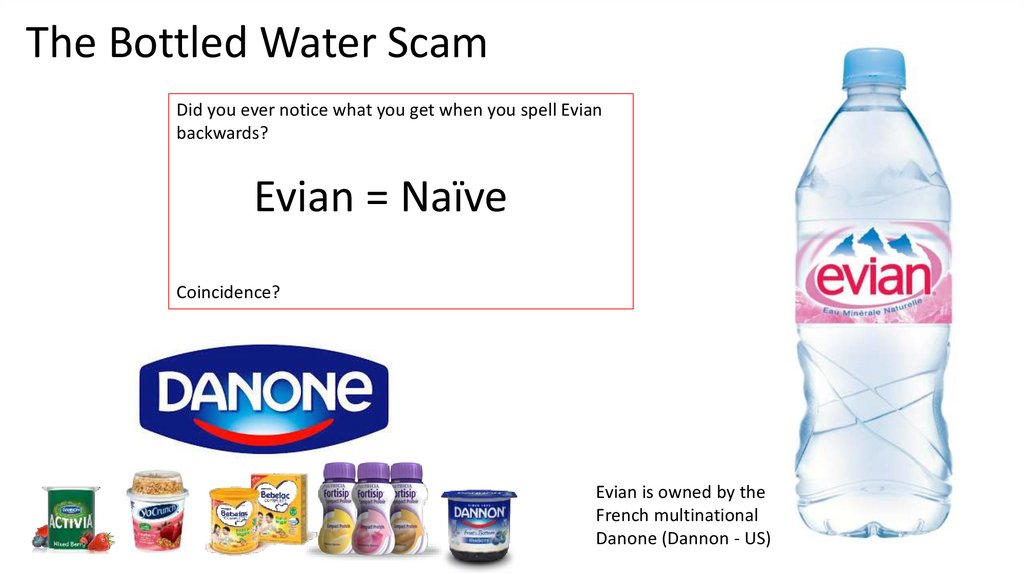
The Bottled Water ScamDid you ever notice what you get when you spell Evian
backwards?
Evian = Naïve
Coincidence?
Evian is owned by the
French multinational
Danone (Dannon - US)
18.
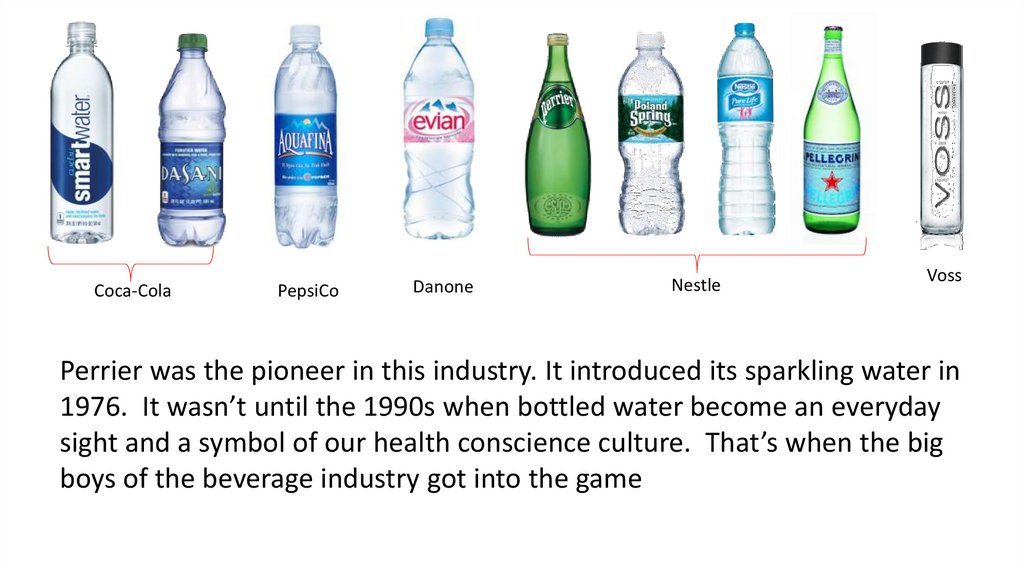
Coca-ColaPepsiCo
Danone
Nestle
Voss
Perrier was the pioneer in this industry. It introduced its sparkling water in
1976. It wasn’t until the 1990s when bottled water become an everyday
sight and a symbol of our health conscience culture. That’s when the big
boys of the beverage industry got into the game
19.
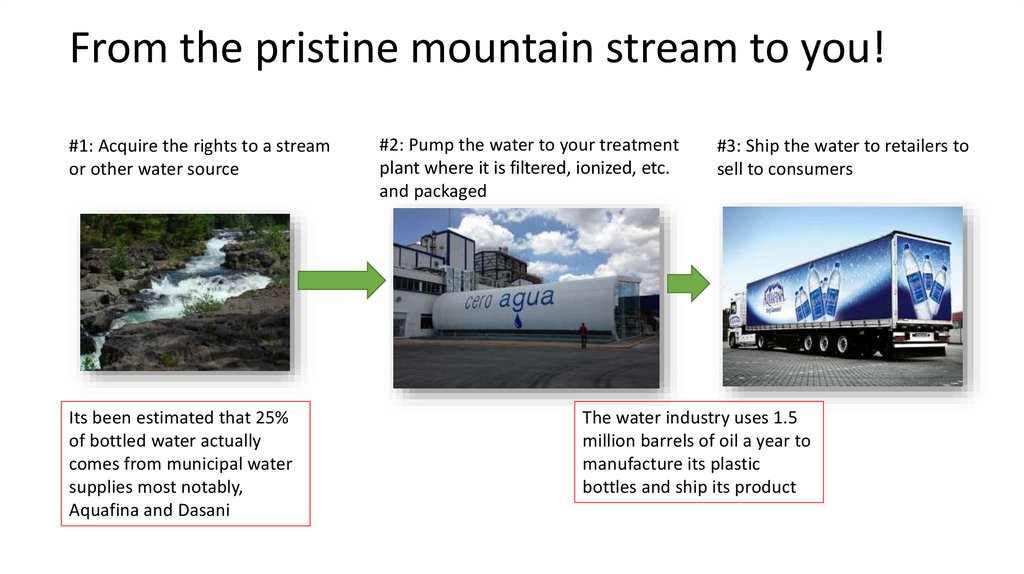
From the pristine mountain stream to you!#1: Acquire the rights to a stream
or other water source
Its been estimated that 25%
of bottled water actually
comes from municipal water
supplies most notably,
Aquafina and Dasani
#2: Pump the water to your treatment
plant where it is filtered, ionized, etc.
and packaged
#3: Ship the water to retailers to
sell to consumers
The water industry uses 1.5
million barrels of oil a year to
manufacture its plastic
bottles and ship its product
20.
Marketing WaterBottled H2O is being directly or indirectly sold as: healthy, smart, pure, sexy,
clean and simple, it is "the stuff of life."
"Treat yourself
well. Everyday."
"Fills you with
volcanicity."
"So pure, we
promise nothing."
“Drink Better, Live
Better."
"Approved by your
body as a source of
youth."
Bottled water spends $61 Million a year in advertising
21.
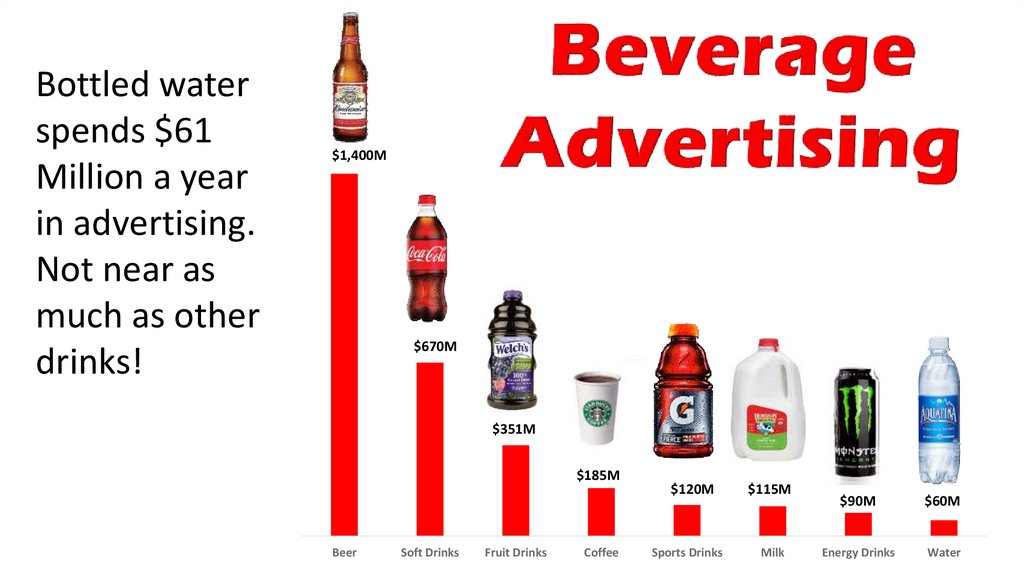
Bottled waterspends $61
Million a year
in advertising.
Not near as
much as other
drinks!
$1,400M
$670M
$351M
$185M
Beer
Soft Drinks
Fruit Drinks
Coffee
$120M
Sports Drinks
$115M
Milk
$90M
$60M
Energy Drinks
Water
22.
Bottom line…bottles water has a 8,500% markup!Cost
Price
• Tap water
$1.50 for 1,000 Gal
($0.0002 for 20oz.)
• Bottle/Label: $0.02
Markup
Markup
mk
1.75 .0202
85.63
.0202
Gross Margin
gm
1.75 .0202
.988
1.75
20 Oz: $1.75
128 oz. in a
gallon
Total MC: $0.0202
$11.20/Gal.
*Bought in bulk at Costco,
we can get that markup
down to about 3500%
23.
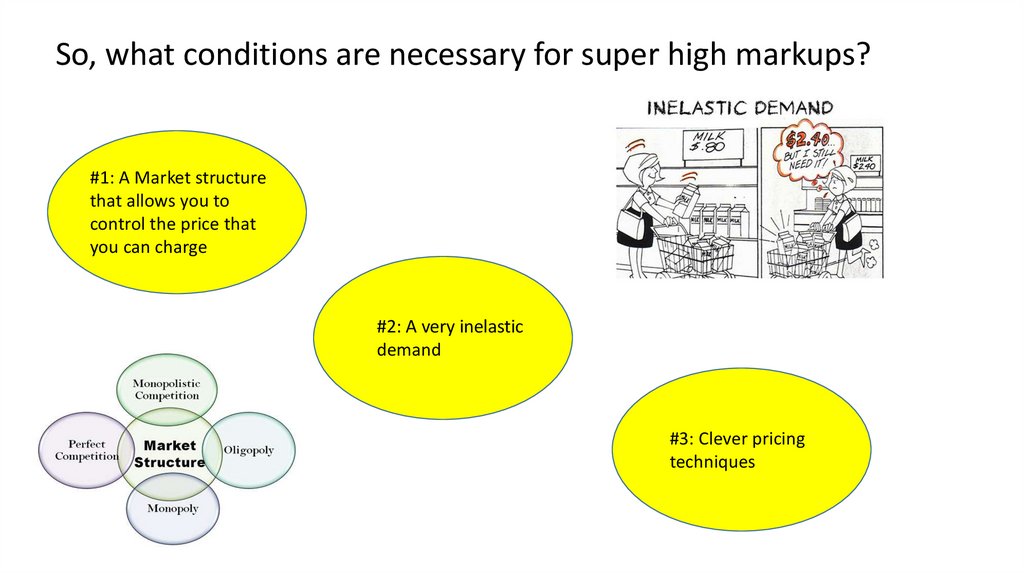
So, what conditions are necessary for super high markups?#1: A Market structure
that allows you to
control the price that
you can charge
#2: A very inelastic
demand
#3: Clever pricing
techniques
24.
Market StructureSpectrum
Monopoly
One firm
Significant artificial or legal
barriers to entry
Market power
Economic profits
High Market Concentration
Monopolistic
Oligopoly
Competition
Very few large firms
Standardized or differentiated
products
Significant barriers to entry
Market power
Interdependent pricing strategies
Many firms
differentiated products
low barriers to entry
Market power
Non-price competition
Lots of advertising
Perfect
Competition
Many very small firms
Standardized products
No barriers to entry
No market power (price takers)
Zero economic profit (reasonable
rate of return)
Low Market Concentration
25.
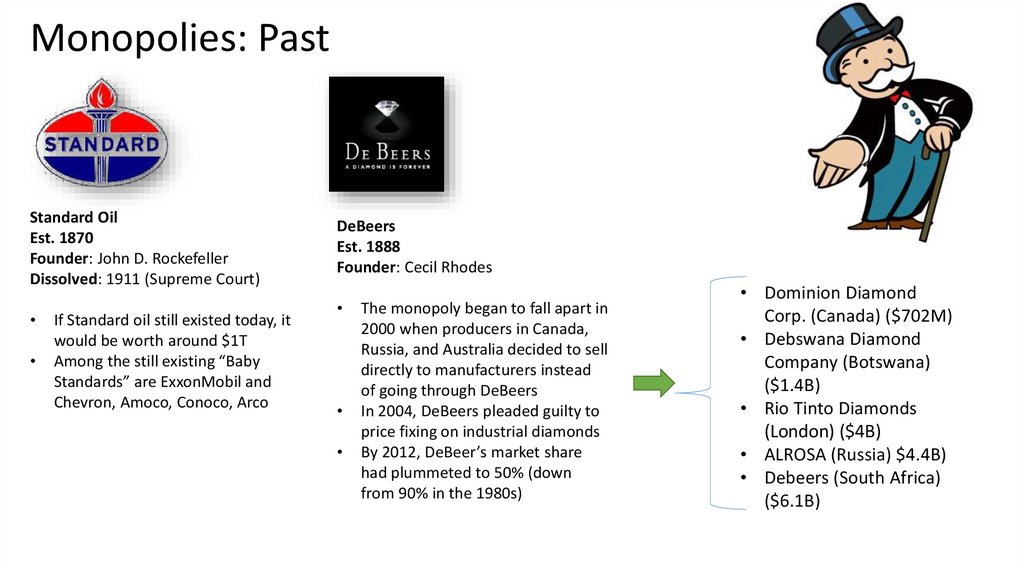
Monopolies: PastStandard Oil
Est. 1870
Founder: John D. Rockefeller
Dissolved: 1911 (Supreme Court)
If Standard oil still existed today, it
would be worth around $1T
Among the still existing “Baby
Standards” are ExxonMobil and
Chevron, Amoco, Conoco, Arco
DeBeers
Est. 1888
Founder: Cecil Rhodes
The monopoly began to fall apart in
2000 when producers in Canada,
Russia, and Australia decided to sell
directly to manufacturers instead
of going through DeBeers
In 2004, DeBeers pleaded guilty to
price fixing on industrial diamonds
By 2012, DeBeer’s market share
had plummeted to 50% (down
from 90% in the 1980s)
• Dominion Diamond
Corp. (Canada) ($702M)
• Debswana Diamond
Company (Botswana)
($1.4B)
• Rio Tinto Diamonds
(London) ($4B)
• ALROSA (Russia) $4.4B)
• Debeers (South Africa)
($6.1B)
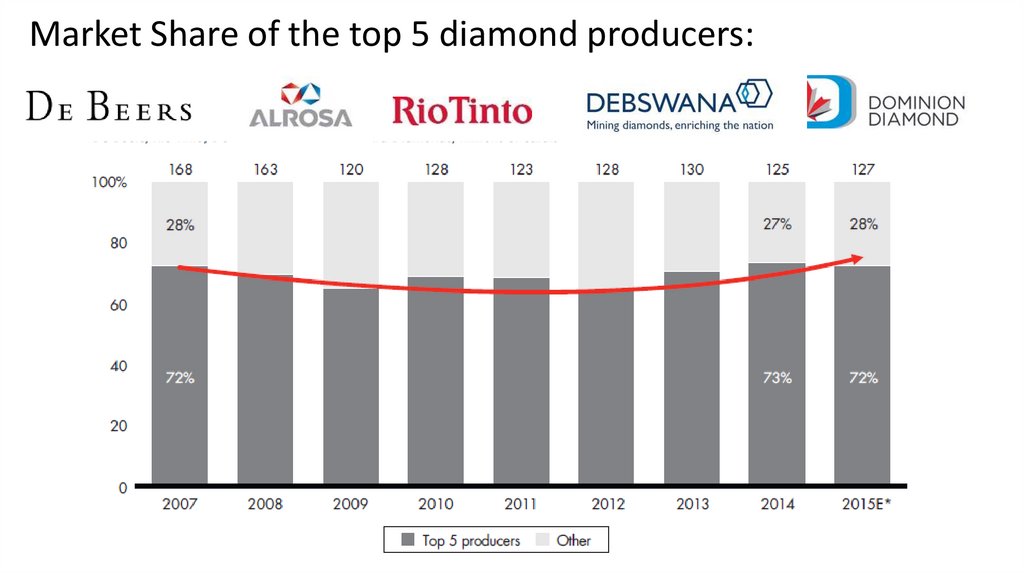
26.
Market Share of the top 5 diamond producers:27.
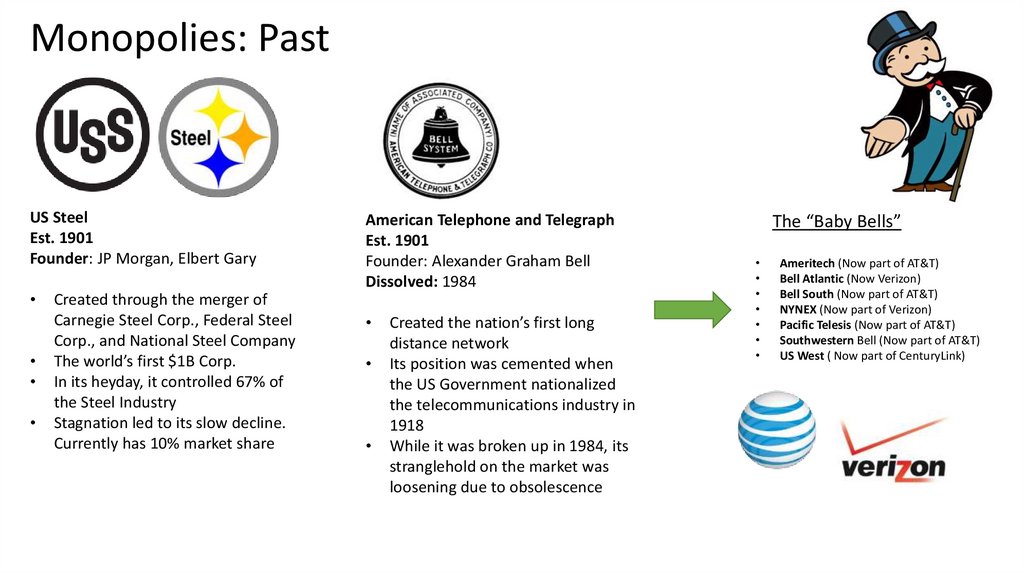
Monopolies: PastUS Steel
Est. 1901
Founder: JP Morgan, Elbert Gary
Created through the merger of
Carnegie Steel Corp., Federal Steel
Corp., and National Steel Company
The world’s first $1B Corp.
In its heyday, it controlled 67% of
the Steel Industry
Stagnation led to its slow decline.
Currently has 10% market share
American Telephone and Telegraph
Est. 1901
Founder: Alexander Graham Bell
Dissolved: 1984
Created the nation’s first long
distance network
Its position was cemented when
the US Government nationalized
the telecommunications industry in
1918
While it was broken up in 1984, its
stranglehold on the market was
loosening due to obsolescence
The “Baby Bells”
Ameritech (Now part of AT&T)
Bell Atlantic (Now Verizon)
Bell South (Now part of AT&T)
NYNEX (Now part of Verizon)
Pacific Telesis (Now part of AT&T)
Southwestern Bell (Now part of AT&T)
US West ( Now part of CenturyLink)
28.
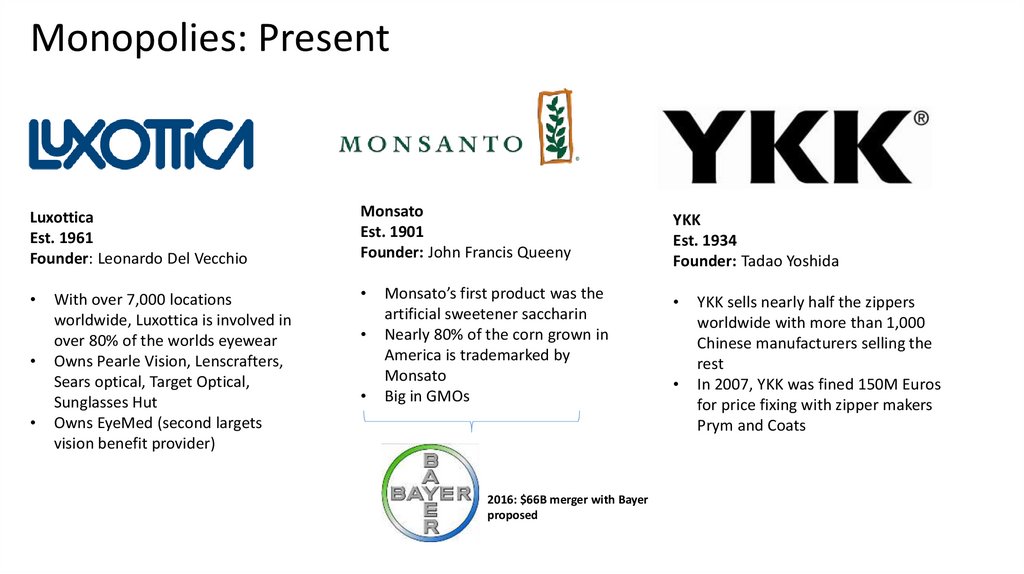
Monopolies: PresentLuxottica
Est. 1961
Founder: Leonardo Del Vecchio
Monsato
Est. 1901
Founder: John Francis Queeny
With over 7,000 locations
worldwide, Luxottica is involved in
over 80% of the worlds eyewear
Owns Pearle Vision, Lenscrafters,
Sears optical, Target Optical,
Sunglasses Hut
Owns EyeMed (second largets
vision benefit provider)
Monsato’s first product was the
artificial sweetener saccharin
Nearly 80% of the corn grown in
America is trademarked by
Monsato
Big in GMOs
2016: $66B merger with Bayer
proposed
YKK
Est. 1934
Founder: Tadao Yoshida
YKK sells nearly half the zippers
worldwide with more than 1,000
Chinese manufacturers selling the
rest
In 2007, YKK was fined 150M Euros
for price fixing with zipper makers
Prym and Coats
29.
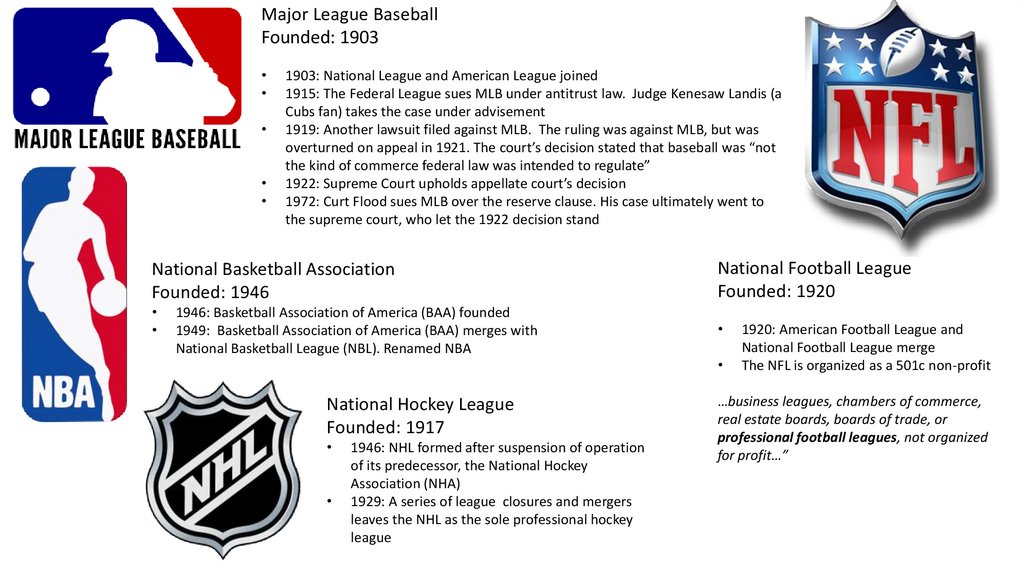
Major League BaseballFounded: 1903
1903: National League and American League joined
1915: The Federal League sues MLB under antitrust law. Judge Kenesaw Landis (a
Cubs fan) takes the case under advisement
1919: Another lawsuit filed against MLB. The ruling was against MLB, but was
overturned on appeal in 1921. The court’s decision stated that baseball was “not
the kind of commerce federal law was intended to regulate”
1922: Supreme Court upholds appellate court’s decision
1972: Curt Flood sues MLB over the reserve clause. His case ultimately went to
the supreme court, who let the 1922 decision stand
National Basketball Association
Founded: 1946
National Football League
Founded: 1920
1946: Basketball Association of America (BAA) founded
1949: Basketball Association of America (BAA) merges with
National Basketball League (NBL). Renamed NBA
National Hockey League
Founded: 1917
1946: NHL formed after suspension of operation
of its predecessor, the National Hockey
Association (NHA)
1929: A series of league closures and mergers
leaves the NHL as the sole professional hockey
league
1920: American Football League and
National Football League merge
The NFL is organized as a 501c non-profit
…business leagues, chambers of commerce,
real estate boards, boards of trade, or
professional football leagues, not organized
for profit…”
30.
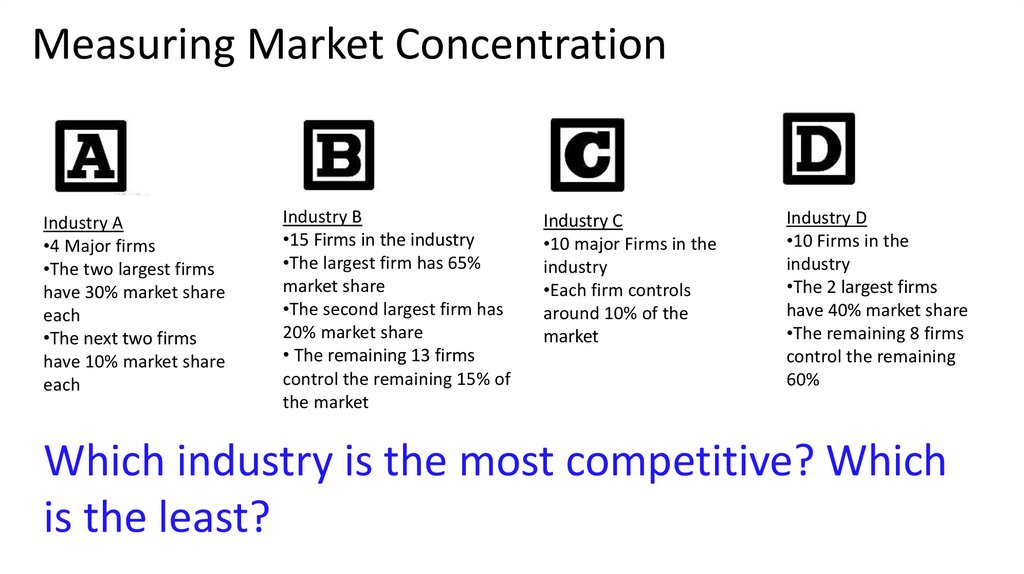
Measuring Market ConcentrationIndustry A
•4 Major firms
•The two largest firms
have 30% market share
each
•The next two firms
have 10% market share
each
Industry B
•15 Firms in the industry
•The largest firm has 65%
market share
•The second largest firm has
20% market share
• The remaining 13 firms
control the remaining 15% of
the market
Industry C
•10 major Firms in the
industry
•Each firm controls
around 10% of the
market
Industry D
•10 Firms in the
industry
•The 2 largest firms
have 40% market share
•The remaining 8 firms
control the remaining
60%
Which industry is the most competitive? Which
is the least?
31.
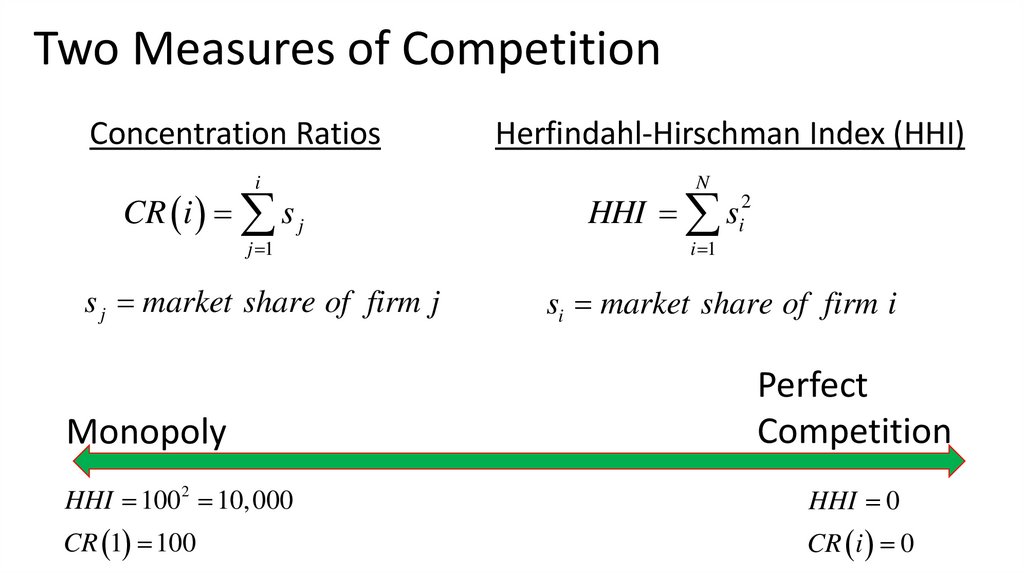
Two Measures of CompetitionConcentration Ratios
i
CR i s j
j 1
s j market share of firm j
Monopoly
Herfindahl-Hirschman Index (HHI)
N
HHI s
i 1
2
i
si market share of firm i
Perfect
Competition
HHI 1002 10, 000
HHI 0
CR 1 100
CR i 0
32.
Herfindahl-Hirschman Index (HHI)N
HHI si2
i 1
si market share of firm i
“The agencies generally consider markets in which the HHI is between 1,500 and 2,500 points to be
moderately concentrated, and consider markets in which the HHI is in excess of 2,500 points to be highly
concentrated. Transactions that increase the HHI by more than 200 points in highly concentrated markets
are presumed likely to enhance market power under the Horizontal Merger Guidelines issued by the
Department of Justice and the Federal Trade Commission.
33.
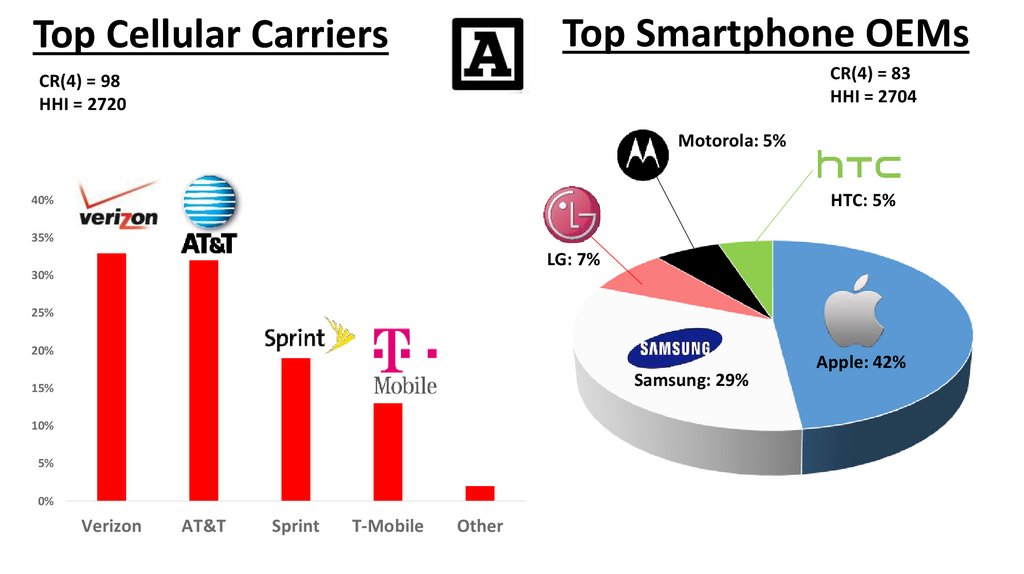
Top Smartphone OEMsTop Cellular Carriers
CR(4) = 83
HHI = 2704
CR(4) = 98
HHI = 2720
Motorola: 5%
HTC: 5%
40%
35%
LG: 7%
30%
25%
20%
Samsung: 29%
15%
10%
5%
0%
Verizon
AT&T
Sprint
T-Mobile
Other
Apple: 42%
34.
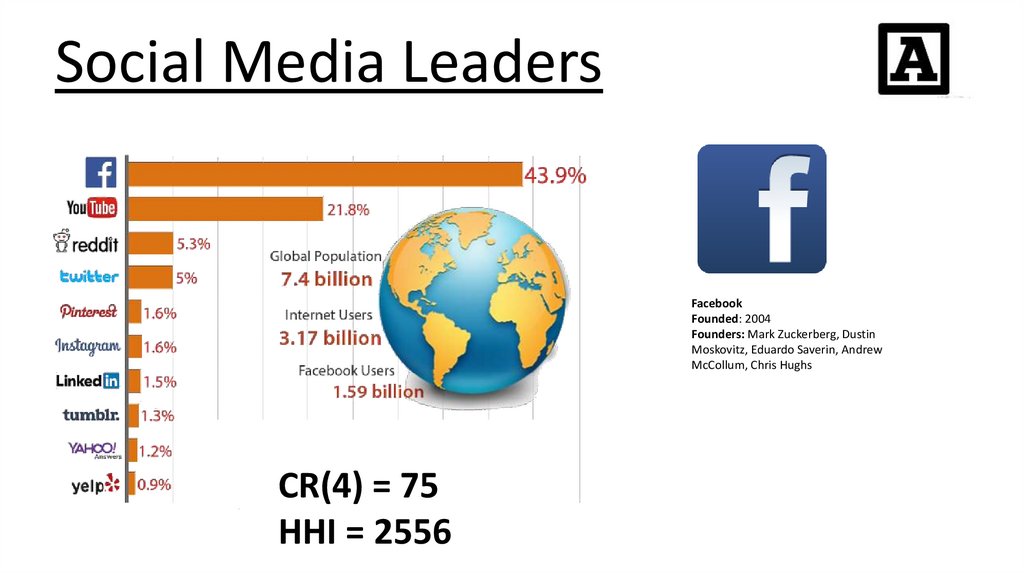
Social Media LeadersFounded: 2004
Founders: Mark Zuckerberg, Dustin
Moskovitz, Eduardo Saverin, Andrew
McCollum, Chris Hughs
CR(4) = 75
HHI = 2556
35.
Digital Movie ServicesNetflix
Founded: 1997
Founders: Reed Hastings
CR(4) = 77
HHI = 4233
Top Search Engines
Founded: 1998
Founders: Larry Page, Sergey Brin
CR(4) = 98.7
HHI = 4975
36.
The Big 1037.
Food (21,355 Companies)HHI = 102
CR(4) = 14.8
CR(8) = 22.8
CR(20) = 37.6
CR(50) = 50.8
Quaker
(PepsiCo): 6%
Mom Brands:7%
Private Label: 9%
Other:3%
Breakfast Cereals (35 Companies)
Kellogg's: 32%
General Mills: 31%
Post: 11%
HHI = 2,425
CR(4) = 80
CR(8) = 91.9
CR(20) = 99.6
38.
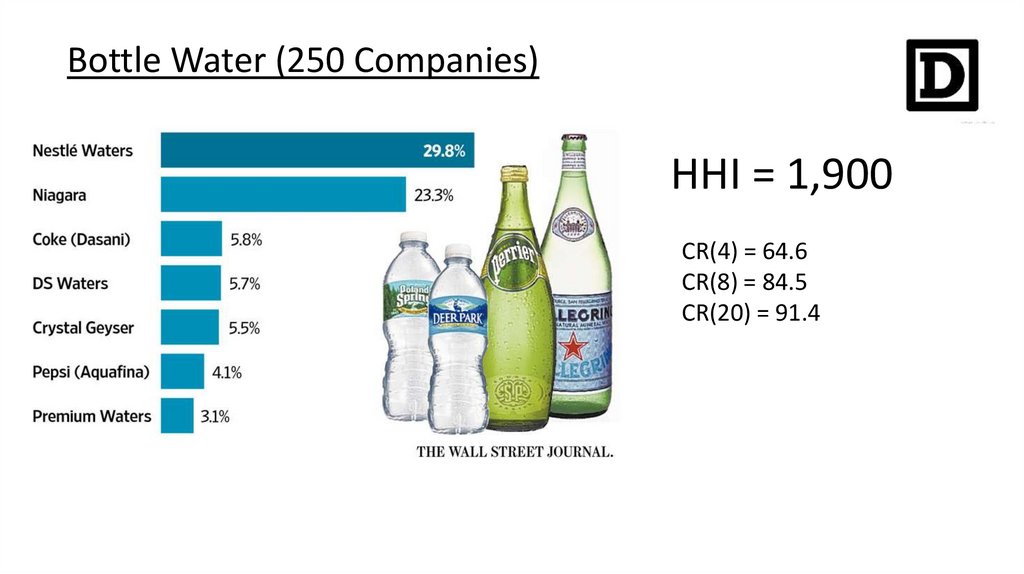
Bottle Water (250 Companies)HHI = 1,900
CR(4) = 64.6
CR(8) = 84.5
CR(20) = 91.4
39.
AB InBevFounded: 2004
• 2004: Created from the merger of the
Belgian Company Interbrew and the
Brazilian Company AmBev
• 2008: InBev purchases Anheuser-Busch
($52 Billion)
• 2016: Merger with SAB Miller ($100B+)
40.
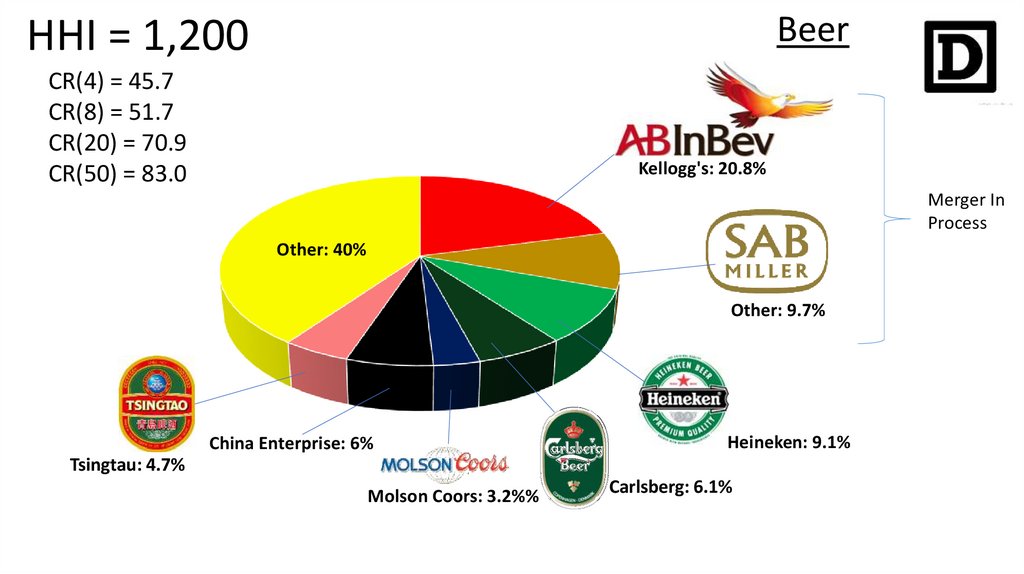
BeerHHI = 1,200
CR(4) = 45.7
CR(8) = 51.7
CR(20) = 70.9
CR(50) = 83.0
Kellogg's: 20.8%
Merger In
Process
Other: 40%
Other: 9.7%
China Enterprise: 6%
Heineken: 9.1%
Tsingtau: 4.7%
Molson Coors: 3.2%%
Carlsberg: 6.1%
41.
Note that competition depends onhow you define the market!!
Microsoft
Founded: 1975
Founders: Bill Gates, Paul Allen
CR(4) = 97
HHI = 7806
42.
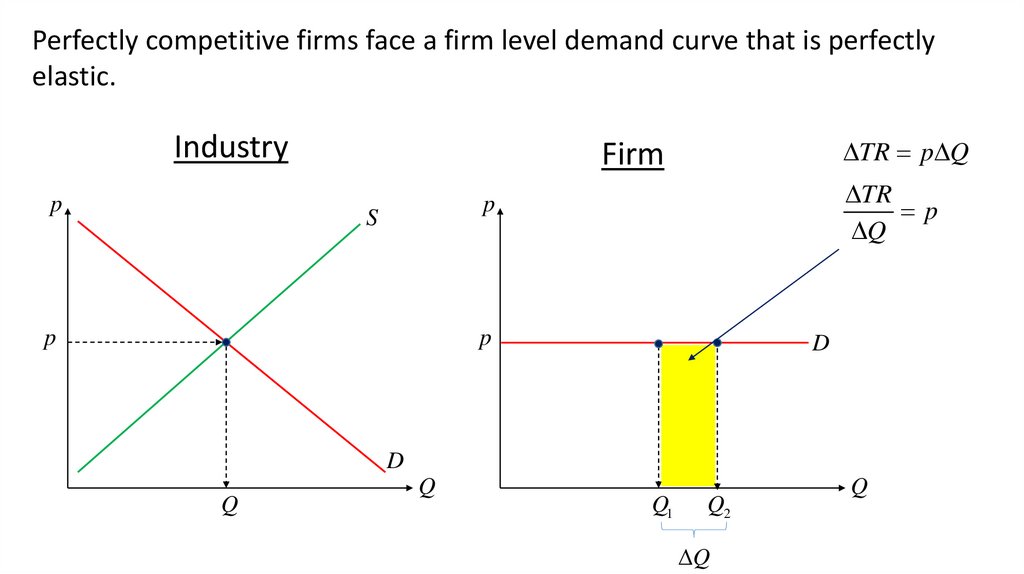
Perfectly competitive firms face a firm level demand curve that is perfectlyelastic.
Industry
p
TR p Q
Firm
TR
p
Q
p
S
p
p
D
D
Q
Q
Q1
Q2
Q
Q
43.
This leads to profit maximizing behavior with price equaling marginal cost(zero markup)
Market
p
Firm
p
S
MC
p MC
p MR
p
D
Total Revenues= P*Q
D
Q
Q
Q1
Q
44.
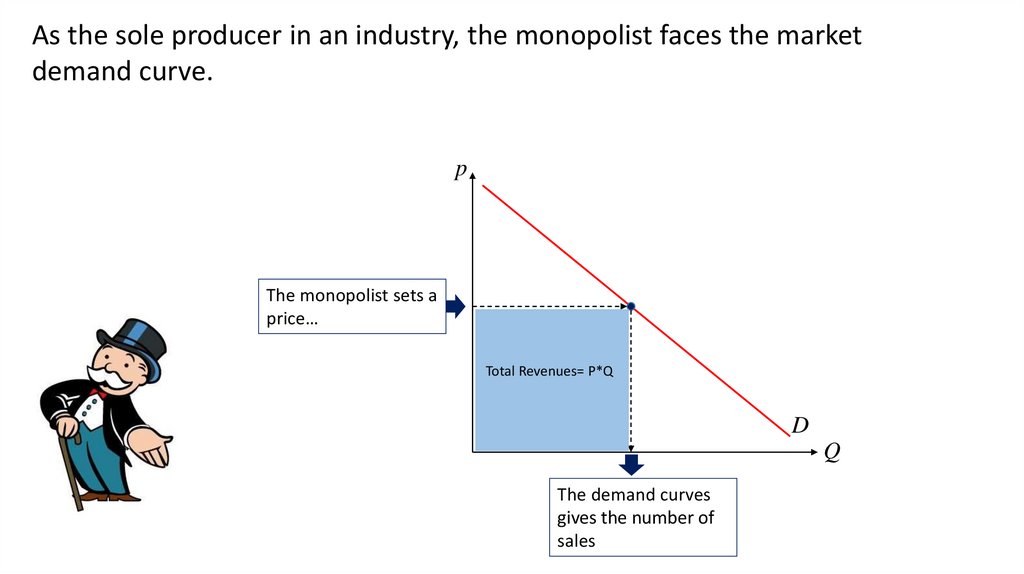
As the sole producer in an industry, the monopolist faces the marketdemand curve.
p
The monopolist sets a
price…
Total Revenues= P*Q
D
Q
The demand curves
gives the number of
sales
45.
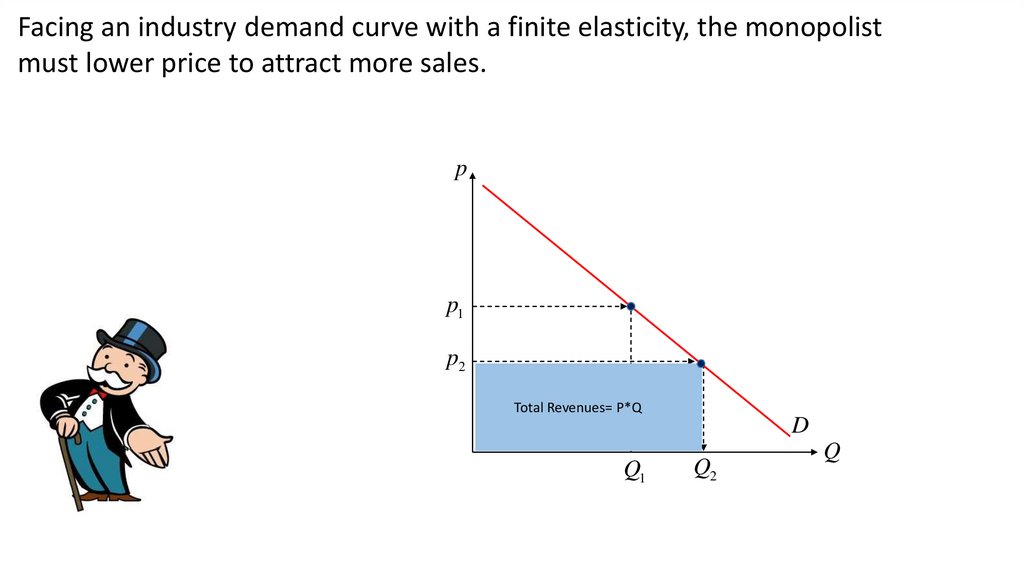
Facing an industry demand curve with a finite elasticity, the monopolistmust lower price to attract more sales.
p
p1
p2
Total Revenues= P*Q
D
Q1
Q2
Q
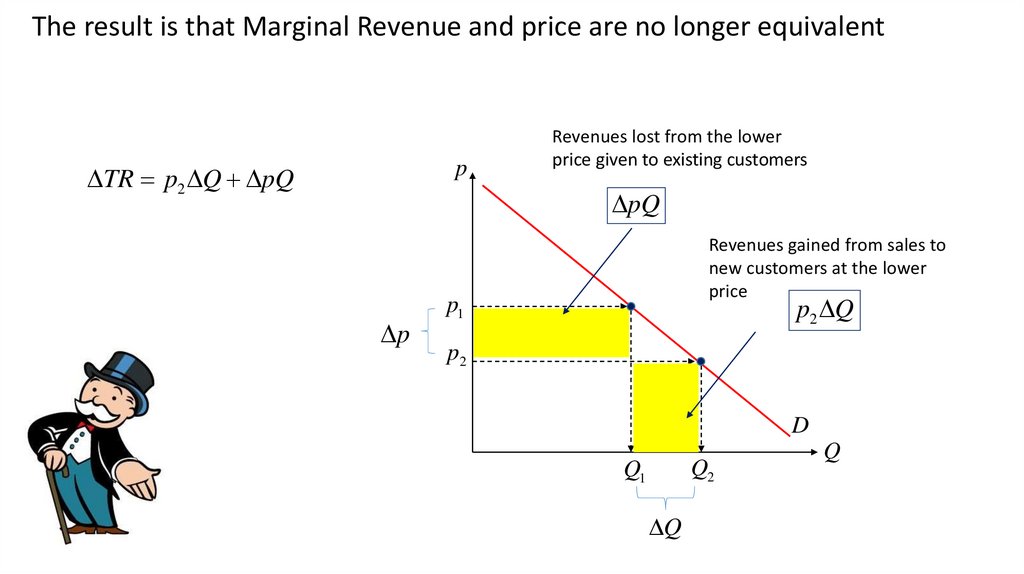
46.
The result is that Marginal Revenue and price are no longer equivalentp
TR p2 Q pQ
Revenues lost from the lower
price given to existing customers
pQ
p
Revenues gained from sales to
new customers at the lower
price
p2 Q
p1
p2
D
Q2
Q1
Q
Q
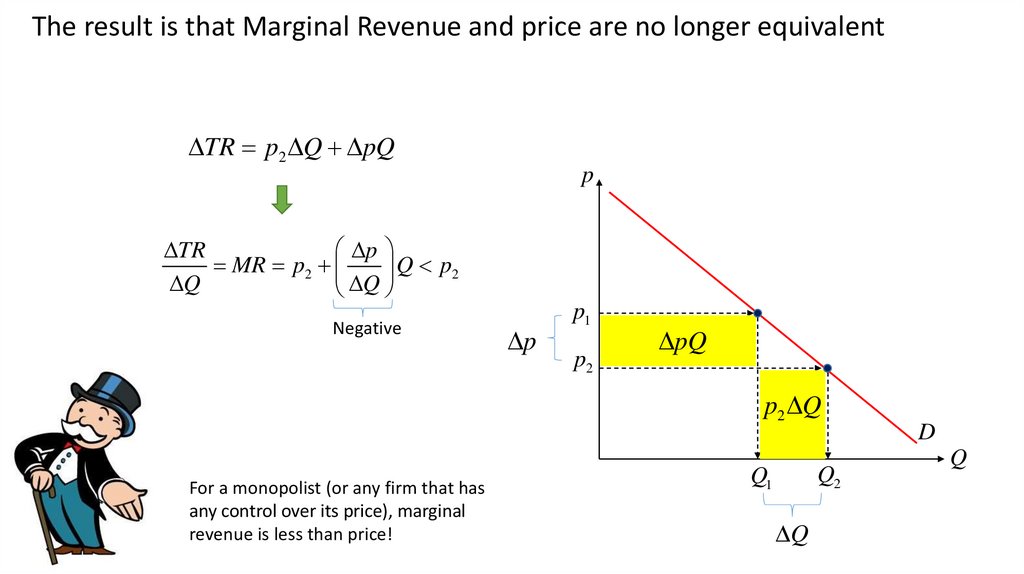
47.
The result is that Marginal Revenue and price are no longer equivalentTR p2 Q pQ
p
p
TR
MR p2
Q p2
Q
Q
Negative
p
p1
p2
pQ
p2 Q
For a monopolist (or any firm that has
any control over its price), marginal
revenue is less than price!
Q2
Q1
Q
D
Q
48.
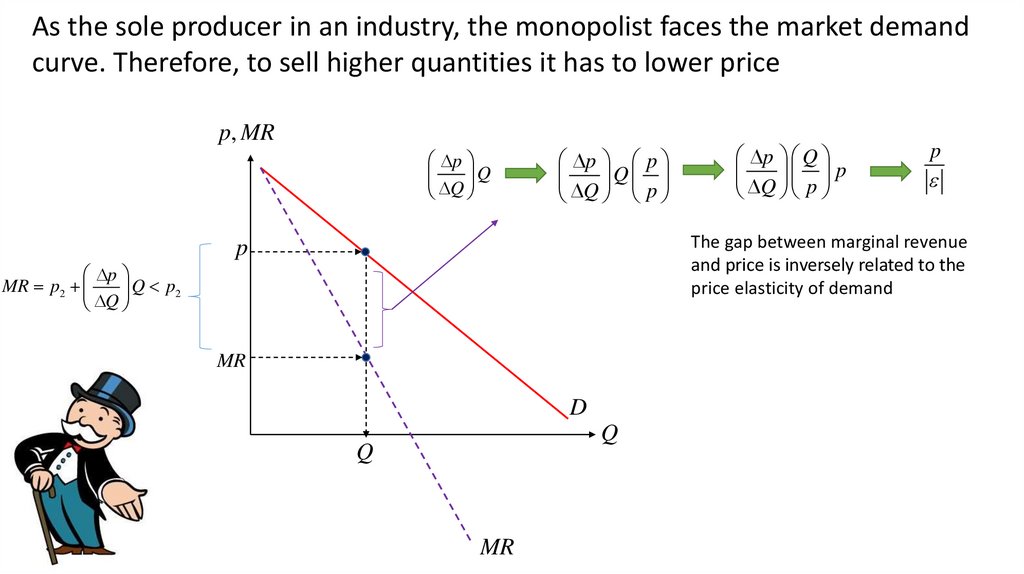
As the sole producer in an industry, the monopolist faces the market demandcurve. Therefore, to sell higher quantities it has to lower price
p, MR
p
Q
Q
p p
Q
Q p
p Q
p
Q p
p
The gap between marginal revenue
and price is inversely related to the
price elasticity of demand
p
p
MR p2
Q p2
Q
MR
D
Q
Q
MR
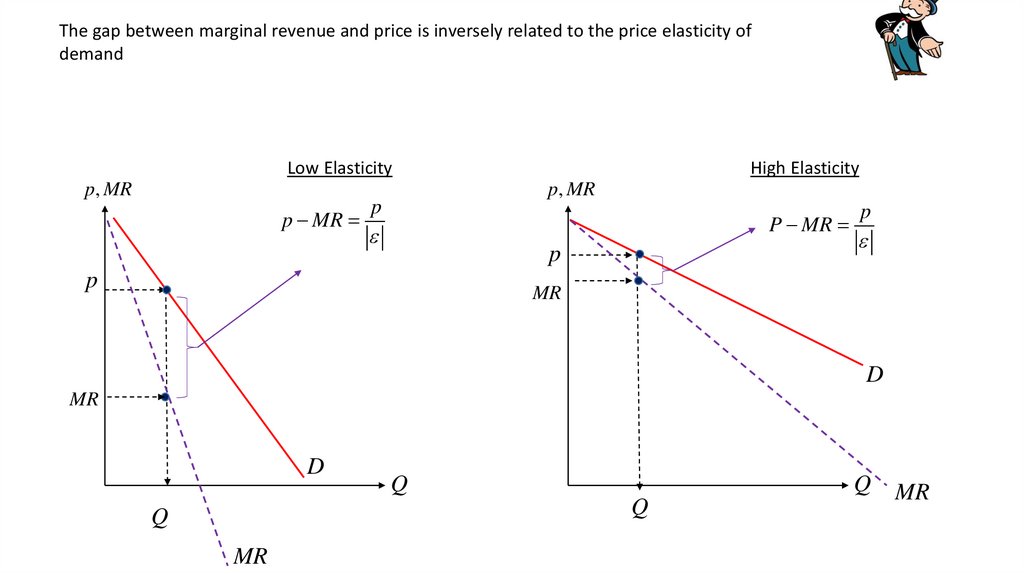
49.
The gap between marginal revenue and price is inversely related to the price elasticity ofdemand
Low Elasticity
p, MR
p MR
High Elasticity
p, MR
p
P MR
p
p
p
MR
D
MR
D
Q
Q
Q
Q
MR
MR
50.
As the sole producer in an industry, the monopolist faces the market demandcurve. Therefore, to sell higher quantities it has to lower price
p, MR
p MR
MC
p
MR MC
p*
p MC
p
MR
D
Q
Q
*
MR
p MC 1
p
The lerner index
(gross margin %)
is inversely
related to the
elasticity of
demand
Abba Lerner
1903 – 1982
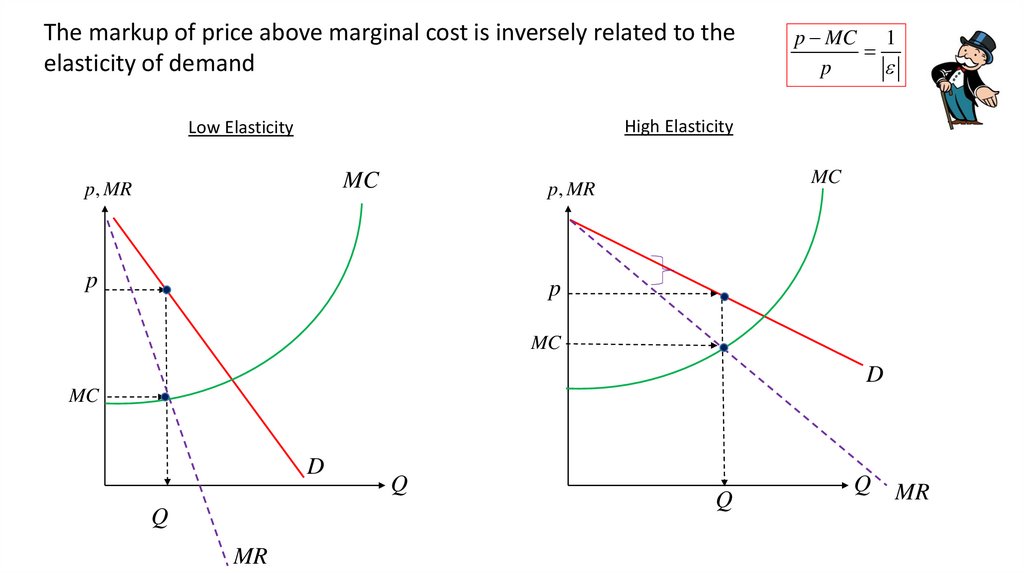
51.
The markup of price above marginal cost is inversely related to theelasticity of demand
p MC 1
p
High Elasticity
Low Elasticity
MC
p, MR
MC
p, MR
p
p
MC
D
MC
D
Q
MR
Q
Q
Q
MR
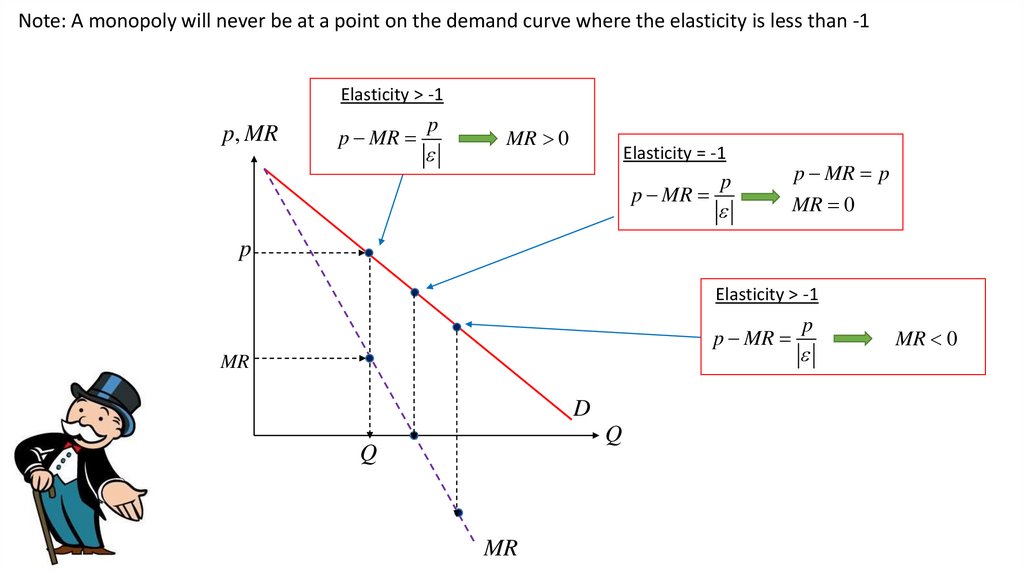
52.
Note: A monopoly will never be at a point on the demand curve where the elasticity is less than -1Elasticity > -1
p, MR
p MR
p
MR 0
Elasticity = -1
p MR
p
p MR p
MR 0
p
Elasticity > -1
p MR
MR
D
Q
Q
MR
p
MR 0
53.
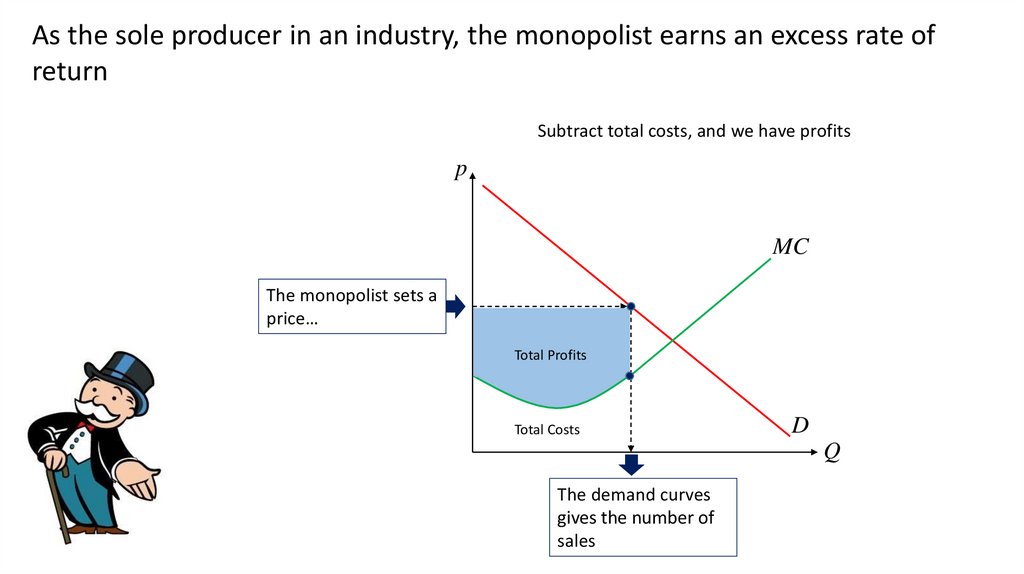
As the sole producer in an industry, the monopolist earns an excess rate ofreturn
Subtract total costs, and we have profits
p
MC
The monopolist sets a
price…
Total Profits
Total Costs
D
Q
The demand curves
gives the number of
sales
54.
Suppose that you face the followingdemand curve….
Q 100 2 p
p 50 .5Q
(Demand)
( Inverse Demand)
p
You have a constant marginal cost of $10
$50
10
.25
80
2
Perfectly competitive
outcome
MC
$10
80
D
Q
What price would you charge to maximize
profits?
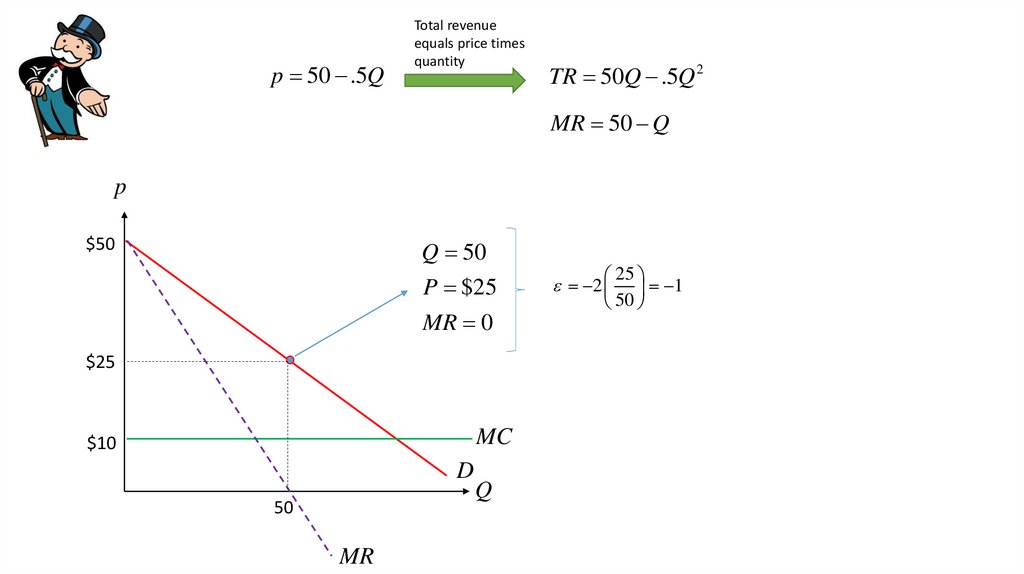
55.
p 50 .5QTotal revenue
equals price times
quantity
TR 50Q .5Q 2
MR 50 Q
p
$50
Q 50
P $25
MR 0
$25
MC
$10
D
50
MR
Q
25
1
50
2
56.
p 50 .5QTotal revenue
equals price times
quantity
TR 50Q .5Q
Set marginal
revenue equal to
marginal cost
2
MR 50 Q
50 Q 10
Q 40
P $30
p
Q 40
$50
P $30
$30
30
1.5
40
2
Markup
Profit = $800
MC
$10
TC = $400
D
40
MR
p MC 30 10
2
MC
10
Gross Margin
Q
p MC 30 10
1
.67 =
p
30
1.5
57.
Perfect Competition vs. MonopolyMonopoly
p
p
Total Gain = $1,200
$50
$50
Perfect Competition
Total Gain = $1,600
Q 100 2 p
MC $10
CS =$400
$30
CS = (1/2)(80)(40) =$1600
Profit = $800
DWL =$400
MC
$10
TC = $400
D
40
MR
MC
$10
D
TC = $800
Q
80
Q
58.
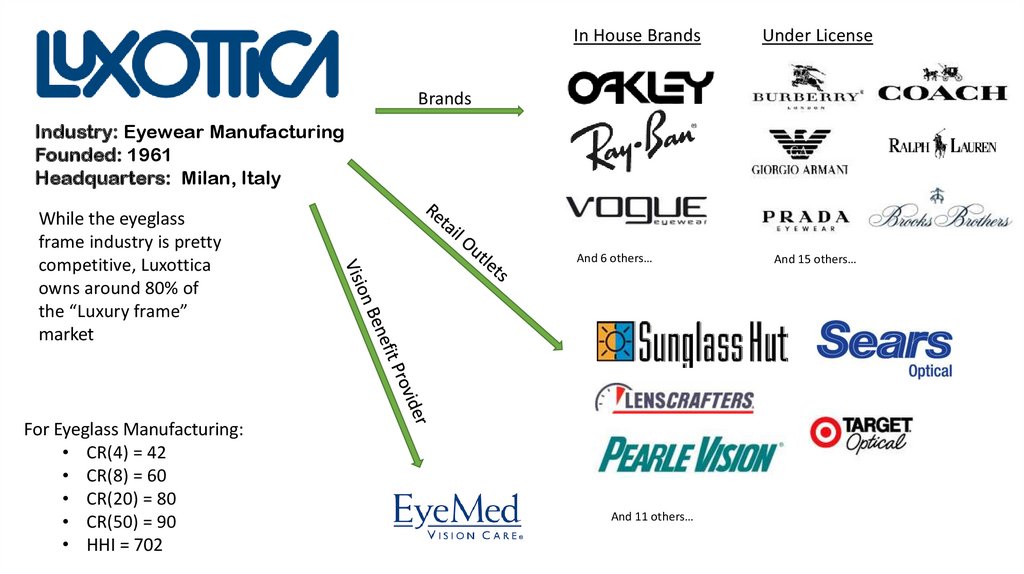
In House BrandsUnder License
Brands
Industry: Eyewear Manufacturing
Founded: 1961
Headquarters: Milan, Italy
While the eyeglass
frame industry is pretty
competitive, Luxottica
owns around 80% of
the “Luxury frame”
market
For Eyeglass Manufacturing:
• CR(4) = 42
• CR(8) = 60
• CR(20) = 80
• CR(50) = 90
• HHI = 702
And 6 others…
And 11 others…
And 15 others…
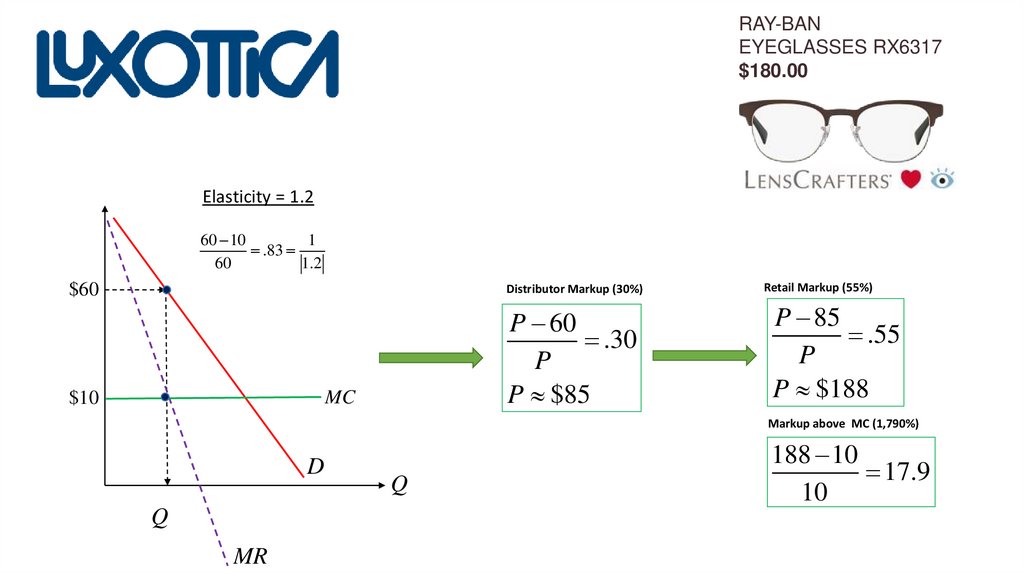
59.
RAY-BANEYEGLASSES RX6317
$180.00
Elasticity = 1.2
60 10
1
.83
60
1.2
$60
Distributor Markup (30%)
$10
P 60
.30
P
P $85
MC
Retail Markup (55%)
P 85
.55
P
P $188
Markup above MC (1,790%)
D
Q
MR
Q
188 10
17.9
10
60.
2 PairsOf EYEGLASSES FOR
$69.95
With a
p
FREE
Eye Exam
MC S
$10
D
Q
Q
Distributor Markup (30%)
P 10
.30
P
P $14
Retail Markup (50%)
P 14
.50
P
P $28
$28 X 2 = $56
Eye Exam = $14
$70
61.
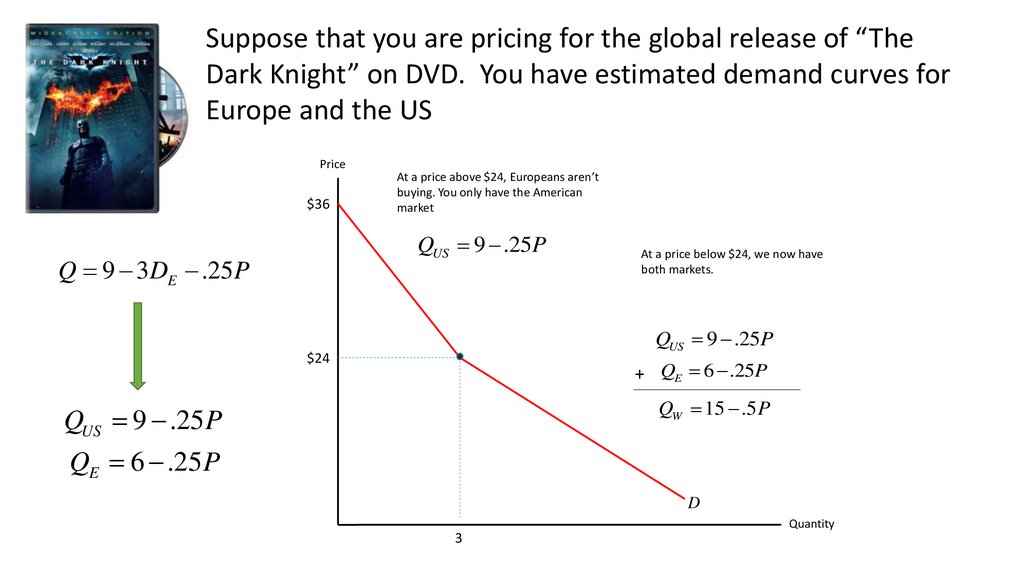
Suppose that you are pricing for the global release of “TheDark Knight” on DVD. You have estimated demand curves for
Europe and the US
Price
$36
At a price above $24, Europeans aren’t
buying. You only have the American
market
QUS 9 .25P
Q 9 3DE .25 P
At a price below $24, we now have
both markets.
QUS 9 .25P
$24
+ QE 6 .25P
QW 15 .5 P
QUS 9 .25 P
QE 6 .25 P
D
Quantity
3
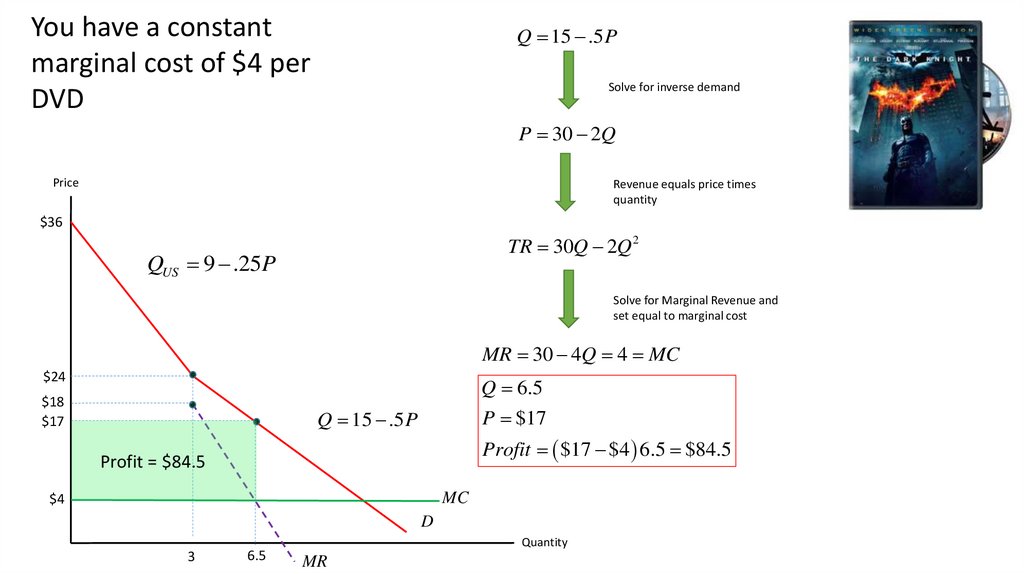
62.
You have a constantmarginal cost of $4 per
DVD
Q 15 .5 P
Solve for inverse demand
P 30 2Q
Price
Revenue equals price times
quantity
$36
TR 30Q 2Q 2
QUS 9 .25P
Solve for Marginal Revenue and
set equal to marginal cost
MR 30 4Q 4 MC
$24
Q 6.5
$18
$17
P $17
Q 15 .5 P
Profit $17 $4 6.5 $84.5
Profit = $84.5
MC
$4
D
3
6.5
Quantity
MR
63.
DVD region codes are a digital rights management technique designed to allow film distributors andtelevision companies to control aspects of a release, including content, release date, and price,
according to the region
64.
To Price discriminate, you need• To identify different buyers
• Prevent resale
Europe
United States
QE 6 .25 PE
QUS 9 .25PUS
PE 24 4QE
PUS 36 4QUS
TR 24Q 4Q 2
TR 36Q 4Q 2
Price
Price
MR 36 8Q 4
Q 2 .5
Q 4
$36
MR 24 8Q 4
P $14
P $20
$24
Profit $64 $25 $89
$20
$14
$64
$4
$25
MC
$4
MC
D
D
Quantity
4
2.5
MR
MR
Quantity
65.
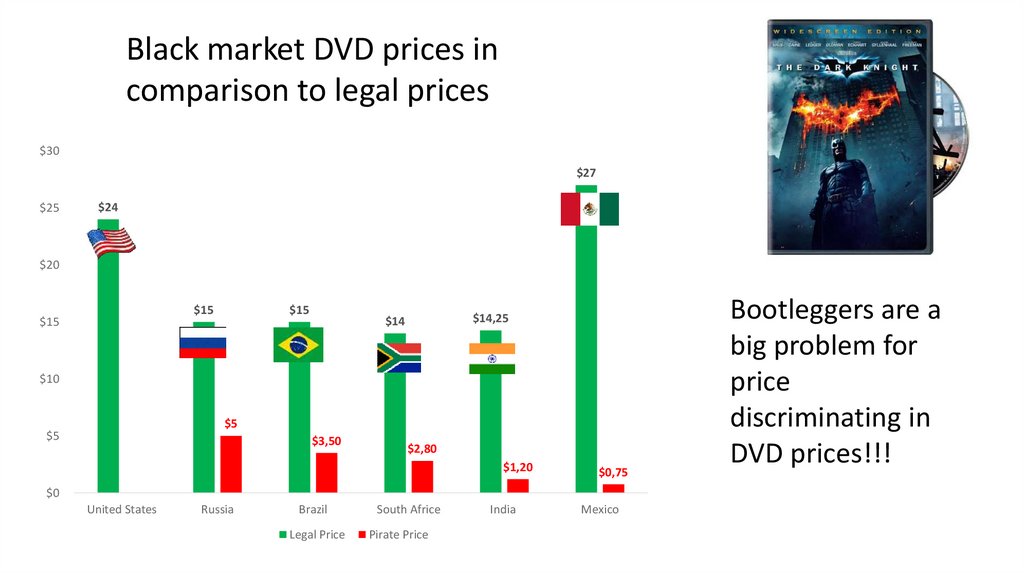
Black market DVD prices incomparison to legal prices
$30
$27
$25
$24
$20
$15
$15
$15
$14,25
$14
$10
$5
$5
$3,50
$2,80
$1,20
$0,75
$0
United States
Russia
Brazil
Legal Price
South Africe
Pirate Price
India
Mexico
Bootleggers are a
big problem for
price
discriminating in
DVD prices!!!
66.
Average Netflix Monthly Revenue per customer by countryDenmark
Norway
Sweden
Austria
France
Germany
Luxambourg
Belgium
Netherlands
Finland
UK
Switzerland
United States
Japan
Brazil
Colombia
Canada
Mexico
Chile
Argentina
15,11
13,44
12,36
11,88
11,88
11,88
11,88
11,88
11,38
11,38
10,89
9,8
8,16
8,01
7,98
7,82
7,78
7,6
Netflix CEO Reed Hastings has long said that his company isn’t primarily
competing with cable TV or other paid services in Latin America, but
with piracy instead. The region is a piracy hotbed, according to the U.S.
Trade Representative (USTR), which has been keeping Argentina, Chile
and Venezuela on its priority watch list of piracy worst offenders.
6,61
4,75
0
2
4
6
8
10
12
14
16
67.
Why are prescription drugs so expensive inthe United States?
68.
Americans Spend Way More than most other countries on Prescription drugs*Source: OECD Health Statistics
69.
Most name brand drugs sell for about 60% of theUS price outside the US
70.
This hasresulted in
Americans
relying much
more on
generics than
the rest of the
world
71.
Issue #1:Developing
Prescription
Drugs is
VERY
Expensive
Compound Success
Rates by Stage
Years
0
Discovery
(2–10 Years)
Phase I
20–80 Healthy Volunteers Used to
Determine Safety and Dosage
2
4
6
8
Phase III
10
1,000–5,000 Patient Volunteers
Used to Monitor Adverse
Reactions to Long-Term Use
12
Additional PostMarketing Testing
Preclinical Testing
Laboratory and
Animal Testing
14
16
Phase II
100–300 Patient Volunteers
Used to Look for Efficacy
and Side Effects
FDA Review Approval
5,000–10,000
Screened
250
Enter Preclinical
Testing
5
Enter
Clinical
Testing
1
Approved
by the FDA
Net Cost: $1 Billion Invested Over 12-15 Years
*Source: PhRMA Pharmaceutical Industry Profile 2003, Chapter 1: Increased Length and Complexity of the Research and
Development Process. And DiMasi, JA, Hansen, RW, Grabowski, HG. “The Price of Innovation: new estimates of drug
development costs.” J of Health Economics. 2003:22:151-185.
72.
Let’s suppose that AstraZeneca has afixed cost (R&D) of $400M
At Sales of 3M per year
p
Now, the pharmacies charge a 20-30%
markup
TC = $1(3M) + $400M
ATC = $403/3M = $134
MC = $1
Charging a price equal to
marginal cost would
result in a $400M loss
$180
Profit
$134
ATC
$68
$1
D
Q* 6 M
Q* 3M
MR
MC
Q
P 180
.25
P
P $240
73.
Let’s suppose that AstraZeneca has afixed cost (R&D) of $400M
At Sales of 3M per year
p
TC = $1(3M) + $400M
ATC = $403/3M = $134
MC = $1
Gross Margin
Operating Margin
180 1
.994
180
180 134
.255
180
$180
Profit
$134
ATC
$1
D
Q* 3M
MR
MC
Q
While their Gross margin is huge, the
operating margin is much lower!
74.
Now, patents protect drugs from copycatversions for 20 years after the drug is invented.
Upon introduction of a generic version, the
demand for the brand name becomes much
more elastic and profits disappear (Generic
Nexium was introduces in 2015)
p
At Sales of 5M per year
Gross Margin
TC = $1(5M) + $400M
ATC = $405/5M = $81
MC = $1
81 1
.98
81
Operating Margin
81 81
0
81
While their Gross margin is huge, the operating
margin is much lower!
$81
ATC
D
MC
$1
Q
Q* 5M
MR
P 81
.25
P
P $108
P $45
(Nexium)
(Generic)
75.
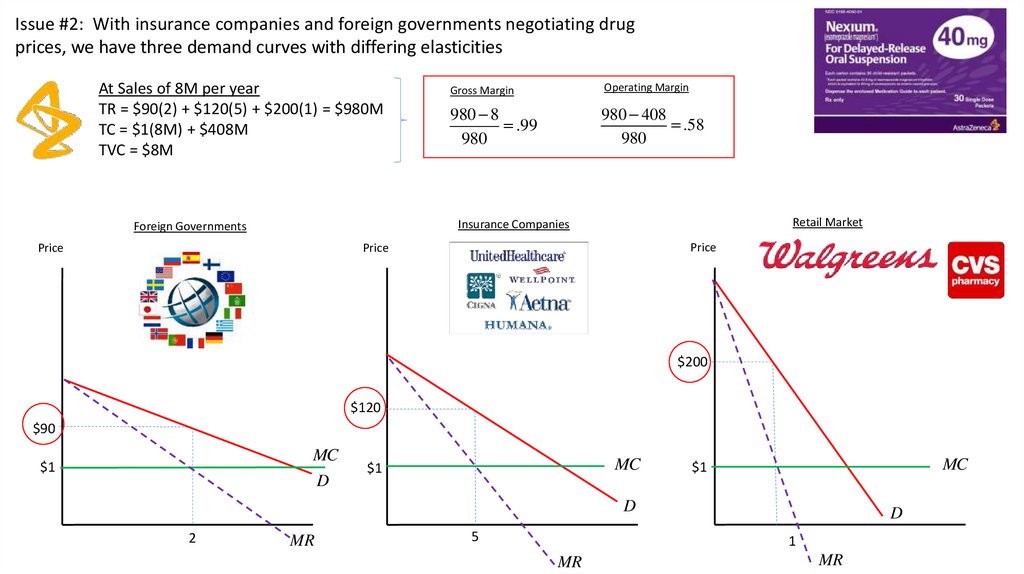
Issue #2: With insurance companies and foreign governments negotiating drugprices, we have three demand curves with differing elasticities
At Sales of 8M per year
TR = $90(2) + $120(5) + $200(1) = $980M
TC = $1(8M) + $408M
TVC = $8M
Gross Margin
Operating Margin
980 8
.99
980
980 408
.58
980
Retail Market
Insurance Companies
Foreign Governments
Price
Price
Price
$200
$120
$90
MC
D
$1
MC
$1
MC
$1
D
2
MR
5
D
1
MR
MR
76.
Why is movie popcorn so expensive?Dollars
$15
Avid
Moviegoer
Occasional
Moviegoer
$8
0
200
Ticket Price
Popcorn Price
Total
Option #1
$14
$1
$15
Option #2
$8
$7
$15
Option #3
$2
$13
$15
300
As long as the total
price (popcorn +
ticket) is $15 or less,
avid moviegoers will
still go
77.
Two Part PricingIn some situations, producers have
more than one price they can charge
customers…this opens up many new
pricing strategies
Shoppers Club Cards
Cover Charges
Notre Dame Ticket Rights Fee
Credit Cards with Annual
Fees
Land Line “Rental Fee”
Amusement Park Entry Fees
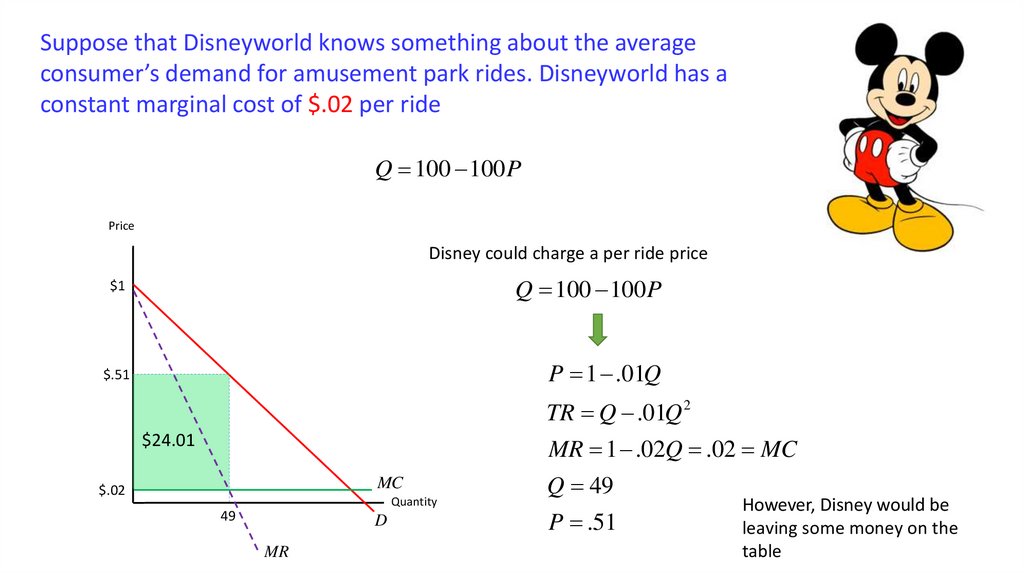
78.
Suppose that Disneyworld knows something about the averageconsumer’s demand for amusement park rides. Disneyworld has a
constant marginal cost of $.02 per ride
Q 100 100 P
Price
Disney could charge a per ride price
$1
Q 100 100 P
$.51
P 1 .01Q
TR Q .01Q 2
$24.01
MR 1 .02Q .02 MC
MC
$.02
Quantity
49
D
MR
Q 49
P .51
However, Disney would be
leaving some money on the
table
79.
Suppose that Disneyworld knows something about the averageconsumer’s demand for amusement park rides. Disneyworld has a
constant marginal cost of $.02 per ride
Q 100 100 P
Price
$1
CS = (1/2)($1-.51)*49 = $12.00
$.51
Disney could charge an entry fee to
the park equal to the consumer
surplus. This is known as two part
pricing
$24.01
MC
$.02
Quantity
49
D
MR
Profit = $24.01 + $12.00 = $36.01
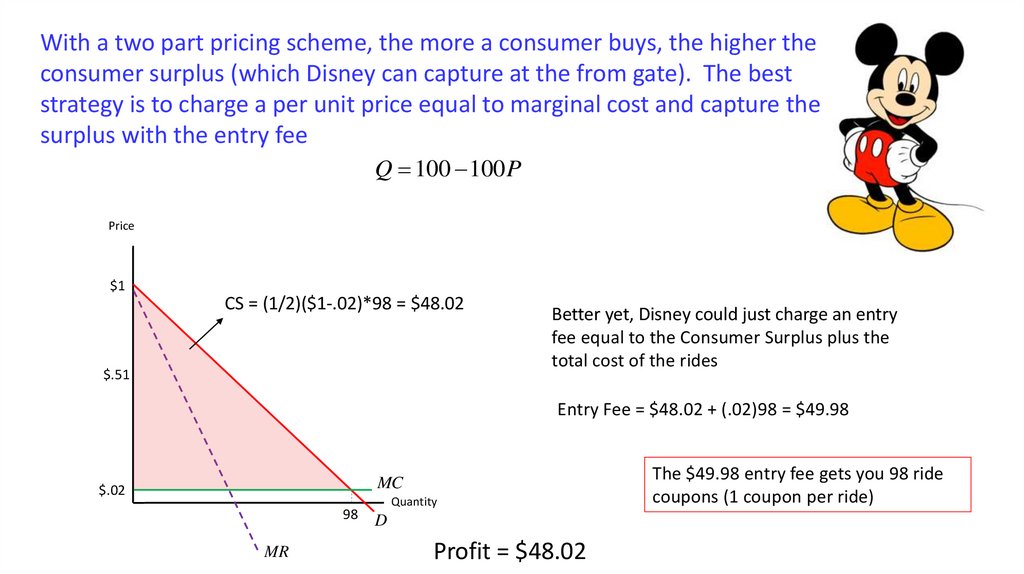
80.
With a two part pricing scheme, the more a consumer buys, the higher theconsumer surplus (which Disney can capture at the from gate). The best
strategy is to charge a per unit price equal to marginal cost and capture the
surplus with the entry fee
Q 100 100 P
Price
$1
CS = (1/2)($1-.02)*98 = $48.02
$.51
Better yet, Disney could just charge an entry
fee equal to the Consumer Surplus plus the
total cost of the rides
Entry Fee = $48.02 + (.02)98 = $49.98
MC
$.02
98
MR
Quantity
D
Profit = $48.02
The $49.98 entry fee gets you 98 ride
coupons (1 coupon per ride)
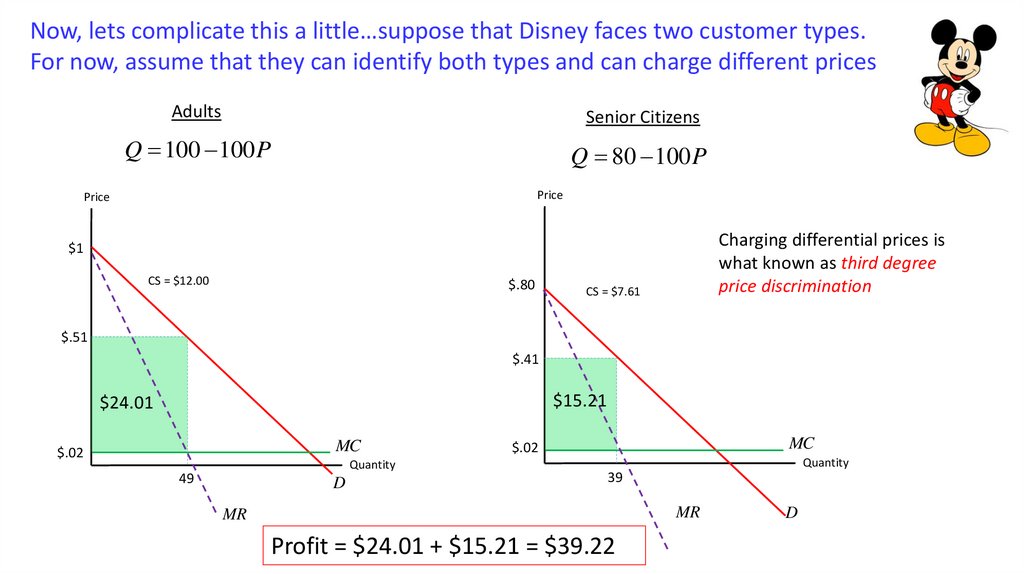
81.
Now, lets complicate this a little…suppose that Disney faces two customer types.For now, assume that they can identify both types and can charge different prices
Adults
Senior Citizens
Q 100 100 P
Q 80 100 P
Price
Price
Charging differential prices is
what known as third degree
price discrimination
$1
CS = $12.00
$.80
CS = $7.61
$.51
$.41
$15.21
$24.01
MC
$.02
Quantity
49
D
MC
$.02
Quantity
39
MR
MR
Profit = $24.01 + $15.21 = $39.22
D
82.
Alternatively, they could use the two part pricing scheme to extra every dollar ofconsumer surplus from both groups
Senior Citizens
Adults
Q 80 100 P
Q 100 100 P
Price
Price
Senior Package (78 Ride Coupons)
Adult Package (98 Ride Coupons)
$1
$30.42 + (.02)(78) = $31.98
$48.02 + (.02)(98) = $49.98
$.80
$48.02
$.02
Charging differential prices is
what known as first degree
price discrimination
$30.42
MC
MC
$.02
Quantity
98 D
Quantity
78
D
Profit = $48.02 + $30.42 = $78.44
83.
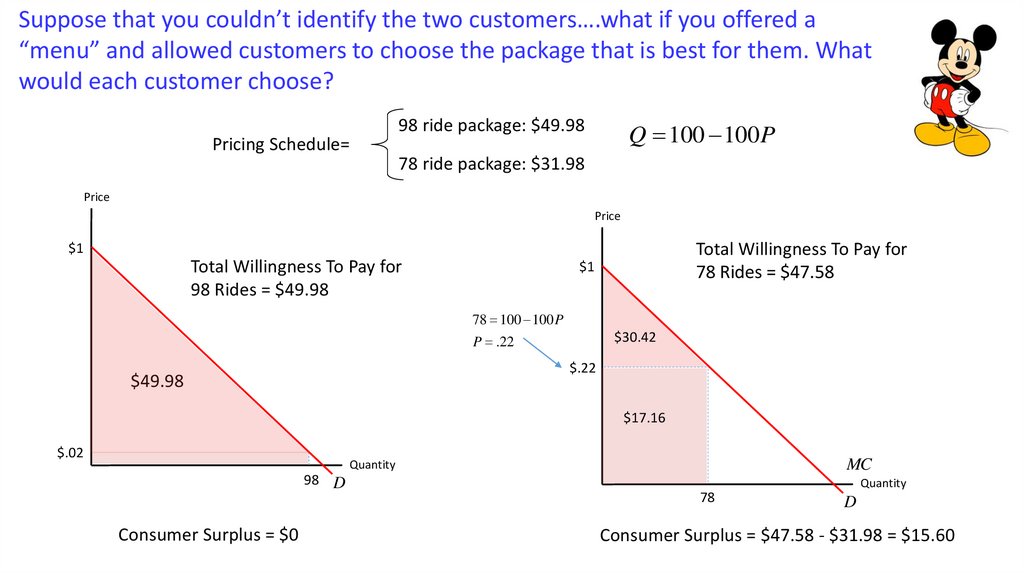
Suppose that you couldn’t identify the two customers….what if you offered a“menu” and allowed customers to choose the package that is best for them. What
would each customer choose?
Pricing Schedule=
98 ride package: $49.98
Q 100 100 P
78 ride package: $31.98
Price
Price
Total Willingness To Pay for
78 Rides = $47.58
$1
Total Willingness To Pay for
98 Rides = $49.98
$1
78 100 100 P
$30.42
P .22
$.22
$49.98
$17.16
$.02
MC
Quantity
98 D
Consumer Surplus = $0
Quantity
78
D
Consumer Surplus = $47.58 - $31.98 = $15.60
84.
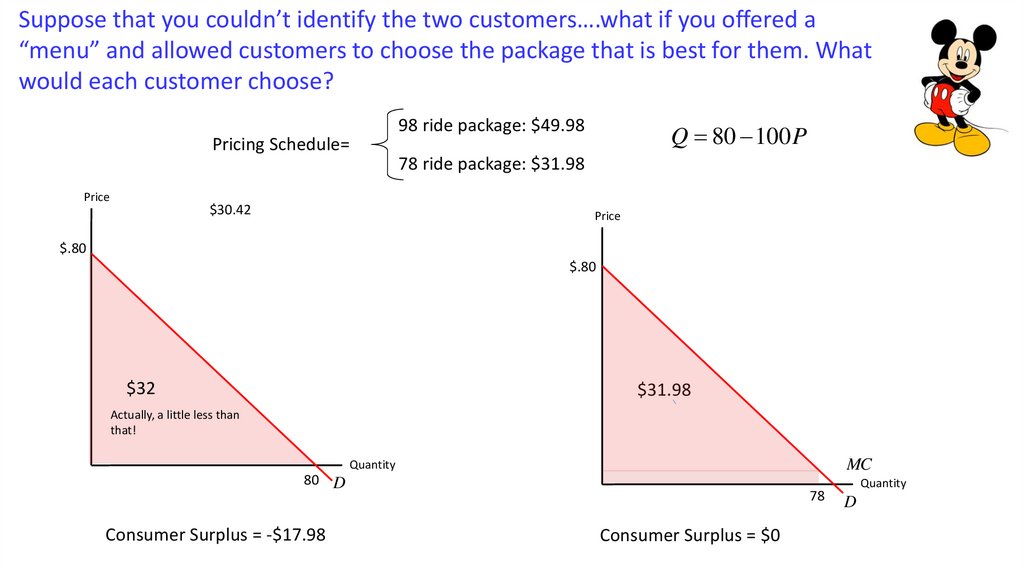
Suppose that you couldn’t identify the two customers….what if you offered a“menu” and allowed customers to choose the package that is best for them. What
would each customer choose?
Pricing Schedule=
Price
$30.42
98 ride package: $49.98
Q 80 100 P
78 ride package: $31.98
Price
$.80
$.80
$32
$31.98
Actually, a little less than
that!
MC
Quantity
80 D
Consumer Surplus = -$17.98
78
Consumer Surplus = $0
Quantity
D
85.
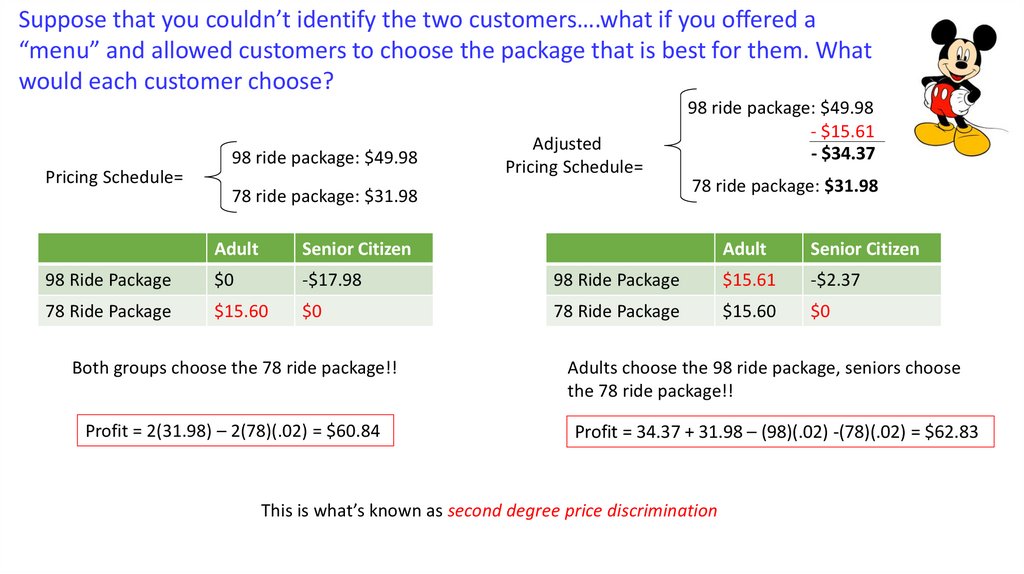
Suppose that you couldn’t identify the two customers….what if you offered a“menu” and allowed customers to choose the package that is best for them. What
would each customer choose?
Pricing Schedule=
98 ride package: $49.98
Adjusted
Pricing Schedule=
78 ride package: $31.98
Adult
Senior Citizen
98 Ride Package
$0
-$17.98
78 Ride Package
$15.60
$0
Both groups choose the 78 ride package!!
Profit = 2(31.98) – 2(78)(.02) = $60.84
98 ride package: $49.98
- $15.61
- $34.37
78 ride package: $31.98
Adult
Senior Citizen
98 Ride Package
$15.61
-$2.37
78 Ride Package
$15.60
$0
Adults choose the 98 ride package, seniors choose
the 78 ride package!!
Profit = 34.37 + 31.98 – (98)(.02) -(78)(.02) = $62.83
This is what’s known as second degree price discrimination
86.
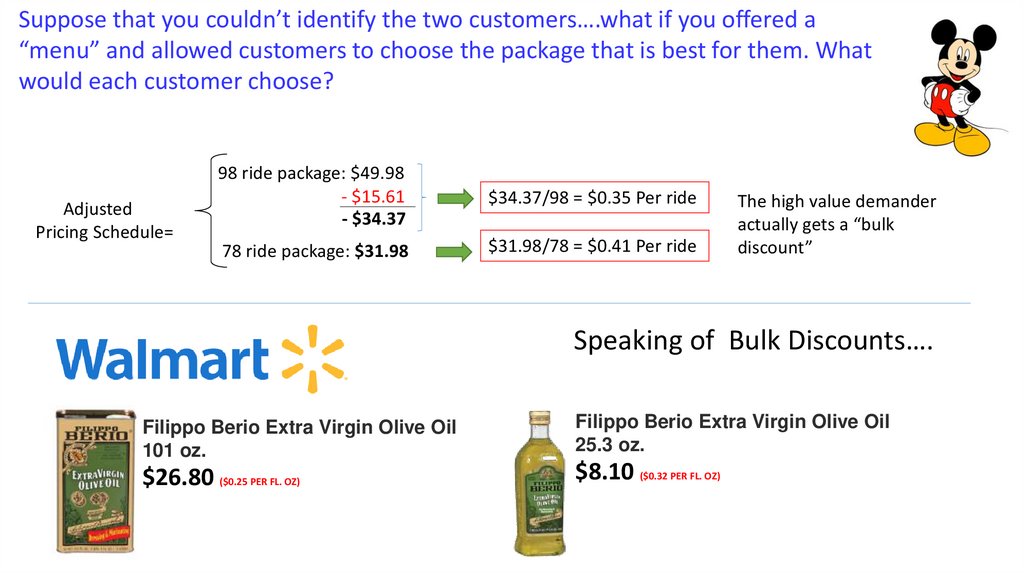
Suppose that you couldn’t identify the two customers….what if you offered a“menu” and allowed customers to choose the package that is best for them. What
would each customer choose?
Adjusted
Pricing Schedule=
98 ride package: $49.98
- $15.61
- $34.37
$34.37/98 = $0.35 Per ride
78 ride package: $31.98
$31.98/78 = $0.41 Per ride
The high value demander
actually gets a “bulk
discount”
Speaking of Bulk Discounts….
Filippo Berio Extra Virgin Olive Oil
101 oz.
$26.80 ($0.25 PER FL. OZ)
Filippo Berio Extra Virgin Olive Oil
25.3 oz.
$8.10 ($0.32 PER FL. OZ)
87.
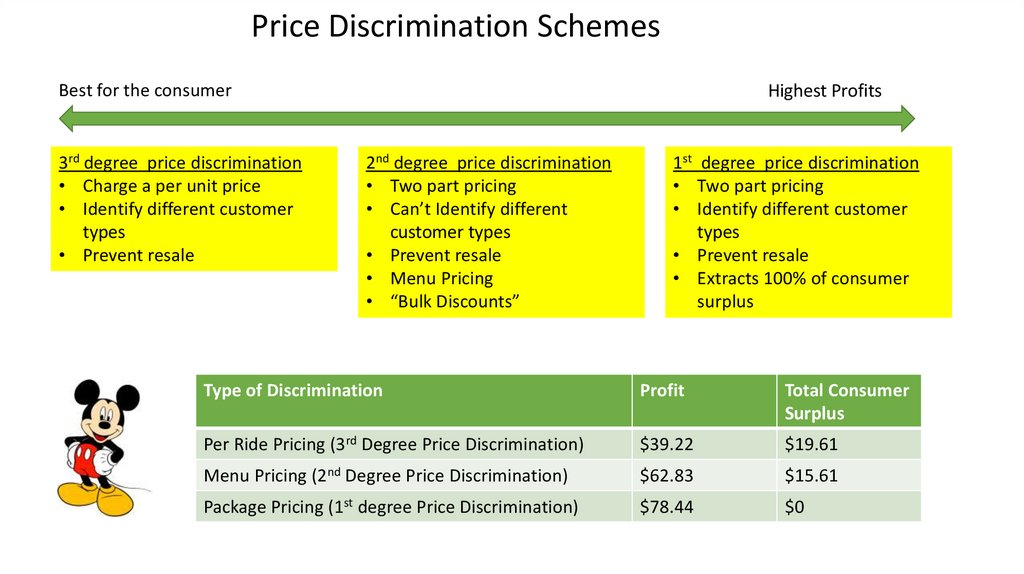
Price Discrimination SchemesBest for the consumer
3rd degree price discrimination
• Charge a per unit price
• Identify different customer
types
• Prevent resale
Highest Profits
2nd degree price discrimination
• Two part pricing
• Can’t Identify different
customer types
• Prevent resale
• Menu Pricing
• “Bulk Discounts”
1st degree price discrimination
• Two part pricing
• Identify different customer
types
• Prevent resale
• Extracts 100% of consumer
surplus
Type of Discrimination
Profit
Total Consumer
Surplus
Per Ride Pricing (3rd Degree Price Discrimination)
$39.22
$19.61
Menu Pricing (2nd Degree Price Discrimination)
$62.83
$15.61
Package Pricing (1st degree Price Discrimination)
$78.44
$0
88.
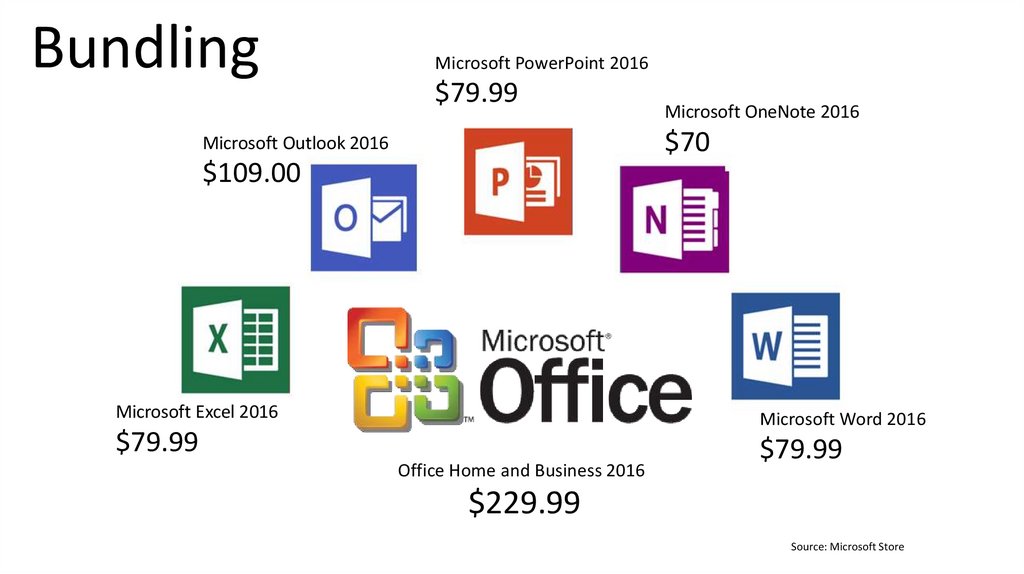
BundlingMicrosoft PowerPoint 2016
$79.99
Microsoft OneNote 2016
$70
Microsoft Outlook 2016
$109.00
Microsoft Excel 2016
Microsoft Word 2016
$79.99
Office Home and Business 2016
$79.99
$229.99
Source: Microsoft Store
89.
Bundle$229.99
Separate
$79.99
$79.99
Audio CD: $11.55
MP3:
$9.49
$79.99
$109.00
$70.00
Bundle
Track
Price
Most Wonderful Girl
$0.99
Fingerlicking Good
$0.99
Sole Sucker
$0.99
Rover Take Over
$0.99
Nasty Love
$0.99
Voodoo U
$0.99
Hot Magma
$0.99
Stripper
$0.99
Sexbomb
$0.99
Drowning in Ecstasy
$0.99
Lover
$0.99
She and Mr. Jones
$0.99
Total:
$418.97
$11.88
Separate
90.
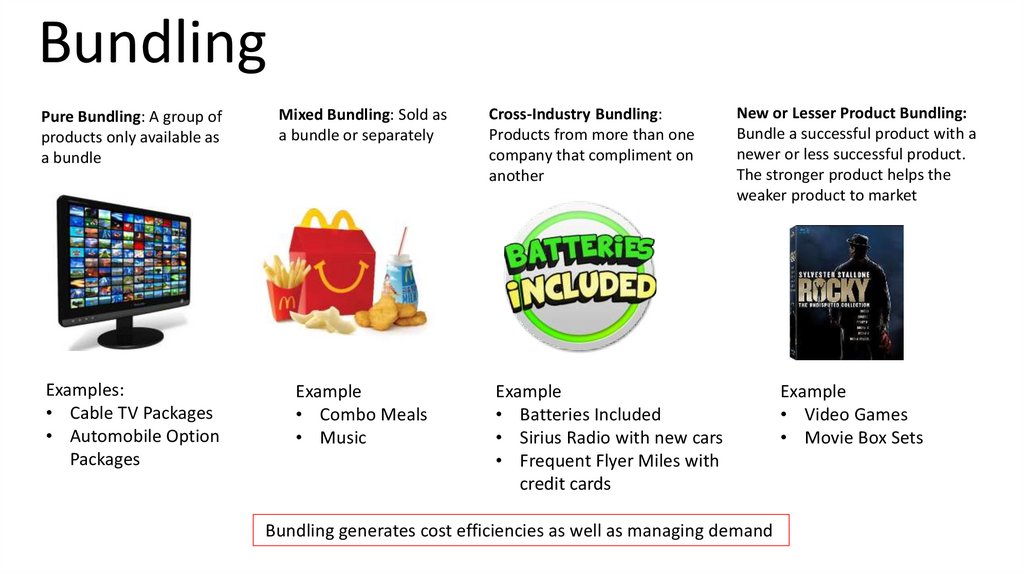
BundlingPure Bundling: A group of
products only available as
a bundle
Mixed Bundling: Sold as
a bundle or separately
Examples:
• Cable TV Packages
• Automobile Option
Packages
Example
• Combo Meals
• Music
Cross-Industry Bundling:
Products from more than one
company that compliment on
another
New or Lesser Product Bundling:
Bundle a successful product with a
newer or less successful product.
The stronger product helps the
weaker product to market
Example
• Batteries Included
• Sirius Radio with new cars
• Frequent Flyer Miles with
credit cards
Bundling generates cost efficiencies as well as managing demand
Example
• Video Games
• Movie Box Sets
91.
Suppose that you are selling two products. Marginal costs for these products are $100(Product 1) and $150 (Product 2). You have 4 potential consumers that will either buy one
unit or none of each product (they buy if the price is below their reservation value)
Consumer
Sum
A
$50
$450
$500
B
$250
$275
$525
C
$300
$220
$520
D
$450
$50
$500
92.
Separate PricingMicrosoft Excel
Microsoft Word
MC = $150
MC = $100
P
Q
TR
TC
Profit
P
Q
TR
TC
Profit
$450
1
$450
$100
$350
$450
1
$450
$150
$300
$300
2
$600
$200
$400
$275
2
$550
$300
$250
$250
3
$750
$300
$450
$220
3
$660
$450
$210
$50
4
$200
$400
-$200
$50
4
$200
$600
-$400
Profits = $450 + $300 = $750
93.
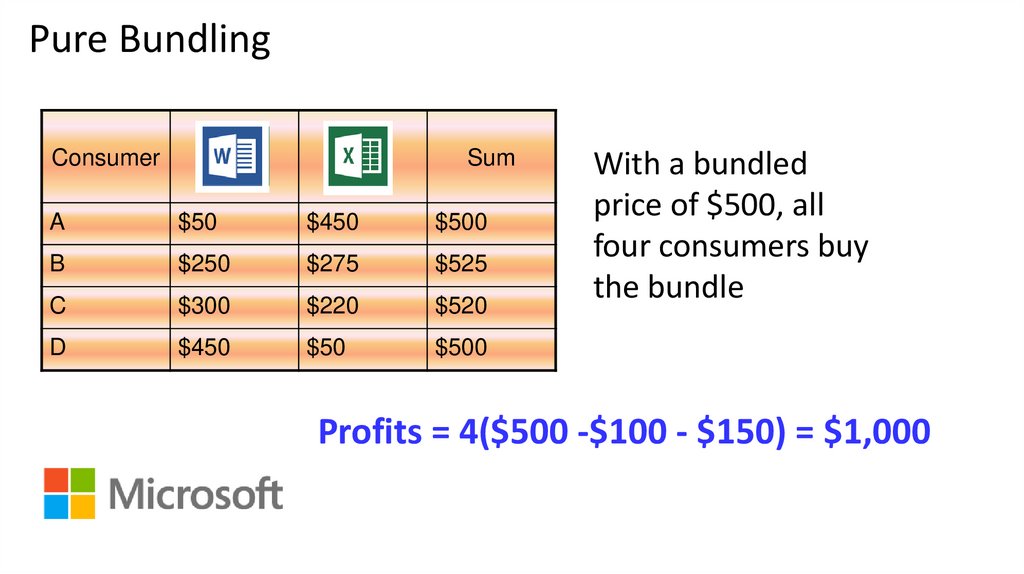
Pure BundlingConsumer
Sum
A
$50
$450
$500
B
$250
$275
$525
C
$300
$220
$520
D
$450
$50
$500
With a bundled
price of $500, all
four consumers buy
the bundle
Profits = 4($500 -$100 - $150) = $1,000
94.
Mixed BundlingConsumer
Sum
A
$50
$450
$500
B
$250
$275
$525
C
$300
$220
$520
D
$450
$50
$500
Price = $250
Price = $450
Price = $500
With mixed bundling,
consumers have the option
of buying the individual
titles or the bundle. Utility
maximizing consumers make
the choice that provides the
greatest consumer surplus
Consumer A: Buys Excel (Profit = $300) or Bundle
(Profit = $250)
Consumer B: Buys Bundle (Profit = $250)
Consumer C: Buys Word (Profit = $150)
Consumer D: Buys Only Word (Profit = $150)
Profit = $850 or $800
95.
Mixed BundlingConsumer
Sum
A
$50
$450
$500
B
$250
$275
$525
C
$300
$220
$520
D
$450
$50
$500
Price = $450
Price = $450
Price = $520
With mixed bundling,
consumers have the option
of buying the individual
titles or the bundle. Utility
maximizing consumers make
the choice that provides the
greatest consumer surplus
Consumer A: Buys Only Excel(Profit = $300)
Consumer B: Buys Bundle (Profit = $270)
Consumer C: Buys Bundle (Profit = $270)
Consumer D: Buys Only Word (Profit = $350)
Profit = $1,190
96.
Mixed BundlingConsumer
Sum
A
$300
$200
$500
B
$300
$200
$500
C
$300
$200
$500
D
$300
$200
$500
Individually Priced: Profit = $1,000
Price = $300
Price = $200
Pure Bundling: Profit = $1,000
Mixed Bundling: Profit = $1,000
Price = $500
Without variation among
consumers, there is little
gain (at least on the revenue
side) to bundling!
97.
Tie In SalesRetail Price: $34.99
Cost: $8
Markup: 337%
Retail Price: $129.99
Where does HP make its
money….the printer or the toner
cartridge?
98.
Suppose that you sell laser printers. To create printed pages, you need both a printer and anink cartridge. For now, assume that the toner cartridges are sold in a competitive market and
sell for $2 each. An ink cartridge is good for 1,000 printed pages.
Price
$16
The printer price will equal the
consumer surplus
Demand Curve for Printed Pages (000s)
Q 16 P
CS = ½*($16 - $2)(14) = $98
Number of printed
pages in thousands
MC
$2
D
14
Profit = $98
Q
Toner Cartridge
price
99.
Now, suppose that you design the printer to take a special cartridge that only you produce.Q 16 P
Price
$16
CS = ½*($16 - $9)(7) = $24.50
$9
P 16 Q
This area becomes
deadweight loss…nobody
gets it!
$49
MC
$2
D
MR 16 2Q 2 MC
Q
14
$7
TR PQ 16Q Q 2
Q 7
P $9
MR
Profit = $49 + $24.50 = $73.50
What we make on the cartridges, we are losing on the printers…we would be
better off giving away the cartridges, wouldn’t we?
100.
Suppose that you face two different consumers…assume one of each type$16
Q 16 P
$16
D
High Value Demander
Q 12 P
D
Q
Q
Low Value Demander
Assume that you can identify both types and can charge different
prices
101.
Suppose that you face two different consumers…assume one of each typePrice
$16
Price
Q 16 P
$12
CS = ½*($16 - $2)(14) = $98
$2
MC
D
14
Q 12 P
CS = ½*($10 - $2)(10) = $50
MC
$2
Q
High Value Demander
D
Q
10
Low Value Demander
Profit = $98 + $50 = $148
If you can identify these two customers types and price discriminate against them, your best move is to
sell both types the cartridges at cost and discriminate on the printer price
102.
Now, suppose that you can’t identify customer type...this is why we use tie in sales!!Price
$16
Price
Q1 16 P
$12
Q2 12 P
1
CS 12 P Q2
2
P
P
$2
MC
D
Q1
High Value Demander
Q
MC
$2
D
Q
Q2
Low Value Demander
Tie In Sale Strategy
1) Charge a common cartridge price to everyone (at a markup above marginal cost)
2) Charge a common printer price to everyone equal to the consumer surplus of the low value demander). That way,
we insure that everybody buys a printer!
103.
Tie In Sale Strategy1) Charge a common cartridge price to everyone (at a markup above marginal cost)
2) Charge a common printer price to everyone equal to the consumer surplus of the low value demander). That way,
we insure that everybody buys a printer!
Printer Profits + Cartridge Profits = Total Profits
High Value Demander
Q1 16 P
1
2* 12 P Q2
2
Low Value Demander
Q2 12 P
12 P Q2 P 2 Q1 Q2
(2 printers sold)
Q1 16 P
Q2
P 2 Q1 Q2
+ Q2 12 P
12 P 12 P P 2 28 2 P
Maximize this function of price
Take the derivative with respect to
price and set equal to zero
88 8P P 2
8 2P 0
P 4
P 4
Q1 12
Q2 8
104.
This would be a second degree price discrimination strategy!Price
Price
Q1 16 P
$16
Q2 12 P
$12
Consumer Surplus = $0
Consumer Surplus = $40
$32
$32
$4
$4
$2
MC
D
Q1 12
High Value Demander
Q
MC
$2
D
Q2 8
Low Value Demander
Profit = $32+$32+($4-$2)(12+8) = $104
Q
105.
Retail Price: $59.99Retail Price: $499.00
Estimated Cost: $471.00*
*IHS Estimate
Profit Margin: 4%
Retail Price: $59.99
Retail Price: $59.99
Art/Design:$15
Programming and Engineering: $12
Retail Markup: $12
Marketing: $4
Manufacturing/Packaging: $3
Licensing: $3
Publisher Profit: $1
Distributor: $1
Misc.: $2
Console Owner Fee: $7 (11.5%)
*Source: Forbes
106.
Retail Price: $35.99Price Per Blade: $2.99
Retail Price: $24.38
Price Per Blade: $3.05
Retail Price: $7.49
Cost: $.08 per blade
Markup: 3,500%
Retail Price: $48.98
Price Per Blade: $3.06
107.
Complimentary Goods PricingQ 12 PH PB
Price of a Hot Dog
Price of a Hot Dog Bun
Hot Dogs and Buns are made by separate companies – each has a
monopoly in its own industry. For simplicity, assume that the
marginal cost of production for each equals zero.
108.
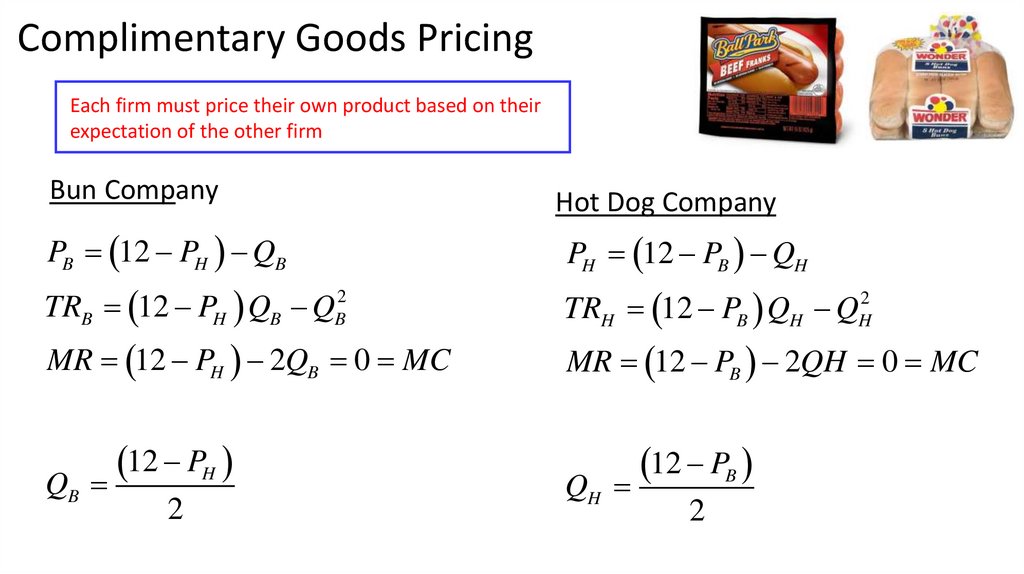
Complimentary Goods PricingEach firm must price their own product based on their
expectation of the other firm
Bun Company
Hot Dog Company
PB 12 PH QB
PH 12 PB QH
TRB 12 PH QB QB2
TRH 12 PB QH QH2
MR 12 PH 2QB 0 MC
MR 12 PB 2QH 0 MC
QB
12 PH
2
QH
12 PB
2
109.
Complimentary Goods PricingEach firm must price their own product based on their
expectation of the other firm
Bun Company
Hot Dog Company
PB 12 PH QB
QB
PB
12 PH
2
PH 12 PB QH
12 PH
QH
2
PH
12 PB
12 PB
2
2
110.
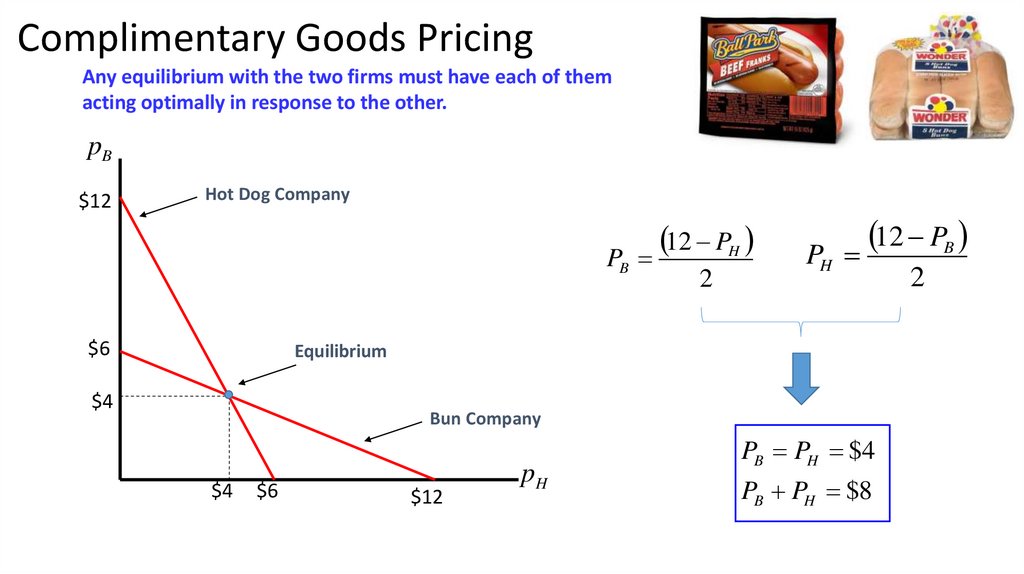
Complimentary Goods PricingAny equilibrium with the two firms must have each of them
acting optimally in response to the other.
pB
$12
Hot Dog Company
PB
$6
12 PH
2
PH
12 PB
Equilibrium
$4
Bun Company
$4
$6
$12
pH
PB PH $4
PB PH $8
2
111.
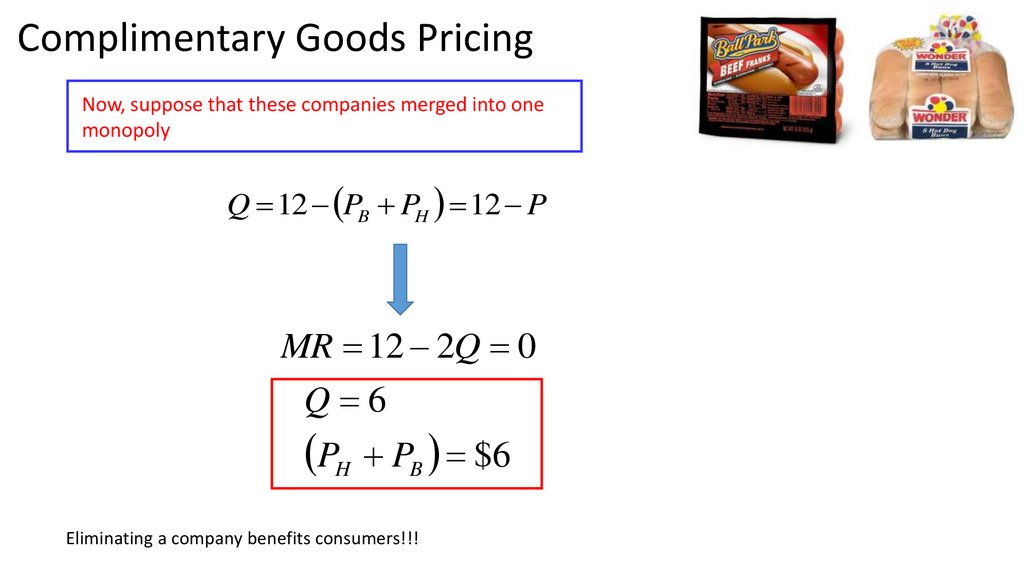
Complimentary Goods PricingNow, suppose that these companies merged into one
monopoly
Q 12 PB PH 12 P
MR 12 2Q 0
Q 6
PH PB $6
Eliminating a company benefits consumers!!!
112.
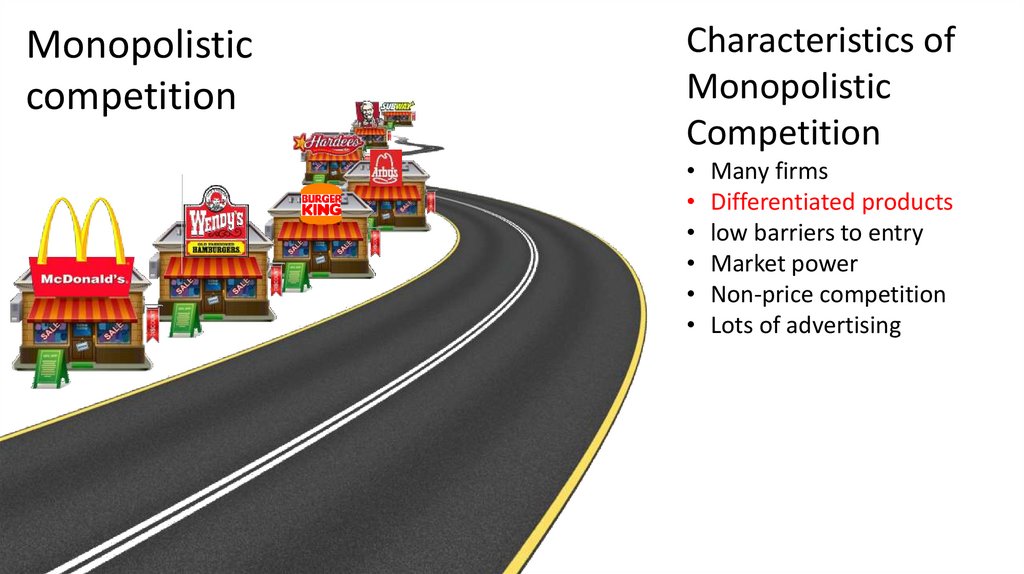
Monopolisticcompetition
Characteristics of
Monopolistic
Competition
Many firms
Differentiated products
low barriers to entry
Market power
Non-price competition
Lots of advertising
113.
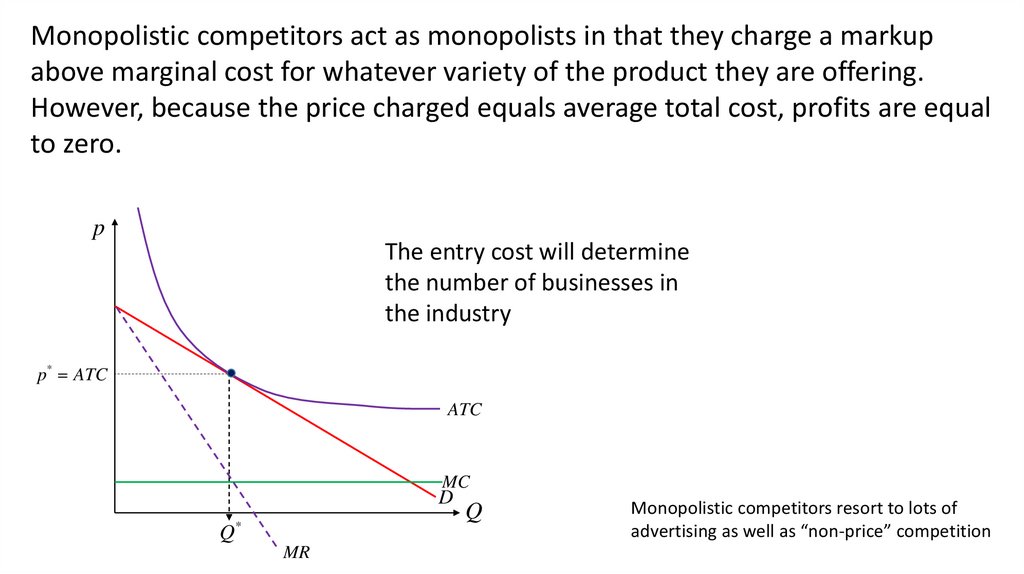
Monopolistic competitors act as monopolists in that they charge a markupabove marginal cost for whatever variety of the product they are offering.
However, because the price charged equals average total cost, profits are equal
to zero.
p
The entry cost will determine
the number of businesses in
the industry
p* ATC
ATC
MC
D
Q*
MR
Q
Monopolistic competitors resort to lots of
advertising as well as “non-price” competition
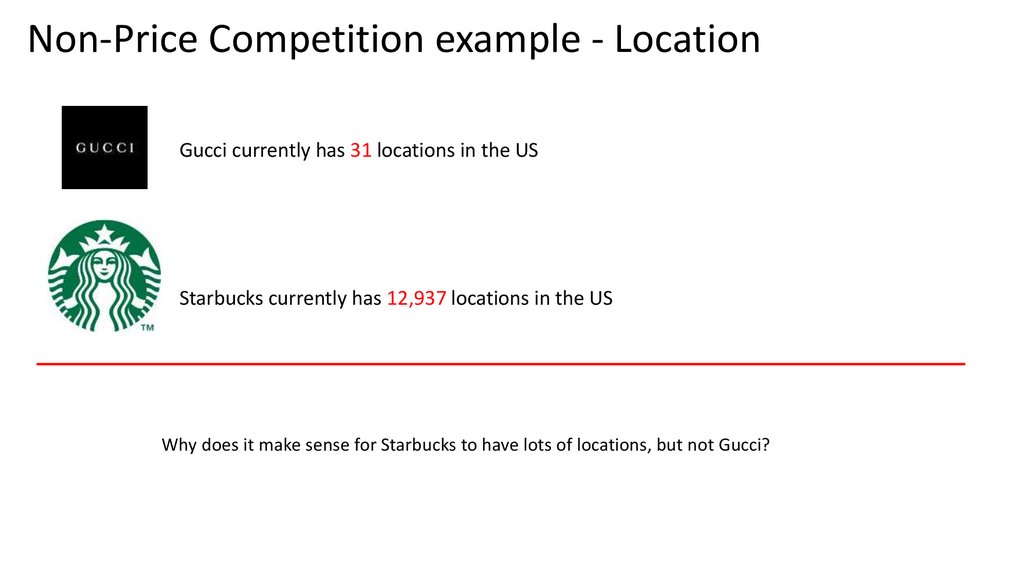
114.
Non-Price Competition example - LocationGucci currently has 31 locations in the US
Starbucks currently has 12,937 locations in the US
Why does it make sense for Starbucks to have lots of locations, but not Gucci?
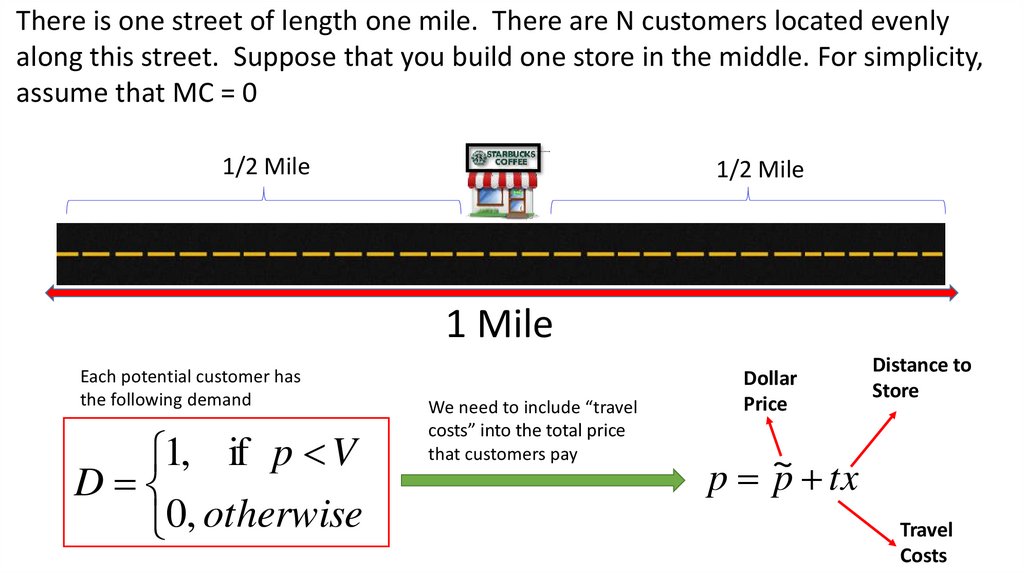
115.
There is one street of length one mile. There are N customers located evenlyalong this street. Suppose that you build one store in the middle. For simplicity,
assume that MC = 0
1/2 Mile
1/2 Mile
1 Mile
Each potential customer has
the following demand
1, if p V
D
0, otherwise
We need to include “travel
costs” into the total price
that customers pay
Dollar
Price
Distance to
Store
p ~
p tx
Travel
Costs
116.
There is one street of length one mile. There are N customers located evenlyalong this street. Suppose that you build one store in the middle. For simplicity,
assume that MC = 0
1/2 Mile
1/2 Mile
1 Mile
To capture the whole market, set x = 1/2
V p 1
x
t
2
t
~
p V
2
117.
Now, suppose that you build a second store…will a smaller market to capture, youcan charge a higher price!
1/4 Mile
1/4 Mile
1/4 Mile
1/4 Mile
1 Mile
To capture the whole market, set x = 1/4
V p 1
x
t
4
t
p V
4
118.
Now, three stores!1/6 Mile
1/6 Mile
1/6 Mile
1/6 Mile
1/6 Mile
1 Mile
To capture the whole market, set x = 1/6
V p 1
x
t
6
t
p V
6
1/6 Mile
119.
With ‘n’ stores, you can set a price ofFurther, profits are equal to
p V
t
2n
1 Mile
t
profit N V nF
2n
Total Sales
Price
Total Costs
120.
1 MileMaximizing Profits
t
max N V nF
n
2n
tN
n
2F
Number of locations is based on
• Size of the Market (N)
• Fixed costs of establishing a new
location
• “Transportation costs”
121.
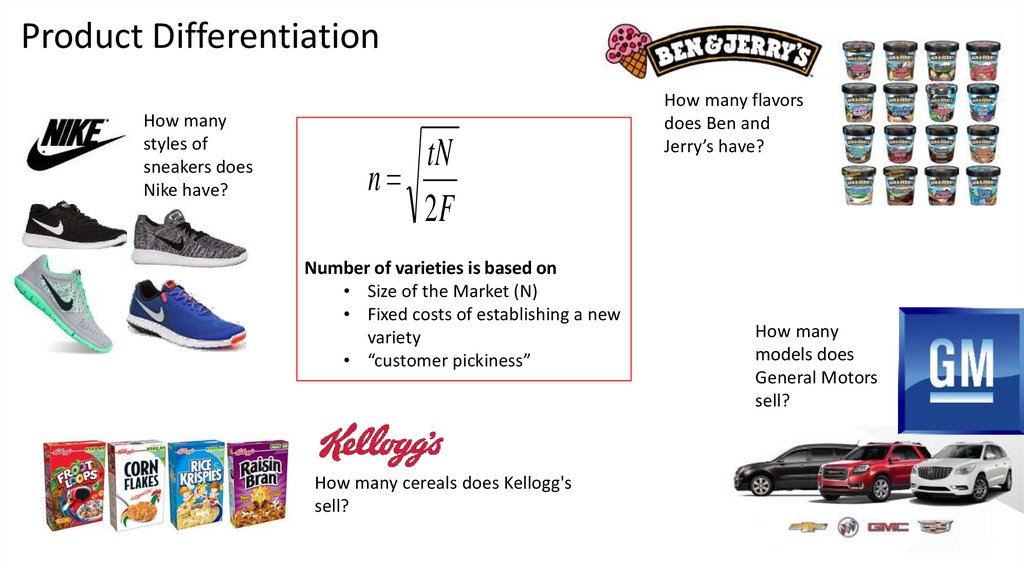
Product DifferentiationHow many
styles of
sneakers does
Nike have?
tN
n
2F
Number of varieties is based on
• Size of the Market (N)
• Fixed costs of establishing a new
variety
• “customer pickiness”
How many cereals does Kellogg's
sell?
How many flavors
does Ben and
Jerry’s have?
How many
models does
General Motors
sell?