


 Финансы
Похожие презентации:


")


My business team montly results
1. MY BUSINESS TEAM MONTLY RESULTS
Period ______2.
ПОКАЗАТЕЛИ В ДИНАМИКЕРасскажи про основные показатели:
онлайны на анкету, подарки, доходы
по бизнес тиме (сравниваем месяц к
месяцу)
СИТУАЦИЯ В КОМАНДЕ
Как обстоит ситуация с откликами,
сколько ушло переводчиков, кто в
ТОПе и почему
РЕКОМЕНДАЦИИ
К подготовке презентации
ИННОВАЦИИ И РИСК МЕНЕДЖМЕНТ
Что нового придумали и внедрили,
что протестировали, какие видишь
риски
2
3.
ТОПЫ В МОЕЙ КОМАНДЕLiza
Kuman
John
Davison
WE CREATE A SPECIAL
DESIGN FOR YOUR
BUSINESS.
WITH YOUR GREAT TEAM
YOU CAN CHANGE THE
WORLD
Marie
Nilsson
Peter
Freeman
PODCASTING OPERATIONAL
CHANGE MANAGEMENT
INSIDE
TAKING SEAMLESS KEY
PERFORMANCE INDICATORS
OFFLINE TO MAXIMISE
3
4.
АУТСАЙДЕРЫ В КОМАНДЕДоходы
Подарки
Профиля
Jimmy Fatty
120,200
WEB Developing
+10 Projects
Leon Kimmy
340,000
Print Design
+22 Projects
Esteban Kolton
240,000
UI/UX Apps
+33 Projects
Chaco Peeress
1,200,000
Logotype Creation
+44 Projects
2,400,000
450,000
Вывод:
4
5.
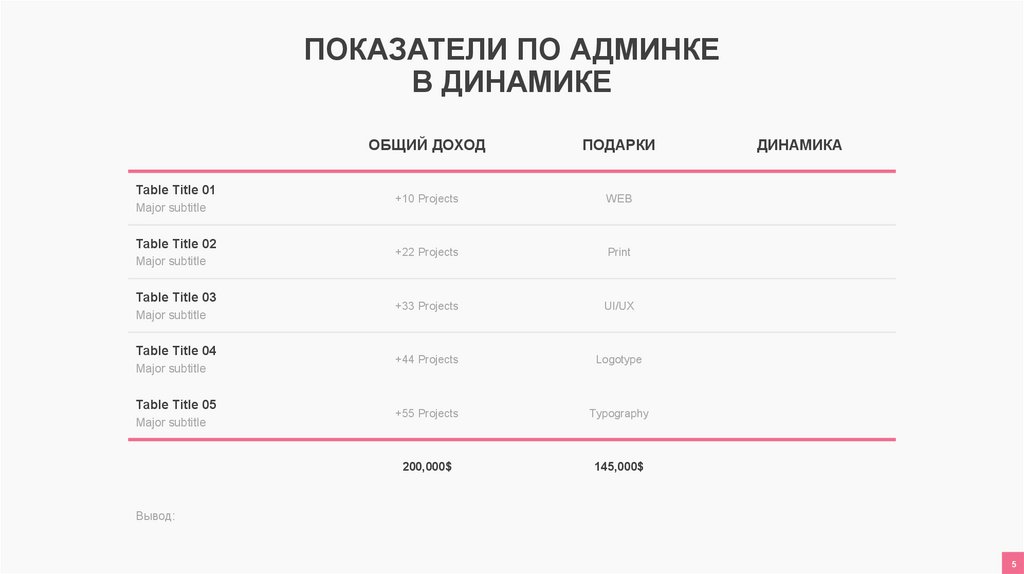
ПОКАЗАТЕЛИ ПО АДМИНКЕВ ДИНАМИКЕ
Table Title 01
Major subtitle
Table Title 02
Major subtitle
Table Title 03
Major subtitle
Table Title 04
Major subtitle
Table Title 05
Major subtitle
ОБЩИЙ ДОХОД
ПОДАРКИ
+10 Projects
WEB
+22 Projects
+33 Projects
UI/UX
+44 Projects
Logotype
+55 Projects
Typography
200,000$
145,000$
ДИНАМИКА
Вывод:
5
6. WE TREND
6ONE
TWO
THREE
Leverage agile frameworks to provide a
robust synopsis for high level overviews.
Iterative approaches to corporate.
Bring to the table win-win survival strategies
to ensure proactive domination. At the end of
the day.
Capitalize on low hanging fruit to identify a
ballpark value added activity to beta test.
Override the digital divide.
7.
ДОСТИЖЕНИЯ В ЦИФРАХПО ЦЕЛЯМ
735
48
320
CREATIVE
DESIGN
MARKETING
Leverage agile frameworks to provide a
robust synopsis
Your business begins with a general
introduction to the product.
Organically grow the holistic world view
of disruptive
7
8.
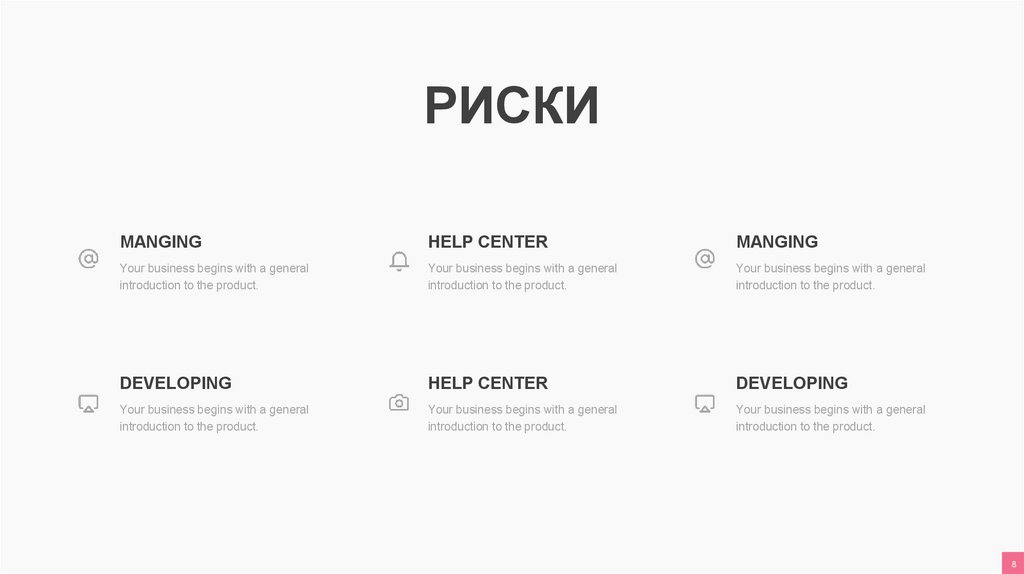
РИСКИMANGING
HELP CENTER
MANGING
Your business begins with a general
introduction to the product.
Your business begins with a general
introduction to the product.
Your business begins with a general
introduction to the product.
DEVELOPING
HELP CENTER
DEVELOPING
Your business begins with a general
introduction to the product.
Your business begins with a general
introduction to the product.
Your business begins with a general
introduction to the product.
8
9.
ЦЕЛИ НА СЛЕДУЮЩИЙМЕСЯЦ
MANGING
HELP CENTER
Your business begins with a general
introduction to the product.
Your business begins with a general
introduction to the product.
DEVELOPING
HELP CENTER
Your business begins with a general
introduction to the product.
Your business begins with a general
introduction to the product.
9
10.
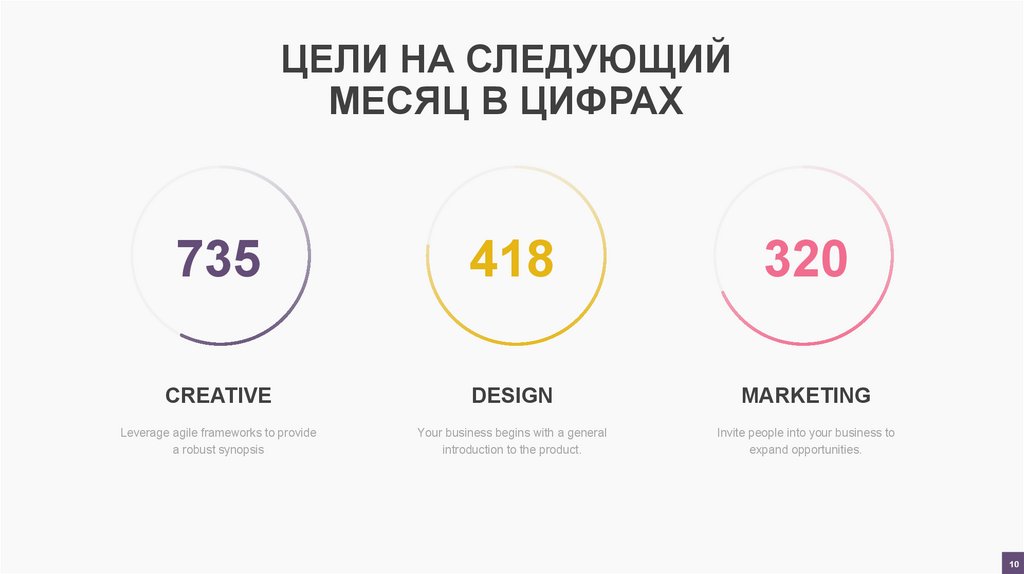
ЦЕЛИ НА СЛЕДУЮЩИЙМЕСЯЦ В ЦИФРАХ
735
418
320
CREATIVE
DESIGN
MARKETING
Leverage agile frameworks to provide
a robust synopsis
Your business begins with a general
introduction to the product.
Invite people into your business to
expand opportunities.
10
11.
ДАЛЬШЕ ВЫ НАЙДЕТЕ ШАБЛОНЫ,КОТОРЫЕ ВЫ МОЖЕТЕ
ИСПОЛЬЗОВАТЬ ДЛЯ ГРАФИКОВ И
ВИЗУАЛИЗАЦИИ
12.
GREAT NUMBERS70
60
NUMBERS
CHART
50
40
30
Leverage agile frameworks to provide a
robust synopsis for high level
overviews. Iterative approaches to
corporate.
20
10
0
1.5.02
Open
1.6.02
1.7.02
High
1.8.02
Low
1.9.02
Close
12
13.
87
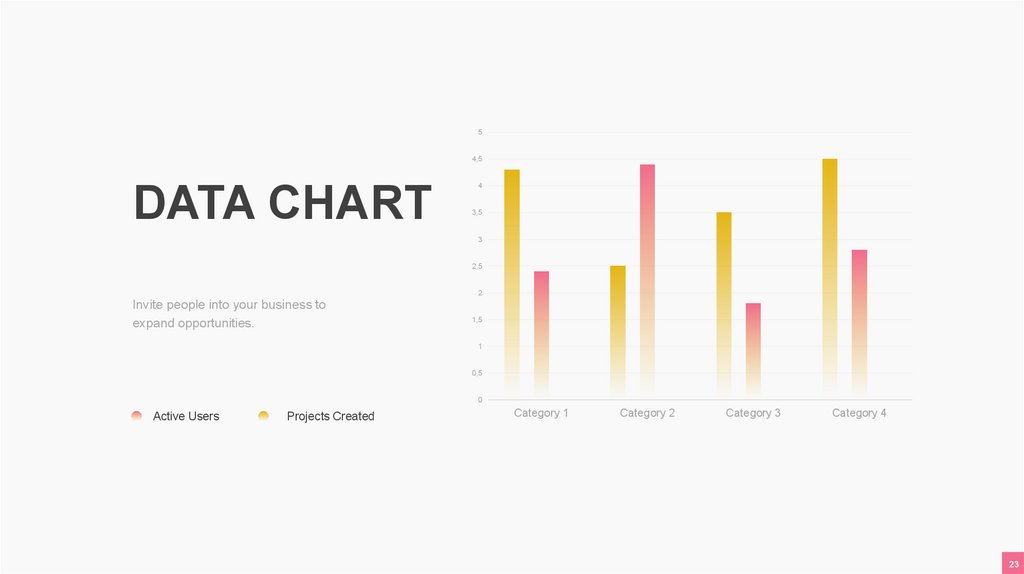
DATA CHART
6
5
4
Invite people into your business to
expand opportunities.
3
2
1
0
Active Users
Projects Created
Category 1
Category 2
Category 3
Category 4
13
14.
DATA CHART 735Invite people into your business to
expand opportunities.
48
CREATIVE
DESIGN
Leverage agile frameworks to provide a
robust synopsis
Your business begins with a general
introduction to the product.
5
4,5
4
3,5
3
2,5
2
1,5
1
0,5
0
Category 1
Category 2
Category 3
Category 4
15.
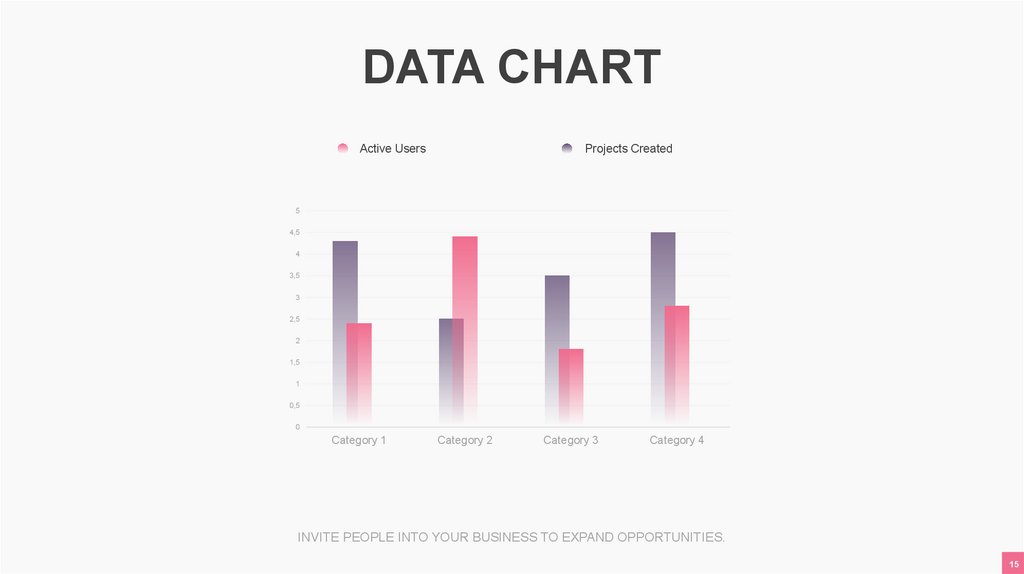
DATA CHARTActive Users
Projects Created
5
4,5
4
3,5
3
2,5
2
1,5
1
0,5
0
Category 1
Category 2
Category 3
Category 4
INVITE PEOPLE INTO YOUR BUSINESS TO EXPAND OPPORTUNITIES.
15
16.
AREA CHART1
2
3
4
COMPANY ONE
5
6
ANOTHER CHART
7
8
9
COMPETITOR
10
11
12
13
PEAR AG
INVITE PEOPLE INTO YOUR BUSINESS TO EXPAND OPPORTUNITIES.
16
17.
Category 4DATA CHART
Category 3
Invite people into your business to
expand opportunities.
Category 2
Active Users
Projects Created
Category 1
0
0,5
1
1,5
2
2,5
3
3,5
4
4,5
5
17
18.
DATA CHARTActive Users
Projects Created
8
7
6
5
4
3
2
1
0
Category 1
Category 2
Category 3
Category 4
INVITE PEOPLE INTO YOUR BUSINESS TO EXPAND OPPORTUNITIES.
18
19.
LINE CHART160
120
80
40
0
01.02.2016
08.02.2016
15.02.2016
22.02.2016
29.02.2016
INVITE PEOPLE INTO YOUR BUSINESS TO EXPAND OPPORTUNITIES.
19
20.
LINE CHART2150
2110
2070
2030
1990
1950
02.02.2016
05.02.2016
08.02.2016
11.02.2016
14.02.2016
Open
17.02.2016
High
Low
20.02.2016
23.02.2016
26.02.2016
29.02.2016
02.03.2016
Close
INVITE PEOPLE INTO YOUR BUSINESS TO EXPAND OPPORTUNITIES.
20
21.
COLUMN CHART100%
90%
80%
70%
60%
50%
40%
30%
20%
10%
0%
2012
2013
Series 1
Series 2
2014
Series 3
Series 4
2015
Series 5
INVITE PEOPLE INTO YOUR BUSINESS TO EXPAND OPPORTUNITIES.
21
22.
LINE CHART100%
90%
85%
90%
86%
85%
85%
78%
80%
65%
70%
65%
65%
60%
55%
60%
48%
50%
38%
40%
30%
45%
40%
30%
28%
32%
28%
22%
22%
15%
20%
10%
10%
5%
0%
Jan
Feb
Mar
Apr
May
Jun
Sales
Jul
Aug
Sep
Oct
Nov
Dec
Revenue
INVITE PEOPLE INTO YOUR BUSINESS TO EXPAND OPPORTUNITIES.
22
23.
54,5
DATA CHART
4
3,5
3
2,5
2
Invite people into your business to
expand opportunities.
1,5
1
0,5
0
Active Users
Projects Created
Category 1
Category 2
Category 3
Category 4
23
24.
54,5
DATA CHART
4
3,5
3
2,5
Invite people into your business to
expand opportunities.
2
1,5
1
0,5
0
Active Users
Projects Created
0
0,5
1
1,5
2
2,5
3
3,5
4
4,5
24
25.
SalesNUMBERS
CHART
Leverage agile frameworks to provide a
robust synopsis for high level
overviews. Iterative approaches to
corporate.
Кв. 1
Кв. 2
Кв. 3
Кв. 4
25
26.
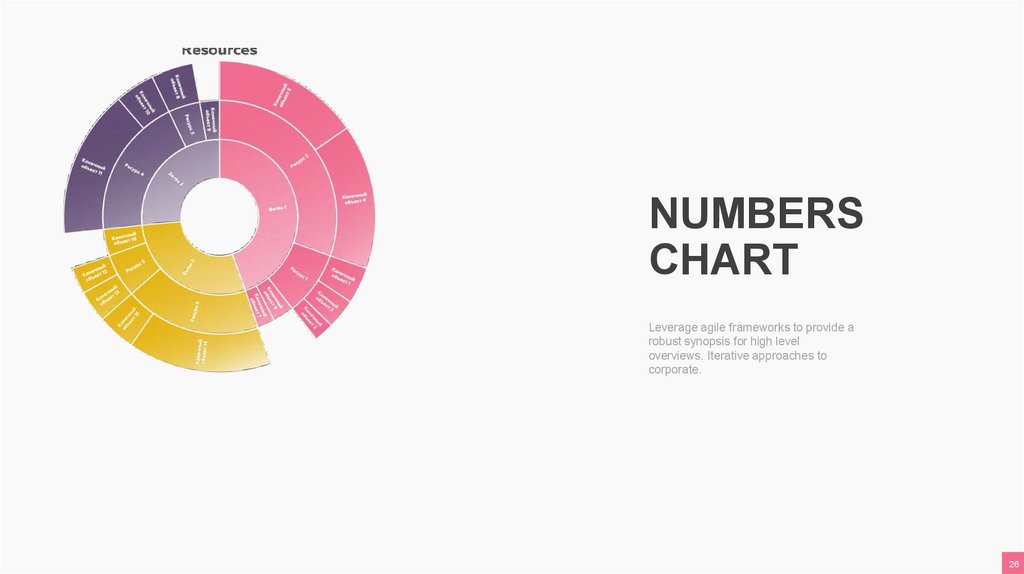
NUMBERSCHART
Leverage agile frameworks to provide a
robust synopsis for high level
overviews. Iterative approaches to
corporate.
26
27.
Sales3,5
3
NUMBERS
CHART
2,5
2
1,5
Leverage agile frameworks to provide a
robust synopsis for high level
overviews. Iterative approaches to
corporate.
1
0,5
0
0
0,5
1
1,5
2
2,5
3
27
28.
SalesNUMBERS
CHART
Leverage agile frameworks to provide a
robust synopsis for high level
overviews. Iterative approaches to
corporate.
Кв. 1
Кв. 2
Кв. 3
Кв. 4
28
29.
Diagram Name 11.5.02
1.6.02
1.7.02
1.8.02
1.9.02
Diagram Name 2
1.5.02
1.6.02
1.7.02
1.8.02
NUMBERS
CHARTS
Leverage agile frameworks to provide a
robust synopsis for high level
overviews. Iterative approaches to
corporate.
1.9.02
29