 Types of Data – categorical data")


")


")


 Математика
Похожие презентации:
. Week 2 (2)")
")
")
")
")
")
")
")
")
")
Types of Data – categorical data. Week 2 (1)
1. BBA182 Applied Statistics Week 2 (1) Types of Data – categorical data
DR SUSANNE HANSEN SARALEMAIL: SUSANNE.SARAL@OKAN.EDU.TR
HT TPS://PIAZZA.COM/CLASS/IXRJ 5MMOX1U2T8?CID=4#
WWW.KHANACADEMY.ORG
DR SUSANNE HANSEN SARAL
1
2. NEW IN CLASS?
Send me an email to the following address:susanne.saral@okan.edu.tr
DR SUSANNE HANSEN SARAL
2
3. Activation of piazza.com account
Enter your first and last nameSelect : Undergraduate
Select : Economy
Select : Class 1 and add BBA 182 and click “join the class”
DR SUSANNE HANSEN SARAL
3
4. Where does data come from?
Market researchSurvey (online questionnaires, paper questionnaires, etc.)
Interviews
Research experiments (medicine, psychology, economics)
Databases of companies, banks, insurance companies
Internet
other sources
DR SUSANNE HANSEN SARAL
4
5. Random Sampling
Simple random sampling is a procedure in which:Each member/item in the population is chosen strictly by chance
Each member/item in the population has an equal chance to be chosen
Each member/item has to be independent from each other
Every possible sample of n objects is equally likely to be chosen
The resulting sample is called a random sample.
DR SUSANNE HANSEN SARAL
Ch. 1-5
6. Convenience sample
A sample where subjects are not chosen strictly by chance. The researchers choses the sample(bias)
Advantage to collect a convenience sample:
- Convenient, less work load
- Fast, provides a fast answer
- Provides a trend or indication
Disadvantage:
- The data collected is not statistically valid and reliable. Cannot draw conclusions about the
population based on a convenience sample.
7. Data - Information
The objective of statistics is to extract information from data so that we can make businessdecisions that increase company profits
As we saw in last class, data can be numbers and data can be categories. Therefore we divide
them into different types. Each type requires a specific statistical technique for analysis.
To help explain this important principle, we need to define a few terms:
DR SUSANNE HANSEN SARAL
8. Variables
A variable is any characteristic, number, or quantity that can be measured or counted.Age, gender, business income and expenses, country of birth, capital expenditure, class grades,
car model, nationality are examples of variables.
They are called variables, because they can vary:
Country of birth can vary from person to person, not all class grades are the same, gender can
be either female or male. A variable can take on more than one characteristic and therefore is
called a variable
DR SUSANNE HANSEN SARAL
9. Variables and values (continued)
Values of a variable are the possible observations of the variable.Examples:
The values of religious orientation: Muslim, Buddhist, Protestant, Catholic, Agnostic, etc.
The values of a statistics exam are the integers between 0 and 100
The values of gender: Male or female
The size of buildings: 10 – 100 meters tall
DR SUSANNE HANSEN SARAL
10. Data = variable - values
When we talk about data we talk about observed values of a variable:Example, we observe the midterm exam grades (a variable) of 10 students:
67 74
71
83
93
55
48
From this set of data we can extract information.
who - what - when
DR SUSANNE HANSEN SARAL
81 68
62
11. Data – observed values of a variable
Data = values – informationData can be numbers (quantitative): Number of daily flight
departures at Sabiha Gökçen airport, size of a person, number of
products sold annually in a store, number of trucks arriving at a
warehouse, price of gold, etc.
Data can be categories (qualitative): Religious orientation, countries,
customer preference, tourist attractions, codes, gender, etc.
DR SUSANNE HANSEN SARAL
11
12. Classification of variables
Knowledge about the type of variable we are working with is necessary,because each type of variable requires a different statistical technique.
If we use the wrong statistical technique to present data the
information we are giving will be misleading.
13. Why classify variables?
Correctly classifying data is an important first step to selecting the correctstatistical procedures needed to analyze and interpret data.
Some graphs are appropriate for categorical/qualitative variables, and others
appropriate for quantitative/numerical variables
DR SUSANNE HANSEN SARAL
14. Classification of Variables
Data = value of a variableCategorical/
qualitative data
Numerical/quantitative
data
DR SUSANNE HANSEN SARAL
15. Categorical/qualitative
When the values of a variable are simply names of categories orcodes, we call it
a categorical or a qualitative variable
16. Classification of Variables Categorical/qualitative data – nominal
Categorical data generate responses that belong to categories:Responses to yes/no questions: Do you have a credit card?
What are the different academic departments of IYBF faculty? ( IR, Logistics, Business
Administration, etc. )
Transportations means (truck, ship, plane, etc.)
Product codes, country codes (0090 for Turkey), postal codes (34730 Göztepe, Istanbul),
ID numbers, telephone number, number on a football players’ shirt, etc.
The responses produce names, words or codes and are therefore called nominal data
DR SUSANNE HANSEN SARAL
17. Classification of Variables Categorical/qualitative data – Ordinal
Ordinal data includes an ordered range of choices, such as :strongly disagree – disagree – indifferent – agree - strongly agree
or large-medium-small
Example:
Size of a T-shirt: Small – medium - large
How do you rate the quality of meals in OKAN cafeterias on a scale from 1 to 5?
Where 1 = Very bad
5 = very good
How do you rate the latest Star Wars movie «Rouge One» on a scale from 1 to 5?
Where 1 = very boring
5 = very entertaining
DR SUSANNE HANSEN SARAL
18. Classification of Variables
Data values of a variableCategorical/qualitative
data
Nominal
Examples:
Nationality
Responses to yes/ no
questions
Codes
Interval or
Numerical data
Ordinal
Examples:
Customer ratings: On a scale from
1–5
Sizes: Small – medium - large
DR SUSANNE HANSEN SARAL
19. Classification of Variables Numerical/quantitative data
Many variables are quantitative:Price of a product, quantity of a product and time spent on a website, are all quantitative values
with units.
For quantitative variables, units such as TL or $, kilogram, minutes, liter or degree
Celsius tell us the scale of measurement.
Without units, the values of measurement have no meaning.
Example: It does little good to be promised a salary increase of 5000 a year if you do not know
whether it is paid in EUROS, TL or kilograms of rice
DR SUSANNE HANSEN SARAL
20. Classification of Variables
Data values of a variableCategorical/qualitative
data
Numerical/quantitative data
Discrete
DR SUSANNE HANSEN SARAL
Continuous
21. Classification of Variables Numerical/quantitative data
For quantitative variables, units such as TL or $, kilogram, minutes, liter ordegree Celsius tell us the scale of measurement.
Without units, the values of measurement have no meaning.
An essential part of a quantitative variable is it’s units!
DR SUSANNE HANSEN SARAL
22. Classification of Variables Numerical/quantitative data – discrete
Discrete variables are countable. They represent whole numbers – integers:Examples:
Number of trucks leaving a warehouse between 8:00 – 8:30 hours
Number of different nationalities living in Turkey in February 2017
Number of cars crossing the Bosphorus bridge in one day
DR SUSANNE HANSEN SARAL
23. Classification of Variables Numerical data – continuous
Continuous variables may take on any value within a given range or interval of realnumbers….and units are attached to continuous variables
Examples:
The age of a building, 14 years (14 – 15 years)
Temperature of a day in February in Istanbul, 6 degrees ( -1 – 10 degrees)
Distance travelled by car in one day, 55 km ( 54.30 – 55.64 km)
DR SUSANNE HANSEN SARAL
24.
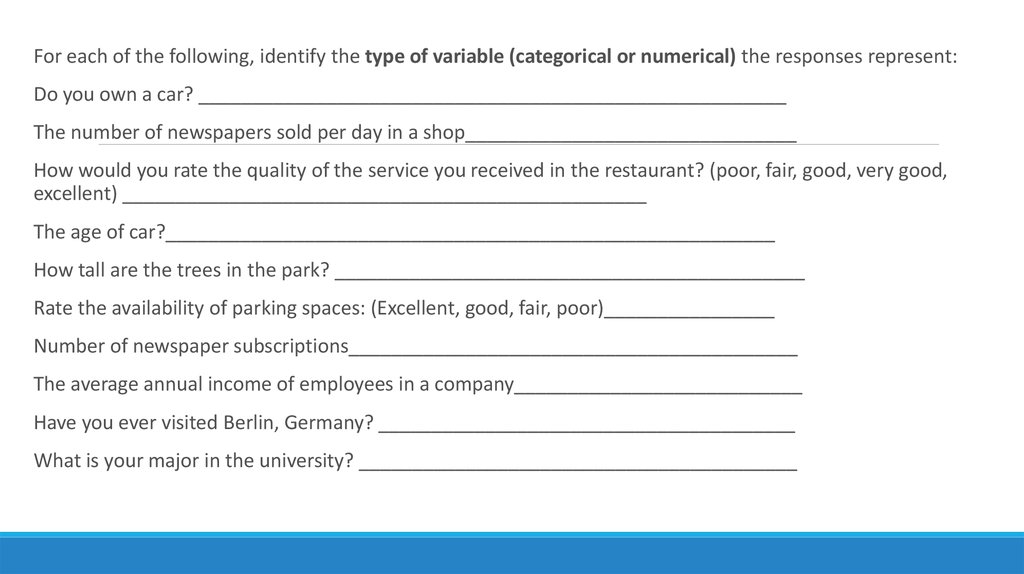
For each of the following, identify the type of variable (categorical or numerical) the responses represent:Do you own a car? _______________________________________________________
The number of newspapers sold per day in a shop_______________________________
How would you rate the quality of the service you received in the restaurant? (poor, fair, good, very good,
excellent) _________________________________________________
The age of car?_________________________________________________________
How tall are the trees in the park? ____________________________________________
Rate the availability of parking spaces: (Excellent, good, fair, poor)________________
Number of newspaper subscriptions__________________________________________
The average annual income of employees in a company___________________________
Have you ever visited Berlin, Germany? _______________________________________
What is your major in the university? _________________________________________
25. Classification of Variables
Data = variableCategorical/qualitative
data
Nominal
Ordinal
Numerical/quantitative data
Discrete
Examples:
# of goals in a football
match
# of subscriptions
# of meals sold in a
restaurant (Counted
items)
DR SUSANNE HANSEN SARAL
Continuous
Examples: with units
Weight
Volume
Size
26.
Graphical Presentation ofCategorical Data
Data in raw form are usually not easy to use for decision making
We need to make sense out of the data by some type of organization:
◦ Frequency Table - to compress and summarize the data
◦ Graph - to make a picture and present the data
DR SUSANNE HANSEN SARAL, SUSANNE.SARAL@GMAIL.COM
27. Raw data – data that is not yet organized Example: Football World cup champions (1930 – 2014)
Year ChampionsYear
Champions
1930
Uruguay
1974
W. Germany
1934
Italy
1978
Argentina
1938
Italy
1982
Italy
1950
Uruguay
1986
Argentina
1954
W. Germany
1990
W. Germany
1958
Brazil
1994
Brazil
1962
Brazil
1998
France
1966
England
2002
Brazil
1970
Brazil
2006
Italy
2010
2014
Spain
Germany
DR SUSANNE HANSEN SARAL, SUSANNE.SARAL@GMAIL.COM
28. Tables and Graphs for Categorical Variables
Categorical DataTabulating Data
Frequency and relative
frequency tables
Cross-table
Graphing Data
Bar Charts
Multivariate
bar charts
DR SUSANNE HANSEN SARAL, SUSANNE.SARAL@GMAIL.COM
Pie Chart
29. Organizing categorical data
Categorical data produce values that are names, words or codes, but not realnumbers.
Only calculations based on the frequency of occurrence of these names, words
or codes are valid.
We count the number of times a certain value occurs and add the frequency in
the table.
DR SUSANNE HANSEN SARAL, SUSANNE.SARAL@GMAIL.COM
30. The Frequency and relative frequency - Distribution Table Summarizing categorical data
The Frequency and relative frequency Distribution TableSummarizing categorical data
A frequency table organizes data by recording totals and category names.
The variable we measure here is the number of times a country became world champion in
football:
World champion in Football Number of times
Italy
4
Argentina
2
France
1
Uruguay
2
Brazil
5
Germany
4
England
1
Spain
1
Total
20
DR SUSANNE HANSEN SARAL, SUSANNE.SARAL@GMAIL.COM
31. The Frequency and relative frequency - Distribution Table
The Frequency and relative frequency Distribution TableSummarizing categorical data
Example: Number of visits on the website of OKAN University through different
search engines during 1 month. Search engine is the variable. Why?
(Variables are
categorical)
Search engine (category) Visits (frequencies) Visits (relative frequencies)
50269
54.5%
Direct
22173
24.0%
Yahoo
7272
7.9%
MSN
3166
3.4%
All others
8967
9.7%
Total
92221
100%
DR SUSANNE HANSEN SARAL, SUSANNE.SARAL@GMAIL.COM
32. The Frequency and relative frequency - Distribution Table
The Frequency and relative frequency Distribution TableSummarizing qualitative data
Example: Number of Hospital Patients admitted by Unit per semester
Hospital units is the variable here. Why?
Hospital Unit
(categories)
(Variables are
categorical)
Cardiac Care
Emergency
Intensive Care
Maternity
Surgery
Total:
Number of Patients
(frequencies)
Percent
(relative frequencies)
1,052
2,245
340
552
4,630
8,819
DR SUSANNE HANSEN SARAL, SUSANNE.SARAL@GMAIL.COM
11.93
25.46
3.86
6.26
52.50
100.00