Measures of variation")


")
")
")
 Математика
Похожие презентации:
")
")
")
")
")
")

")

")
Measures of variation. Week 4 (1)
1. BBA182 Applied Statistics Week 4 (1)Measures of variation
DR SUSANNE HANSEN SARALEMAIL: SUSANNE.SARAL@OKAN.EDU.TR
HT TPS://PIAZZA.COM/CLASS/IXRJ5MMOX1U2T8?CID=4#
WWW.KHANACADEMY.ORG
DR SUSANNE HANSEN SARAL
1
2. Numerical measures to describe data
Describing Data NumericallyCentral Tendency
Variation
Mean
Quartile
Median
Range
Mode
Interquartile Range
Variance
Standard Deviation
Coefficient of Variation
COPYRIGHT © 2013 PEARSON EDUCATION, INC. PUBLISHING AS PRENTICE HALL
Ch. 2-2
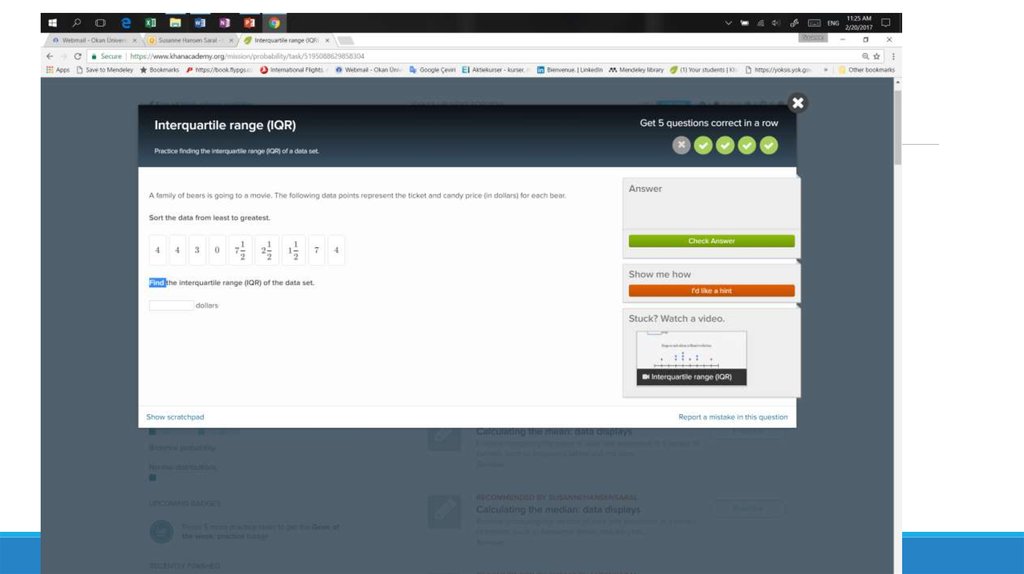
3. Interquatile range, IQR
Alternative way to calculate the IQRKhan Academy
4.
5. Five-Number Summary of a data set
In describing numerical data, statisticians often refer to thefive-number summary. It refers to five the descriptive
measures we have looked at:
minimum value
first quartile
median
third quartile
maximum value
minimum < Q1 < median < Q3 < maximum
It gives us a good idea where the data is located and how it is spread in the
data set
DR SUSANNE HANSEN SARAL
6. Five-Number Summary: Example
Sample Ranked Data:minimum <
6
6 7 8 9 10 11
Q1 < median <
< 7.75 < 10.5
Q3
11 12
< maximum
< 12.25 <
DR SUSANNE HANSEN SARAL
13 14
14
7. Exercise
Consider the data given below:110
a.
b.
c.
d.
e.
f.
g.
125
99
115
119 95 110
Compute the mean.
Compute the median.
What is the mode?
What is the shape of the distribution?
What is the lower quartile, Q1?
What is the upper quartile, Q3?
Indicate the five number summary
132
85
8. Exercise
Consider the data given below.85
95
99
110
110
115
119
125
132
a.
Compute the mean. 110
b.
Compute the median. 110
c.
What is the mode? 110
d.
What is the shape of the distribution? Symmetric, because mean = median=mode
e.
What is the lower quartile, Q1? 97
f.
What is the upper quartile, Q3? 122
g.
Indicate the five number summary 85 < 97 < 110 < 122 < 132
9. Five number summary and Boxplots
Boxplot is created from the five-number summaryA boxplot is a graph for numerical data that describes the shape of
a distribution, in terms of the 5 number summary.
It visualizes the spread of the data in the data set.
COPYRIGHT © 2013 PEARSON EDUCATION, INC. PUBLISHING AS PRENTICE HALL
Ch. 2-9
10. Five number summary and Boxplots
Boxplot is created from the five-number summaryThe central box shows the middle half of the data from Q1 to Q3,
(middle 50% of the data) with a line drawn at the median
Two lines extend from the box. One line is the line from Q1 to the
minimum value, the other is the line from Q3 to the maximum value
A boxplot is a graph for numerical data that describes the shape of a
distribution, like the histogram
COPYRIGHT © 2013 PEARSON EDUCATION, INC. PUBLISHING AS PRENTICE HALL
Ch. 2-10
11. Five number summary and boxplot
1,1,1,1,1,1,1,1,1,1,1,2,2,2,2,2,2,2,2,3,3,3,3,4,5Minimum number = 1
Maximum number = 5