 Using numerical data to describe data")


 for a sample of U.S. marketing managers:")


 Математика
Похожие презентации:
")
")
")
. Week 2 (2)")
")


")
")
")
Using numerical measures to describe data. Measures of the center. Week 3 (2)
1. BBA182 Applied Statistics Week 3 (2) Using numerical data to describe data
DR SUSANNE HANSEN SARALEMAIL: SUSANNE.SARAL@OKAN.EDU.TR
HT TPS://PIAZZA.COM/CLASS/IXRJ5MMOX1U2T8?CID=4#
WWW.KHANACADEMY.ORG
DR SUSANNE HANSEN SARAL
1
2. Using numerical measures to describe data
«Is the data in the sample centered or located around a specificvalue?»
First question that business people, economists, corporate executives, etc. ask
when presented with sample data.
3. Using numerical measures to describe data
The histogram gives an idea whether the data is centered around aspecific value.
The histogram provides a visual picture of how the data is distributed
(symmetric, skewed, etc.)
4. Is the data centered around a specific value?
5. Numerical measures to describe data
Describing Data NumericallyCentral Tendency
Variation
Mean
Range
Median
Interquartile Range
Mode
Variance
Standard Deviation
Coefficient of Variation
COPYRIGHT © 2013 PEARSON EDUCATION, INC. PUBLISHING AS PRENTICE HALL
Ch. 2-5
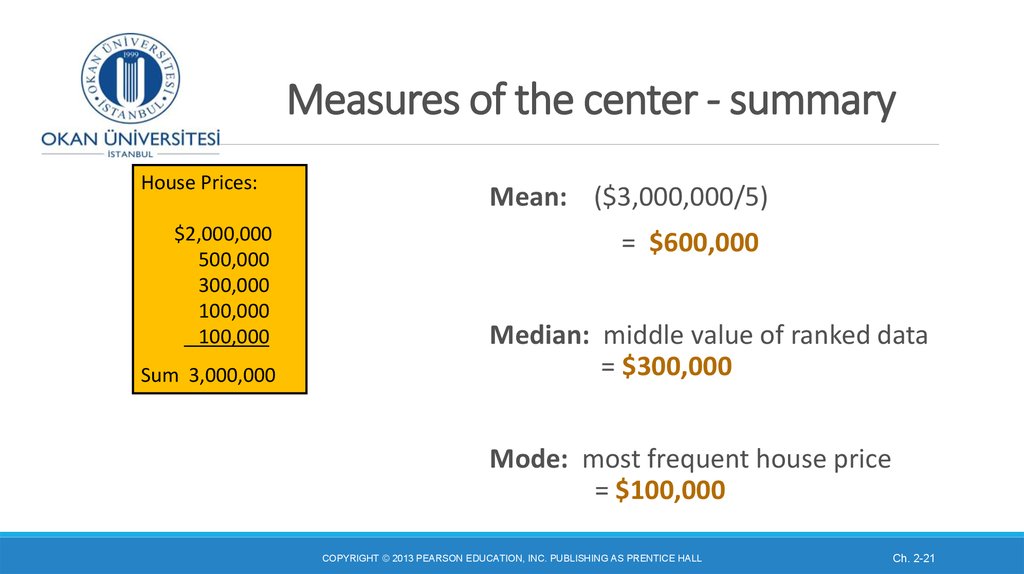
6. Measures of the center of the data set
2.1Measures of the center of the data set
Measures of Central
Tendency
Mean
Median
Mode
n
x
x
i 1
i
n
Arithmetic
average of the
data
Midpoint of
ranked/ordered
values in the data
Most frequently
observed value in the
data
(if one exists)
COPYRIGHT © 2013 PEARSON EDUCATION, INC. PUBLISHING AS PRENTICE HALL
Ch. 2-6
7. Mean Population mean, μ
MeanPopulation mean,