


 Экономика
Похожие презентации:


Measurement of Economic Performance
1.
Measurement of EconomicPerformance
2.
Gross Domestic Product3.
Measuring a Nation’s IncomeMicroeconomics – the study of how
individual households and firms make
decisions and how they interact with
one another in markets
Macroeconomics – the study of the
economy as a whole, its goal is to
explain the economic changes that
affect many households, firms, and
markets at once
4.
Measuring a Nation’s IncomeMacroeconomics answers questions like the
following:
Why is average income high in some
countries and low in others?
Why do prices rise rapidly in some time
periods while they are more stable in
others?
Why do production and employment
expand in some years and contract in
others?
5.
The Economy’s Income and ExpenditureWhen judging whether the economy is doing well
or poorly, it is natural to look at the total income
that everyone in the economy is earning
For an economy as a whole, income must equal
expenditure because:
Every transaction has a buyer and a seller
Every dollar of spending by some buyer is a
dollar of income for some seller
6.
The Measurement of Gross DomesticProduct
Gross Domestic Product (GDP) – a measure
of the income and expenditures of an
economy
It is the total market value of all final
goods and services produced within a
country in a given period of time
7.
The Measurement of Gross DomesticProduct
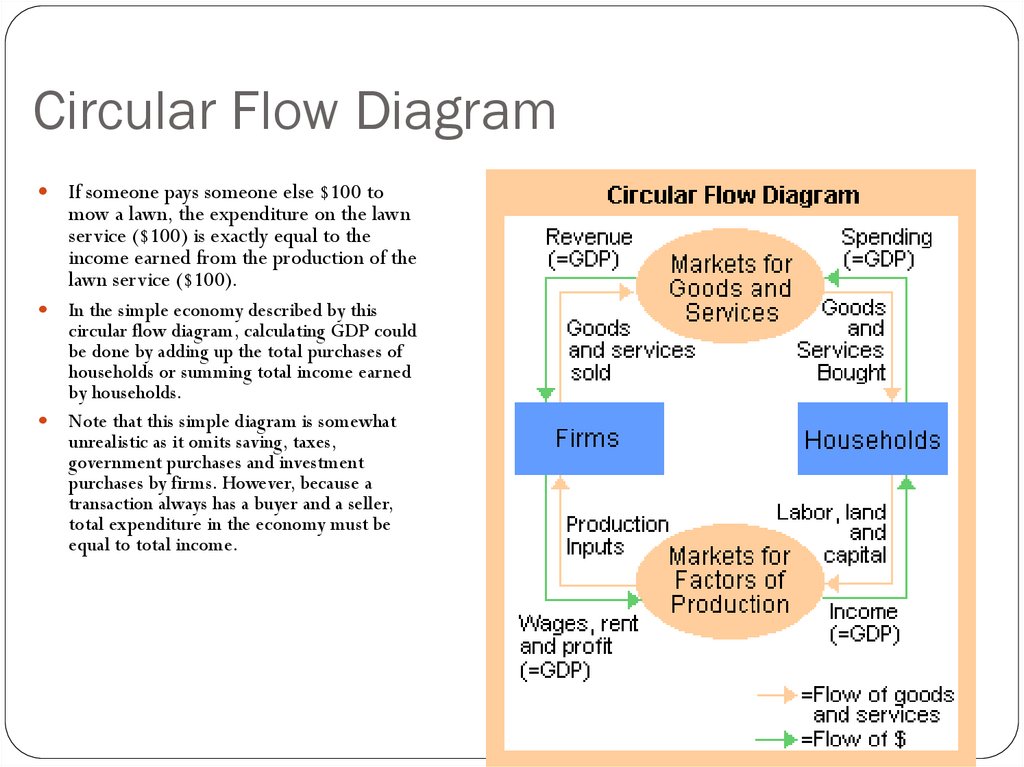
The equality of income and expenditure can be illustrated
with the circular-flow diagram
Circular-flow diagram is a simple depiction of the
macroeconomy.
Circular-flow diagram illustrates GDP as spending,
revenue, factor payments, and income.
First, some preliminaries:
Factors of production are inputs like labor, land, capital,
and natural resources.
Factor payments are payments to the factors of production.
(e.g., wages, rent)
Households:
own the factors of production,
sell/rent them to firms for income
buy and consume g&s
Firms:
buy/hire factors of production,
use them to produce g&s
sell g&s
8.
Circular Flow DiagramIf someone pays someone else $100 to
mow a lawn, the expenditure on the lawn
service ($100) is exactly equal to the
income earned from the production of the
lawn service ($100).
In the simple economy described by this
circular flow diagram, calculating GDP could
be done by adding up the total purchases of
households or summing total income earned
by households.
Note that this simple diagram is somewhat
unrealistic as it omits saving, taxes,
government purchases and investment
purchases by firms. However, because a
transaction always has a buyer and a seller,
total expenditure in the economy must be
equal to total income.
9.
Circular Flow - LeakagesLeakage is the non-consumption uses of
income, including saving, taxes, and
imports.
Savings, taxes, and imports are "leaked" out
of the main flow, reducing the money
available in the rest of the economy
Cash leakage refers to the sums of money
borrowed from banks but not re-deposited
10.
The Measurement of Gross DomesticProduct
Definition: GDP is the market value of all final goods
and services produced within a country in a given period
of time
“GDP is the Market Value…”
Output is valued at market prices
GDP measures all goods using the same units (e.g., dollars in
the U.S.), rather than “adding apples to oranges.”
Things that don’t have a market value are excluded, e.g.,
housework you do for yourself.
11.
The Measurement of Gross DomesticProduct
“Of All Final …”
It records only the value of final goods, not intermediate goods (the value if counted only
once) Used goods are NOT counted.
Final goods are intended for the end user
Intermediate goods are used as components or ingredients in the production of other
goods.
GDP only includes final goods, as they already embody the value of the intermediate
goods used in their production.
GDP includes all items produced and sold legally in the economy
The value of housing services is somewhat difficult to measure.
If housing is rented, the value of the rent is used to measure the value of the housing
services.
For housing that is owned (or mortgaged), the government estimates the rental value
and uses this figure to value the housing services.
GDP does not include illegal goods or services or items that are not sold in markets.
When you hire someone to mow your lawn, that production is included in GDP
If you mow your own lawn, that production is not included in GDP
12.
The Measurement of Gross DomesticProduct
“Goods and Services…”
It includes both tangible goods (food, clothing, cars) and intangible
goods (haircuts, housecleaning, doctor visits)
“Produced…”
It includes goods and services currently produced, not transactions
involving goods produced in the past
“Within a Country…”
It measures the value of production within the geographic confines
of a country
GDP measures the value of production that occurs within a country’s
borders, whether done by its own citizens or by foreigners located
there.
13.
The Measurement of Gross DomesticProduct
“In a Given Period of Time…”
It measures the value of production that takes
place within a specific interval of time, usually a
year or a quarter (three months).
14.
What is not Counted in GDP?GDP includes all items produced in the
economy and sold legally in markets
GDP excludes most items that are
produced and consumed at home and that
never enter the marketplace
It excludes items produced and sold
illicitly, such as illegal drugs.
15.
The Components of GDPGDP (Y) is the sum of the following:
Consumption (C)
Investment (I)
Government Purchases (G)
Net Exports (NX)
These components add up to GDP (denoted Y):
Y = C + I + G +NX
16.
The Components of GDPConsumption (C)
The spending by households on goods and services, with the exception
Note on housing costs:
For renters, consumption includes rent payments.
For homeowners, consumption includes
the imputed rental value of the house,
but not the purchase price or mortgage payments.
Investment (I)
is total spending on goods that will be used in the future to produce
more goods.
includes spending on
capital equipment (e.g., machines, tools)
structures (factories, office buildings, houses)
inventories (goods produced but not yet sold)
Note: “Investment” does not mean the purchase of financial assets like stocks
and bonds.
17.
The Components of GDPGovernment Purchases (G)
The spending on goods and services by local, state, and
federal governments
Does not include transfer payments such as Social
Security or unemployment insurance benefits because
these payments represent transfers of income and are
not made in exchange for currently produced goods or
services
Net Exports (NX)
Exports minus imports
Exports represent foreign spending on the economy’s
g&s.
Imports are the portions of C, I, and G
that are spent on g&s produced abroad.
18.
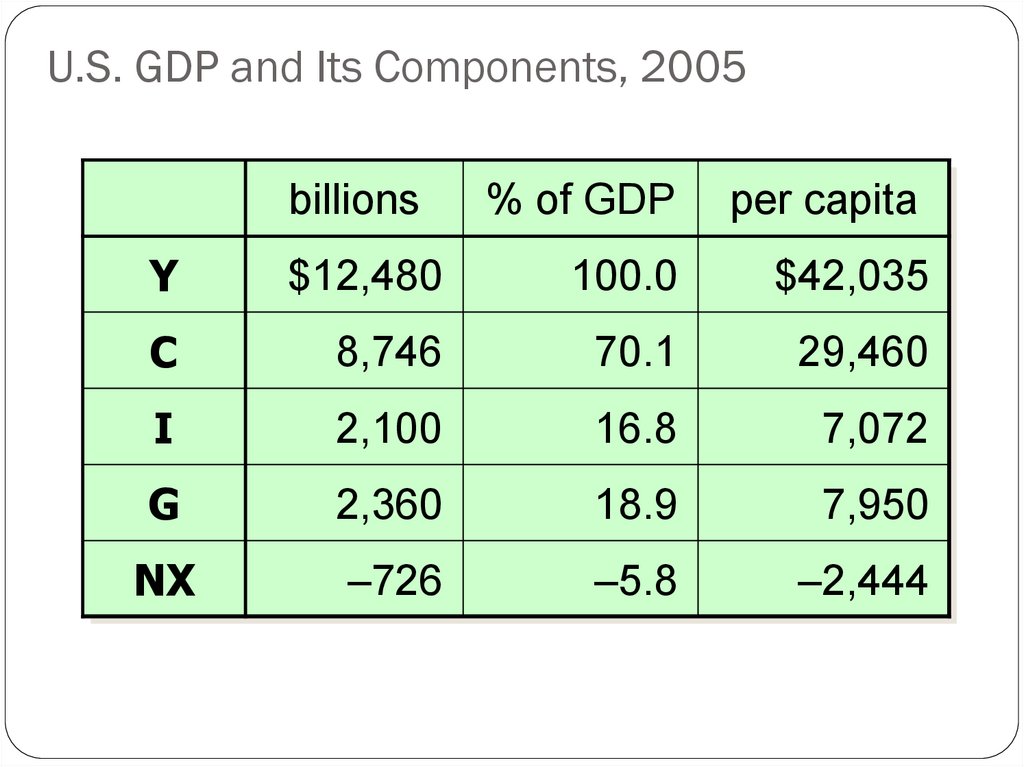
U.S. GDP and Its Components, 2005billions
% of GDP
per capita
Y
$12,480
100.0
$42,035
C
8,746
70.1
29,460
I
2,100
16.8
7,072
G
2,360
18.9
7,950
NX
–726
–5.8
–2,444
19.
A C T I V E L E A R N I N G 1:GDP and its components
In each of the following cases, determine how
much GDP and each of its components is
affected (if at all).
A. Debbie spends $200 to buy her husband dinner
at the finest restaurant in Boston.
B. Sarah spends $1800 on a new laptop to use in her publishing business. The
laptop was built in China.
C. Jane spends $1200 on a computer to use in her
editing business. She got last year’s model on sale
for a great price from a local manufacturer.
D. General Motors builds $500 million worth of cars,
but consumers only buy $470 million worth of them.
19
20.
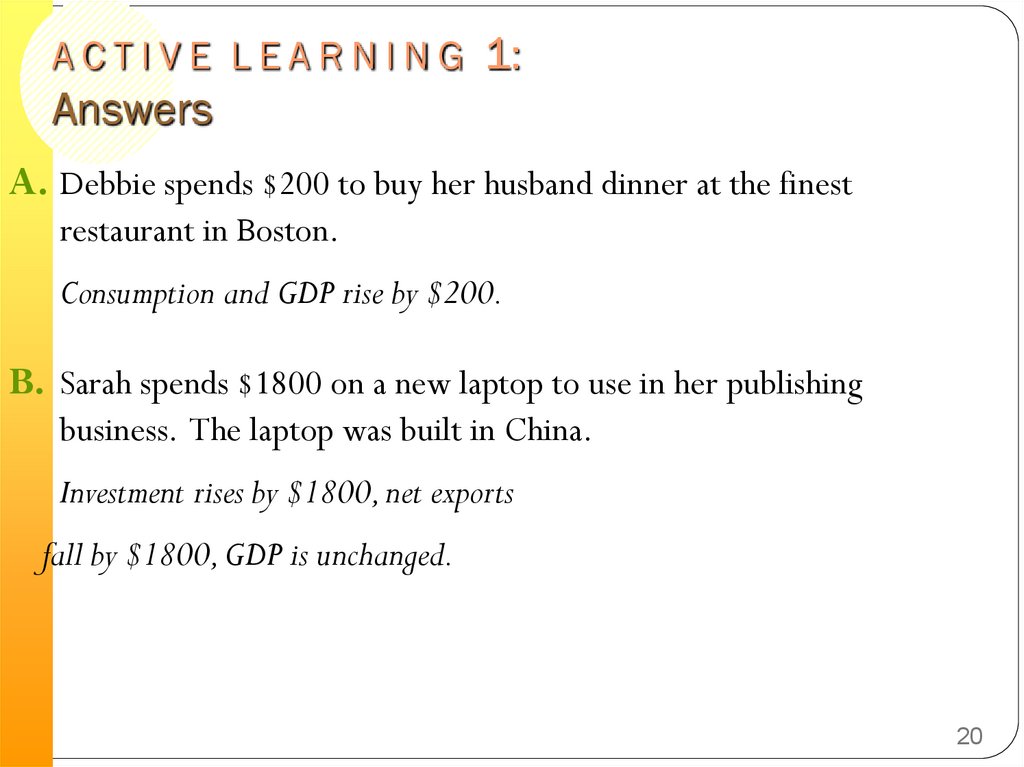
A C T I V E L E A R N I N G 1:Answers
A. Debbie spends $200 to buy her husband dinner at the finest
restaurant in Boston.
Consumption and GDP rise by $200.
B. Sarah spends $1800 on a new laptop to use in her publishing
business. The laptop was built in China.
Investment rises by $1800, net exports
fall by $1800, GDP is unchanged.
20
21.
A C T I V E L E A R N I N G 1:Answers
C.
Jane spends $1200 on a computer to use in
her editing business. She got last year’s
model on sale for a great price from a local manufacturer.
Current GDP and investment do not change, because the computer was
built last year.
D. General Motors builds $500 million worth of cars, but
consumers only buy $470 million of them.
Consumption rises by $470 million,
inventory investment rises by $30 million,
and GDP rises by $500 million.
21
22.
Real versus nominal GDPNominal GDP – values the production of
goods and services at current prices
Real GDP – values the production of
goods and services at constant prices
An accurate view of the economy
requires adjusting nominal to real GDP
by using the GDP deflator.
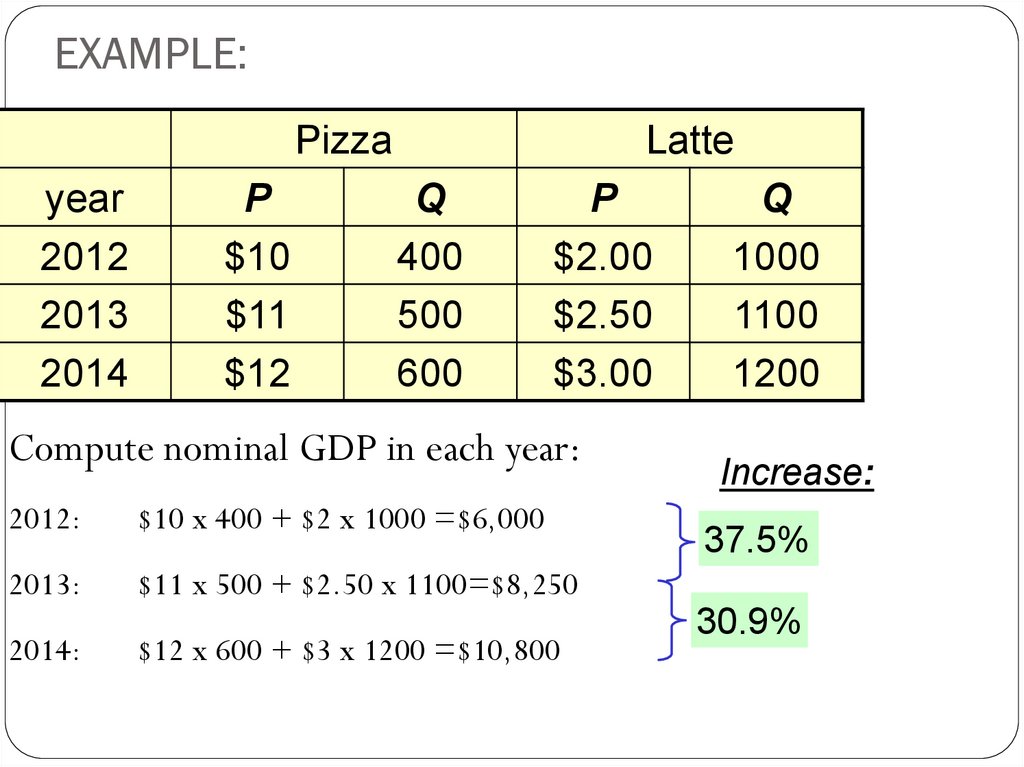
23.
EXAMPLE:Pizza
year
2012
2013
2014
P
$10
$11
$12
Latte
Q
400
500
600
P
$2.00
$2.50
$3.00
Compute nominal GDP in each year:
2012:
$10 x 400 + $2 x 1000 =$6,000
2013:
$11 x 500 + $2.50 x 1100=$8,250
2014:
$12 x 600 + $3 x 1200 =$10,800
Q
1000
1100
1200
Increase:
37.5%
30.9%
24.
EXAMPLE:Pizza
year
2012
2013
2014
P
$10
$10
$11
$12
Latte
Q
400
500
600
P
$2.00
$2.00
$2.50
$3.00
Compute real GDP in each year,
using 2012 as the base year:
Increase:
2012:
$10 x 400 + $2 x 1000
= $6,000
2013:
$10 x 500 + $2 x 1100
= $7,200
2014:
$10 x 600 + $2 x 1200
Q
1000
1100
1200
= $8,400
20.0%
16.7%
25.
EXAMPLE:Nominal
year
GDP
2012
$6000
2013
$8250
2014 $10,800
Real
GDP
$6000
$7200
$8400
In each year,
nominal GDP is measured using the (then)
current prices.
real GDP is measured using constant prices
from the base year (2012 in this example).
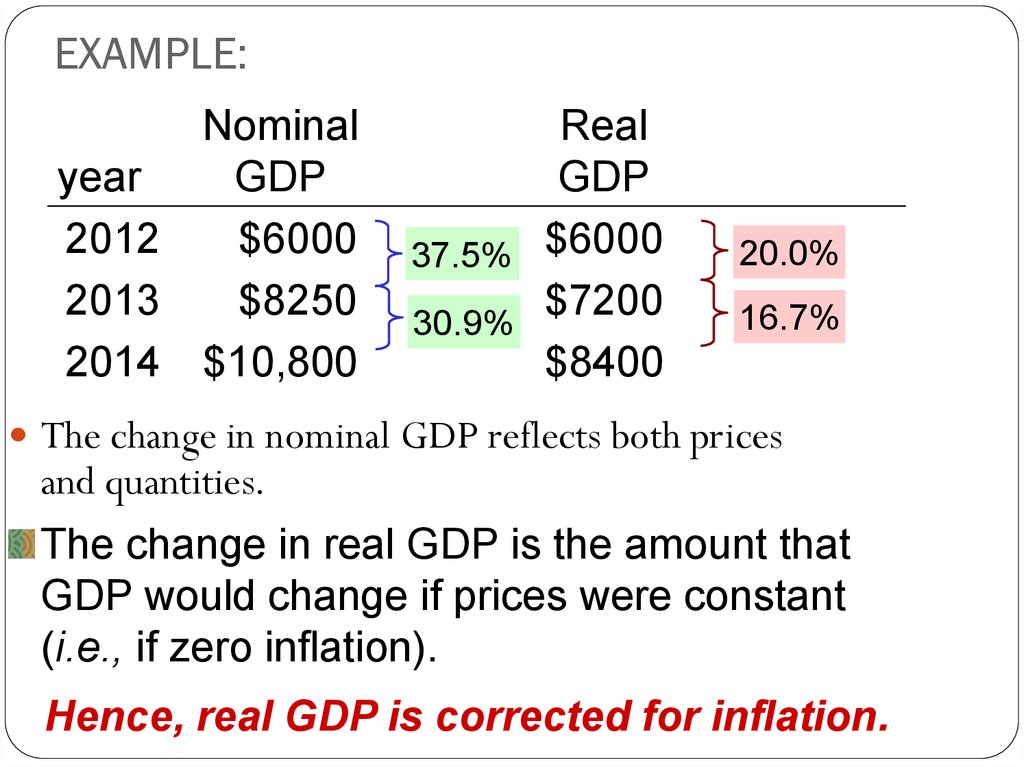
26.
EXAMPLE:Nominal
year
GDP
2012
$6000
2013
$8250
2014 $10,800
Real
GDP
37.5% $6000
$7200
30.9%
$8400
20.0%
16.7%
The change in nominal GDP reflects both prices
and quantities.
The change in real GDP is the amount that
GDP would change if prices were constant
(i.e., if zero inflation).
Hence, real GDP is corrected for inflation.
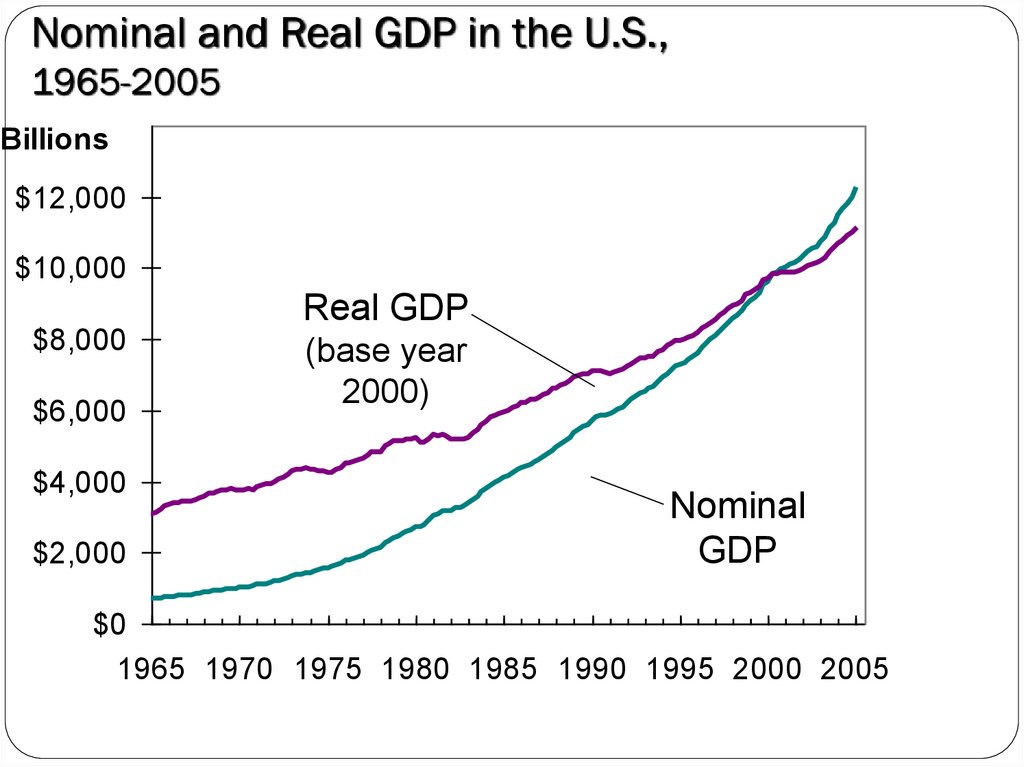
27.
Nominal and Real GDP in the U.S.,1965-2005
Billions
$12,000
$10,000
Real GDP
$8,000
$6,000
$4,000
$2,000
(base year
2000)
Nominal
GDP
$0
1965 1970 1975 1980 1985 1990 1995 2000 2005
28.
The GDP DeflatorThe GDP Deflator is a measure of the price
level calculated as the ratio of nominal GDP
to real GDP times 100
It tells us the rise in nominal GDP that is
attributable to a rise in prices rather than a
rise in the quantities produced
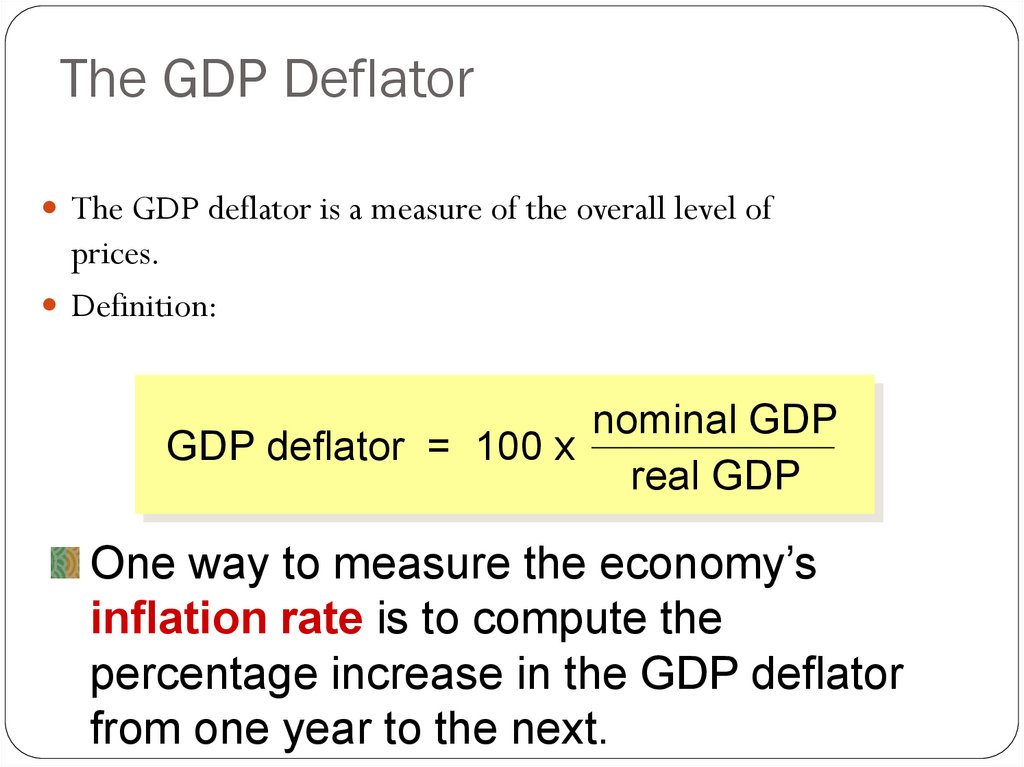
29.
The GDP DeflatorThe GDP deflator is a measure of the overall level of
prices.
Definition:
nominal GDP
GDP deflator = 100 x
real GDP
One way to measure the economy’s
inflation rate is to compute the
percentage increase in the GDP deflator
from one year to the next.
30.
EXAMPLE:year
2012
2013
2014
Nominal
GDP
$6000
$8250
$10,800
Real
GDP
$6000
$7200
$8400
GDP
Deflator
100.0 14.6%
114.6
12.2%
128.6
Compute the GDP deflator in each year:
2012: 100 x (6000/6000) =
100.0
2013: 100 x (8250/7200) =
114.6
2014: 100 x (10,800/8400) =
128.6
31.
The GDP DeflatorConverting Nominal GDP to Real GDP
Nominal GDP is converted to real GDP as follows:
Real GDP = Nominal GDP/GDP Deflator x 100
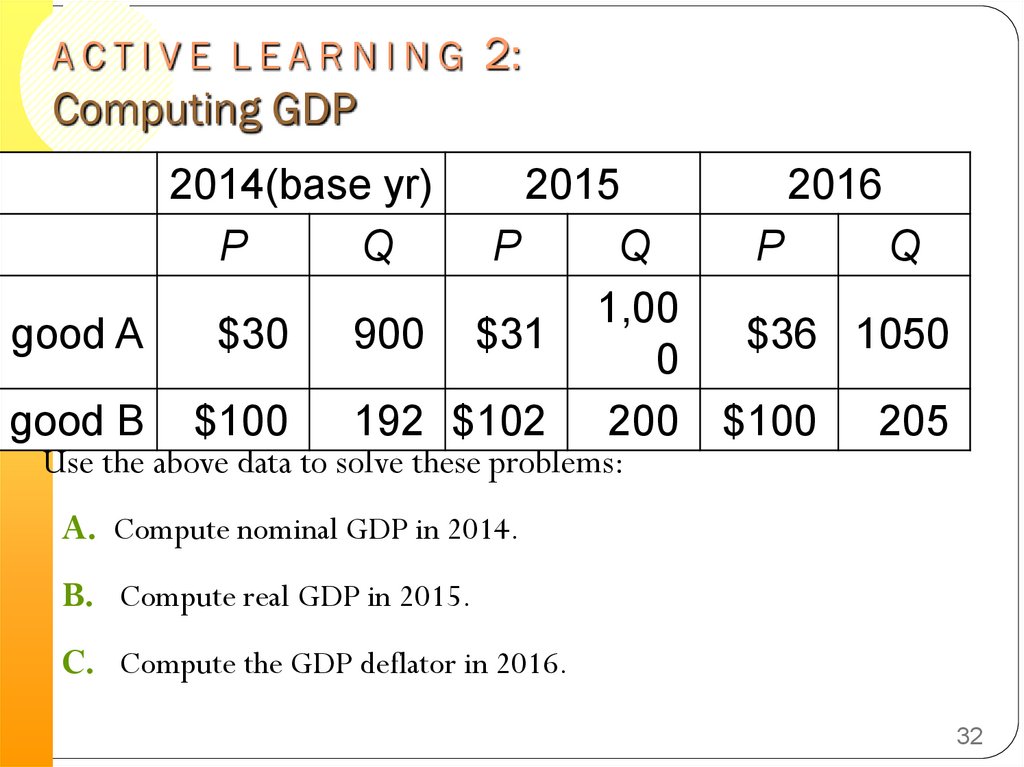
32.
A C T I V E L E A R N I N G 2:Computing GDP
2014(base yr)
P
Q
good A
$30
good B
$100
2015
P
Q
1,00
900 $31
0
192 $102 200
Use the above data to solve these problems:
2016
P
Q
$36 1050
$100
205
A. Compute nominal GDP in 2014.
B. Compute real GDP in 2015.
C. Compute the GDP deflator in 2016.
32
33.
A C T I V E L E A R N I N G 2:Answers
2014(base yr)
2015
P
Q
P
Q
good A
$30
900 $31 1,000
good B $100
192 $102 200
A. Compute nominal GDP in 2014.
2016
P
Q
$36 1050
$100 205
$30 x 900 + $100 x 192 = $46,200
B. Compute real GDP in 2015.
$30 x 1000 + $100 x 200 = $50,000
33
34.
A C T I V E L E A R N I N G 2:Answers
2014 (base yr)
2015
P
Q
P
Q
good A
$30
900 $31 1,000
good B $100
192 $102
200
C. Compute the GDP deflator in 2016.
2016
P
Q
$36 1050
$100
205
Nom GDP = $36 x 1050 + $100 x 205 = $58,300
Real GDP = $30 x 1050 + $100 x 205 = $52,000
GDP deflator = 100 x (Nom GDP)/(Real GDP)
= 100 x ($58,300)/($52,000) = 112.1
34
35.
GDP and Economic Well-beingGDP is the best single measure of the
economic well-being of a society
GDP per person tells us the income and
expenditure of the average person in the
economy
Higher GDP per person indicates a higher
standard of living
GDP is not a perfect measure of the
happiness or quality of life, however.
36.
GDP and Economic Well-BeingSome things that contribute to well-being are not
included in GDP
The value of leisure
The value of a clean environment
The value of almost all activity that takes place outside of
markets, such as the value of the time parents spend with their
children and the value of volunteer work
Distribution of income
Divorce
37.
GDP and Economic Well-BeingIt does not allow for the health of our
children, the quality of their
education, or the joy of their play. It
does not include the beauty of our
poetry or the strength of our
marriages, the intelligence of our
public debate or the integrity of our
public officials. It measures neither
our courage, nor our wisdom, nor
our devotion to our country. It
measures everything, in short, except
that which makes life worthwhile, and
it can tell us everything about
America except why we are proud
that we are Americans.”
- Senator Robert Kennedy, 1968
38.
Then Why Do We Care About GDP?Having a large GDP enables a country to afford better
schools, a cleaner environment, health care, etc.
Many indicators of the quality of life are positively
correlated with GDP. For example…
39.
GDP and Life Expectancy in 12 Countries90
Life
expectancy 85
(in years)
Japan
80
U.S.
75
Indonesia
China
70
Germany
Mexico
Brazil
65
India
60
Russia
Pakistan
Bangladesh
Nigeria
55
50
$0
$10,000
$20,000
$30,000
Real GDP per capita, 2002
$40,000
40.
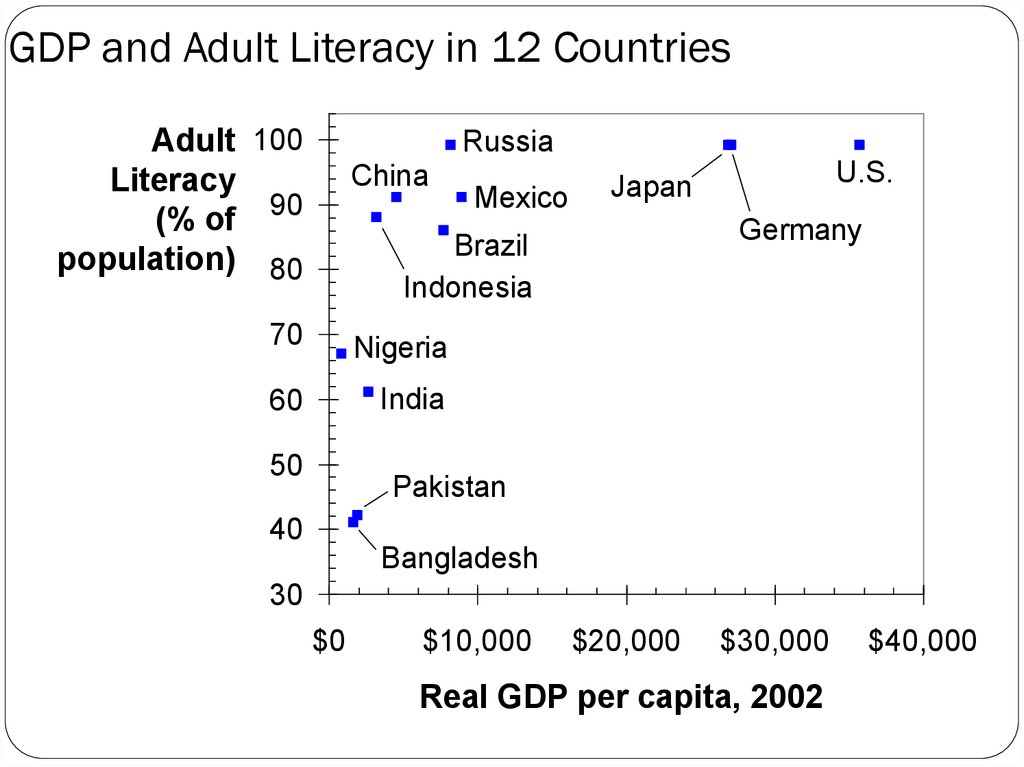
GDP and Adult Literacy in 12 CountriesAdult 100
Literacy
(% of 90
population) 80
Russia
China
Mexico
Germany
Brazil
Indonesia
70
Nigeria
60
India
50
U.S.
Japan
Pakistan
40
Bangladesh
30
$0
$10,000
$20,000
$30,000
Real GDP per capita, 2002
$40,000
41.
Gross National Product (GNP)GNP is the total income earned by a nation’s permanent
residents.
Differs from GDP by including income that our citizens
earn abroad and excluding income that foreigners earn
here.
Example: when a Canadian citizen works temporarily in
the United States, his production is part of U.S. GDP,
but it is not part of U.S. GNP (It is part of Canada’s
GNP)
42.
Other Measures of IncomeNet national product (NNP) – is the total income earned by a
nation’s residents (GNP) minus losses from depreciation (wear
and tear on an economy’s stock of equipment and structures)
Net domestic product (NDP) – equals the Gross Domestic
Product (GDP) minus depreciation on a country’s capital goods.
This is an estimate of how the country is not able to replace the
capital stock, lost through depreciation, then GDP will fall. In
addition, a growing gap between GDP and NDP indicates
increasing obsolescence of capital goods, while a narrowing gap
would mean that the condition of capital stock in the country is
improving.
43.
Other Measures of IncomeAn economy in 2008 produced $500 billion worth of
final goods and services. Of these, $70 billion were
investment goods. During the year, $25 billion of the
capital stock in existence at the beginning of 2004 was
replaced or repaired
NDP for 2008 for this economy is ______.
NDP = GDP – depreciation
NNP = GNP – depreciation
44.
Other Measures of IncomeNational Income – the total income earned by a nation’s residents
in production of goods/services. National income differs from
NNP by excluding indirect business taxes (sales tax) and including
business subsidies.
National income = NNP – sales tax
Personal Income – the income that households and non-corporate
businesses receive. It excludes retained earnings, which is income
that corporations have earned but have not paid out to their
owners.
Personal income = national income – earnings
Disposable personal income – the income households and noncorporate businesses have left after satisfying all their obligations
to the government. It equals personal income minus personal
taxes and certain non-tax payments (such as traffic tickets)
Disposable personal income = personal income – personal
income tax
45.
Income ApproachGDP can also be calculated through three different income
approaches: aggregate, national, and personal.
Aggregate income – the most common income approach and is the total
income measured by adding all labor income (wages, salaries, benefits),
capital income (interest, profits, and rent), depreciation, indirect
business taxes, and net income of foreigners.
National income – the total income earned by citizens and businesses
within a country during one year. It is the sum of labor income and
capital income and excludes indirect business taxes, depreciation, and
the net income of foreigners.
Personal income – the total income paid directly to individuals. It
includes capital income, labor income, and transfer payments.
46.
Production ApproachThe production approach is the total production of all firms
or industries in the economy. In order to avoid double
counting, only the value added by each manufacturer is
counted. The total value added will be equal to the final
price.
47.
Unemployment and its Natural Rate48.
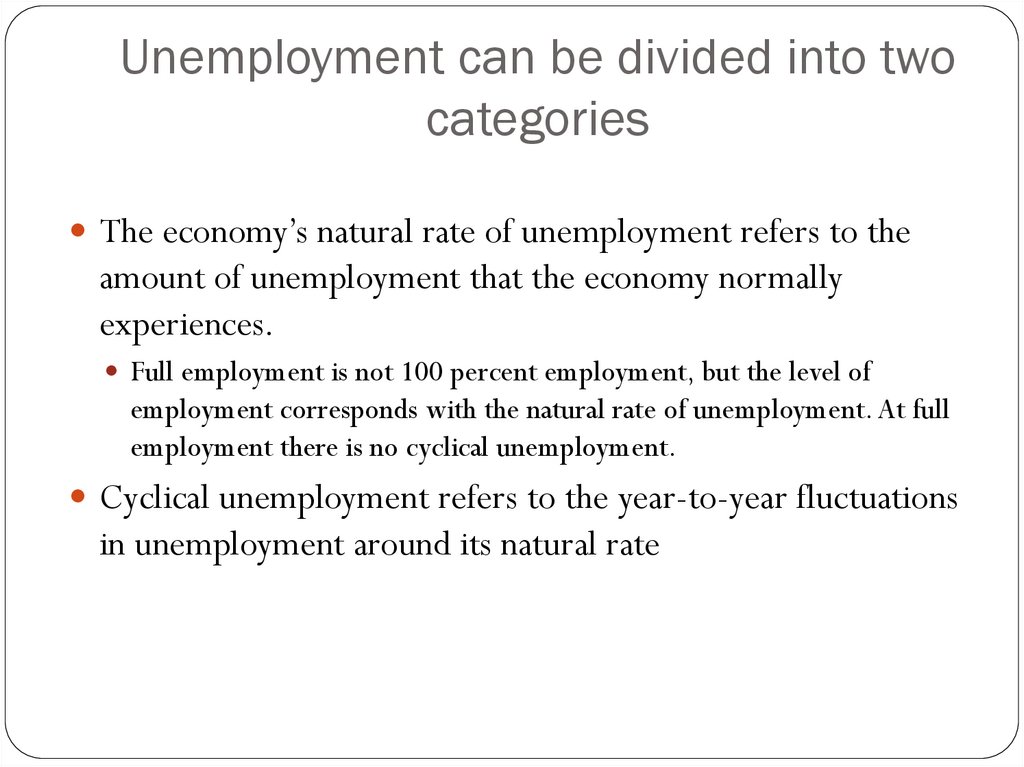
Unemployment can be divided into twocategories
The economy’s natural rate of unemployment refers to the
amount of unemployment that the economy normally
experiences.
Full employment is not 100 percent employment, but the level of
employment corresponds with the natural rate of unemployment. At full
employment there is no cyclical unemployment.
Cyclical unemployment refers to the year-to-year fluctuations
in unemployment around its natural rate
49.
Identify UnemploymentHow is Unemployment Measured?
The Bureau of Labor Statistics (BLS) surveys 60,000
households every month.
The BLS places each adult (aged 16 or older) into one three
categories: employed, unemployed, or not in the labor force
50.
How is Unemployment Measured?Labor force – the total number of workers, including
both the employed and unemployed
Labor force = number of employed + number of
unemployed
Unemployment rate – the percentage of the labor force
that is unemployed
Unemployment rate = (number of unemployed/ labor
force) x 100%
51.
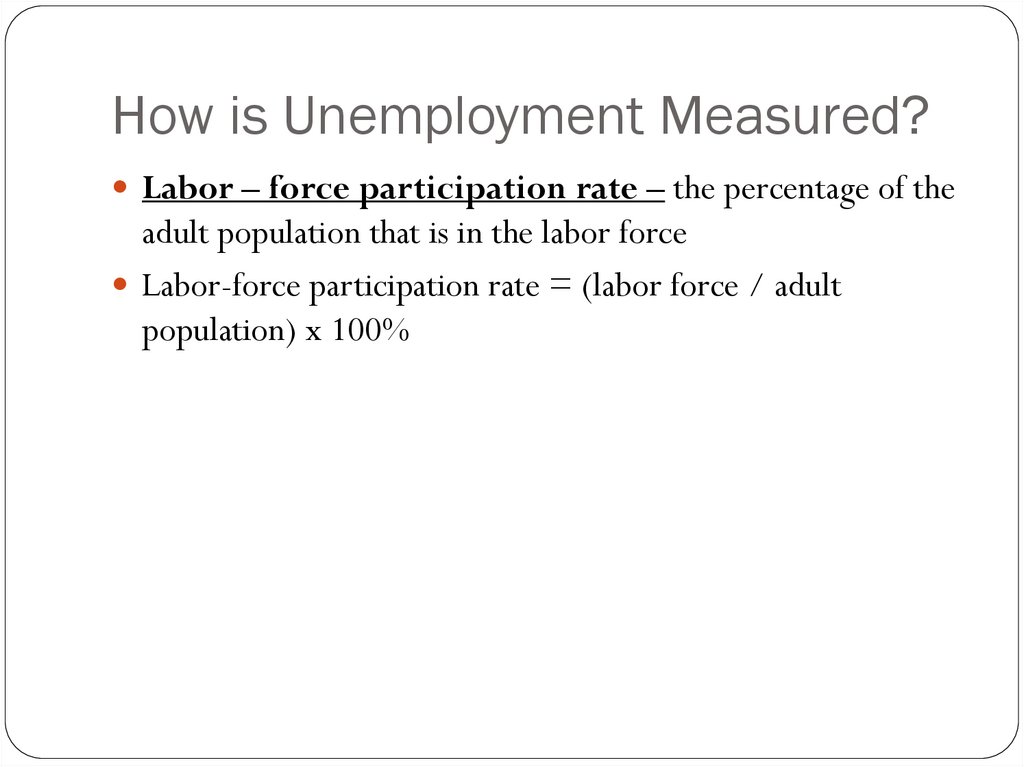
How is Unemployment Measured?Labor – force participation rate – the percentage of the
adult population that is in the labor force
Labor-force participation rate = (labor force / adult
population) x 100%
52.
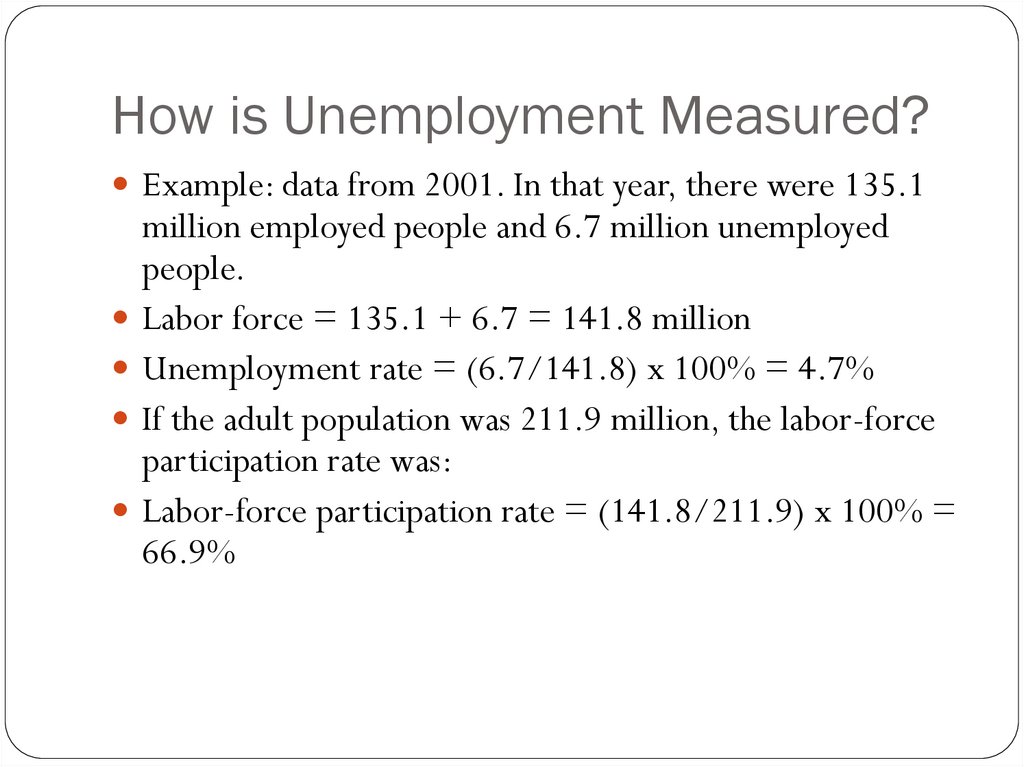
How is Unemployment Measured?Example: data from 2001. In that year, there were 135.1
million employed people and 6.7 million unemployed
people.
Labor force = 135.1 + 6.7 = 141.8 million
Unemployment rate = (6.7/141.8) x 100% = 4.7%
If the adult population was 211.9 million, the labor-force
participation rate was:
Labor-force participation rate = (141.8/211.9) x 100% =
66.9%
53.
A C T I V E L E A R N I N G 1:Calculate labor force statistics
Compute the labor force, u-rate, adult population, and labor force
participation rate using this data:
Adult population of the U.S.
by group, January 2006
# of employed
143.1 million
# of unemployed
7.0 million
not in labor force
77.4 million
53
54.
A C T I V E L E A R N I N G 1:Answers
Labor force
= employed + unemployed
= 143.1 + 7.0
= 150.1 million
U-rate
= 100 x (unemployed)/(labor force)
= 100 x 7.0/150.1
= 4.7%
54
55.
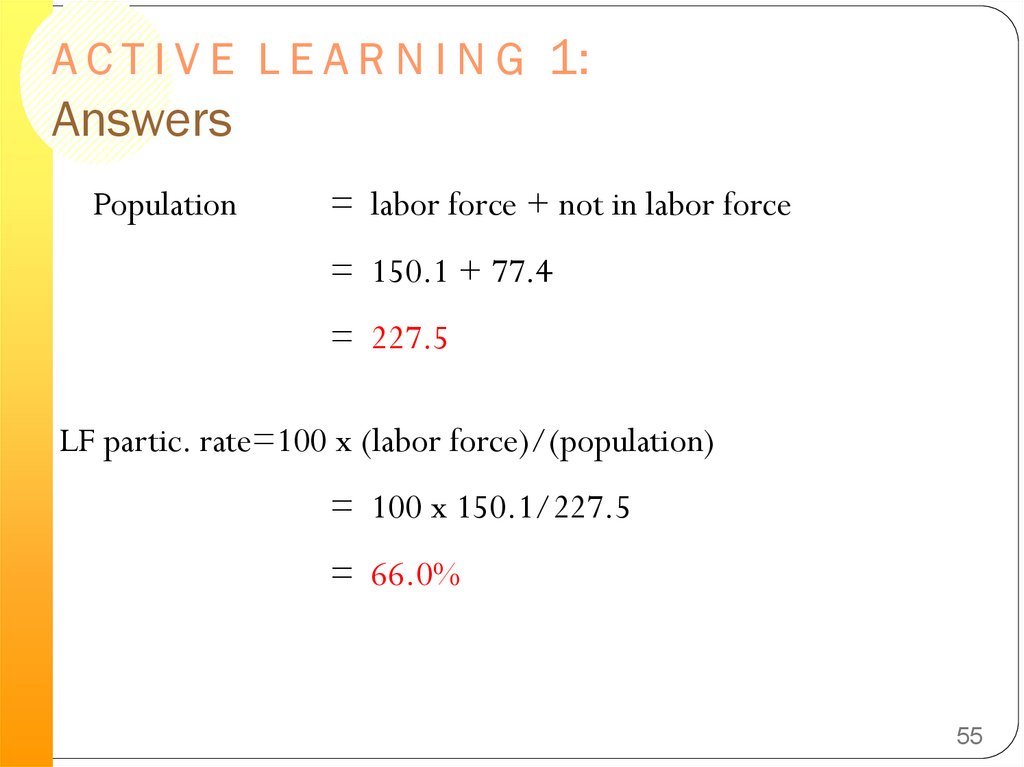
A C T I V E L E A R N I N G 1:Answers
Population
= labor force + not in labor force
= 150.1 + 77.4
= 227.5
LF partic. rate=100 x (labor force)/(population)
= 100 x 150.1/227.5
= 66.0%
55
56.
Unemployment and labor-forceparticipation rates for various sub-groups
of the U.S. population
Women have lower labor-force participation rates than
men, but have similar rates of unemployment
Blacks have similar labor-force participation rates to whites,
but have higher rates of unemployment
Teenagers have lower labor-force participation rates than
adults, but have higher unemployment rates
57.
Labor Market Statistics for Whites & Blacks,January 2006
Adults (20 yrs & older)
u-rate
LF part. rate
White, male
3.6%
76.4%
White, female
3.7
59.7
Black, male
7.5
69.8
Black, female
8.1
64.4
58.
Labor Market Statistics for Whites & Blacks,January 2006
Teens (16-19 yrs)
u-rate
LF part. rate
White
13.3
47.1
Black
31.4
30.9
59.
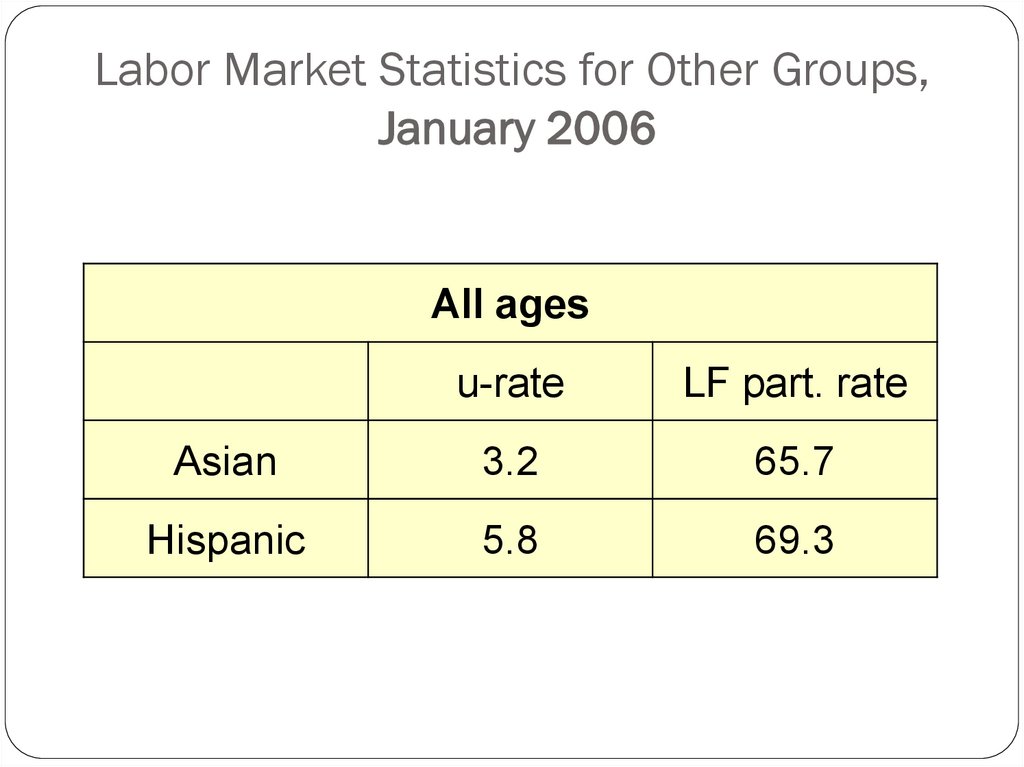
Labor Market Statistics for Other Groups,January 2006
All ages
u-rate
LF part. rate
Asian
3.2
65.7
Hispanic
5.8
69.3
60.
Labor Market Statistics by Education Level,January 2006
Adults (25 yrs & older)
u-rate
LF part. rate
less than h.s.
7.0%
46.0%
h.s. diploma
4.4
62.5
3.5
72.5
2.1
78.3
some college or
assoc degree
bachelor’s
degree or more
61.
62.
UnemploymentNatural rate of
unemployment – the normal
rate of unemployment around
which the unemployment rate
fluctuates
Cyclical unemployment –
the deviation of unemployment
from its natural rate.
63.
Case Study: Labor-Force Participation ofMen and Women in the U.S. economy
There has been a dramatic rise in the labor-force
participation rates of women over the past 50 years
The labor-force participation rates for men have actually
fallen by a small amount over the same time period.
64.
Does the Unemployment Rate MeasureWhat We Want It To?
Measuring the unemployment rate is not as straightforward
as it may seem.
There is a tremendous amount of movement into and out of
the labor force
Many of the unemployed are new entrants or reentrants looking
for work
Many unemployment spells end with a person leaving the labor
force as opposed to actually finding a job
65.
Does the Unemployment Rate MeasureWhat We Want It To?
There may be individuals who are calling themselves unemployed to qualify
for government assistance, yet they are not trying hard to find work. These
individuals are more likely not a part of the true labor force, but they will
be counted as unemployed.
Dishonest workers – bias the unemployment figures upward. These
individuals claim to be unemployed in order to receive unemployment
benefits when, in fact, they do not want a job or are working for cash in an
unreported job.
Discouraged workers – individuals who would like to work but have
given up looking for a job
These individuals will not be counted as part of the labor force
Thus, while they are likely a part of the unemployed, they will not show up in the
unemployment statistics
66.
How Long are the Unemployed withoutwork?
Another important variable that policymakers may be
concerned with is the duration of unemployment
Most spells of unemployment are short, and most
unemployment observed at any given time is long term
67.
Why are there always PeopleUnemployed?
In an ideal labor market, wages would adjust so that the
quantity of labor supplied and the quantity of labor
demanded would be equal
However, there is always unemployment even when the
economy is doing well. The unemployment rate is never zero;
it fluctuates around the natural rate
68.
Types of UnemploymentFrictional unemployment – unemployment that results
because it takes time for workers to search for the jobs that
best suit their tastes and skills
Structural unemployment – unemployment that results
because the number of jobs available in some labor markets
is insufficient to provide a job for everyone who wants one
Three possible reasons for structural unemployment are
minimum-wage laws, unions, and efficiency wages
69.
Types of UnemploymentSeasonal unemployment – the unemployment that arises
because of seasonal weather patterns.
Seasonal unemployment increases during the winter months and decreases
during the spring and summer.
Examples: a fruit picker who is laid off after the fall harvest and who gets
rehired the following summer. A lifeguard that works during the summer,
but is laid off during the winter.
Cyclical unemployment – the fluctuating unemployment over
the business cycle.
Cyclical unemployment increases during a recession and decreases during an
expansion.
Example: an autoworker who is laid off because the economy is in a
recession and who gets rehired some months later when the expansion
begins.
70.
Job SearchJob search – the process by which
workers find appropriate jobs given
their tastes and skills
Because workers differ from one
another in terms of their skills and
tastes and jobs differ in their
attributes, it is often difficult for
workers to match with the appropriate
job
71.
Why some Frictional Unemployment isInevitable?
Frictional unemployment often occurs because of a change in the
demand for labor among different firms
When workers decide to stop buying a good produced by Firm A and instead
start buying a good produced by Firm B, some workers at Firm A will likely
lose their jobs
New jobs will be created at Firm B, but it will take some time to move the
displaced workers from Firm A to Firm B
The result of this transition is temporary unemployment
The same type of situation can occur across industries as well
This implies that, because the economy is always changing, frictional
unemployment is inevitable. Workers in declining industries will find
themselves looking for new jobs, and firms in growing industries will be
seeking new workers
72.
Public Policy and Job SearchGovernment programs can help to reduce the amount of frictional
unemployment
These programs include
Government-run employment agencies that give out information on job
vacancies
Public training programs that aim to ease the transition of workers from
declining to growing industries and to help disadvantaged groups escape
poverty
Critics of these programs argue that the private labor market will do a
better job of matching workers with employers and therefore the
government should not be involved in the process of job search.
73.
Unemployment InsuranceUnemployment insurance – a
government program that partially protects
workers’ incomes when they become
unemployed
Because unemployment insurance reduces
the hardship of unemployment, it also
increases the amount of unemployment that
exists.
Many studies have shown that more
generous unemployment insurance benefits
lead to reduced job search effort and, as a
result, more unemployment
74.
In the News: German UnemploymentUnemployment benefits
are much more generous
in Germany than they are
in the United States
75.
Minimum-Wage LawsUnemployment can also occur
because of minimum-wage laws
The minimum wage is a price floor
If the minimum wage is set above
the equilibrium wage in the labor
market, a surplus of labor will
occur
However, this is a binding
constraint only when the
minimum wage is set above the
equilibrium wage
Most workers in the economy
earn a wage above the minimum
wage
Minimum-wage laws therefore
have the largest effect on
workers with low skill and little
experience (such as teenagers)
76.
Minimum-Wage LawsAnytime a wage is kept above the equilibrium level for any
reason, the result is unemployment.
Other causes of this situation include unions and efficiency
wages.
This situation is different from frictional unemployment where
the search for the right job is the reason for unemployment.
77.
Unions and Collective BargainingUnion – a worker association that bargains with employers over
wages and working bargains
Unions play a smaller role in the U.S. economy today than they did
in the past. However, unions continue to be prevalent in many
European countries.
78.
The Economics of UnionCollective bargaining – the process by
which unions and firms agree on the terms
of employment
Unions try to negotiate for higher wages,
better benefits, and better working
conditions than the firm would offer if
there were no union
Strike – the organized withdrawal of
labor from a firm by a union
Economists have found that union workers
typically earn 10 to 20 percent more than
similar workers who do not belong to
unions
79.
The Economics of UnionsThis implies that unions raise the wage above the
equilibrium wage, resulting in unemployment.
Unions are often believed to cause conflict between insiders
(who benefit from high union wages) and outsiders (who do not
get the union jobs).
Outsiders will either remain unemployed or find jobs in firms
that are not unionized
The supply of workers in nonunion firms will increase, pushing
wages at those firms down.
80.
Are Unions Good or Bad for theEconomy?
Critics of unions argue that unions are a cartel,
which causes inefficiency because fewer workers
end up being hired at the higher union wage
Advocates of unions argue that unions are an
answer to the problems that occur when a firm has
too much power in the labor market (for example,
if it is the only major employer in town)
In the News: Should you join a Union?
Individuals looking for jobs may have to consider
whether or not they should join a union.
81.
The Theory of Efficiency WagesEfficiency wages – above-equilibrium wages paid by firms
in order to increase worker productivity
Efficiency wages raise the wage above the market equilibrium
wage, resulting in unemployment.
82.
There are several reasons why a firmmay pay efficiency wages.
Worker Health
Better paid workers can afford to eat better and can afford good
medical care.
This is not applicable in rich countries such as the United States, but
can raise the productivity of workers in less-developed countries
where inadequate nutrition and health care are more common
Worker Turnover
A firm can reduce turnover by paying a wage greater than its workers
could receive elsewhere
This is especially helpful for firms that face high hiring and training
costs.
83.
There are several reasons why a firmmay pay efficiency wages.
Worker Effort
Again, if a firm pays a worker more than he or she can receive
elsewhere, the worker will be more likely to try to protect his or her
job by working harder.
This is especially helpful for firms who have difficulty monitoring
their workers.
Worker Quality
Offering higher wages attracts a better pool of applicants
This is especially helpful for firms who are not able to perfectly gauge
the quality of job applicants
84.
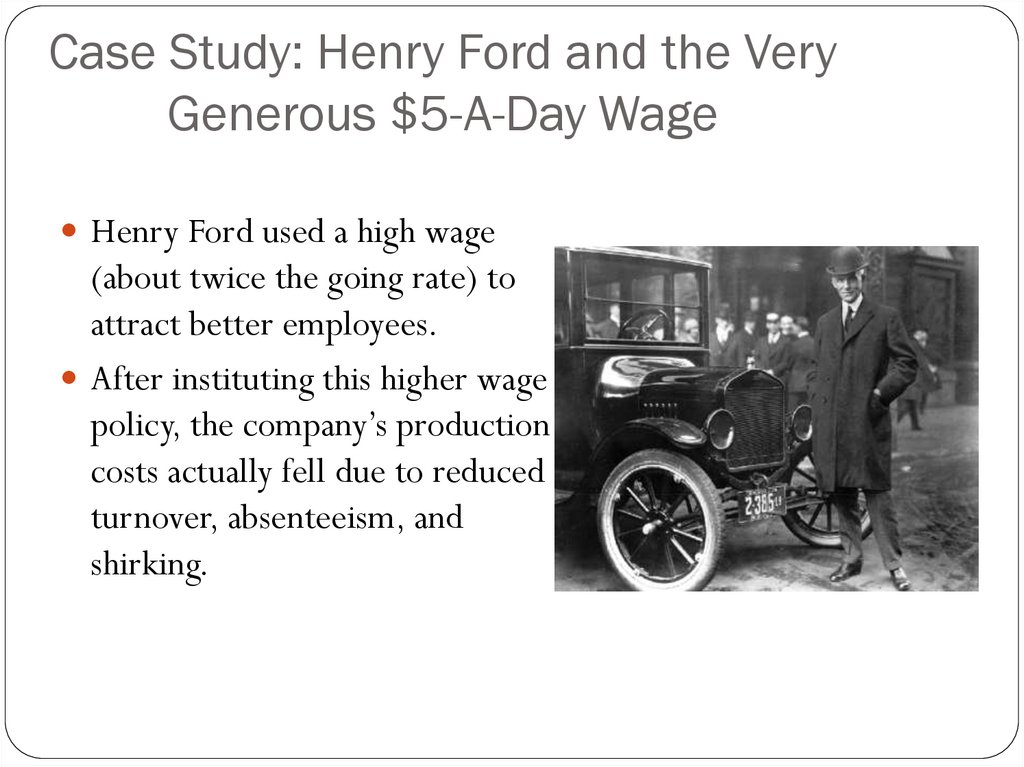
Case Study: Henry Ford and the VeryGenerous $5-A-Day Wage
Henry Ford used a high wage
(about twice the going rate) to
attract better employees.
After instituting this higher wage
policy, the company’s production
costs actually fell due to reduced
turnover, absenteeism, and
shirking.
85.
UnemploymentHigh rates of unemployment can cause a personal loss of
self-confidence, crime, the breakup of families, and
suicide.
There are also losses to output and income.
Economists, including the late Arthur Okun, have
estimated that for every one percentage point increase in
the unemployment rate above the natural rate, output falls
by 2 to 3 percentage points. This is called Okun’s law.
86.
87.
Inflation and CPI88.
Consumer Price IndexConsumer Price Index – (CPI) measure of the overall
cost of the goods and services bought by a typical consumer
The basis of cost of living adjustments (COLAs) in many
contracts and in Social Security.
89.
How the Consumer Price Index iscalculated
1) Fix the basket
The Bureau of Labor Statistics uses surveys to determine a
representative bundle of goods and services purchased by a
typical consumer
Example: 4 hot dogs and 2 hamburgers
2) Find the prices
Prices for each of the goods and services in the basket must be
determined for each time period
90.
How the Consumer Price Index iscalculated
Year
Price of Hot
Dogs
Price of
Hamburgers
2011
$1
$2
2012
$2
$3
2013
$3
$4
91.
How the Consumer Price Index iscalculated
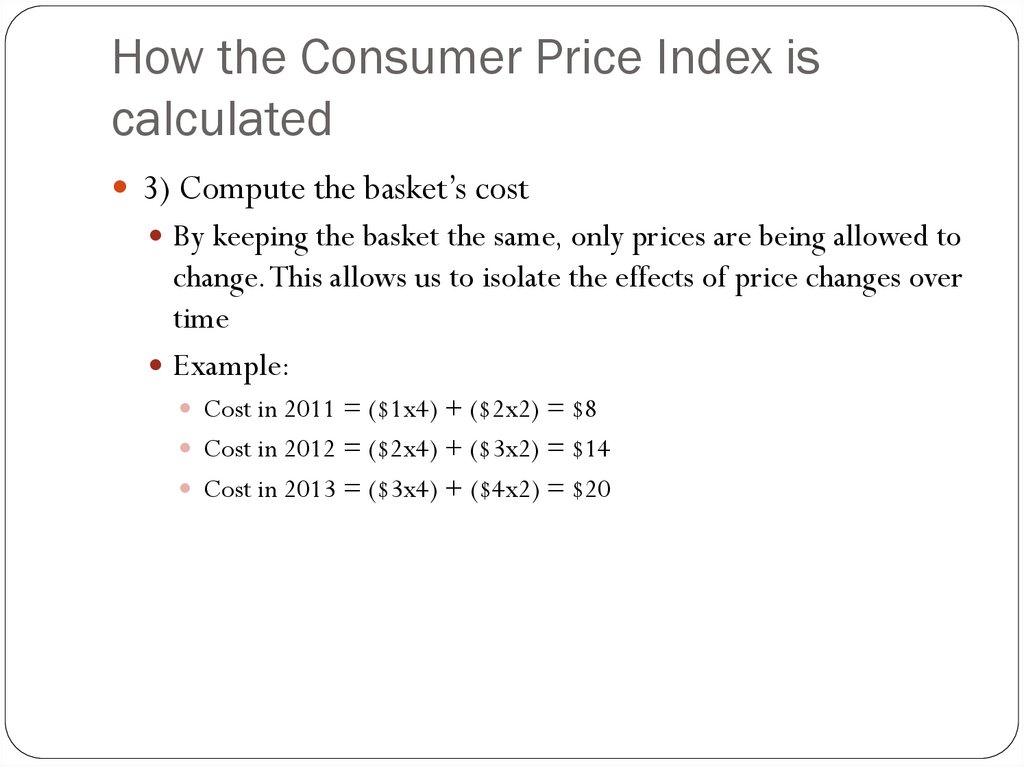
3) Compute the basket’s cost
By keeping the basket the same, only prices are being allowed to
change. This allows us to isolate the effects of price changes over
time
Example:
Cost in 2011 = ($1x4) + ($2x2) = $8
Cost in 2012 = ($2x4) + ($3x2) = $14
Cost in 2013 = ($3x4) + ($4x2) = $20
92.
How the Consumer Price Index iscalculated
4) Choose a base year and compute the index.
The base year is the benchmark against which other years are
compared
The formula for calculating the price index is:
CPI = (cost of basket in current year/cost of basket in base
year) x 100
Example (using 2011 as the base year):
CPI for 2011 = ($8)/($8) x 100 = 100
CPI for 2012 = ($14)/($8) x 100 = 175
CPI for 2013 = ($20)/($8) x 100 = 250
93.
How the Consumer Price Index iscalculated
5) Compute the inflation rate
Inflation rate: the percentage change in the price index from
the preceding period
The formula used to calculate the inflation rate is:
Inflation rate = [(CPIyear2 – CPIyear1)/CPIyear1] x 100%
Example:
Inflation rate for 2012 = (175-100)/100 x 100% = 75%
Inflation rate for 2013 = (250-175)/175 x 100% = 43%
94.
EXAMPLEyear
2013
2014
2015
basket: {4 pizzas, 10 lattes}
price of price of
pizza
latte
$10
$2.00
$11
$2.50
$12
$3.00
cost of basket
$10 x 4 + $2 x 10 = $60
$11 x 4 + $2.5 x10 = $69
$12 x 4 + $3 x 10 = $78
Compute CPI in each year:
Inflation rate:
2003: 100 x ($60/$60) = 100
15%
2004: 100 x ($69/$60) = 115
13%
2005: 100 x ($78/$60) = 130
95.
A C T I V E L E A R N I N G 1:Calculate the CPI
The basket contains
20 movie tickets
and 10 textbooks.
The table shows their prices
for 2004-2006.
The base year is 2004.
2004
2005
2006
movie
tickets
$10
$10
$12
textbooks
$50
$60
$60
A. How much did the basket cost in
2004?
B. What is the CPI in 2005?
C. What is the inflation rate from 2005-
2006?
95
96.
A C T I V E L E A R N I N G 1:Answers
The basket contains
20 movie tickets
and 10 textbooks.
A. How much
2004
2005
2006
movie
tickets
$10
$10
$12
textbooks
$50
$60
$60
did the
basket cost
in 2004?
($10 x 20) + ($50 x 10) = $700
96
97.
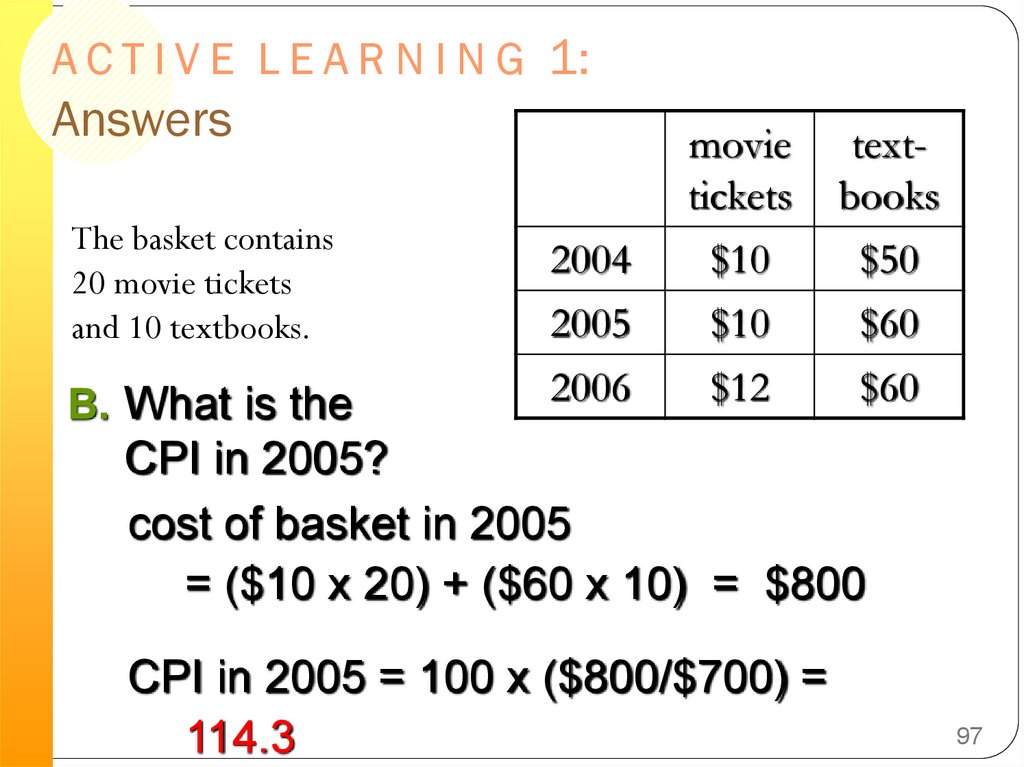
A C T I V E L E A R N I N G 1:Answers
The basket contains
20 movie tickets
and 10 textbooks.
B. What is the
2004
2005
2006
movie
tickets
$10
$10
$12
textbooks
$50
$60
$60
CPI in 2005?
cost of basket in 2005
= ($10 x 20) + ($60 x 10) = $800
CPI in 2005 = 100 x ($800/$700) =
114.3
97
98.
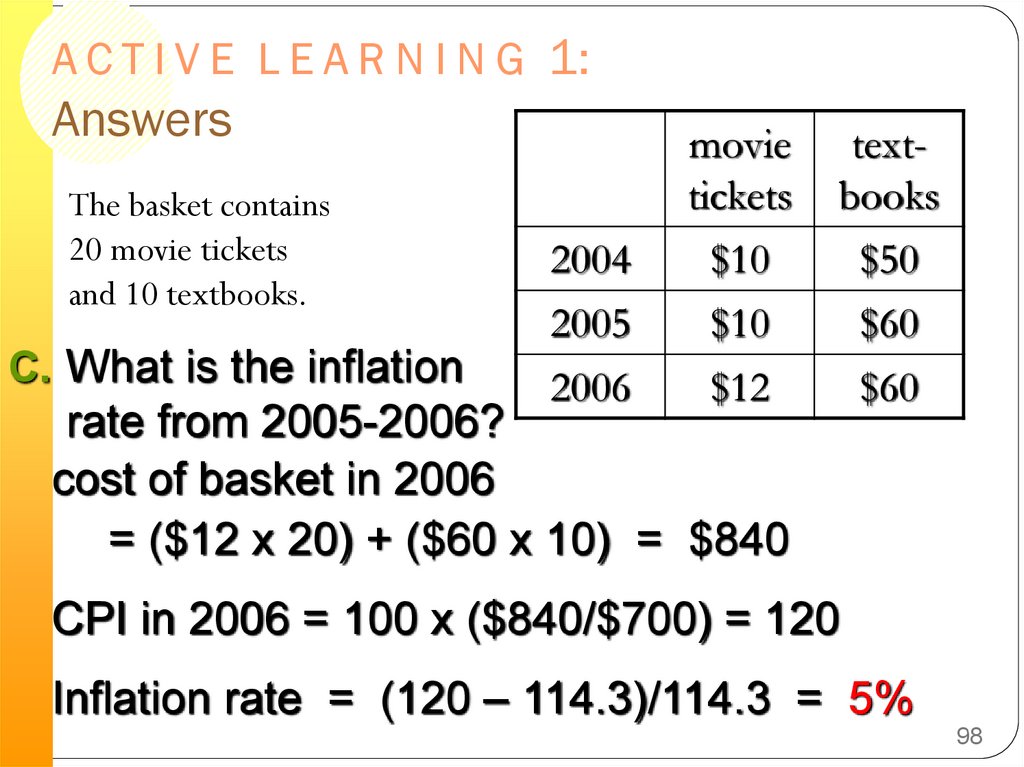
A C T I V E L E A R N I N G 1:Answers
The basket contains
20 movie tickets
and 10 textbooks.
C. What is the inflation
2004
2005
2006
movie
tickets
$10
$10
$12
rate from 2005-2006?
cost of basket in 2006
= ($12 x 20) + ($60 x 10) = $840
textbooks
$50
$60
$60
CPI in 2006 = 100 x ($840/$700) = 120
Inflation rate = (120 – 114.3)/114.3 = 5%
98
99.
What is in the CPI’s Basket?Housing 41%
Transportation 17%
Food and Beverages 16%
Education and Communication 6%
Medical Care 6%
Recreation 6%
Apparel 4%
Other goods and services 4%
100.
What’s in the CPI’s Basket?4%
4%
Housing
6%
Transportation
6%
Food & Beverages
42%
6%
Medical care
Recreation
Education and
communication
Apparel
15%
17%
Other
101.
In the News: Shopping for the CPIThere are approximately 300 employees of the Bureau of
Labor Statistics who gather information on prices
102.
The Producer Price IndexProducer Price Index – a measure of the cost of a basket
of goods and services bought by firms
Because firms eventually pass on higher costs to consumers in
the form of higher prices on products, the producer price
index is believed to be helpful in predicting changes in the
CPI
103.
Problems in Measuring the Cost ofLiving
Substitution Bias
When the price of one good changes, consumers often respond
by substituting another good in its place
The CPI does not allow for this substitution; it is calculated
using a fixed basket of goods and services
This implies that the CPI overstates the increase in the cost of
living over time
104.
Problems in Measuring the Cost of LivingIntroduction of New Goods
When a new good is introduced,
consumers have a wider variety of goods
and services to choose from
This makes every dollar more valuable,
which means that there is an increase in
the purchasing power of the dollar
Because the market basket is not revised
often enough, these new goods are left
out of the bundle of goods and services
included in the basket.
105.
Problems in Measuring the Cost ofLiving
Unmeasured Quality Change
If the quality of a good falls from one year to the next, the value
of a dollar falls; if quality rises, the value of the dollar rises
Attempts are made to correct prices for changes in quality, but
it is often difficult to do so because quality is hard to measure
106.
Problems in Measuring the Cost ofLiving
The size of these problems is also difficult to measure
Most studies indicate that the CPI overstates the rate of
inflation by approximately 1 percentage point per year
The issue is important because many government transfer
programs (such as Social Security) are tied to increases in
CPI
107.
The GDP Deflator versus the ConsumerPrice Index
The GDP Deflator reflects the prices of all goods
produced domestically, while the CPI reflects the prices
of all goods bought by consumers
The CPI compares the prices of a fixed basket of goods
over time, while the GDP deflator compares the prices
of the goods currently produced to the prices of the
goods produced in the base year. This means that the
group of goods and services used to compute the GDP
deflator changes automatically over time as output
changes.
108.
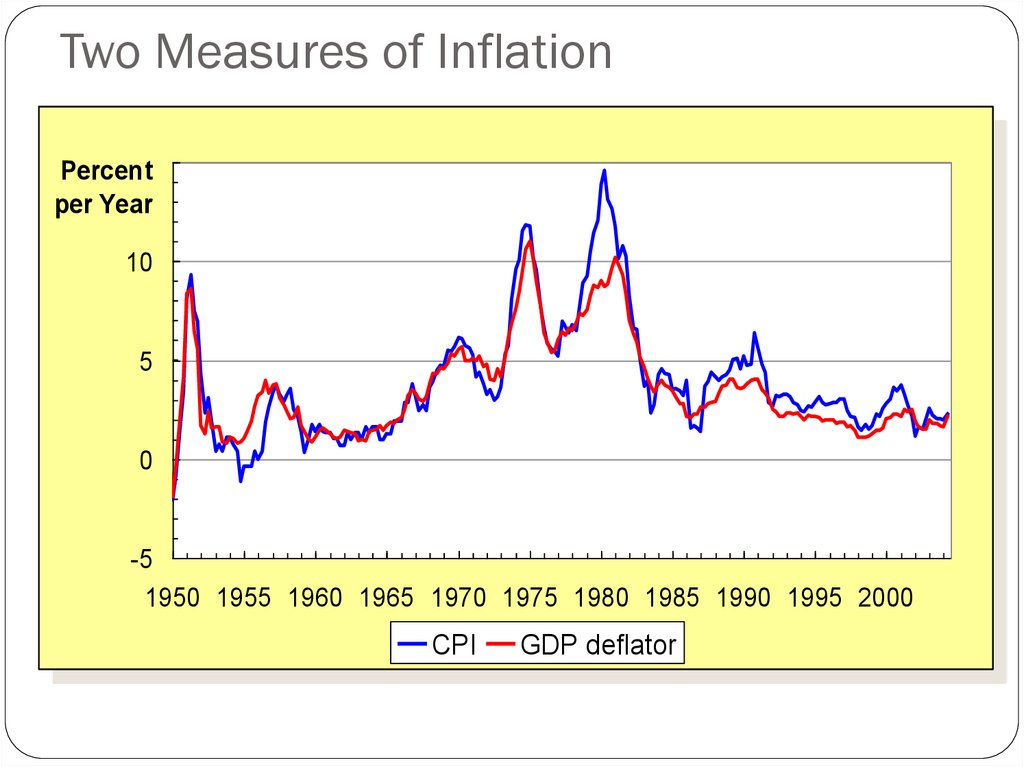
Two Measures of Inflation15
Percent
per Year
10
5
0
-5
1950 1955 1960 1965 1970 1975 1980 1985 1990 1995 2000
CPI
GDP deflator
109.
Contrasting the CPI and GDP DeflatorImported consumer goods:
included in CPI
excluded from GDP deflator
Capital goods:
excluded from CPI
included in GDP deflator (if
produced domestically)
The basket:
CPI uses fixed basket
GDP deflator uses basket of
currently produced goods & services
This matters if different prices are
changing by different amounts.
110.
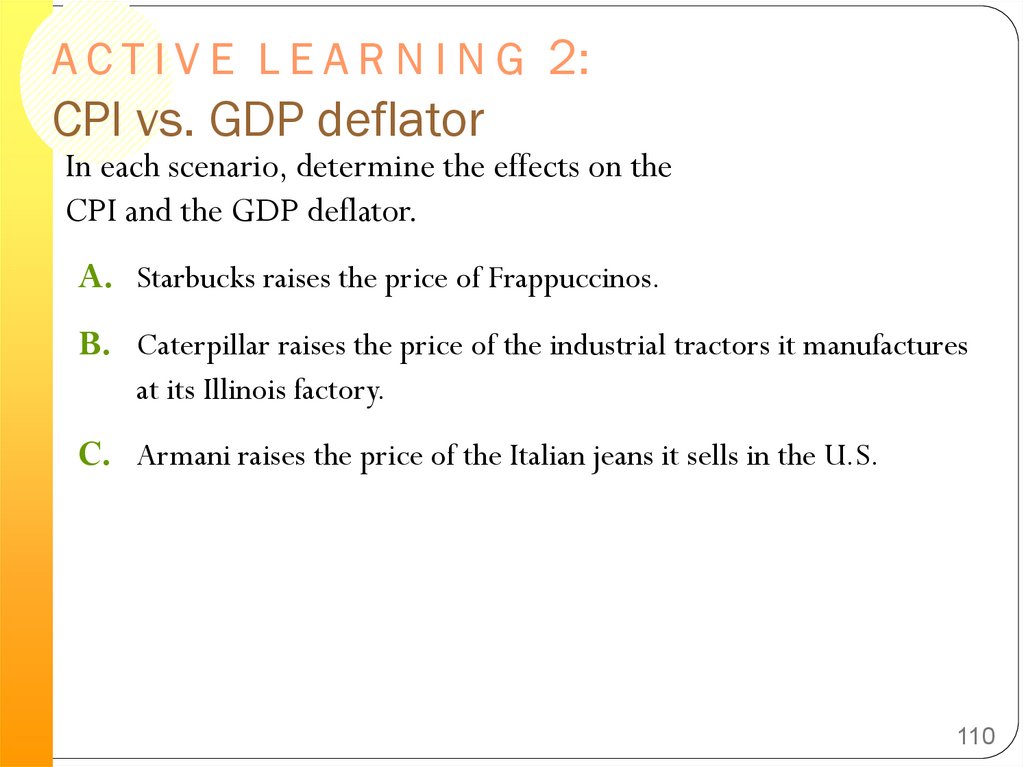
A C T I V E L E A R N I N G 2:CPI vs. GDP deflator
In each scenario, determine the effects on the
CPI and the GDP deflator.
A. Starbucks raises the price of Frappuccinos.
B. Caterpillar raises the price of the industrial tractors it manufactures
at its Illinois factory.
C. Armani raises the price of the Italian jeans it sells in the U.S.
110
111.
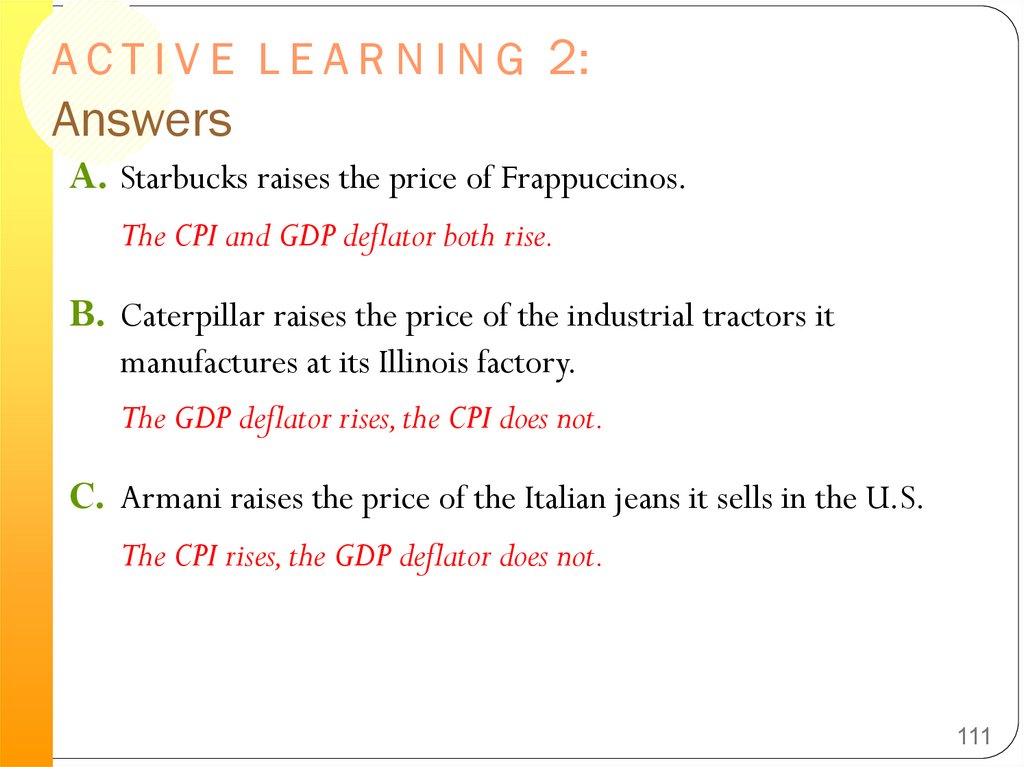
A C T I V E L E A R N I N G 2:Answers
A. Starbucks raises the price of Frappuccinos.
The CPI and GDP deflator both rise.
B. Caterpillar raises the price of the industrial tractors it
manufactures at its Illinois factory.
The GDP deflator rises, the CPI does not.
C. Armani raises the price of the Italian jeans it sells in the U.S.
The CPI rises, the GDP deflator does not.
111
112.
Correcting Economic Variables for theEffects of Inflation
Inflation makes it harder to compare dollar amounts from
different times.
We can use the CPI to adjust figures so that they can be
compared.
Dollar Figures from Different Times
To change dollar values from one year to the next, we can use this
formula:
Value in Year 2 dollars = value in year 1 dollars x (price level in year
2/price level in year1)
Example: Babe Ruth’s 1931 salary in 1999 dollars:
Salary in 1931 = $80,000; CPI in 1931 = 15.2; CPI in 2001 = 177
Salary in 2001 dollars = $80,000 x (177/15.2)
Salary in 2001 dollars = $931,579
113.
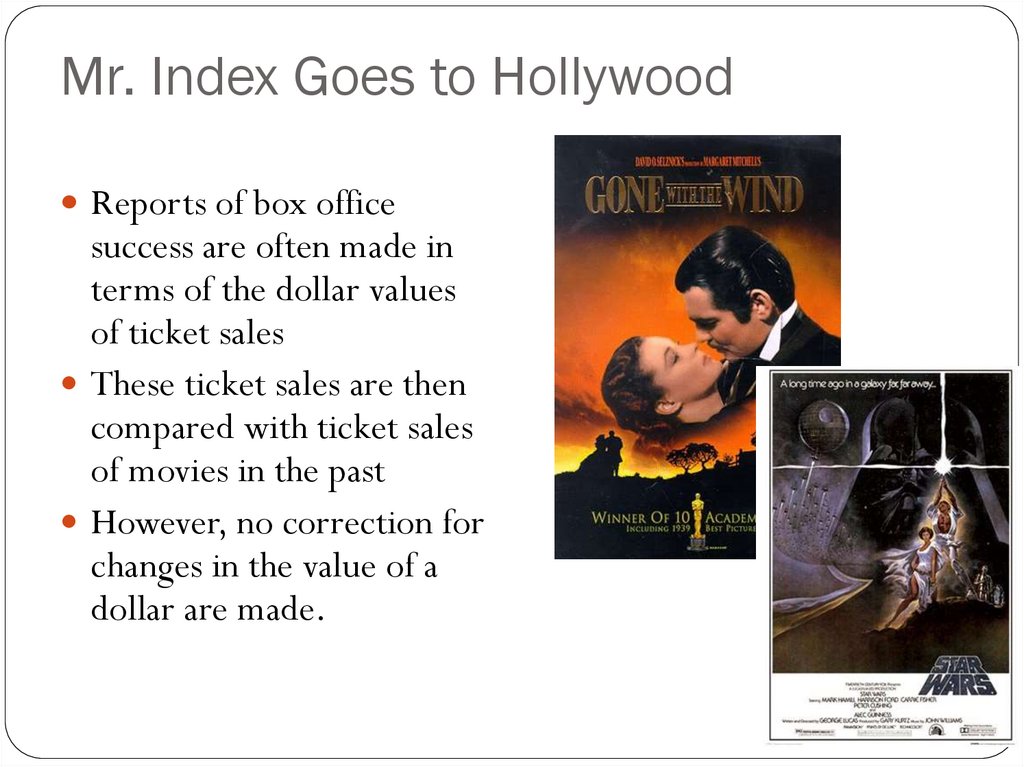
Mr. Index Goes to HollywoodReports of box office
success are often made in
terms of the dollar values
of ticket sales
These ticket sales are then
compared with ticket sales
of movies in the past
However, no correction for
changes in the value of a
dollar are made.
114.
The Most Popular Movies of All Time,Inflation Adjusted
Film
Year of Release
Total Domestic Gross
(millions 2001 dollars)
Gone with the Wind
1939
$1,002
Star Wars
1977
866
The Sound of Music
1965
695
E.T.
1982
687
Titanic
1997
640
The Ten Commandments 1956
639
Jaws
1975
625
Doctor Zhivago
1965
591
The Jungle Book
1967
519
Snow White and the
Seven Dwarfs
1937
518
http://boxofficemojo.com/alltime/adjusted.htm
115.
A C T I V E L E A R N I N G 3:Exercise
1980: CPI = 90,
avg starting salary for econ majors = $24,000
Today: CPI = 180,
avg starting salary for econ majors = $50,000
Are econ majors better off today or in 1980?
115
116.
A C T I V E L E A R N I N G 3:Answers
1980: CPI = 90,
avg starting salary for econ majors = $24,000
Today: CPI = 180,
avg starting salary for econ majors = $50,000
Solution
Convert 1980 salary into “today’s dollars”
$24,000 x (180/90) = $48,000.
After adjusting for inflation, salary is higher
today than in 1980.
116
117.
IndexationIndexation – the automatic correction of a dollar
amount for the effects of inflation by law or contract.
As mentioned above, many government transfer
programs use indexation for the benefits. The
government also indexes the tax brackets used for
federal income tax.
There are uses of indexation in the private sector as well.
Many labor contracts include Cost-of-Living Allowances
(COLAs).
118.
Real And Nominal Interest RatesNominal interest rate – the interest rate as usually
reported without a correction for the effects of inflation.
Real interest rate – the interest rate corrected for the
effects of inflation.
Equation: Real interest rate = nominal interest rate –
inflation rate
119.
Real and Nominal Interest Rates in the U.S.Interest Rates
(percent per year)
15
10
5
0
-5
-10
1950 1955 1960 1965 1970 1975 1980 1985 1990 1995 2000
Nominal interest rate
Real interest rate
120.
Nominal and Real Interest RateSuppose a student has $100 in his savings account
earning 3 percent interest. What is the real interest rate
if prices rise 3 percent during the year?
Real interest rate = nominal interest rate – inflation rate
Real interest rate = 3-3 = 0
What if the inflation rate was 5 percent?
Real interest rate = 3-5 = -2
What if the inflation rate was 1 percent?
Real interest rate = 3-1 = 2
121.
Inflation / Money IllusionIf all prices, wages, salaries, rents, and so forth increase by the same
percentage, the real effects of inflation might be minimal.
For example, suppose Ted’s salary is $10 per day and he uses it to buy a
pizza for $6 and two mochas for $2 each. With inflation at the rate of
100 percent per day, all prices and salaries are doubled by the next day.
Ted earns $20, pizzas cost $12 and mochas cost $4. In economic
terms, Ted’s nominal salary (the actual number of dollars) has
increased, but his real salary (the purchasing power of the dollars) has
remained the same.
There should be no real effect because Ted can still purchase exactly
what he did before with his salary – one pizza and two mochas.
If Ted notes the increase in his salary but does not notice the similar
increase in all prices, he might think he is better off.
This is called the money illusion – and can lead to excessive spending.