

 Маркетинг
Похожие презентации:


")


Decision Making under Uncertainty
1.
Chapter 6Decision Making under Uncertainty
© 2017 Cengage Learning. All Rights Reserved. May not be scanned, copied or duplicated, or posted to a publicly accessible website, in whole or in part.
2.
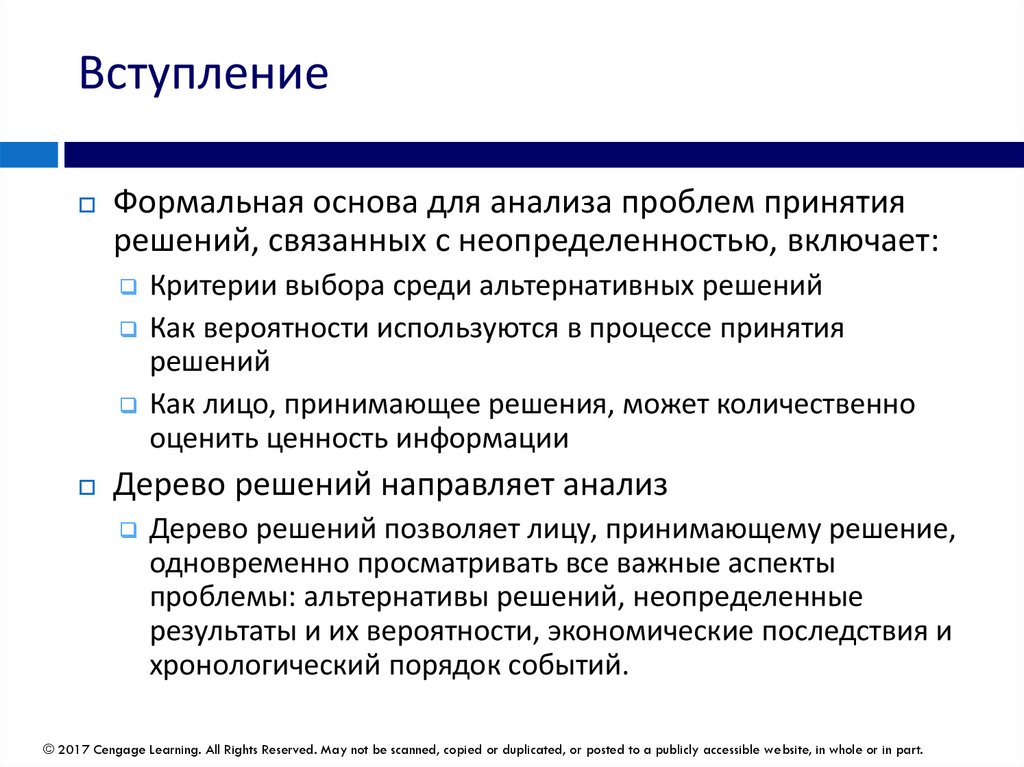
ВступлениеФормальная основа для анализа проблем принятия
решений, связанных с неопределенностью, включает:
Критерии выбора среди альтернативных решений
Как вероятности используются в процессе принятия
решений
Как лицо, принимающее решения, может количественно
оценить ценность информации
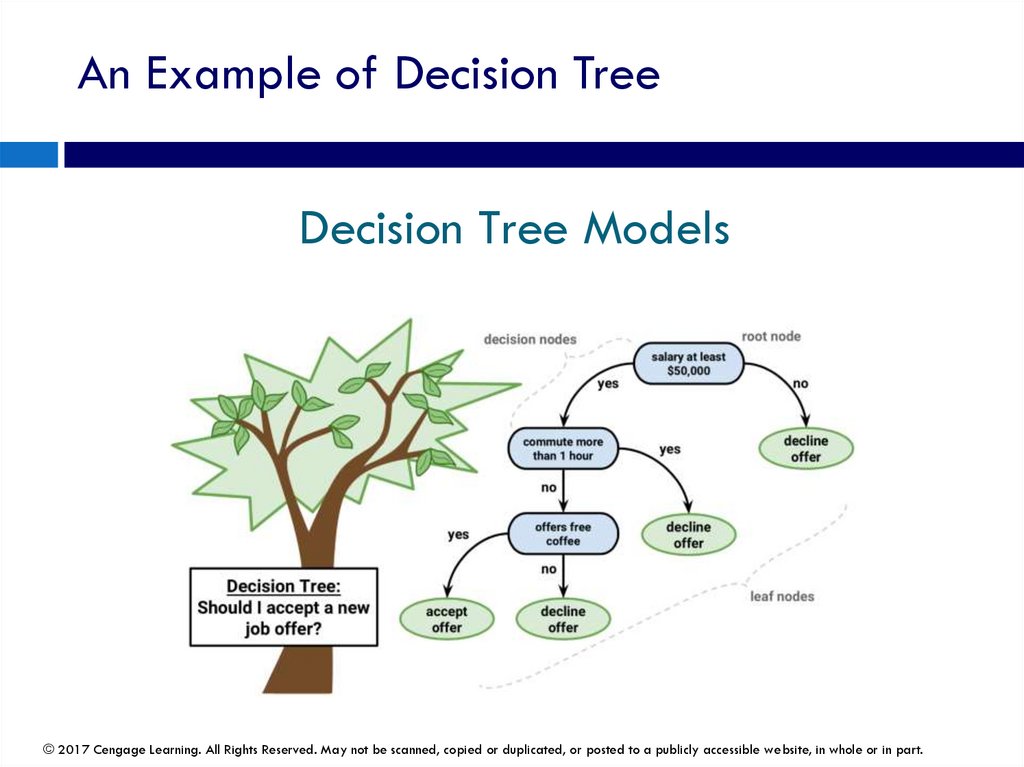
Дерево решений направляет анализ
Дерево решений позволяет лицу, принимающему решение,
одновременно просматривать все важные аспекты
проблемы: альтернативы решений, неопределенные
результаты и их вероятности, экономические последствия и
хронологический порядок событий.
© 2017 Cengage Learning. All Rights Reserved. May not be scanned, copied or duplicated, or posted to a publicly accessible website, in whole or in part.
3.
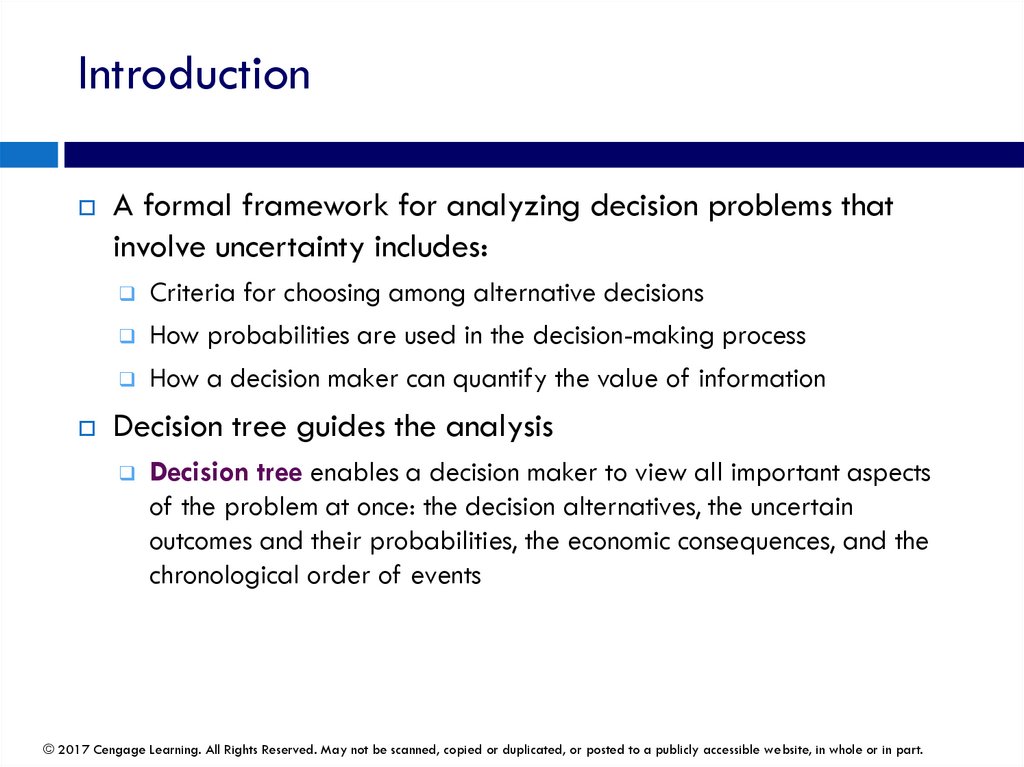
IntroductionA formal framework for analyzing decision problems that
involve uncertainty includes:
Criteria for choosing among alternative decisions
How probabilities are used in the decision-making process
How a decision maker can quantify the value of information
Decision tree guides the analysis
Decision tree enables a decision maker to view all important aspects
of the problem at once: the decision alternatives, the uncertain
outcomes and their probabilities, the economic consequences, and the
chronological order of events
© 2017 Cengage Learning. All Rights Reserved. May not be scanned, copied or duplicated, or posted to a publicly accessible website, in whole or in part.
4.
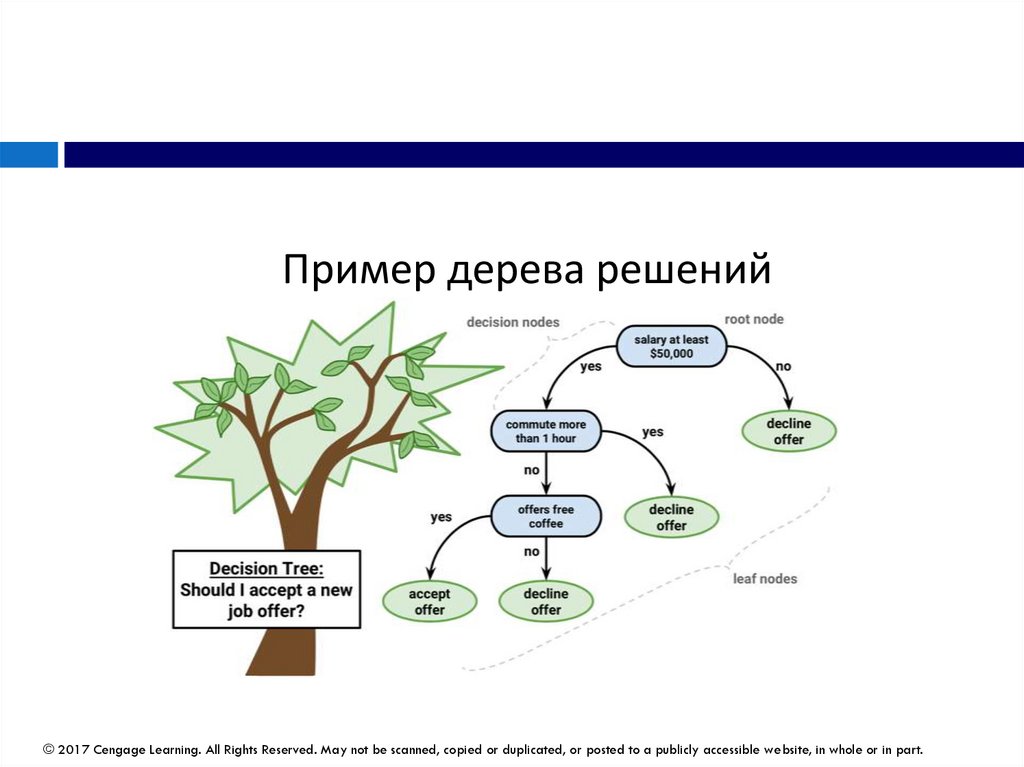
Пример дерева решений© 2017 Cengage Learning. All Rights Reserved. May not be scanned, copied or duplicated, or posted to a publicly accessible website, in whole or in part.
5.
An Example of Decision TreeDecision Tree Models
© 2017 Cengage Learning. All Rights Reserved. May not be scanned, copied or duplicated, or posted to a publicly accessible website, in whole or in part.
6.
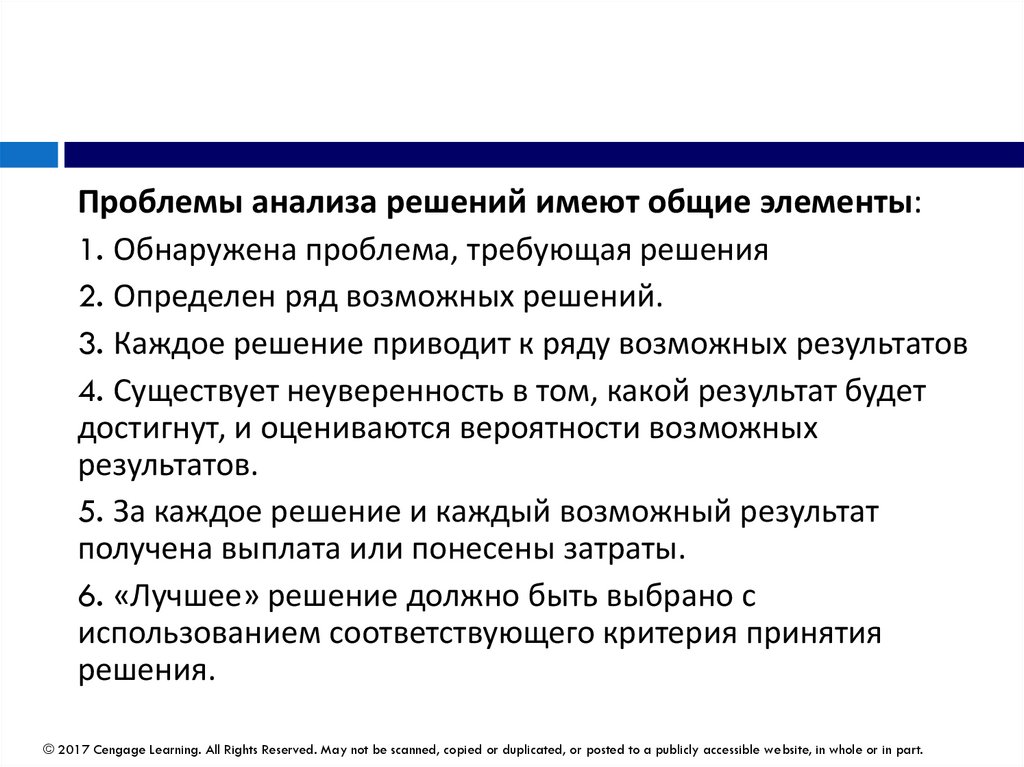
Проблемы анализа решений имеют общие элементы:1. Обнаружена проблема, требующая решения
2. Определен ряд возможных решений.
3. Каждое решение приводит к ряду возможных результатов
4. Существует неуверенность в том, какой результат будет
достигнут, и оцениваются вероятности возможных
результатов.
5. За каждое решение и каждый возможный результат
получена выплата или понесены затраты.
6. «Лучшее» решение должно быть выбрано с
использованием соответствующего критерия принятия
решения.
© 2017 Cengage Learning. All Rights Reserved. May not be scanned, copied or duplicated, or posted to a publicly accessible website, in whole or in part.
7.
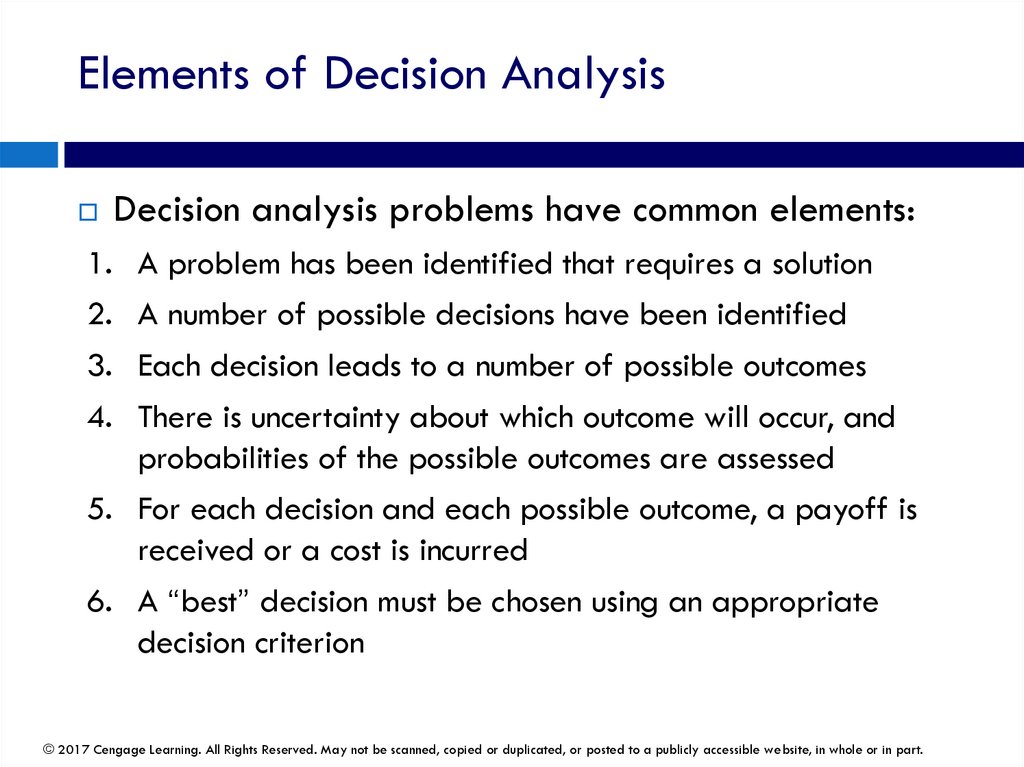
Elements of Decision AnalysisDecision analysis problems have common elements:
1.
2.
3.
4.
A problem has been identified that requires a solution
A number of possible decisions have been identified
Each decision leads to a number of possible outcomes
There is uncertainty about which outcome will occur, and
probabilities of the possible outcomes are assessed
5. For each decision and each possible outcome, a payoff is
received or a cost is incurred
6. A “best” decision must be chosen using an appropriate
decision criterion
© 2017 Cengage Learning. All Rights Reserved. May not be scanned, copied or duplicated, or posted to a publicly accessible website, in whole or in part.
8.
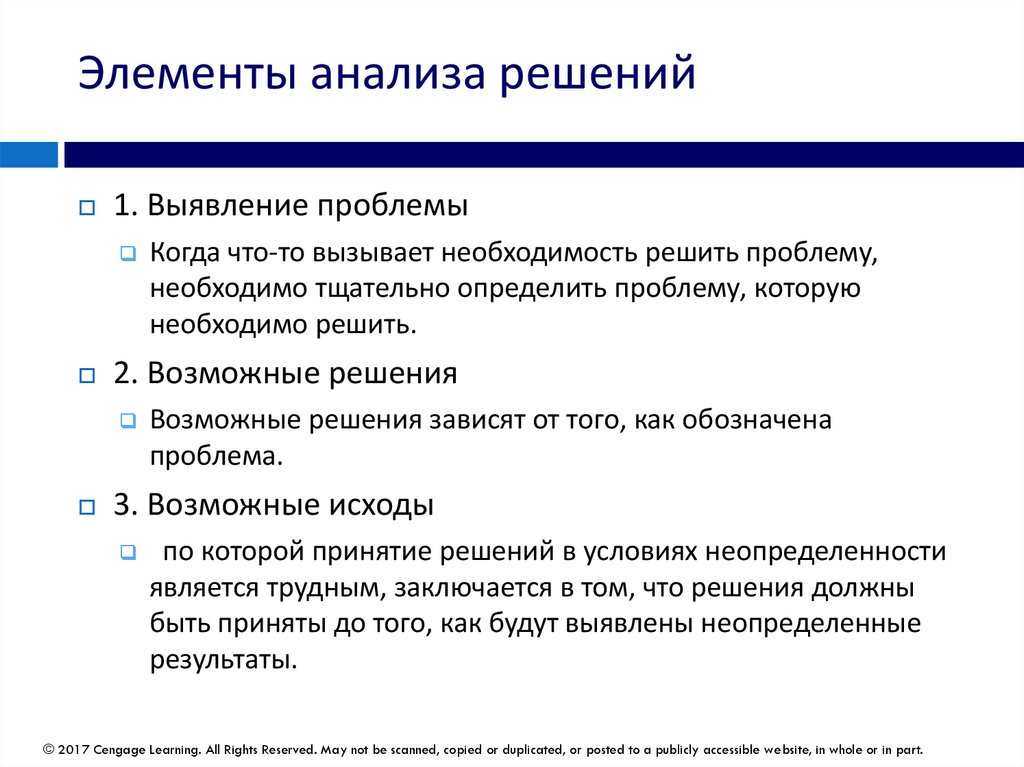
Элементы анализа решений1. Выявление проблемы
Когда что-то вызывает необходимость решить проблему,
необходимо тщательно определить проблему, которую
необходимо решить.
2. Возможные решения
Возможные решения зависят от того, как обозначена
проблема.
3. Возможные исходы
по которой принятие решений в условиях неопределенности
является трудным, заключается в том, что решения должны
быть приняты до того, как будут выявлены неопределенные
результаты.
© 2017 Cengage Learning. All Rights Reserved. May not be scanned, copied or duplicated, or posted to a publicly accessible website, in whole or in part.
9.
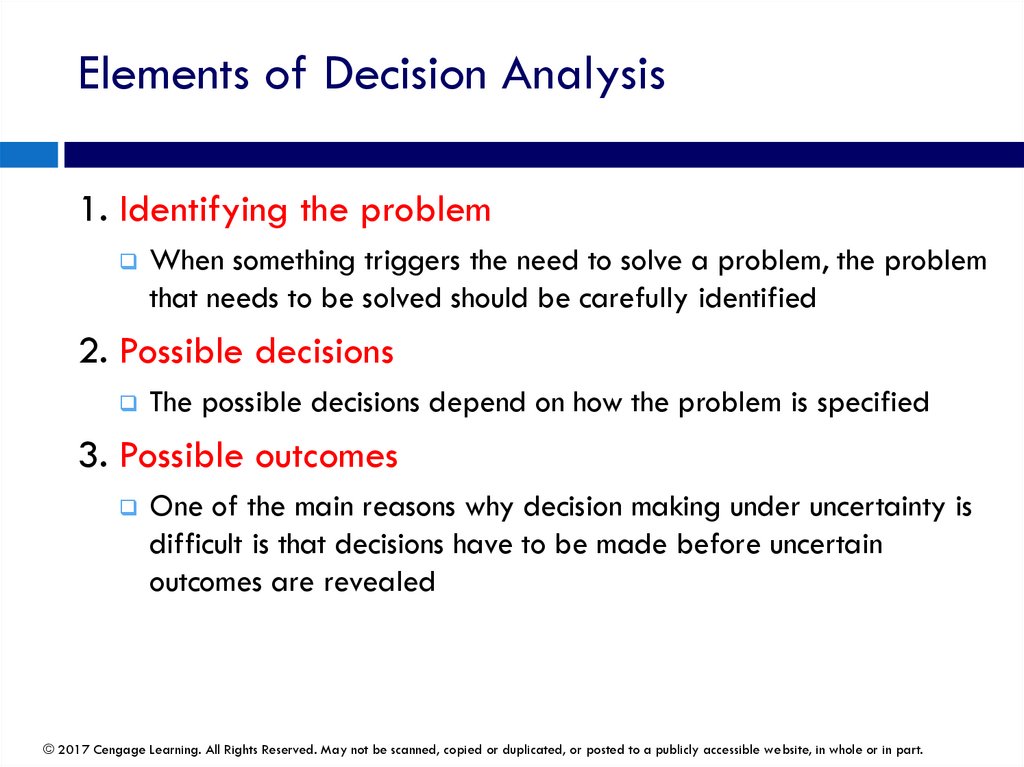
Elements of Decision Analysis1. Identifying the problem
When something triggers the need to solve a problem, the problem
that needs to be solved should be carefully identified
2. Possible decisions
The possible decisions depend on how the problem is specified
3. Possible outcomes
One of the main reasons why decision making under uncertainty is
difficult is that decisions have to be made before uncertain
outcomes are revealed
© 2017 Cengage Learning. All Rights Reserved. May not be scanned, copied or duplicated, or posted to a publicly accessible website, in whole or in part.
10.
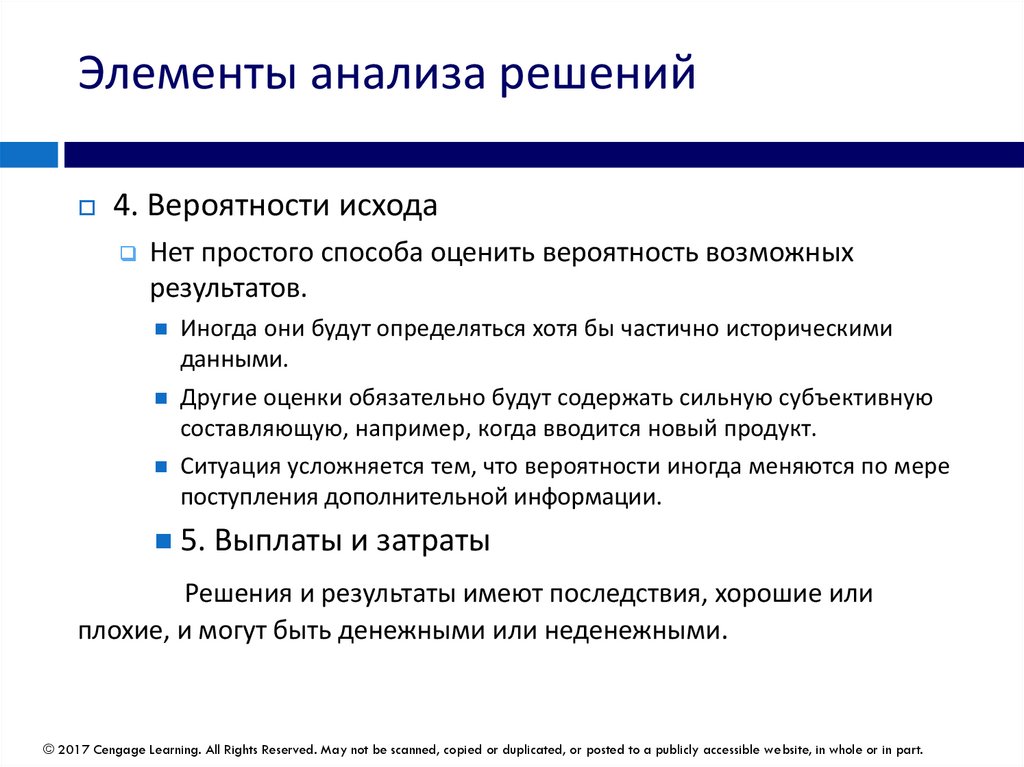
Элементы анализа решений4. Вероятности исхода
Нет простого способа оценить вероятность возможных
результатов.
Иногда они будут определяться хотя бы частично историческими
данными.
Другие оценки обязательно будут содержать сильную субъективную
составляющую, например, когда вводится новый продукт.
Ситуация усложняется тем, что вероятности иногда меняются по мере
поступления дополнительной информации.
5. Выплаты и затраты
Решения и результаты имеют последствия, хорошие или
плохие, и могут быть денежными или неденежными.
© 2017 Cengage Learning. All Rights Reserved. May not be scanned, copied or duplicated, or posted to a publicly accessible website, in whole or in part.
11.
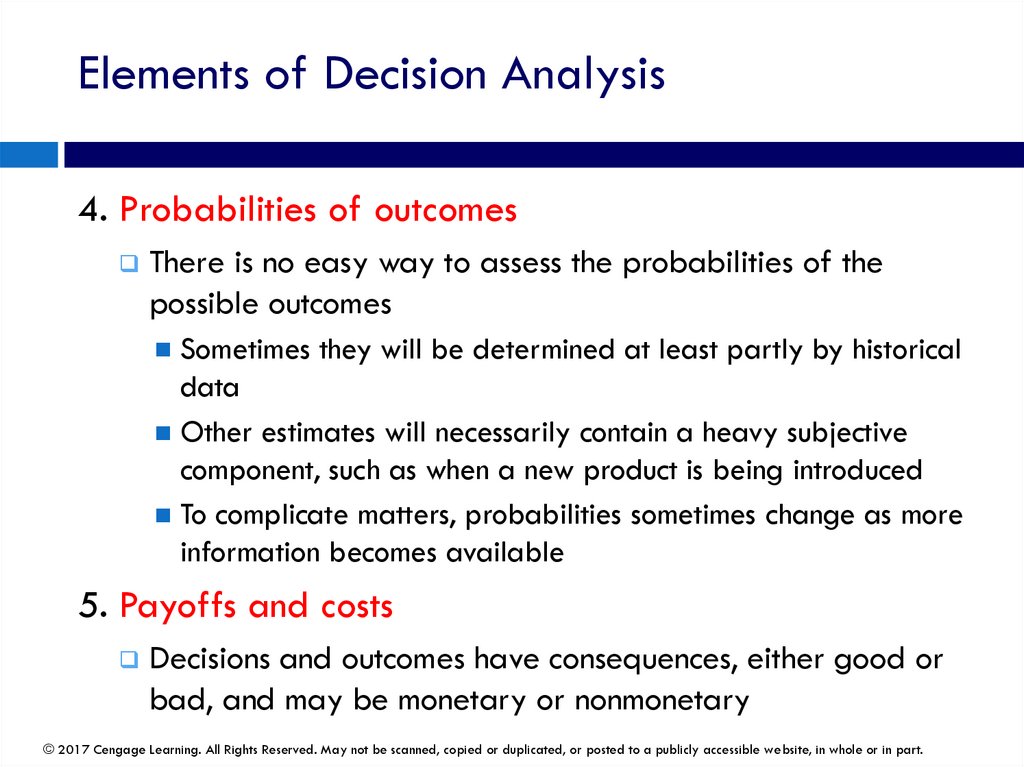
Elements of Decision Analysis4. Probabilities of outcomes
There is no easy way to assess the probabilities of the
possible outcomes
Sometimes they will be determined at least partly by historical
data
Other estimates will necessarily contain a heavy subjective
component, such as when a new product is being introduced
To complicate matters, probabilities sometimes change as more
information becomes available
5. Payoffs and costs
Decisions and outcomes have consequences, either good or
bad, and may be monetary or nonmonetary
© 2017 Cengage Learning. All Rights Reserved. May not be scanned, copied or duplicated, or posted to a publicly accessible website, in whole or in part.
12.
Критерии принятия решенияПосмотрите на наилучший возможный
результат для каждого решения и выберите
решение, которое имеет наилучшие из них.
© 2017 Cengage Learning. All Rights Reserved. May not be scanned, copied or duplicated, or posted to a publicly accessible website, in whole or in part.
13.
Decision CriteriaLook at the best possible outcome for each decision
and choose the decision that has the best of these
© 2017 Cengage Learning. All Rights Reserved. May not be scanned, copied or duplicated, or posted to a publicly accessible website, in whole or in part.
14.
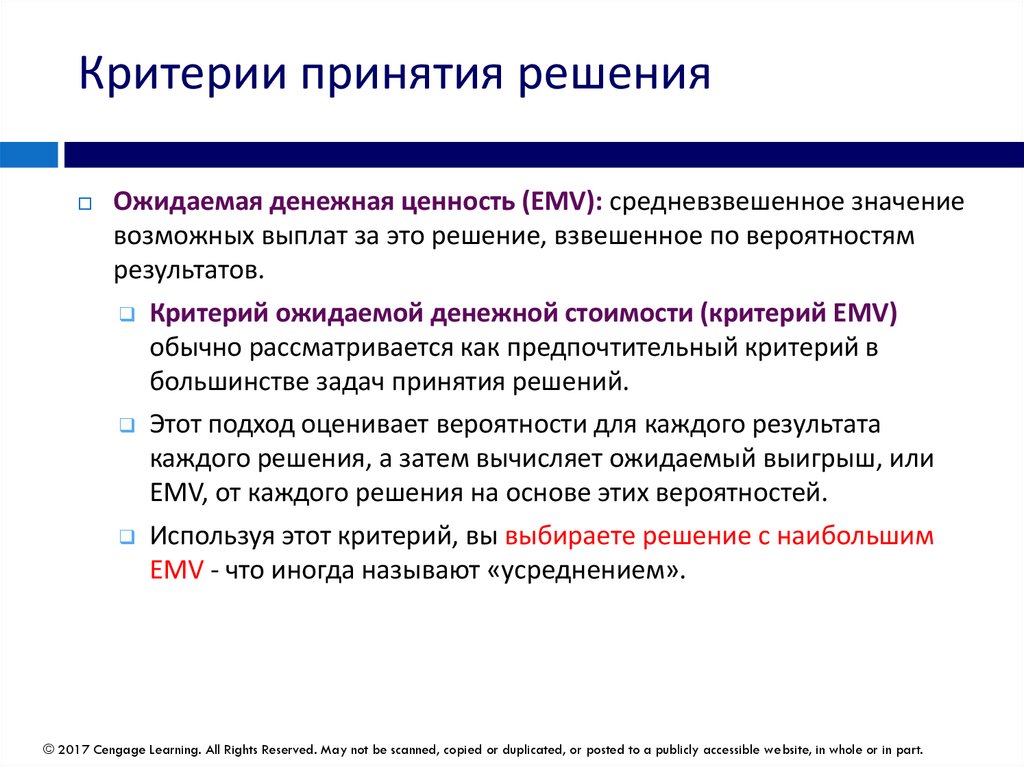
Критерии принятия решенияОжидаемая денежная ценность (EMV): средневзвешенное значение
возможных выплат за это решение, взвешенное по вероятностям
результатов.
Критерий ожидаемой денежной стоимости (критерий EMV)
обычно рассматривается как предпочтительный критерий в
большинстве задач принятия решений.
Этот подход оценивает вероятности для каждого результата
каждого решения, а затем вычисляет ожидаемый выигрыш, или
EMV, от каждого решения на основе этих вероятностей.
Используя этот критерий, вы выбираете решение с наибольшим
EMV - что иногда называют «усреднением».
© 2017 Cengage Learning. All Rights Reserved. May not be scanned, copied or duplicated, or posted to a publicly accessible website, in whole or in part.
15.
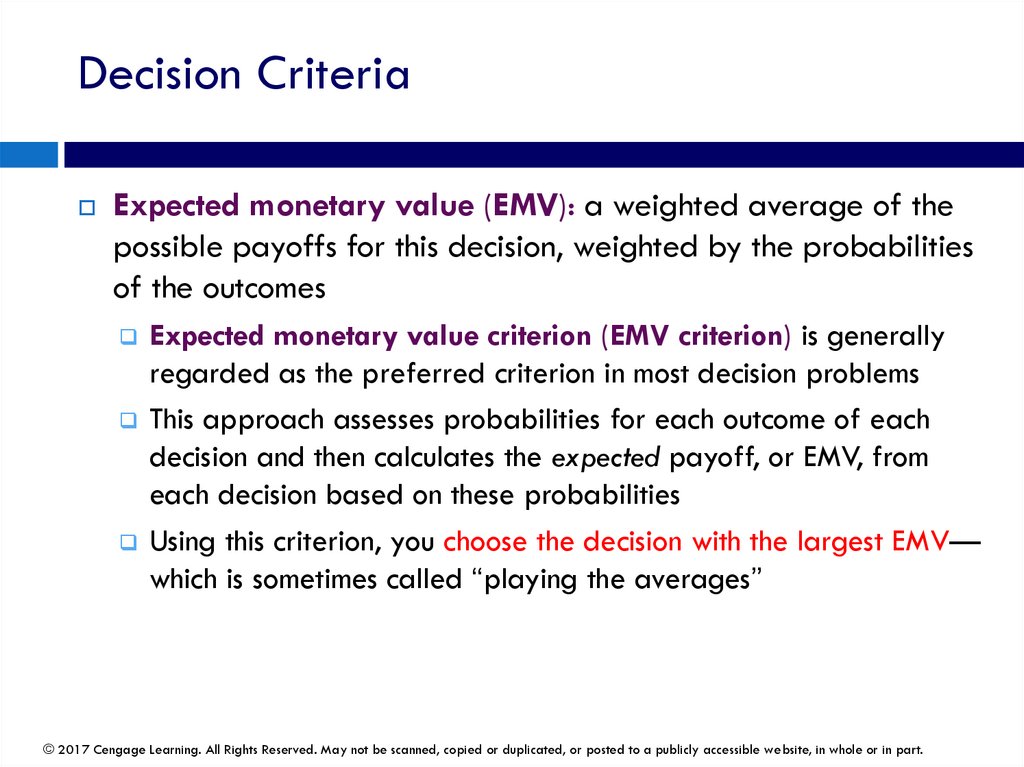
Decision CriteriaExpected monetary value (EMV): a weighted average of the
possible payoffs for this decision, weighted by the probabilities
of the outcomes
Expected monetary value criterion (EMV criterion) is generally
regarded as the preferred criterion in most decision problems
This approach assesses probabilities for each outcome of each
decision and then calculates the expected payoff, or EMV, from
each decision based on these probabilities
Using this criterion, you choose the decision with the largest EMV—
which is sometimes called “playing the averages”
© 2017 Cengage Learning. All Rights Reserved. May not be scanned, copied or duplicated, or posted to a publicly accessible website, in whole or in part.
16.
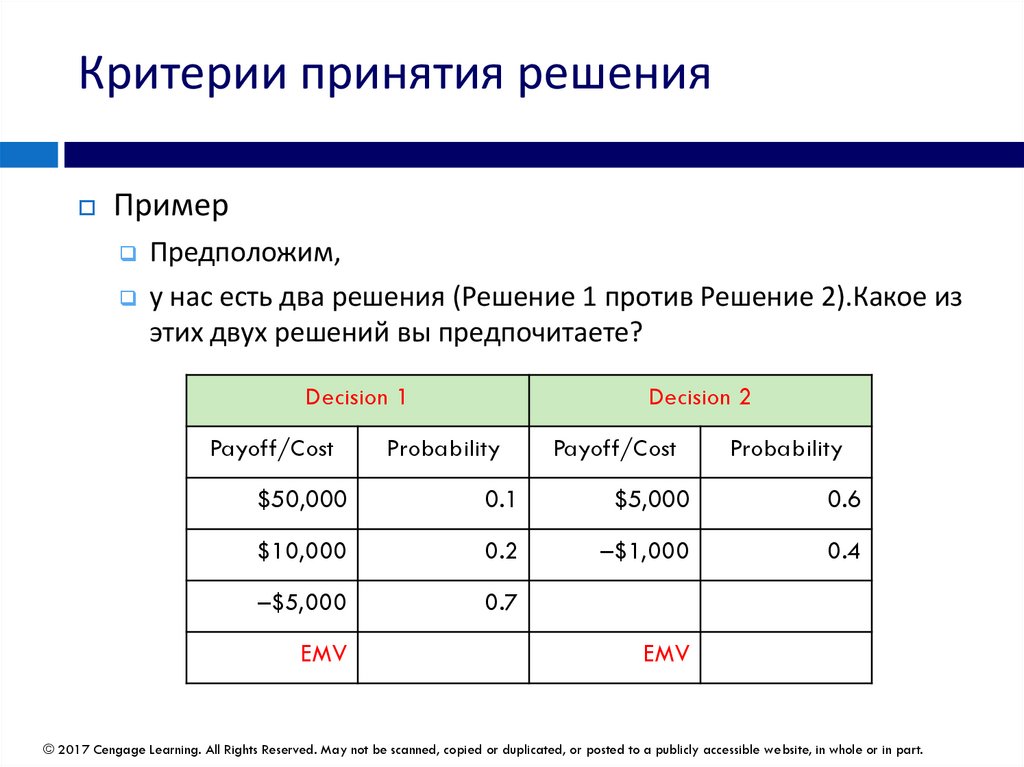
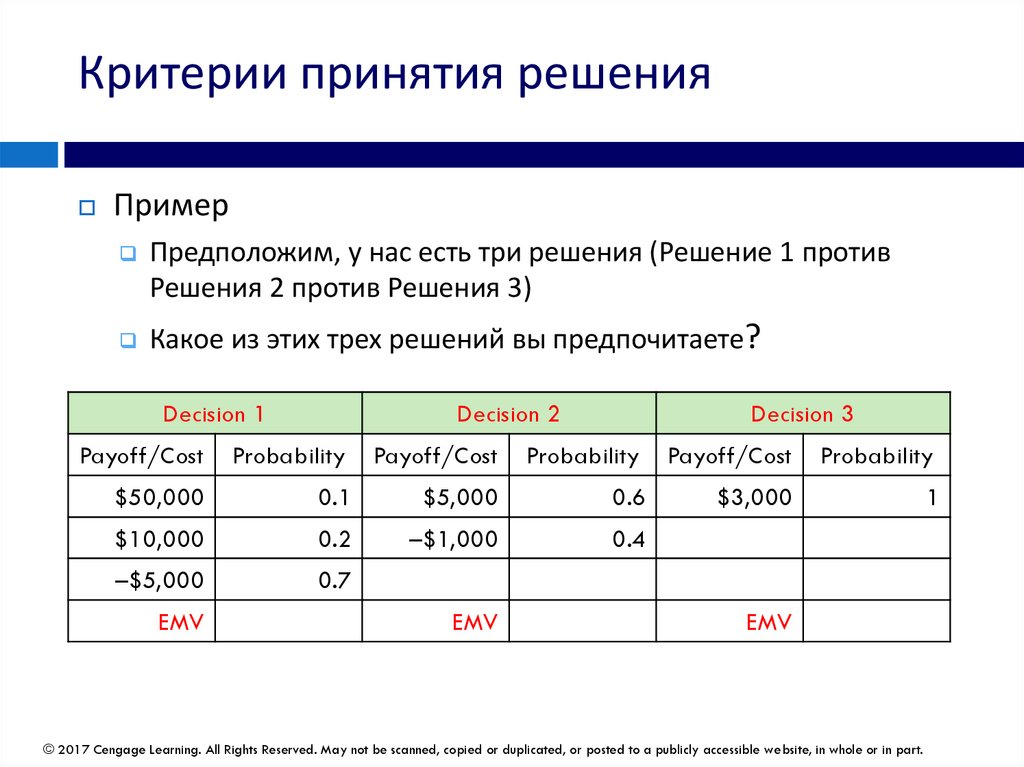
Критерии принятия решенияПример
Предположим,
у нас есть два решения (Решение 1 против Решение 2).Какое из
этих двух решений вы предпочитаете?
Decision 1
Payoff/Cost
Decision 2
Probability
Payoff/Cost
Probability
$50,000
0.1
$5,000
0.6
$10,000
0.2
–$1,000
0.4
–$5,000
0.7
EMV
EMV
© 2017 Cengage Learning. All Rights Reserved. May not be scanned, copied or duplicated, or posted to a publicly accessible website, in whole or in part.
17.
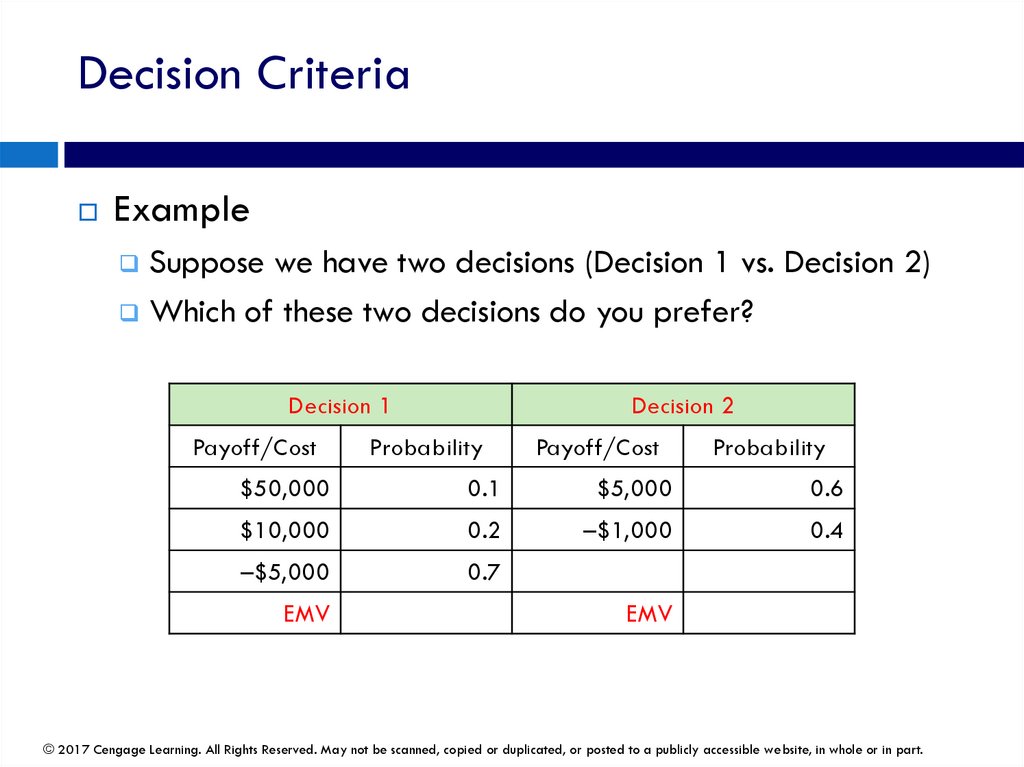
Decision CriteriaExample
Suppose we have two decisions (Decision 1 vs. Decision 2)
Which of these two decisions do you prefer?
Decision 1
Payoff/Cost
Decision 2
Probability
Payoff/Cost
Probability
$50,000
0.1
$5,000
0.6
$10,000
0.2
–$1,000
0.4
–$5,000
0.7
EMV
EMV
© 2017 Cengage Learning. All Rights Reserved. May not be scanned, copied or duplicated, or posted to a publicly accessible website, in whole or in part.
18.
Критерии принятия решенияПример
Предположим, у нас есть три решения (Решение 1 против
Решения 2 против Решения 3)
Какое из этих трех решений вы предпочитаете
Decision 1
Decision 2
?
Decision 3
Payoff/Cost
Probability
Payoff/Cost
Probability
Payoff/Cost
Probability
$50,000
0.1
$5,000
0.6
$3,000
1
$10,000
0.2
–$1,000
0.4
–$5,000
0.7
EMV
EMV
EMV
© 2017 Cengage Learning. All Rights Reserved. May not be scanned, copied or duplicated, or posted to a publicly accessible website, in whole or in part.
19.
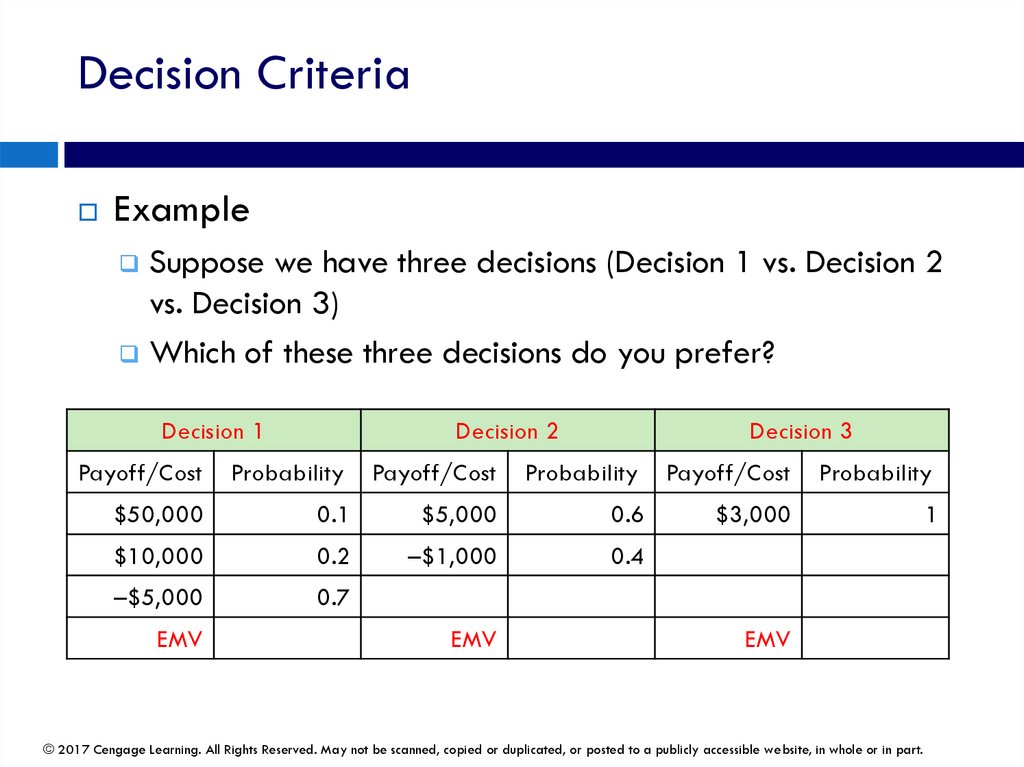
Decision CriteriaExample
Suppose we have three decisions (Decision 1 vs. Decision 2
vs. Decision 3)
Which of these three decisions do you prefer?
Decision 1
Decision 2
Decision 3
Payoff/Cost
Probability
Payoff/Cost
Probability
Payoff/Cost
Probability
$50,000
0.1
$5,000
0.6
$3,000
1
$10,000
0.2
–$1,000
0.4
–$5,000
0.7
EMV
EMV
EMV
© 2017 Cengage Learning. All Rights Reserved. May not be scanned, copied or duplicated, or posted to a publicly accessible website, in whole or in part.
20.
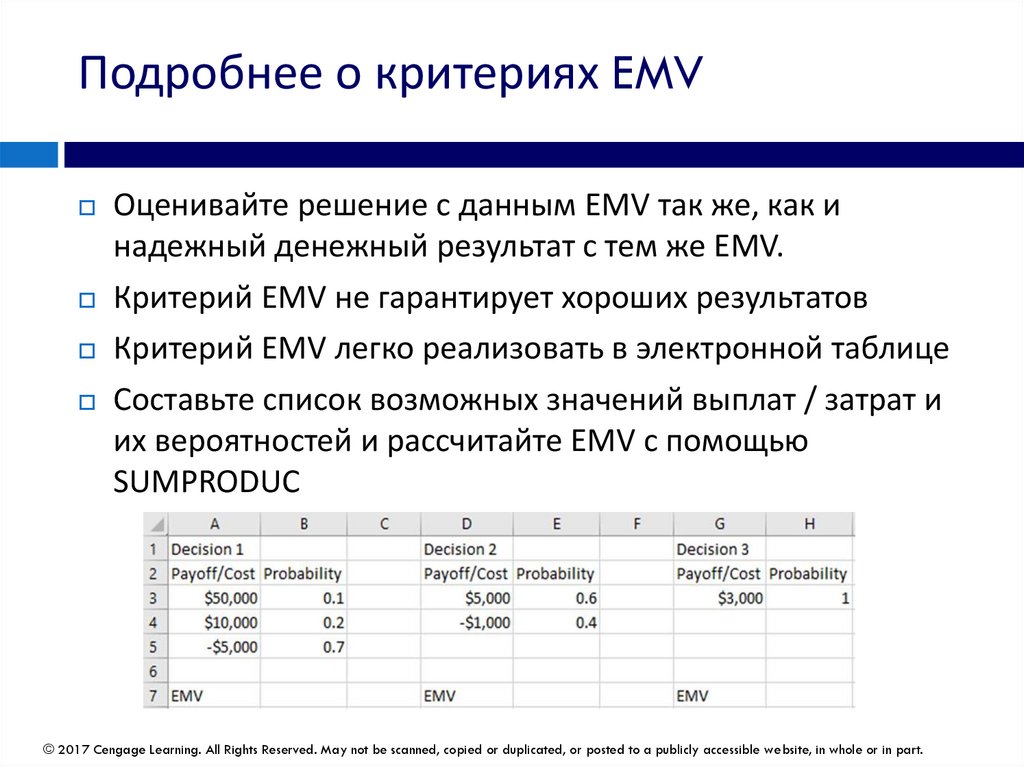
Подробнее о критериях EMVОценивайте решение с данным EMV так же, как и
надежный денежный результат с тем же EMV.
Критерий EMV не гарантирует хороших результатов
Критерий EMV легко реализовать в электронной таблице
Составьте список возможных значений выплат / затрат и
их вероятностей и рассчитайте EMV с помощью
SUMPRODUC
© 2017 Cengage Learning. All Rights Reserved. May not be scanned, copied or duplicated, or posted to a publicly accessible website, in whole or in part.
21.
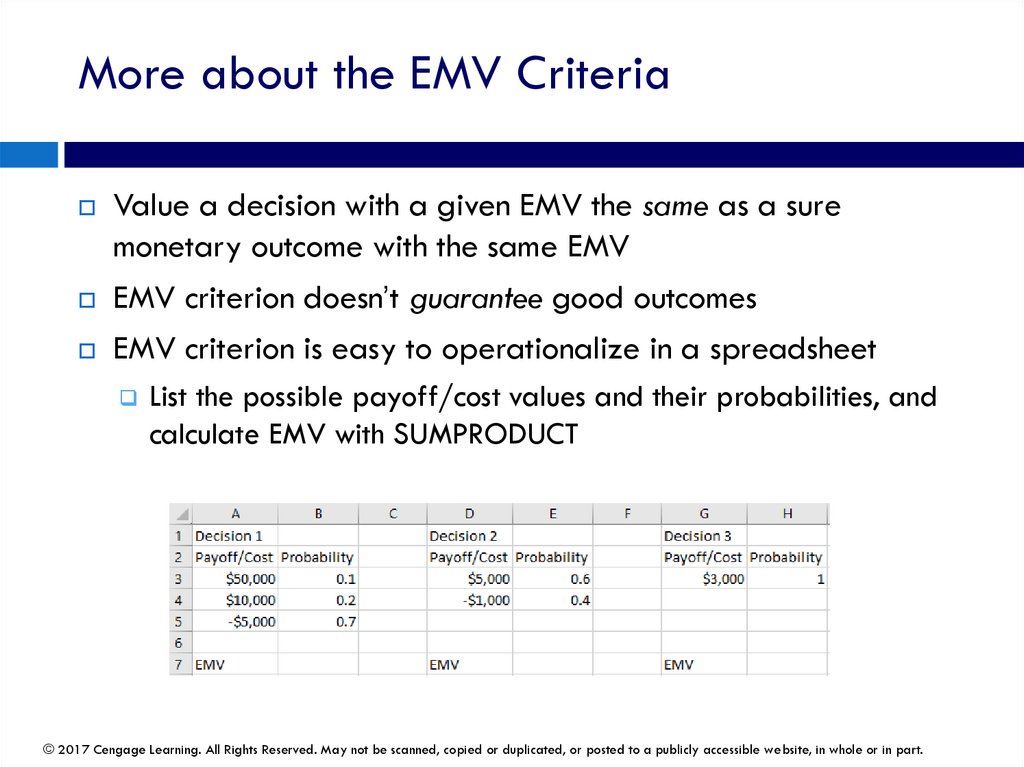
More about the EMV CriteriaValue a decision with a given EMV the same as a sure
monetary outcome with the same EMV
EMV criterion doesn’t guarantee good outcomes
EMV criterion is easy to operationalize in a spreadsheet
List the possible payoff/cost values and their probabilities, and
calculate EMV with SUMPRODUCT
© 2017 Cengage Learning. All Rights Reserved. May not be scanned, copied or duplicated, or posted to a publicly accessible website, in whole or in part.
22.
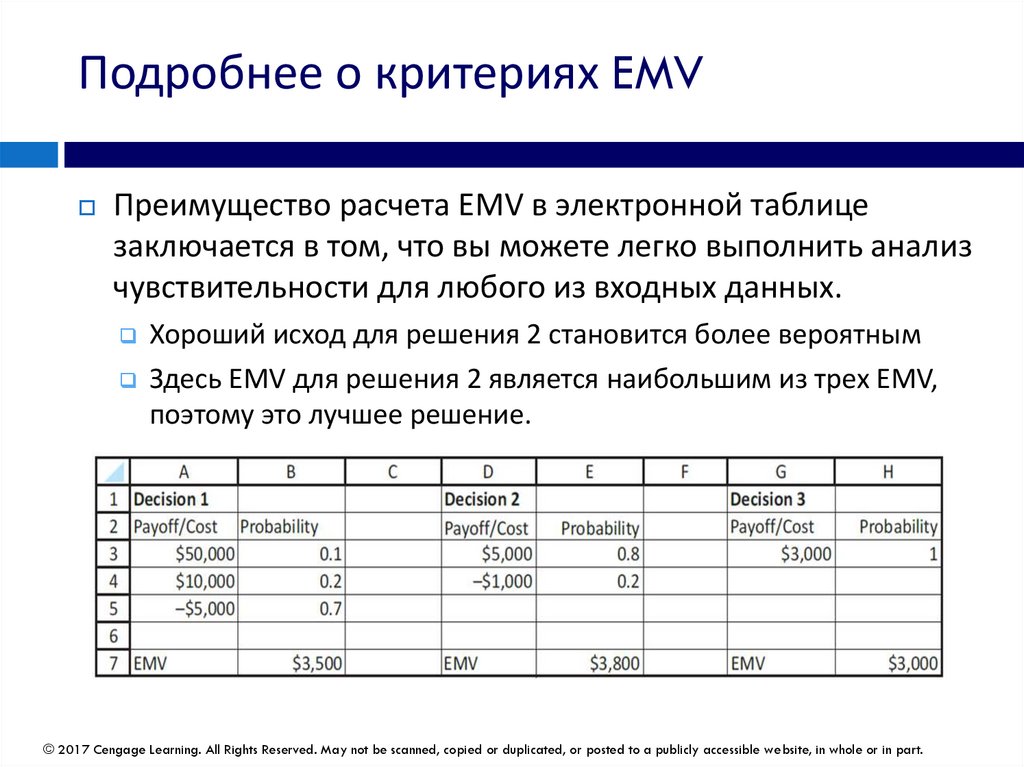
Подробнее о критериях EMVПреимущество расчета EMV в электронной таблице
заключается в том, что вы можете легко выполнить анализ
чувствительности для любого из входных данных.
Хороший исход для решения 2 становится более вероятным
Здесь EMV для решения 2 является наибольшим из трех EMV,
поэтому это лучшее решение.
© 2017 Cengage Learning. All Rights Reserved. May not be scanned, copied or duplicated, or posted to a publicly accessible website, in whole or in part.
23.
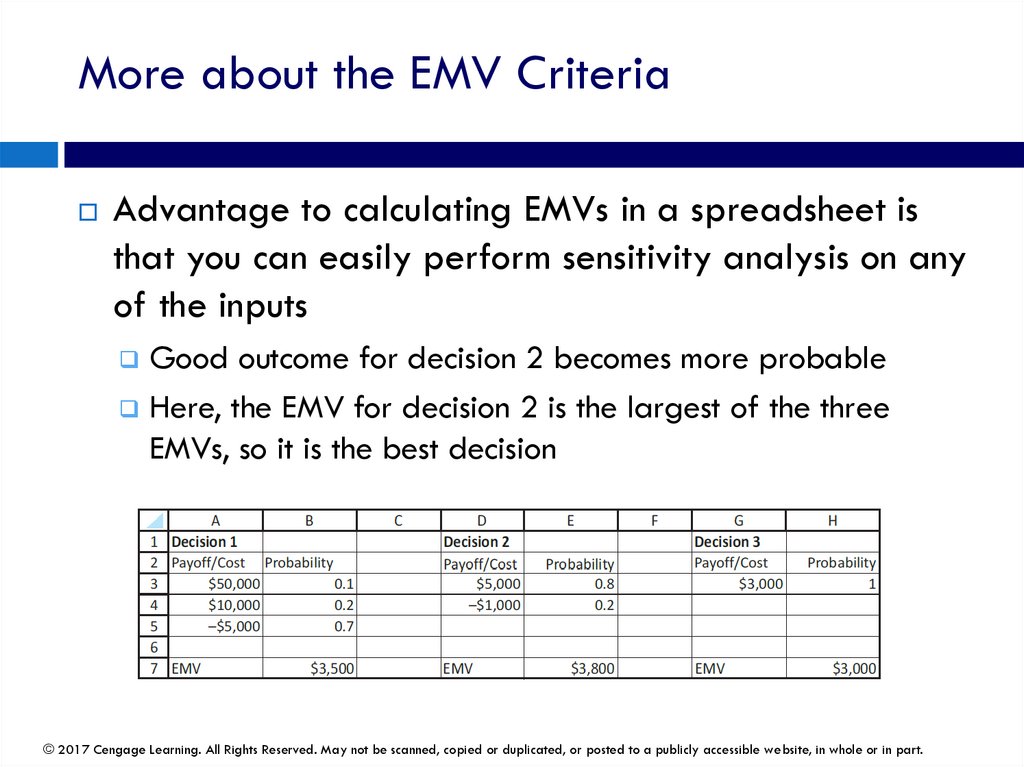
More about the EMV CriteriaAdvantage to calculating EMVs in a spreadsheet is
that you can easily perform sensitivity analysis on any
of the inputs
Good outcome for decision 2 becomes more probable
Here, the EMV for decision 2 is the largest of the three
EMVs, so it is the best decision
© 2017 Cengage Learning. All Rights Reserved. May not be scanned, copied or duplicated, or posted to a publicly accessible website, in whole or in part.
24.
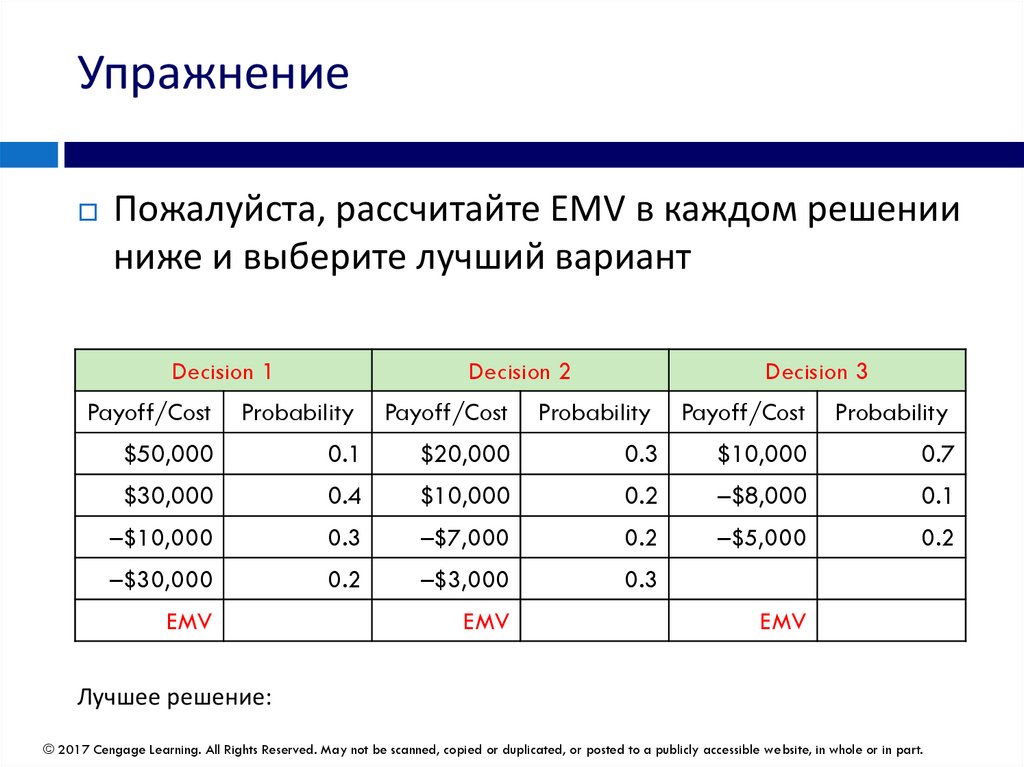
УпражнениеПожалуйста, рассчитайте EMV в каждом решении
ниже и выберите лучший вариант
Decision 1
Decision 2
Decision 3
Payoff/Cost
Probability
Payoff/Cost
Probability
Payoff/Cost
Probability
$50,000
0.1
$20,000
0.3
$10,000
0.7
$30,000
0.4
$10,000
0.2
–$8,000
0.1
–$10,000
0.3
–$7,000
0.2
–$5,000
0.2
–$30,000
0.2
–$3,000
0.3
EMV
EMV
EMV
Лучшее решение:
© 2017 Cengage Learning. All Rights Reserved. May not be scanned, copied or duplicated, or posted to a publicly accessible website, in whole or in part.
25.
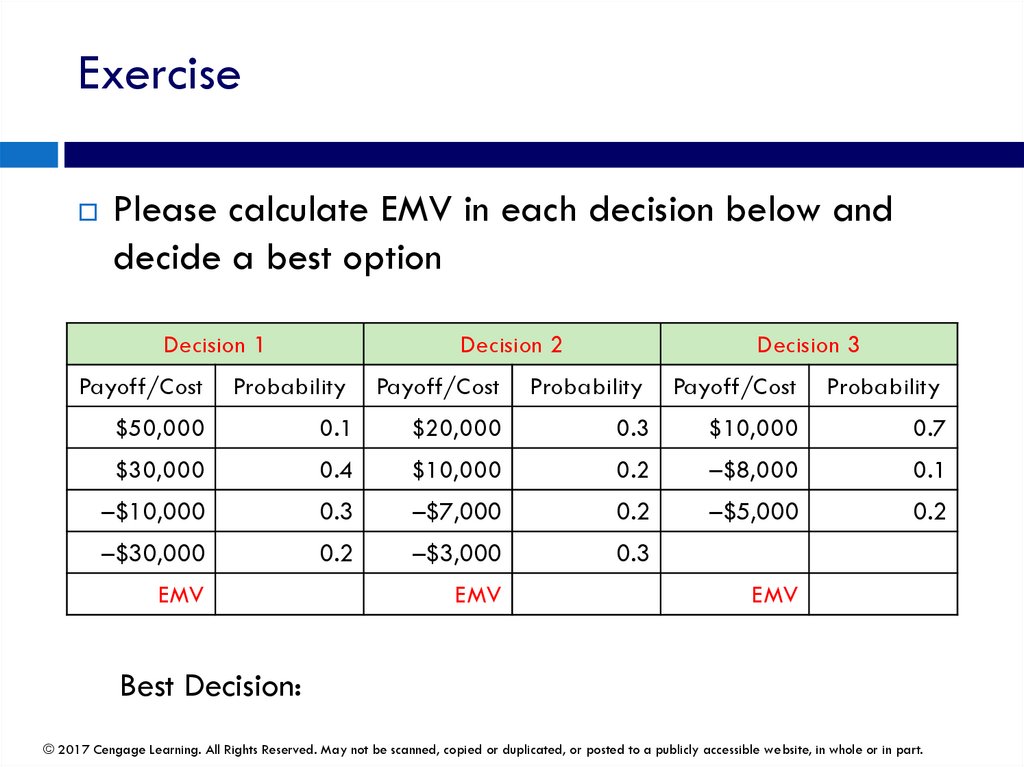
ExercisePlease calculate EMV in each decision below and
decide a best option
Decision 1
Decision 2
Decision 3
Payoff/Cost
Probability
Payoff/Cost
Probability
Payoff/Cost
Probability
$50,000
0.1
$20,000
0.3
$10,000
0.7
$30,000
0.4
$10,000
0.2
–$8,000
0.1
–$10,000
0.3
–$7,000
0.2
–$5,000
0.2
–$30,000
0.2
–$3,000
0.3
EMV
EMV
EMV
Best Decision:
© 2017 Cengage Learning. All Rights Reserved. May not be scanned, copied or duplicated, or posted to a publicly accessible website, in whole or in part.
26.
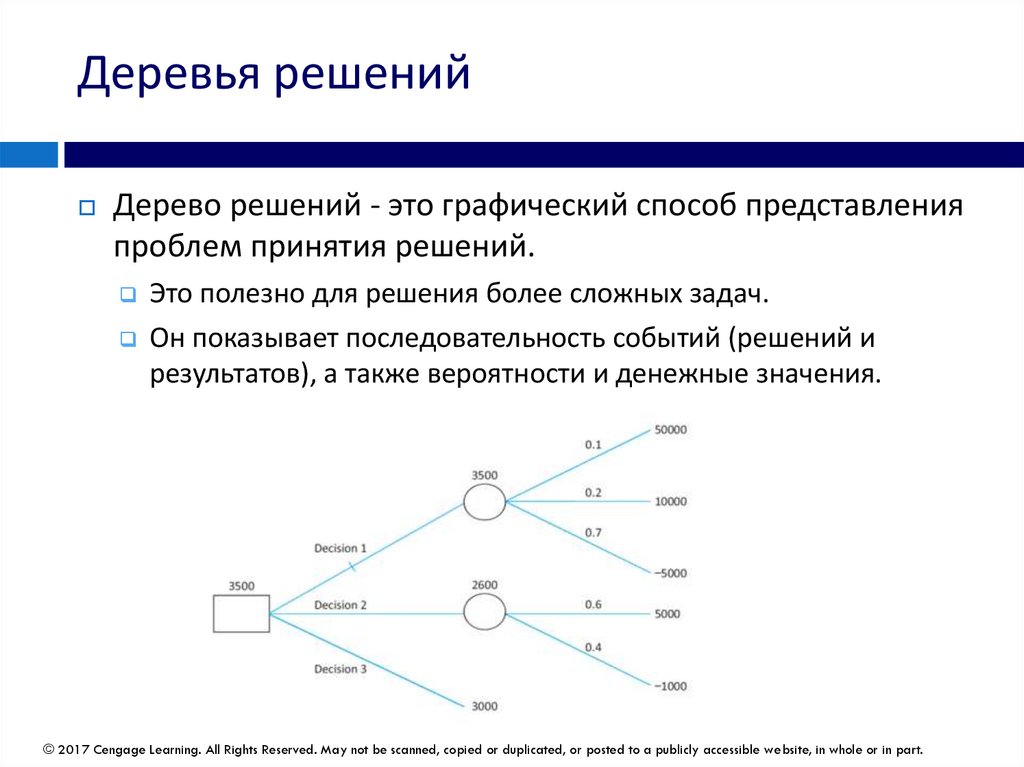
Деревья решенийДерево решений - это графический способ представления
проблем принятия решений.
Это полезно для решения более сложных задач.
Он показывает последовательность событий (решений и
результатов), а также вероятности и денежные значения.
© 2017 Cengage Learning. All Rights Reserved. May not be scanned, copied or duplicated, or posted to a publicly accessible website, in whole or in part.
27.
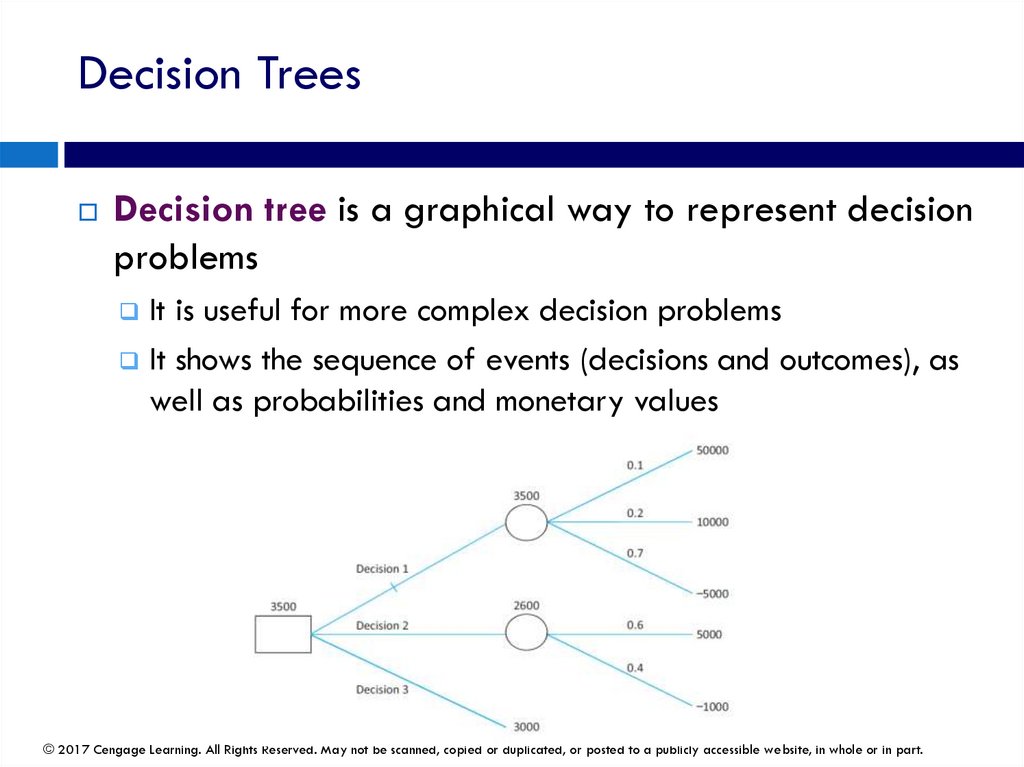
Decision TreesDecision tree is a graphical way to represent decision
problems
It is useful for more complex decision problems
It shows the sequence of events (decisions and outcomes), as
well as probabilities and monetary values
© 2017 Cengage Learning. All Rights Reserved. May not be scanned, copied or duplicated, or posted to a publicly accessible website, in whole or in part.
28.
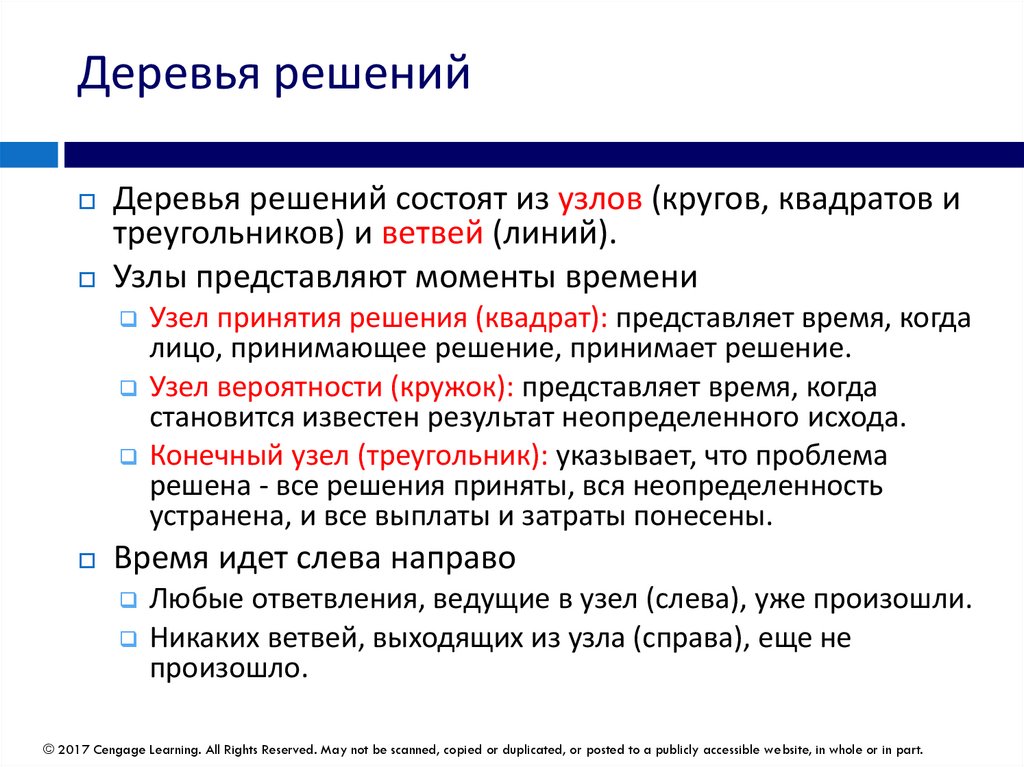
Деревья решенийДеревья решений состоят из узлов (кругов, квадратов и
треугольников) и ветвей (линий).
Узлы представляют моменты времени
Узел принятия решения (квадрат): представляет время, когда
лицо, принимающее решение, принимает решение.
Узел вероятности (кружок): представляет время, когда
становится известен результат неопределенного исхода.
Конечный узел (треугольник): указывает, что проблема
решена - все решения приняты, вся неопределенность
устранена, и все выплаты и затраты понесены.
Время идет слева направо
Любые ответвления, ведущие в узел (слева), уже произошли.
Никаких ветвей, выходящих из узла (справа), еще не
произошло.
© 2017 Cengage Learning. All Rights Reserved. May not be scanned, copied or duplicated, or posted to a publicly accessible website, in whole or in part.
29.
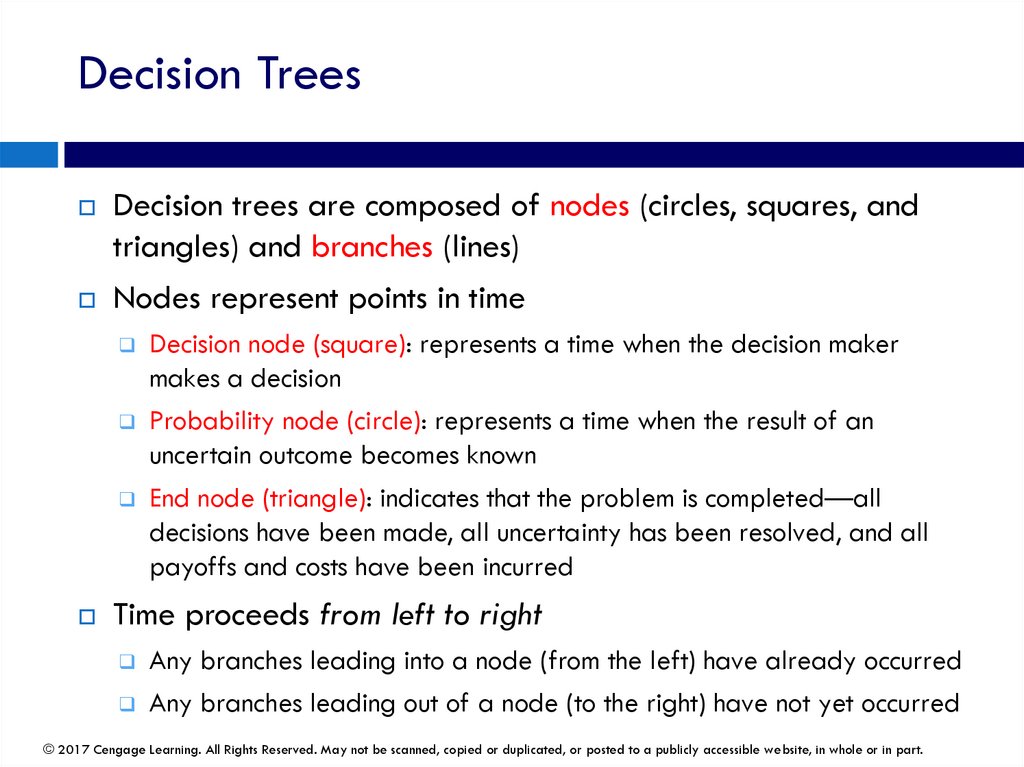
Decision TreesDecision trees are composed of nodes (circles, squares, and
triangles) and branches (lines)
Nodes represent points in time
Decision node (square): represents a time when the decision maker
makes a decision
Probability node (circle): represents a time when the result of an
uncertain outcome becomes known
End node (triangle): indicates that the problem is completed—all
decisions have been made, all uncertainty has been resolved, and all
payoffs and costs have been incurred
Time proceeds from left to right
Any branches leading into a node (from the left) have already occurred
Any branches leading out of a node (to the right) have not yet occurred
© 2017 Cengage Learning. All Rights Reserved. May not be scanned, copied or duplicated, or posted to a publicly accessible website, in whole or in part.
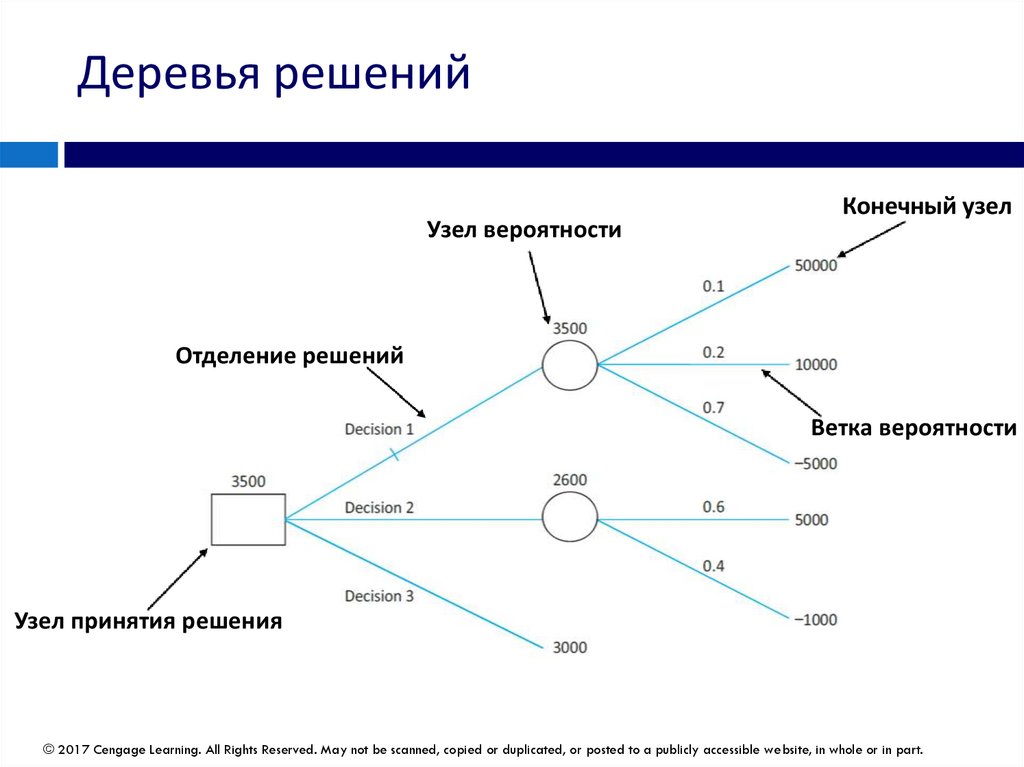
30.
Деревья решенийУзел вероятности
Конечный узел
Отделение решений
Ветка вероятности
Узел принятия решения
© 2017 Cengage Learning. All Rights Reserved. May not be scanned, copied or duplicated, or posted to a publicly accessible website, in whole or in part.
31.
Decision TreesEnd Node
Probability Node
Decision Branch
Probability Branch
Decision Node
© 2017 Cengage Learning. All Rights Reserved. May not be scanned, copied or duplicated, or posted to a publicly accessible website, in whole or in part.
32.
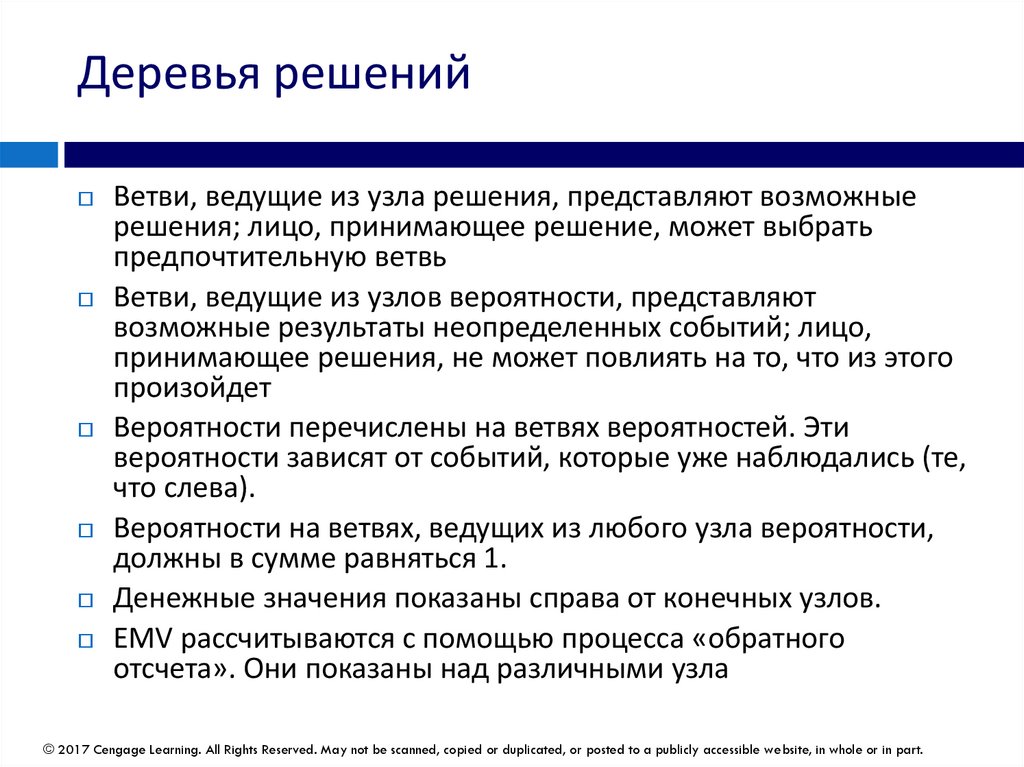
Деревья решенийВетви, ведущие из узла решения, представляют возможные
решения; лицо, принимающее решение, может выбрать
предпочтительную ветвь
Ветви, ведущие из узлов вероятности, представляют
возможные результаты неопределенных событий; лицо,
принимающее решения, не может повлиять на то, что из этого
произойдет
Вероятности перечислены на ветвях вероятностей. Эти
вероятности зависят от событий, которые уже наблюдались (те,
что слева).
Вероятности на ветвях, ведущих из любого узла вероятности,
должны в сумме равняться 1.
Денежные значения показаны справа от конечных узлов.
EMV рассчитываются с помощью процесса «обратного
отсчета». Они показаны над различными узла
© 2017 Cengage Learning. All Rights Reserved. May not be scanned, copied or duplicated, or posted to a publicly accessible website, in whole or in part.
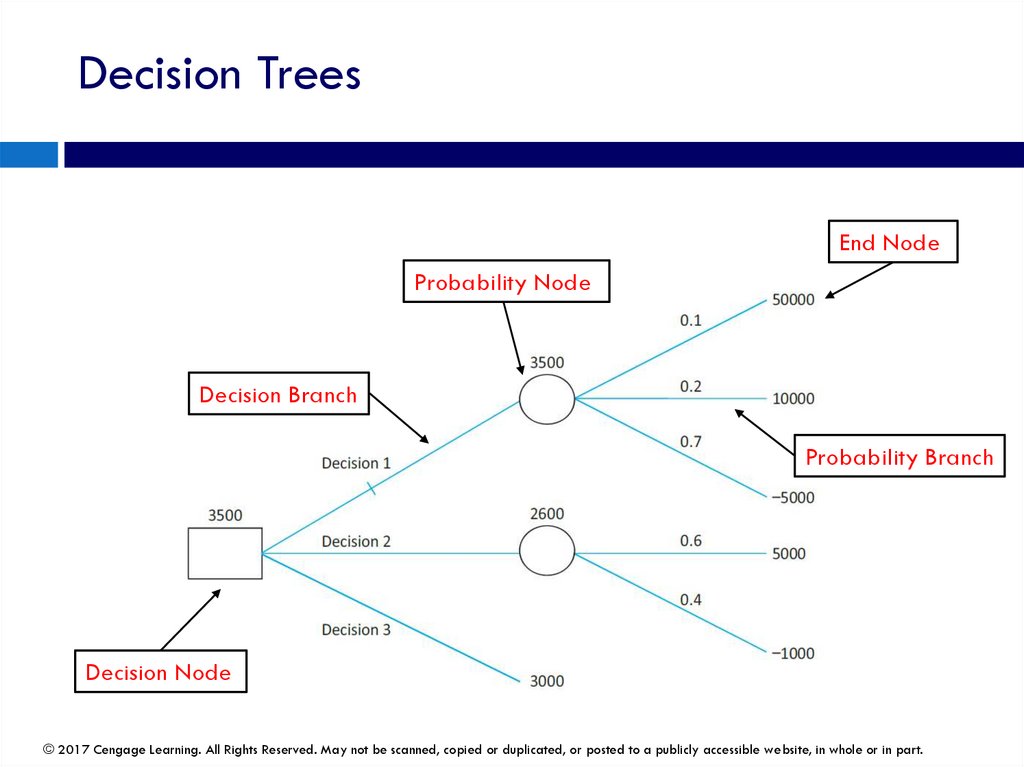
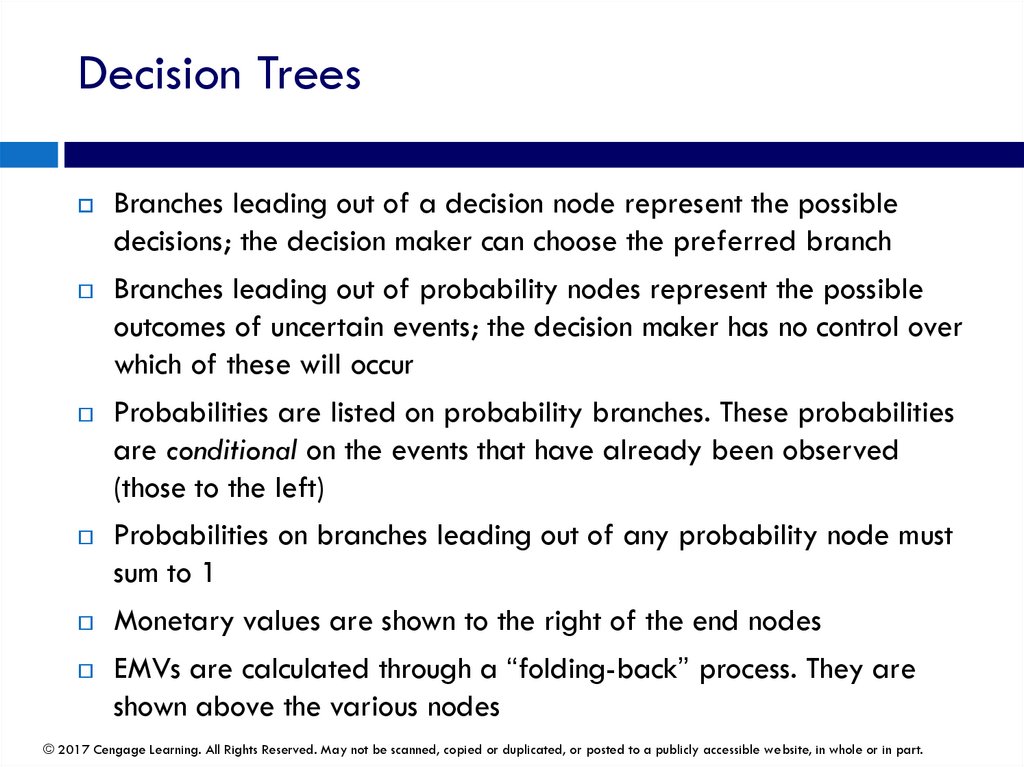
33.
Decision TreesBranches leading out of a decision node represent the possible
decisions; the decision maker can choose the preferred branch
Branches leading out of probability nodes represent the possible
outcomes of uncertain events; the decision maker has no control over
which of these will occur
Probabilities are listed on probability branches. These probabilities
are conditional on the events that have already been observed
(those to the left)
Probabilities on branches leading out of any probability node must
sum to 1
Monetary values are shown to the right of the end nodes
EMVs are calculated through a “folding-back” process. They are
shown above the various nodes
© 2017 Cengage Learning. All Rights Reserved. May not be scanned, copied or duplicated, or posted to a publicly accessible website, in whole or in part.
34.
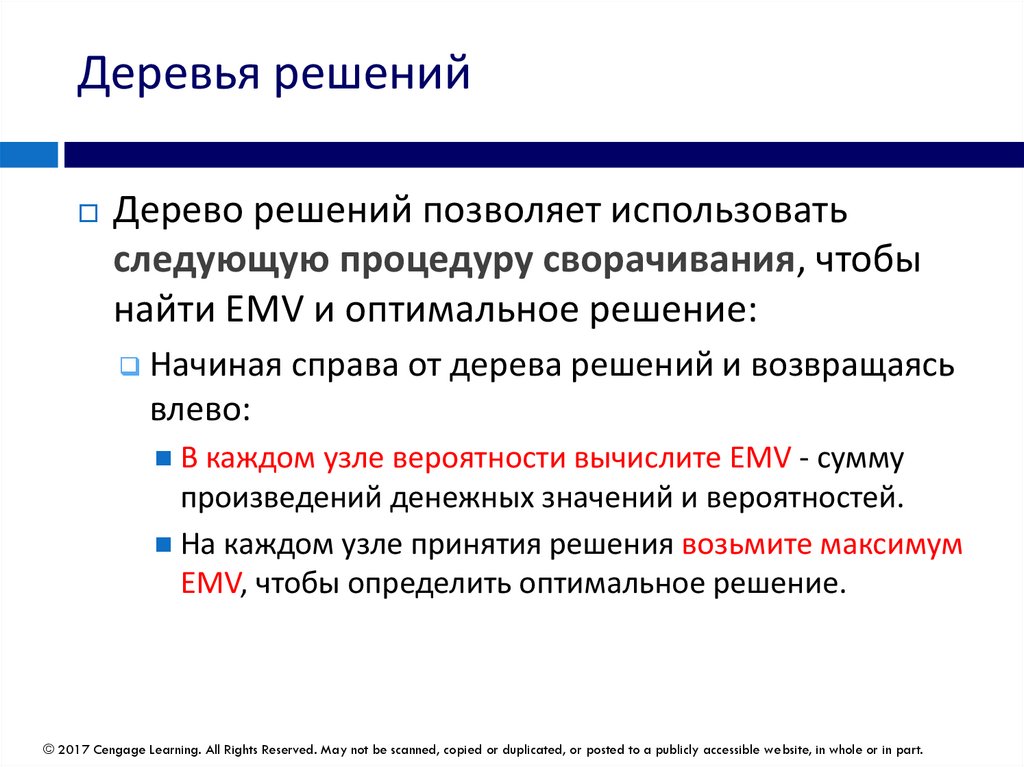
Деревья решенийДерево решений позволяет использовать
следующую процедуру сворачивания, чтобы
найти EMV и оптимальное решение:
Начиная справа от дерева решений и возвращаясь
влево:
В каждом узле вероятности вычислите EMV - сумму
произведений денежных значений и вероятностей.
На каждом узле принятия решения возьмите максимум
EMV, чтобы определить оптимальное решение.
© 2017 Cengage Learning. All Rights Reserved. May not be scanned, copied or duplicated, or posted to a publicly accessible website, in whole or in part.
35.
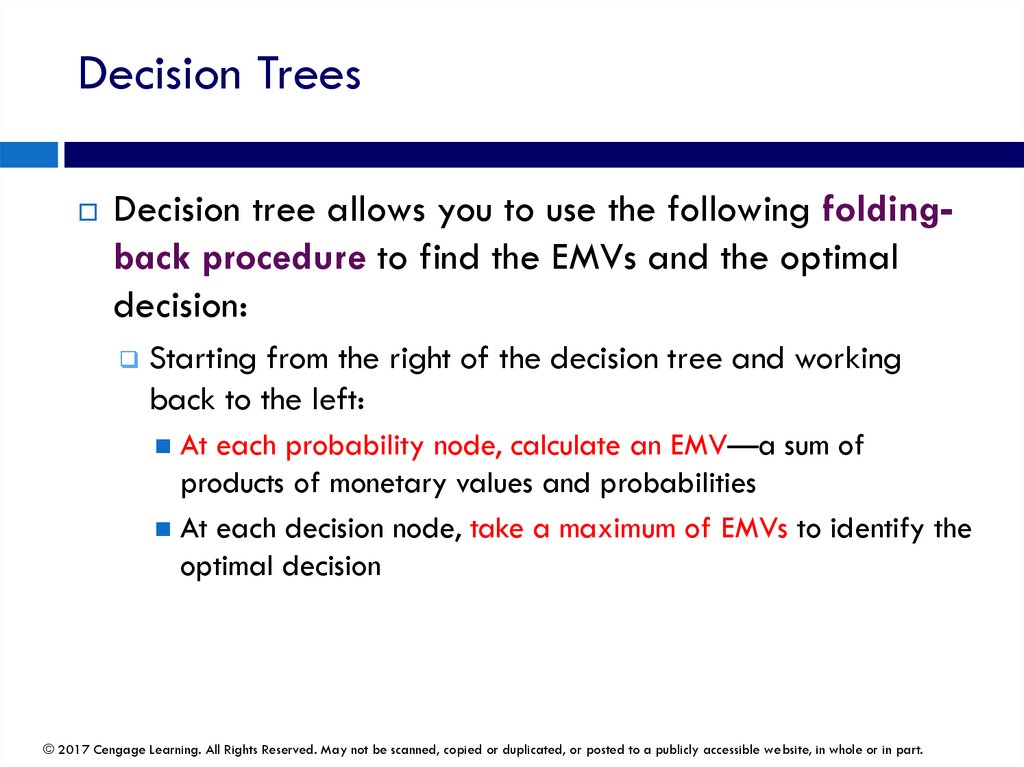
Decision TreesDecision tree allows you to use the following foldingback procedure to find the EMVs and the optimal
decision:
Starting from the right of the decision tree and working
back to the left:
At each probability node, calculate an EMV—a sum of
products of monetary values and probabilities
At each decision node, take a maximum of EMVs to identify the
optimal decision
© 2017 Cengage Learning. All Rights Reserved. May not be scanned, copied or duplicated, or posted to a publicly accessible website, in whole or in part.
36.
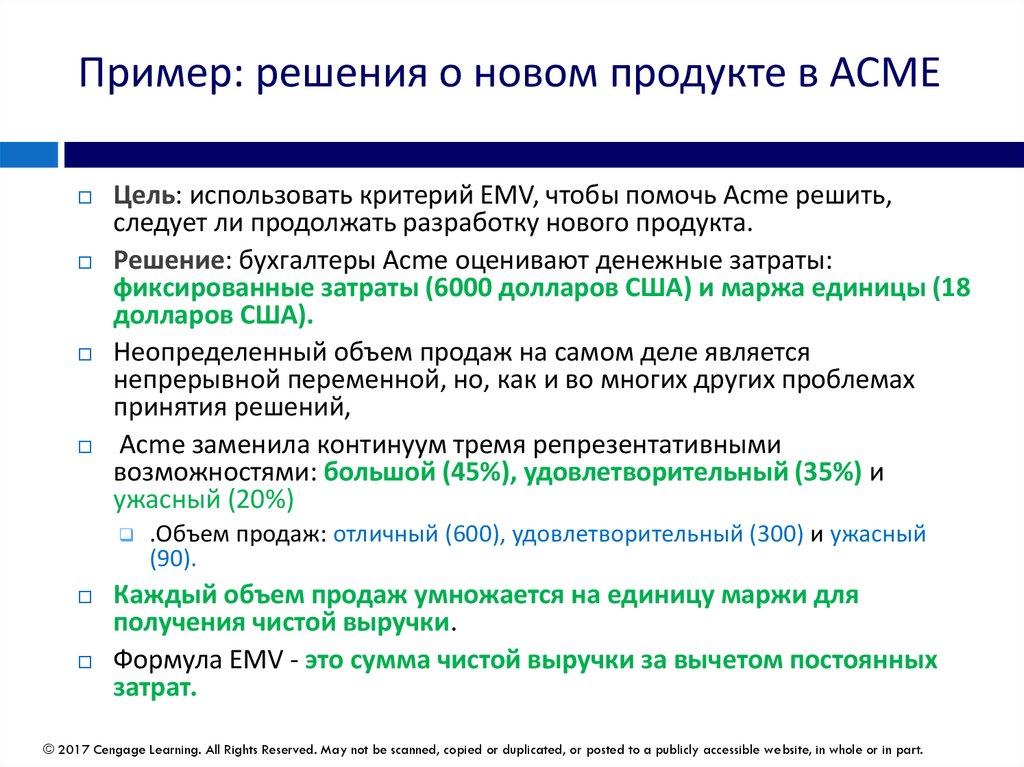
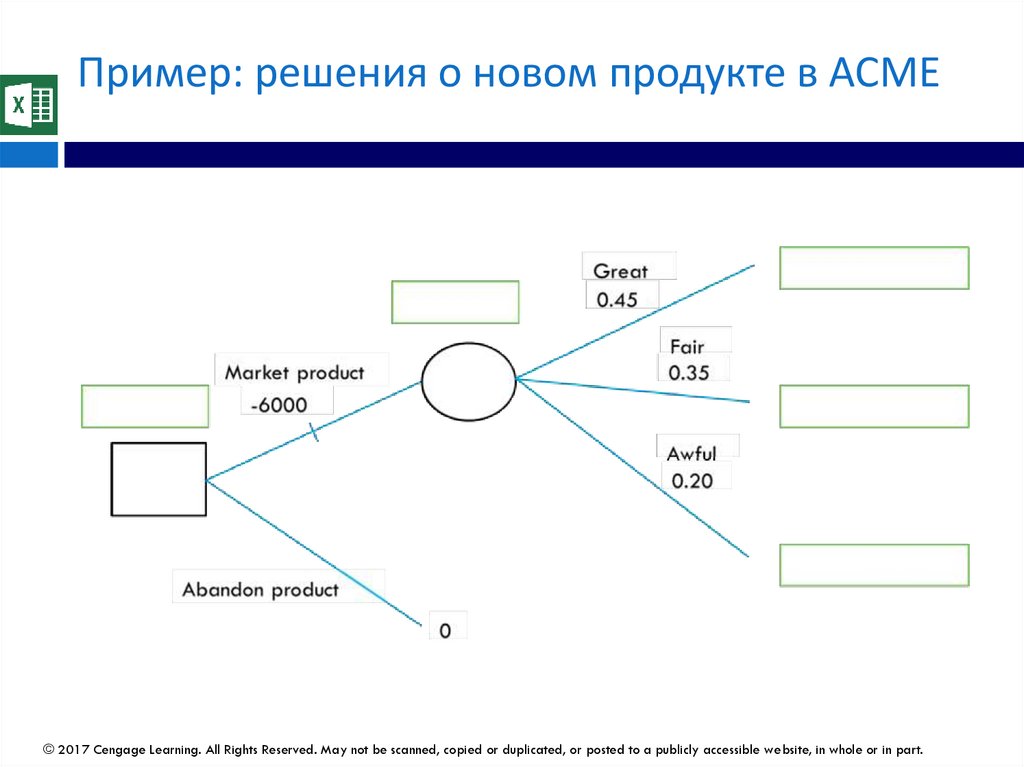
Пример: решения о новом продукте в ACMEЦель: использовать критерий EMV, чтобы помочь Acme решить,
следует ли продолжать разработку нового продукта.
Решение: бухгалтеры Acme оценивают денежные затраты:
фиксированные затраты (6000 долларов США) и маржа единицы (18
долларов США).
Неопределенный объем продаж на самом деле является
непрерывной переменной, но, как и во многих других проблемах
принятия решений,
Acme заменила континуум тремя репрезентативными
возможностями: большой (45%), удовлетворительный (35%) и
ужасный (20%)
.Объем продаж: отличный (600), удовлетворительный (300) и ужасный
(90).
Каждый объем продаж умножается на единицу маржи для
получения чистой выручки.
Формула EMV - это сумма чистой выручки за вычетом постоянных
затрат.
© 2017 Cengage Learning. All Rights Reserved. May not be scanned, copied or duplicated, or posted to a publicly accessible website, in whole or in part.
37.
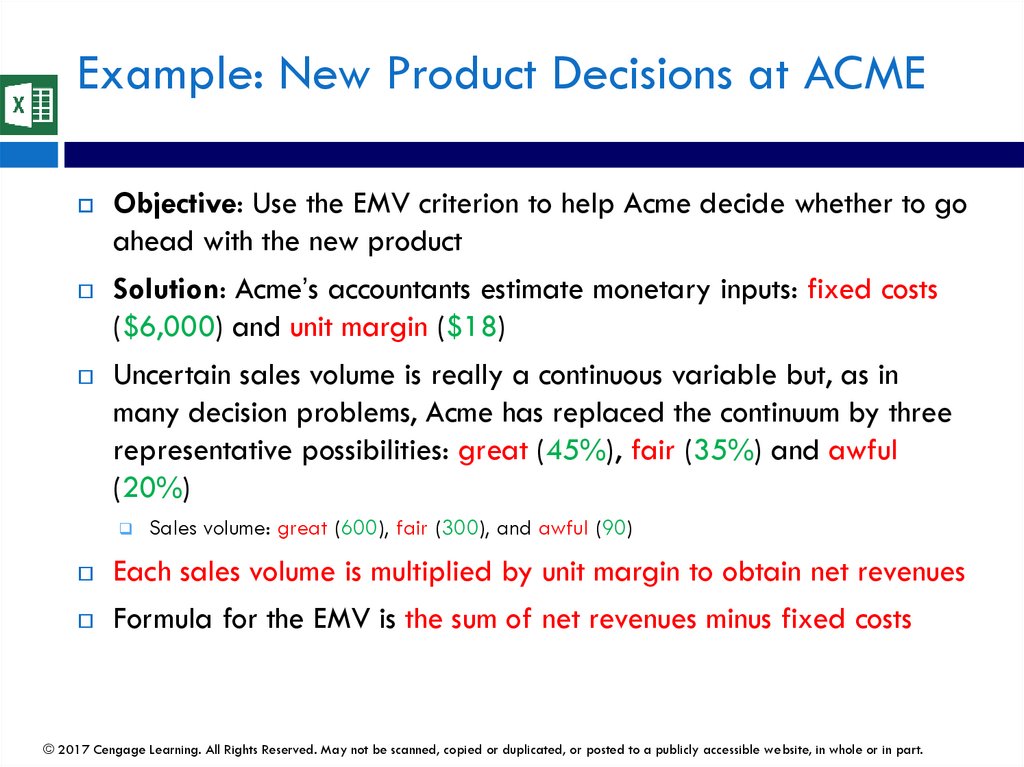
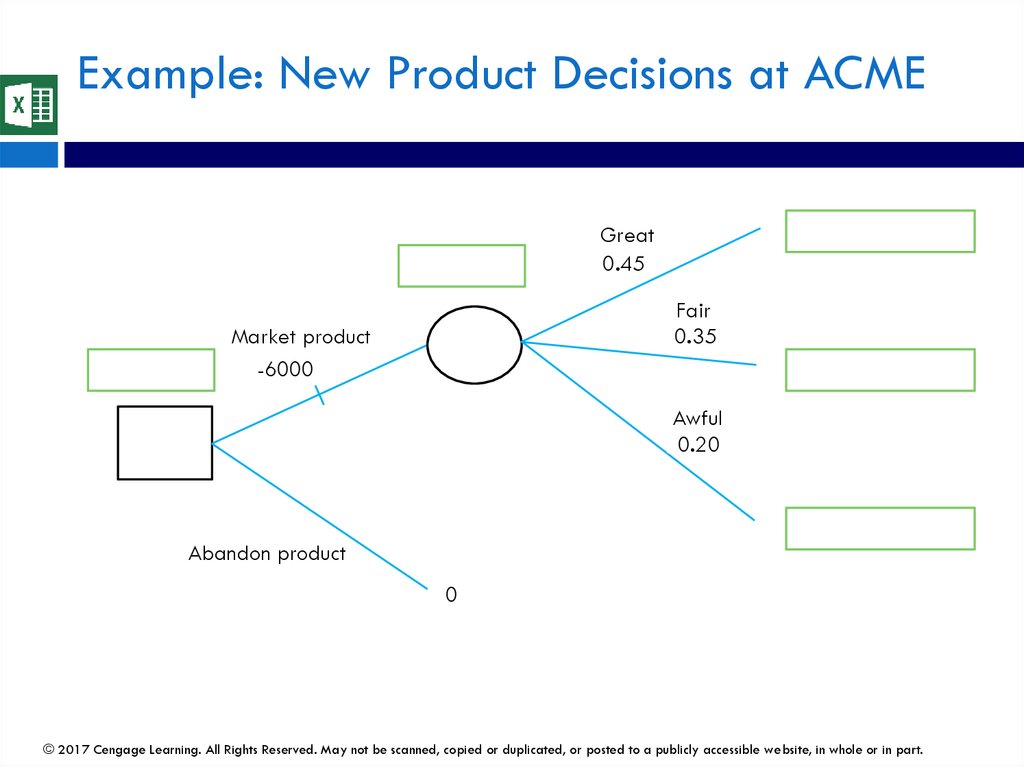
Example: New Product Decisions at ACMEObjective: Use the EMV criterion to help Acme decide whether to go
ahead with the new product
Solution: Acme’s accountants estimate monetary inputs: fixed costs
($6,000) and unit margin ($18)
Uncertain sales volume is really a continuous variable but, as in
many decision problems, Acme has replaced the continuum by three
representative possibilities: great (45%), fair (35%) and awful
(20%)
Sales volume: great (600), fair (300), and awful (90)
Each sales volume is multiplied by unit margin to obtain net revenues
Formula for the EMV is the sum of net revenues minus fixed costs
© 2017 Cengage Learning. All Rights Reserved. May not be scanned, copied or duplicated, or posted to a publicly accessible website, in whole or in part.
38.
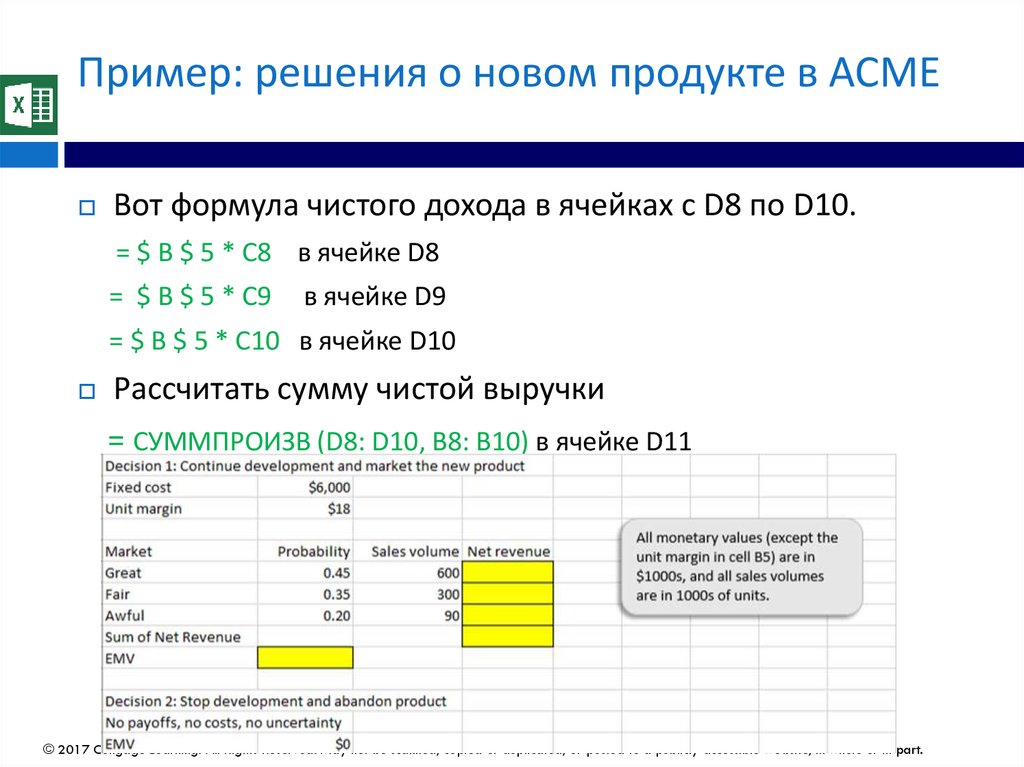
Пример: решения о новом продукте в ACMEВот формула чистого дохода в ячейках с D8 по D10.
= $ B $ 5 * C8 в ячейке D8
= $ B $ 5 * C9
в ячейке D9
= $ B $ 5 * C10 в ячейке D10
Рассчитать сумму чистой выручки
= СУММПРОИЗВ (D8: D10, B8: B10) в ячейке D11
© 2017 Cengage Learning. All Rights Reserved. May not be scanned, copied or duplicated, or posted to a publicly accessible website, in whole or in part.
39.
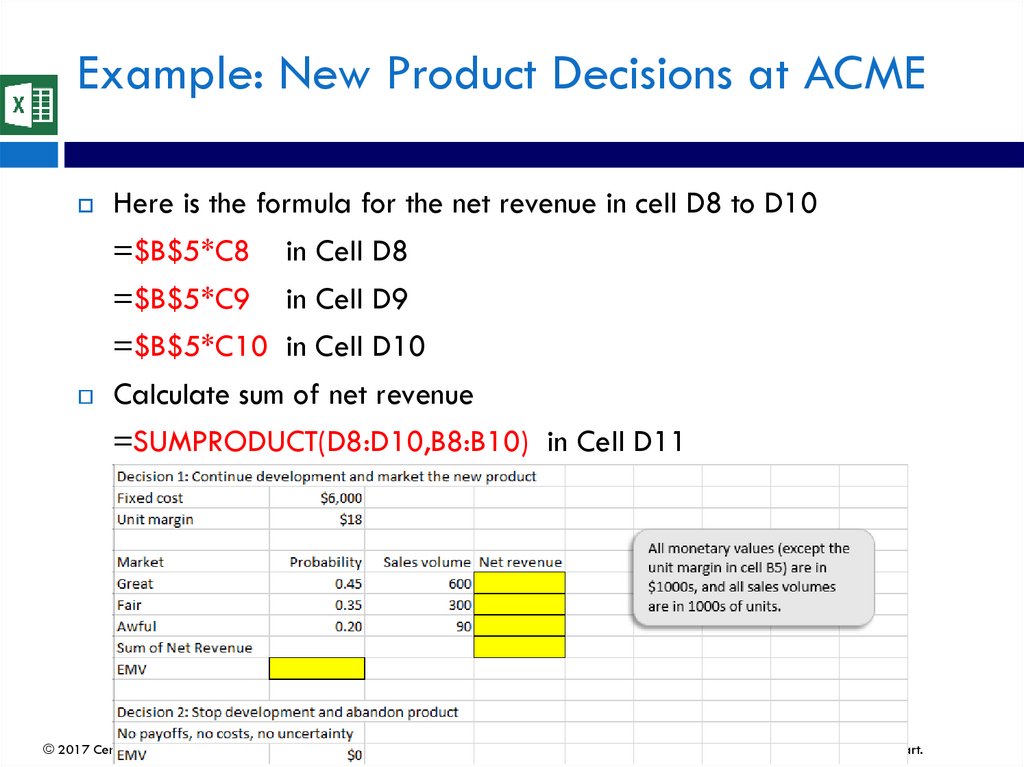
Example: New Product Decisions at ACMEHere is the formula for the net revenue in cell D8 to D10
=$B$5*C8
in Cell D8
=$B$5*C9
in Cell D9
=$B$5*C10 in Cell D10
Calculate sum of net revenue
=SUMPRODUCT(D8:D10,B8:B10) in Cell D11
© 2017 Cengage Learning. All Rights Reserved. May not be scanned, copied or duplicated, or posted to a publicly accessible website, in whole or in part.
40.
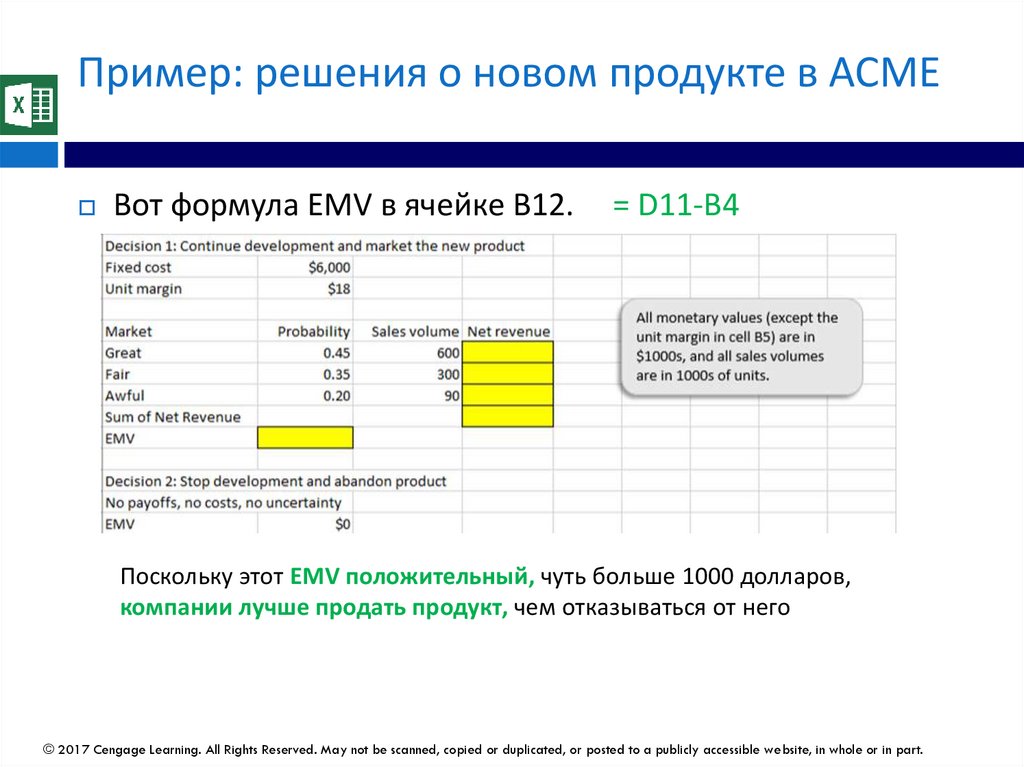
Пример: решения о новом продукте в ACMEВот формула EMV в ячейке B12.
= D11-B4
Поскольку этот EMV положительный, чуть больше 1000 долларов,
компании лучше продать продукт, чем отказываться от него
© 2017 Cengage Learning. All Rights Reserved. May not be scanned, copied or duplicated, or posted to a publicly accessible website, in whole or in part.
41.
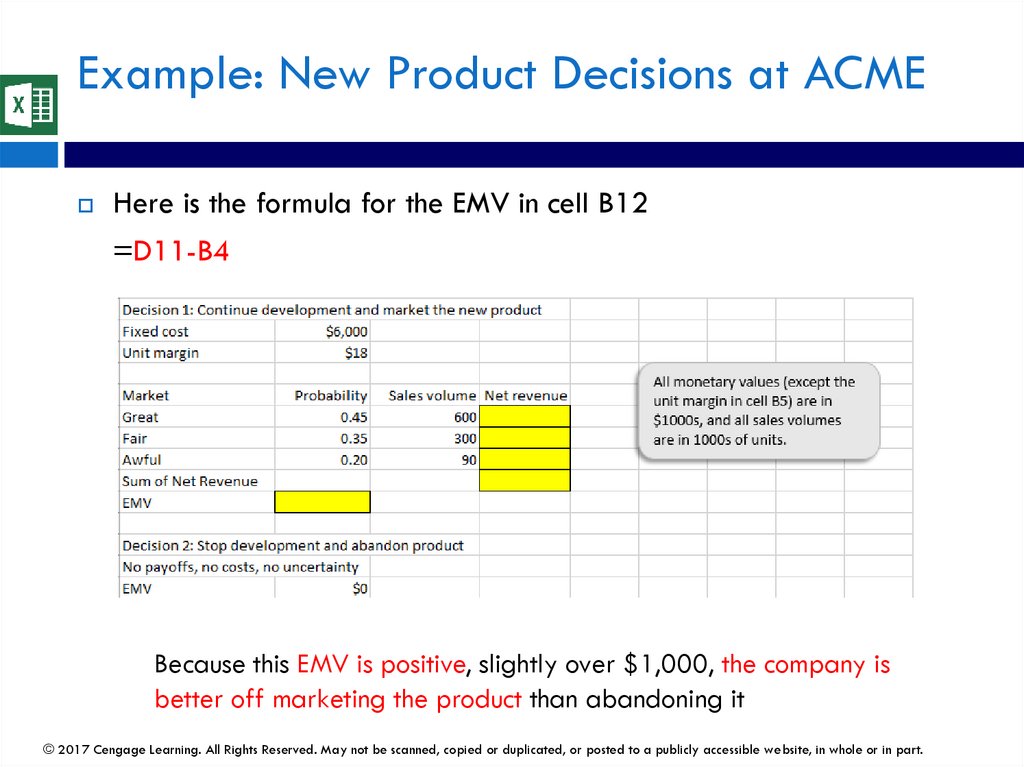
Example: New Product Decisions at ACMEHere is the formula for the EMV in cell B12
=D11-B4
Because this EMV is positive, slightly over $1,000, the company is
better off marketing the product than abandoning it
© 2017 Cengage Learning. All Rights Reserved. May not be scanned, copied or duplicated, or posted to a publicly accessible website, in whole or in part.
42.
Пример: решения о новом продукте в ACME© 2017 Cengage Learning. All Rights Reserved. May not be scanned, copied or duplicated, or posted to a publicly accessible website, in whole or in part.
43.
Example: New Product Decisions at ACMEGreat
0.45
Fair
0.35
Market product
-6000
Awful
0.20
Abandon product
0
© 2017 Cengage Learning. All Rights Reserved. May not be scanned, copied or duplicated, or posted to a publicly accessible website, in whole or in part.
44.
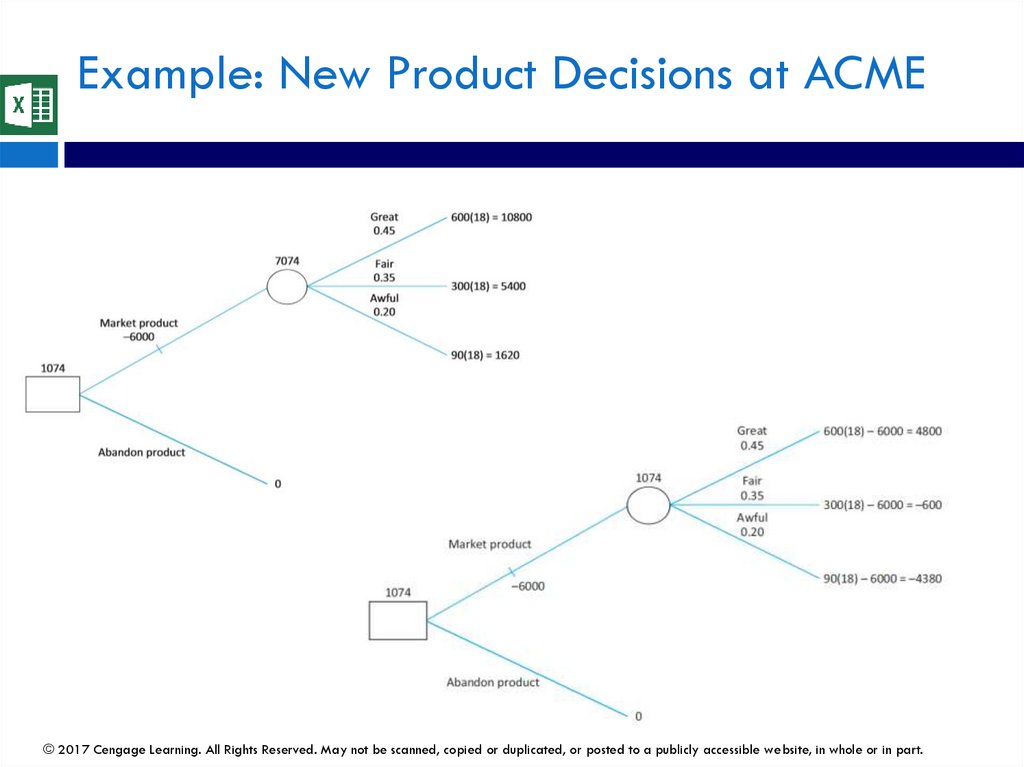
Пример: решения о новом продукте в ACMEУ нас есть другое дерево решений, где фиксированная
стоимость по-прежнему отображается под ветвью
решения, но вычитается из каждого конечного узла.
EMV над узлом вероятности получается после вычитания
фиксированной стоимости. Любое дерево вполне приемлемо
Однако это второе дерево дает представление о том, что
два из трех результатов приводят к чистым убыткам для
Acme, даже несмотря на то, что средневзвешенное
значение EMV находится в положительном диапазоне (см.
Следующий слайд).
© 2017 Cengage Learning. All Rights Reserved. May not be scanned, copied or duplicated, or posted to a publicly accessible website, in whole or in part.
45.
Example: New Product Decisions at ACMEWe have another decision tree, where the fixed cost is still
shown under the decision branch but is subtracted from each
end node
The EMV above the probability node is after subtraction of the fixed
cost. Either tree is perfectly acceptable
However, this second tree provides the insight that two of the
three outcomes result in a net loss to Acme, even though the
weighted average, the EMV, is well in the positive range (See
the next slide)
© 2017 Cengage Learning. All Rights Reserved. May not be scanned, copied or duplicated, or posted to a publicly accessible website, in whole or in part.
46.
Пример: решения о новом продукте в ACME© 2017 Cengage Learning. All Rights Reserved. May not be scanned, copied or duplicated, or posted to a publicly accessible website, in whole or in part.
47.
Example: New Product Decisions at ACME© 2017 Cengage Learning. All Rights Reserved. May not be scanned, copied or duplicated, or posted to a publicly accessible website, in whole or in part.
48.
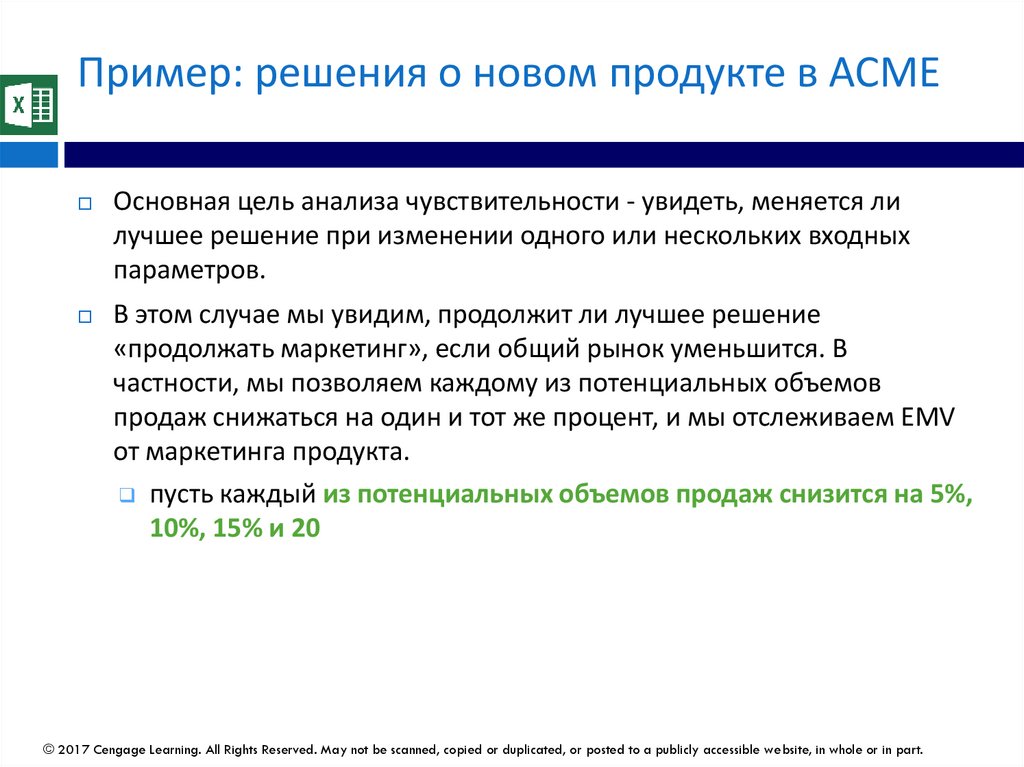
Пример: решения о новом продукте в ACMEОсновная цель анализа чувствительности - увидеть, меняется ли
лучшее решение при изменении одного или нескольких входных
параметров.
В этом случае мы увидим, продолжит ли лучшее решение
«продолжать маркетинг», если общий рынок уменьшится. В
частности, мы позволяем каждому из потенциальных объемов
продаж снижаться на один и тот же процент, и мы отслеживаем EMV
от маркетинга продукта.
пусть каждый из потенциальных объемов продаж снизится на 5%,
10%, 15% и 20
© 2017 Cengage Learning. All Rights Reserved. May not be scanned, copied or duplicated, or posted to a publicly accessible website, in whole or in part.
49.
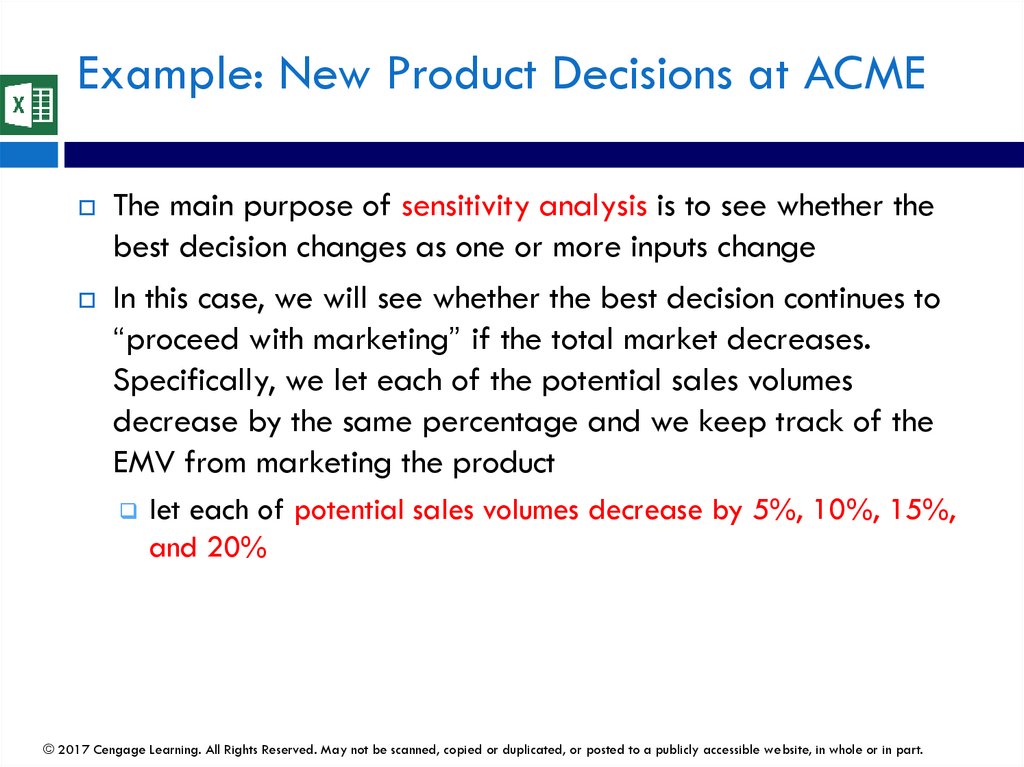
Example: New Product Decisions at ACMEThe main purpose of sensitivity analysis is to see whether the
best decision changes as one or more inputs change
In this case, we will see whether the best decision continues to
“proceed with marketing” if the total market decreases.
Specifically, we let each of the potential sales volumes
decrease by the same percentage and we keep track of the
EMV from marketing the product
let each of potential sales volumes decrease by 5%, 10%, 15%,
and 20%
© 2017 Cengage Learning. All Rights Reserved. May not be scanned, copied or duplicated, or posted to a publicly accessible website, in whole or in part.
50.
Пример 6.1: Решения по новому продукту вACME
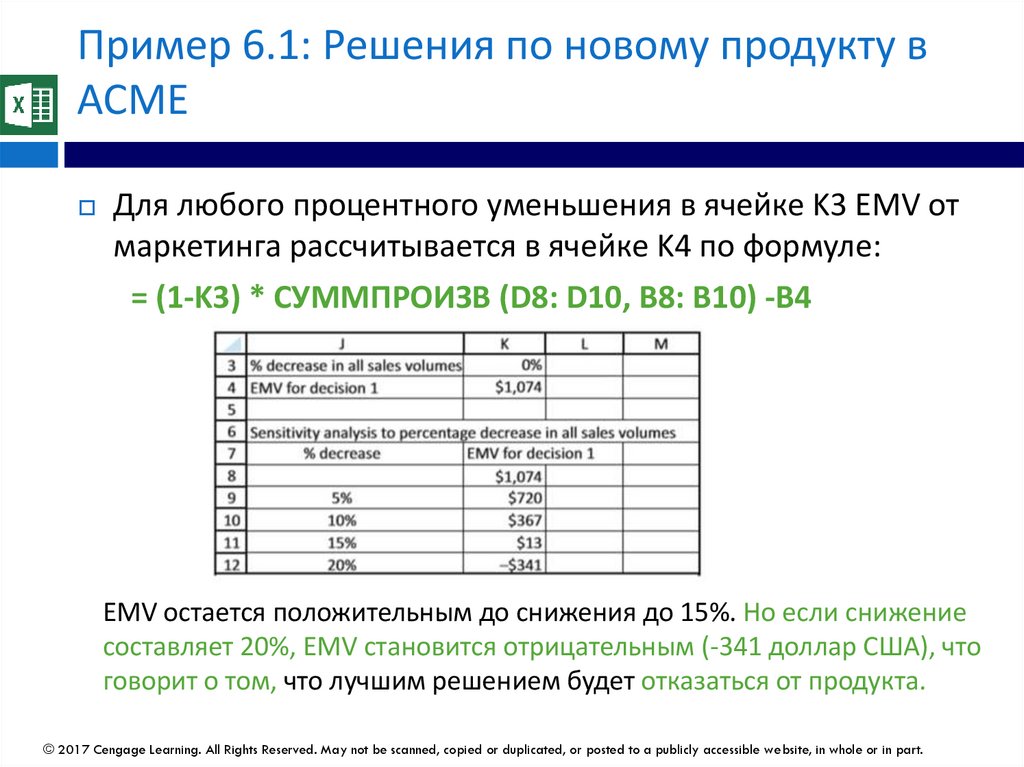
Для любого процентного уменьшения в ячейке K3 EMV от
маркетинга рассчитывается в ячейке K4 по формуле:
= (1-K3) * СУММПРОИЗВ (D8: D10, B8: B10) -B4
EMV остается положительным до снижения до 15%. Но если снижение
составляет 20%, EMV становится отрицательным (-341 доллар США), что
говорит о том, что лучшим решением будет отказаться от продукта.
© 2017 Cengage Learning. All Rights Reserved. May not be scanned, copied or duplicated, or posted to a publicly accessible website, in whole or in part.
51.
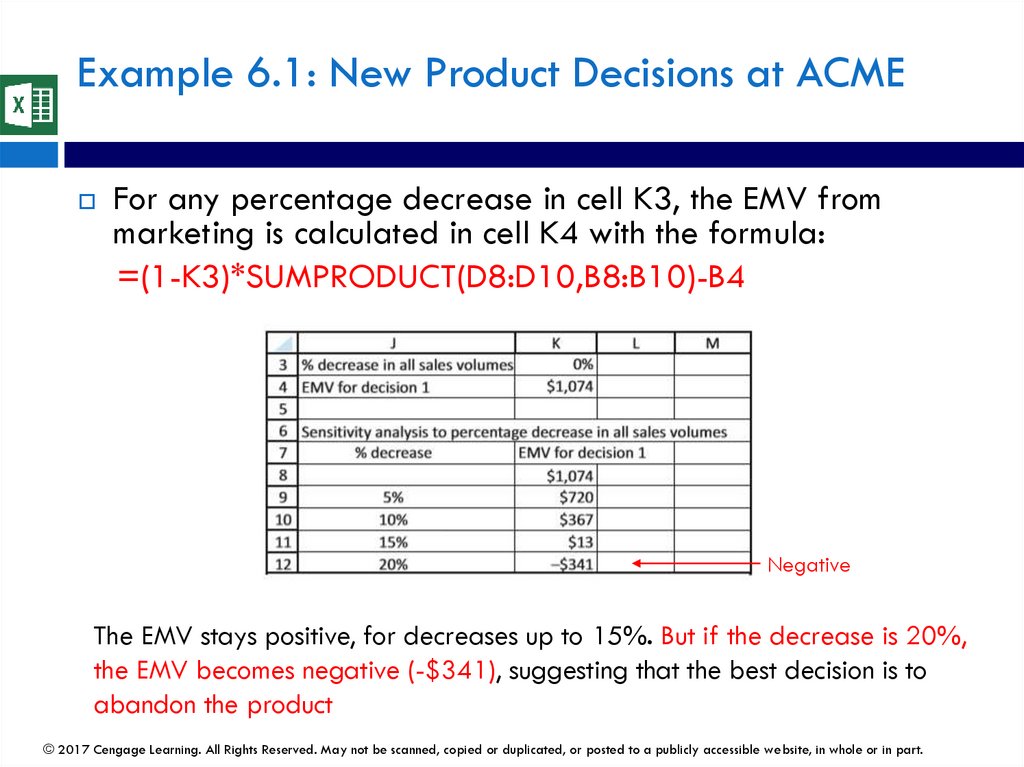
Example 6.1: New Product Decisions at ACMEFor any percentage decrease in cell K3, the EMV from
marketing is calculated in cell K4 with the formula:
=(1-K3)*SUMPRODUCT(D8:D10,B8:B10)-B4
Negative
The EMV stays positive, for decreases up to 15%. But if the decrease is 20%,
the EMV becomes negative (-$341), suggesting that the best decision is to
abandon the product
© 2017 Cengage Learning. All Rights Reserved. May not be scanned, copied or duplicated, or posted to a publicly accessible website, in whole or in part.