


 Маркетинг
Похожие презентации:


")


Регрессионный анализ: оценка взаимосвязей
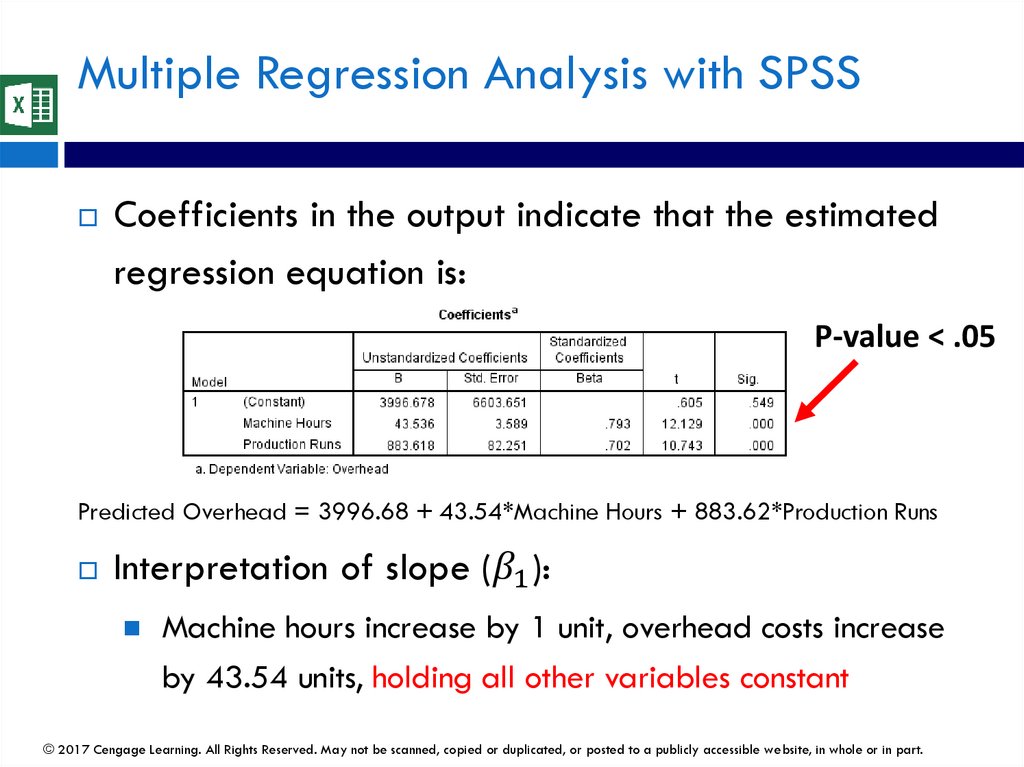
1.
Chapter 10Регрессионный анализ: оценка взаимосвязей
© 2017 Cengage Learning. All Rights Reserved. May not be scanned, copied or duplicated, or posted to a publicly accessible website, in whole or in part.
2.
Chapter 10Regression Analysis: Estimating Relationships
© 2017 Cengage Learning. All Rights Reserved. May not be scanned, copied or duplicated, or posted to a publicly accessible website, in whole or in part.
3.
Цель курсаОпределение и оценка корреляции
Применение простой линейной регрессии для
объяснения / прогнозирования зависимой
переменной от независимой переменной
Применение множественной линейной регрессии для
объяснения / прогнозирования зависимой переменной от
более чем двух независимых переменных
© 2017 Cengage Learning. All Rights Reserved. May not be scanned, copied or duplicated, or posted to a publicly accessible website, in whole or in part.
4.
Course ObjectiveDefine and evaluate correlation
Apply simple linear regression to
explain/predict a dependent variable from an
independent variable
Apply multiple linear regression to explain/predict a
dependent variable from more than two independent
variables
© 2017 Cengage Learning. All Rights Reserved. May not be scanned, copied or duplicated, or posted to a publicly accessible website, in whole or in part.
5.
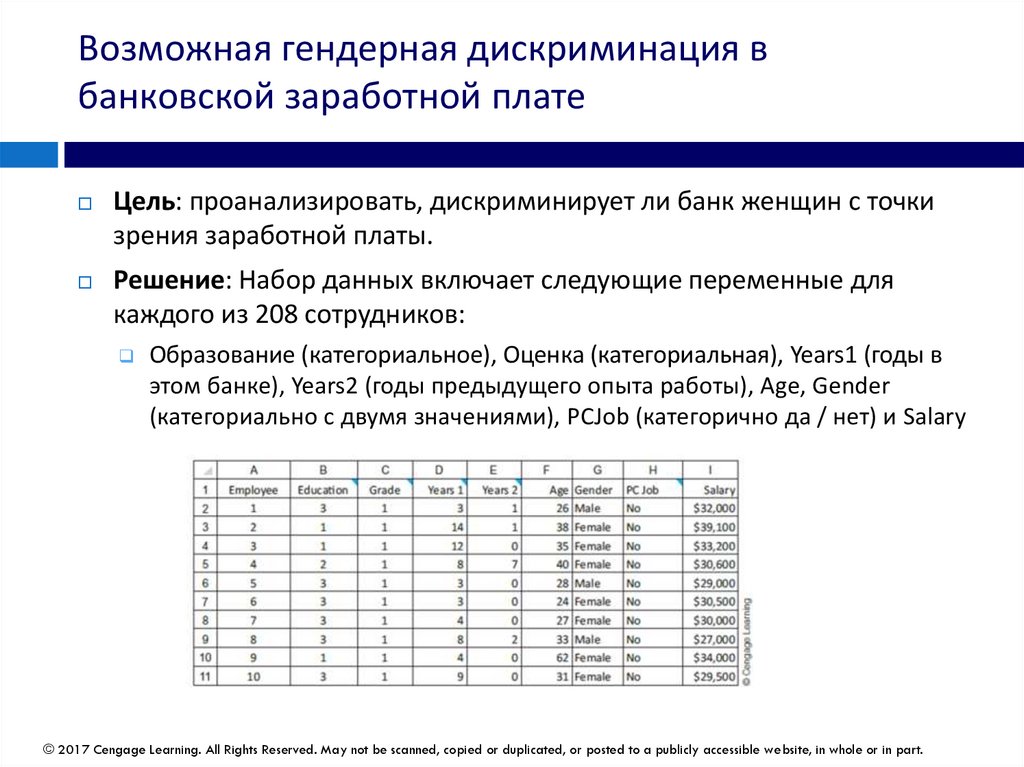
ВступлениеРегрессионный анализ - это изучение взаимосвязей
между переменными.
Потенциальные цели регрессионного анализа - объяснить
причинно-следственные связи и сделать прогнозы.
Анализируются два основных типа данных:
Поперечные данные обычно представляют собой данные,
собранные примерно за один и тот же период времени от
популяции.
Данные временных рядов включают одну или несколько
переменных, которые наблюдаются в несколько, обычно через
равные промежутки времени, моменты времени.
© 2017 Cengage Learning. All Rights Reserved. May not be scanned, copied or duplicated, or posted to a publicly accessible website, in whole or in part.
6.
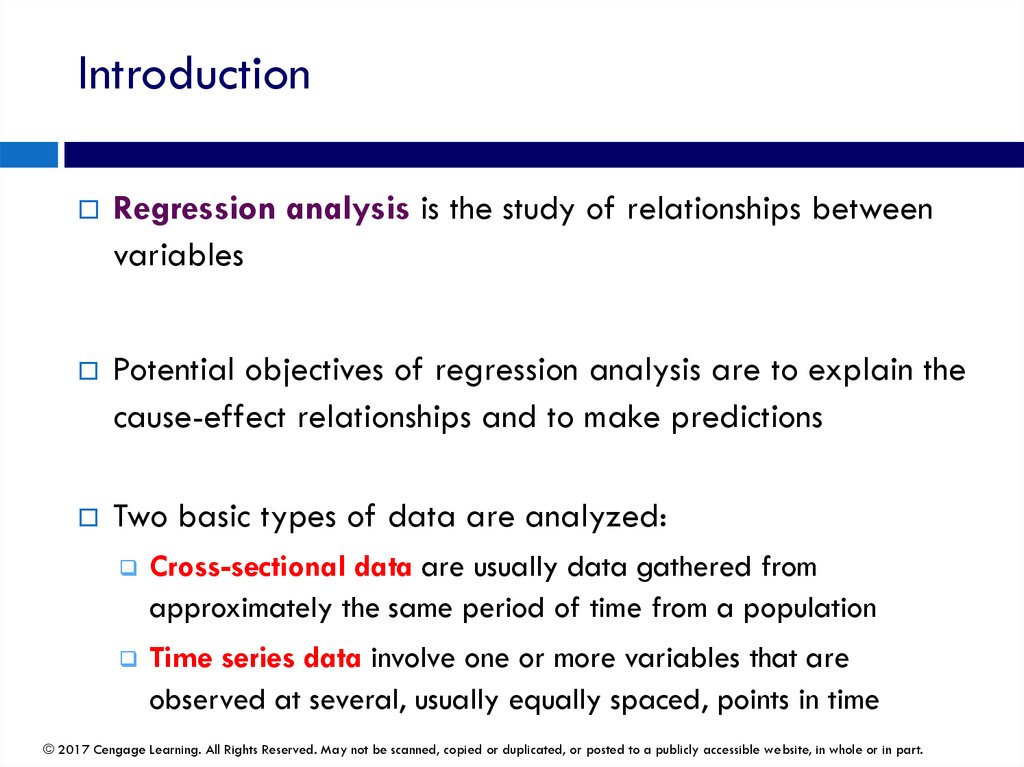
IntroductionRegression analysis is the study of relationships between
variables
Potential objectives of regression analysis are to explain the
cause-effect relationships and to make predictions
Two basic types of data are analyzed:
Cross-sectional data are usually data gathered from
approximately the same period of time from a population
Time series data involve one or more variables that are
observed at several, usually equally spaced, points in time
© 2017 Cengage Learning. All Rights Reserved. May not be scanned, copied or duplicated, or posted to a publicly accessible website, in whole or in part.
7.
ВступлениеВ каждом регрессионном исследовании есть одна
переменная, которую мы пытаемся объяснить или
предсказать, она называется зависимой переменной.
Это также называется переменной ответа или целевой
переменной.
Чтобы помочь объяснить или предсказать зависимую
переменную, мы используем одну или несколько
независимых переменных.
Их также называют независимыми или предикторами.
© 2017 Cengage Learning. All Rights Reserved. May not be scanned, copied or duplicated, or posted to a publicly accessible website, in whole or in part.
8.
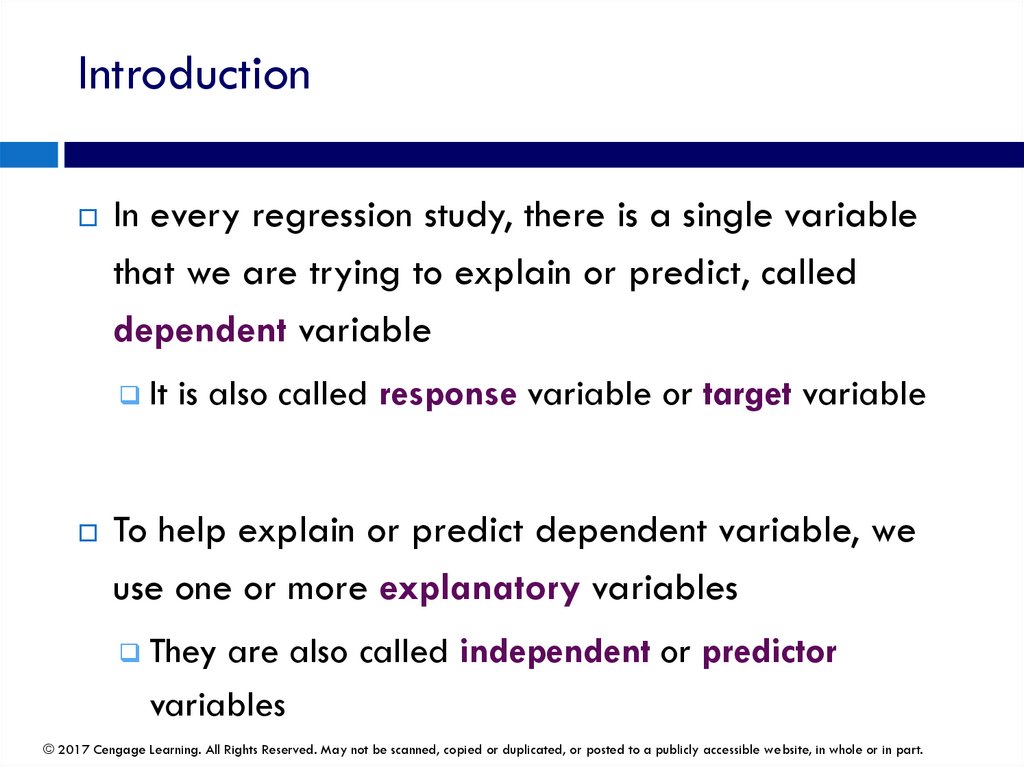
IntroductionIn every regression study, there is a single variable
that we are trying to explain or predict, called
dependent variable
It is also called response variable or target variable
To help explain or predict dependent variable, we
use one or more explanatory variables
They are also called independent or predictor
variables
© 2017 Cengage Learning. All Rights Reserved. May not be scanned, copied or duplicated, or posted to a publicly accessible website, in whole or in part.
9.
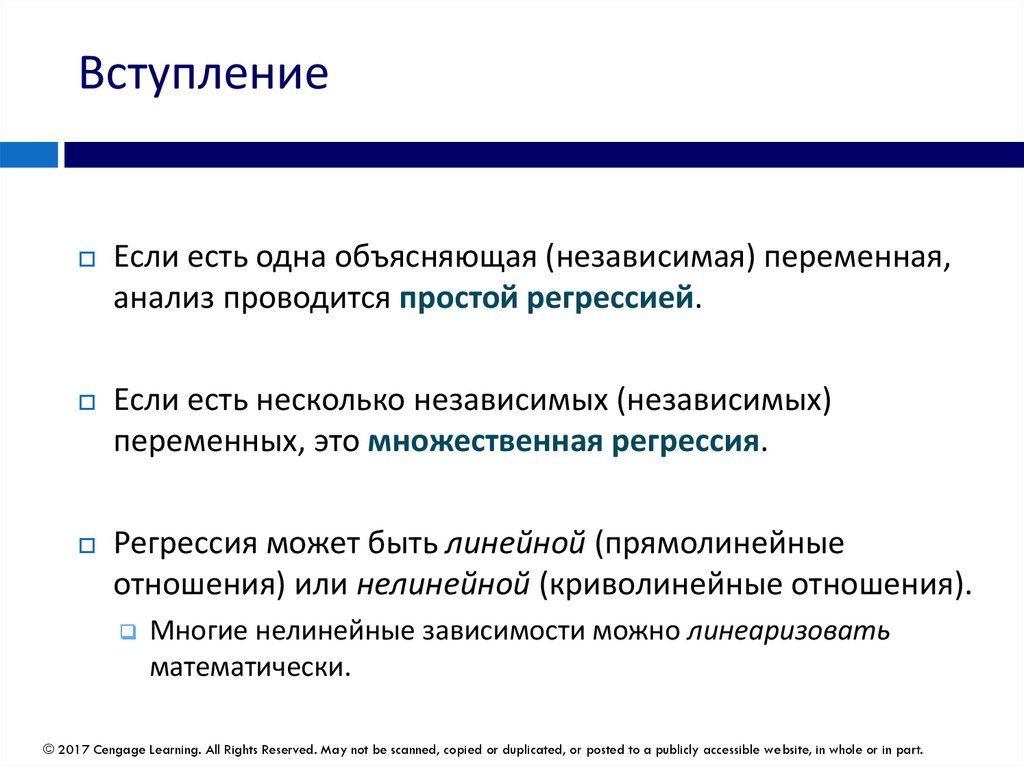
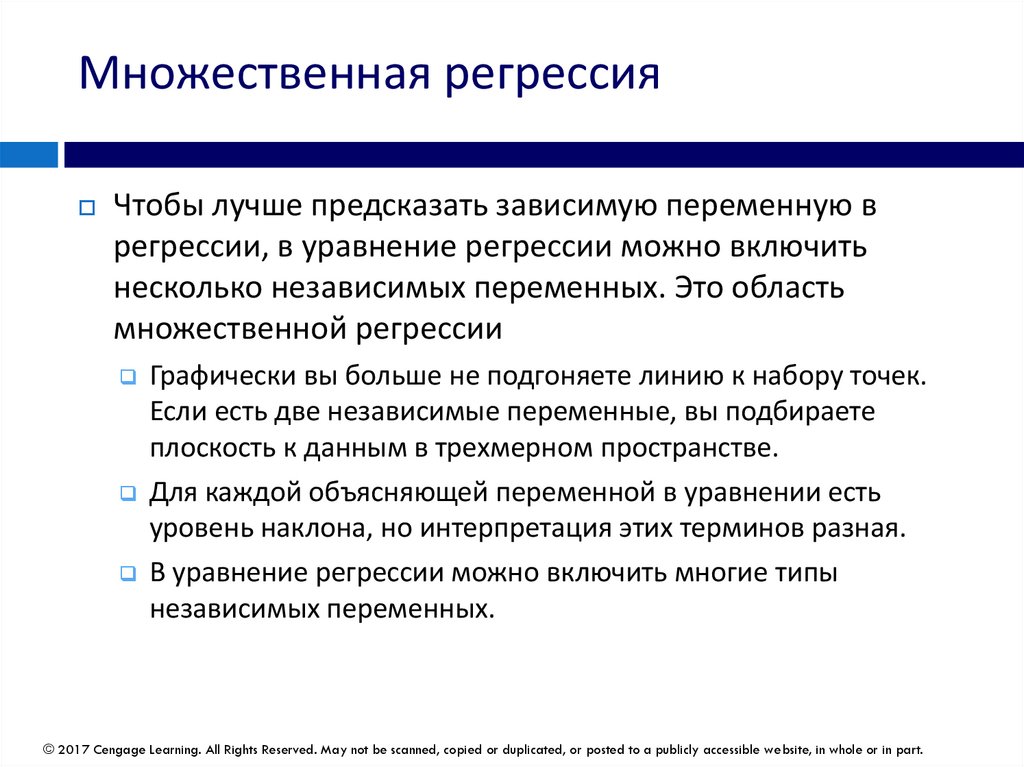
ВступлениеЕсли есть одна объясняющая (независимая) переменная,
анализ проводится простой регрессией.
Если есть несколько независимых (независимых)
переменных, это множественная регрессия.
Регрессия может быть линейной (прямолинейные
отношения) или нелинейной (криволинейные отношения).
Многие нелинейные зависимости можно линеаризовать
математически.
© 2017 Cengage Learning. All Rights Reserved. May not be scanned, copied or duplicated, or posted to a publicly accessible website, in whole or in part.
10.
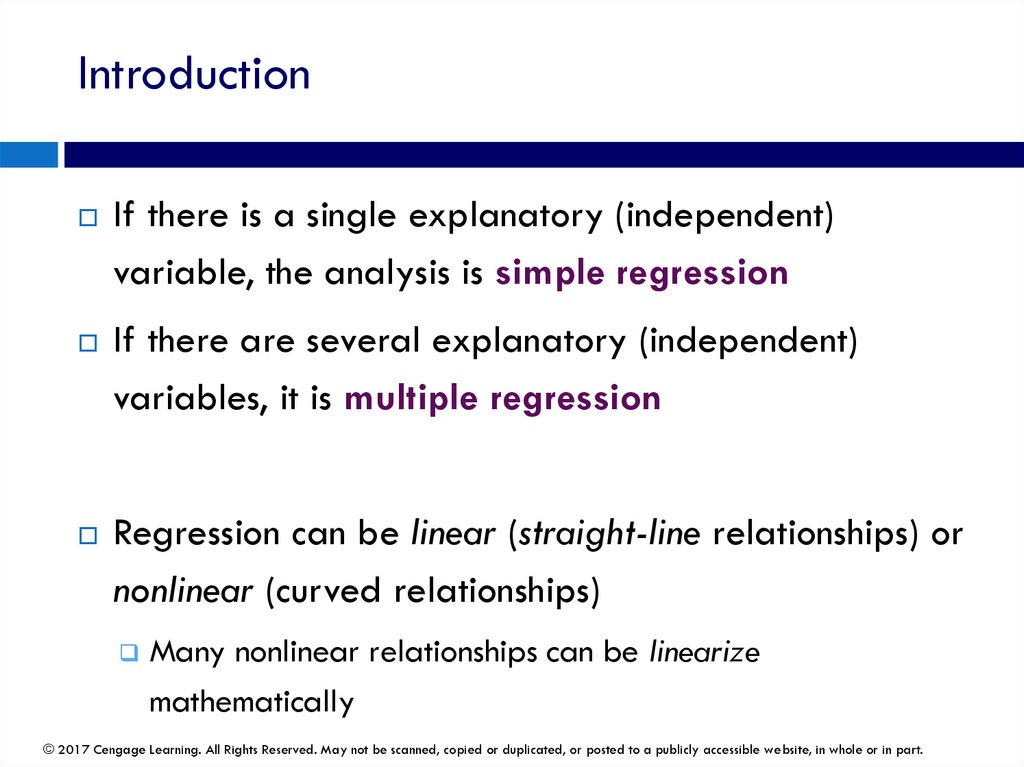
IntroductionIf there is a single explanatory (independent)
variable, the analysis is simple regression
If there are several explanatory (independent)
variables, it is multiple regression
Regression can be linear (straight-line relationships) or
nonlinear (curved relationships)
Many nonlinear relationships can be linearize
mathematically
© 2017 Cengage Learning. All Rights Reserved. May not be scanned, copied or duplicated, or posted to a publicly accessible website, in whole or in part.
11.
Диаграммы рассеяния: графическиезависимости
Рисование диаграмм рассеяния - хороший способ
начать регрессионный анализ
Диаграмма рассеяния - это график двух
переменных, X и Y
Если есть какая-либо связь между двумя
переменными, это обычно видно из диаграммы
рассеяния.
© 2017 Cengage Learning. All Rights Reserved. May not be scanned, copied or duplicated, or posted to a publicly accessible website, in whole or in part.
12.
Scatterplots: Graphing RelationshipsDrawing scatterplots is a good way to begin
regression analysis
Scatterplot is a graphical plot of two variables, X
and Y
If there is any relationship between two variables, it is
usually apparent from scatterplot
© 2017 Cengage Learning. All Rights Reserved. May not be scanned, copied or duplicated, or posted to a publicly accessible website, in whole or in part.
13.
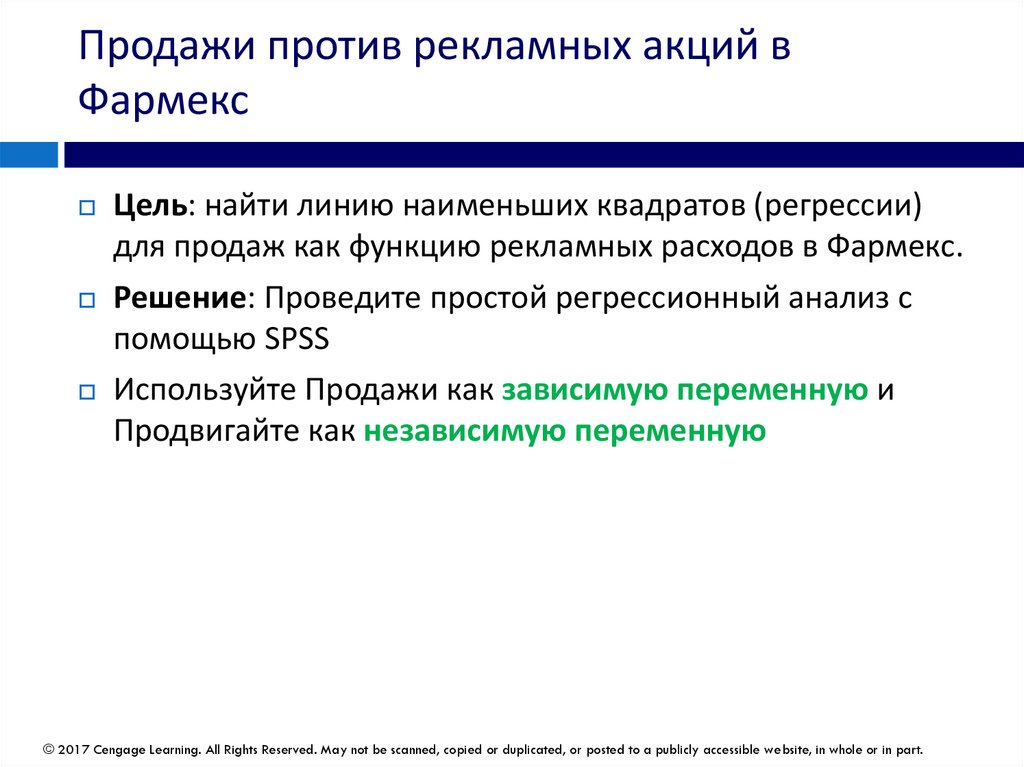
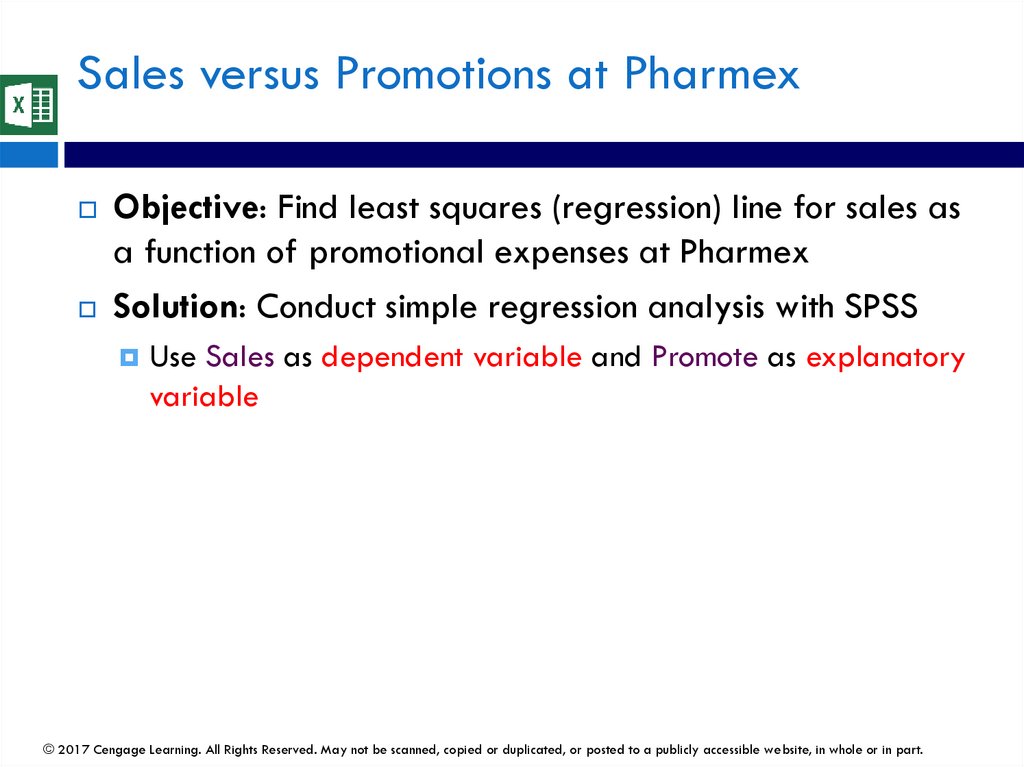
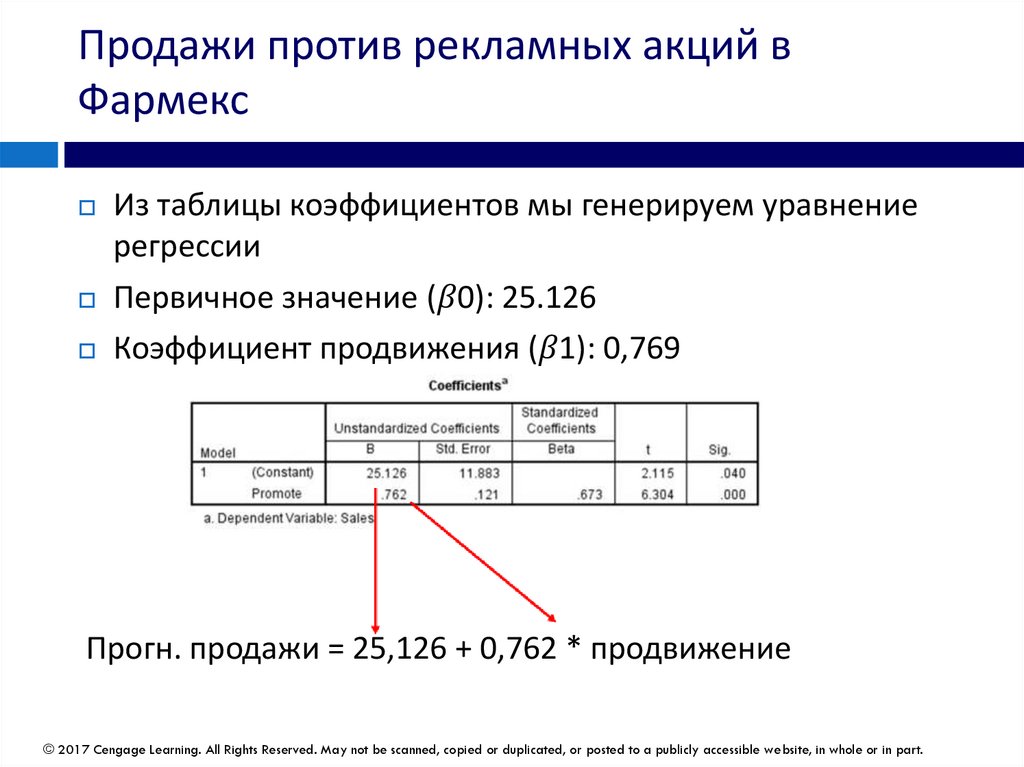
Продажи против рекламных акций вФармекс
Цель: использовать диаграмму рассеяния, чтобы изучить
взаимосвязь между рекламными расходами и
продажами.
Решение: Фармекс собирает данные из 50 случайно
выбранных столичных регионов.
Есть две переменные:
Расходы Фармекс на рекламу в процентах от расходов
ведущего конкурента («Продвигать»)
Продажи Фармекс в процентах от продаж ведущего конкурента
(«Продажи»)
© 2017 Cengage Learning. All Rights Reserved. May not be scanned, copied or duplicated, or posted to a publicly accessible website, in whole or in part.
14.
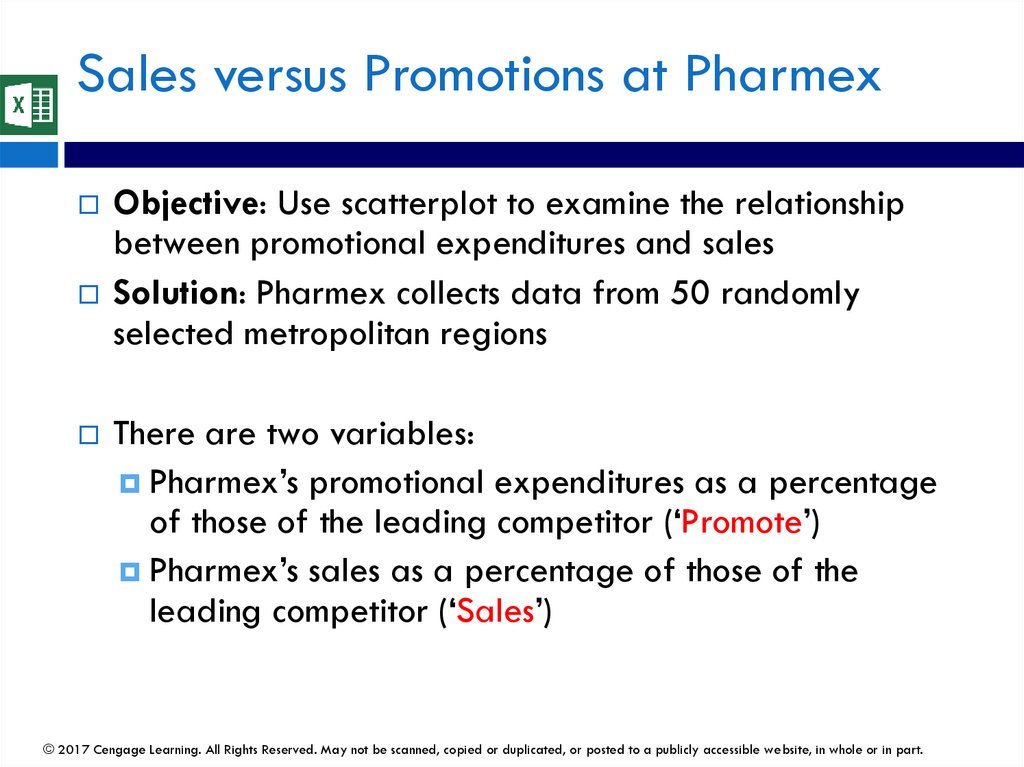
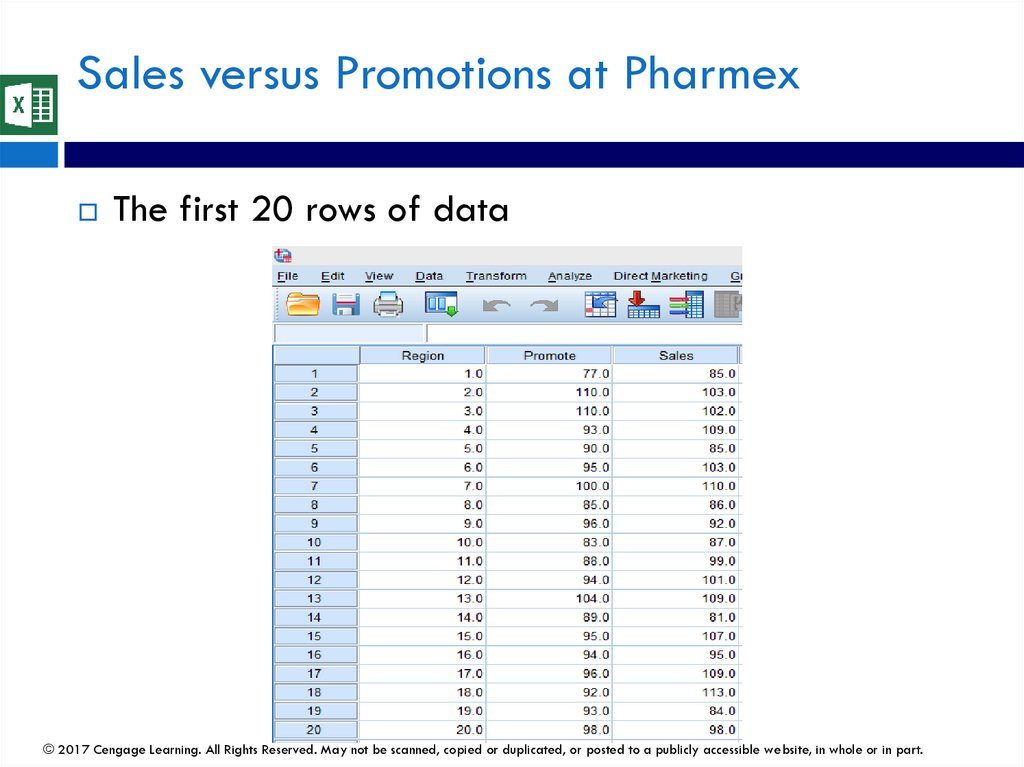
Sales versus Promotions at PharmexObjective: Use scatterplot to examine the relationship
between promotional expenditures and sales
Solution: Pharmex collects data from 50 randomly
selected metropolitan regions
There are two variables:
Pharmex’s promotional expenditures as a percentage
of those of the leading competitor (‘Promote’)
Pharmex’s sales as a percentage of those of the
leading competitor (‘Sales’)
© 2017 Cengage Learning. All Rights Reserved. May not be scanned, copied or duplicated, or posted to a publicly accessible website, in whole or in part.
15.
Продажи против рекламных акций вФармекс
Создать диаграмму рассеяния для изучения
взаимосвязи между рекламными расходами и
продажами.
Во-первых, откройте программное обеспечение SPSS.
Во-вторых, открытый набор данных (Продажи в аптеке)
Файл, Открыть, Данные из меню SPSS
Выберите тип файла, который вы хотите открыть, Excel (* .xls
* .xlsx, * .xlsm)
Выберите имя файла (Продажи в аптеке)
Нажмите "Прочитать имена переменных", если первая
строка таблицы содержит заголовки столбцов.
Нажмите "Открыть"
© 2017 Cengage Learning. All Rights Reserved. May not be scanned, copied or duplicated, or posted to a publicly accessible website, in whole or in part.
16.
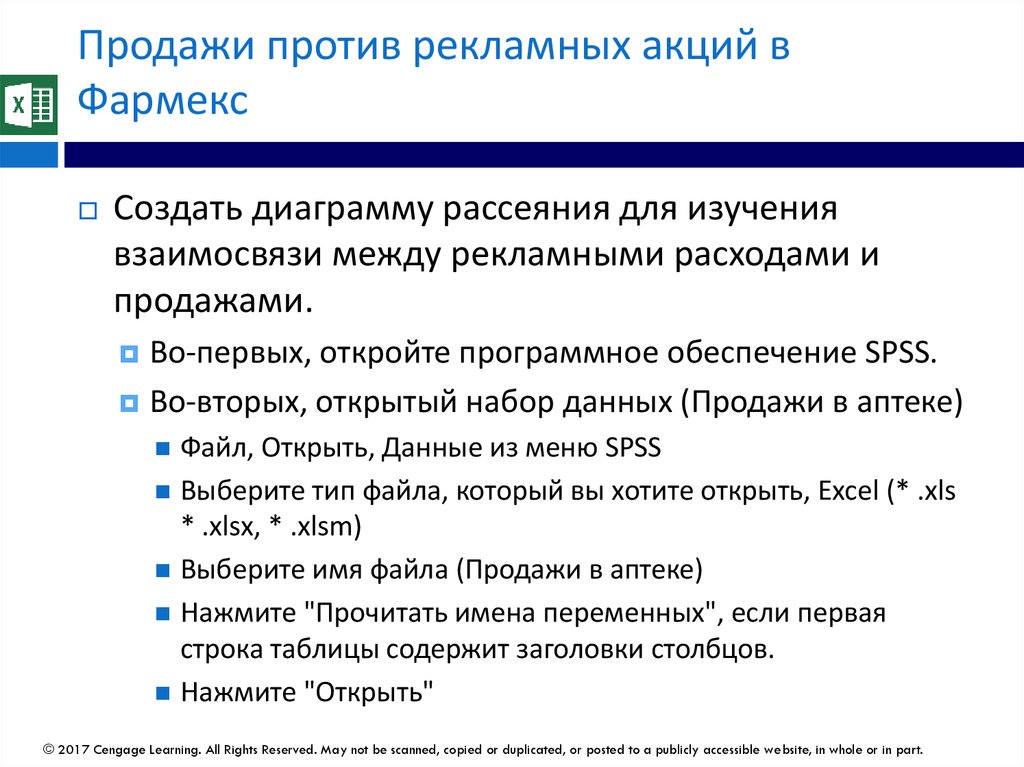
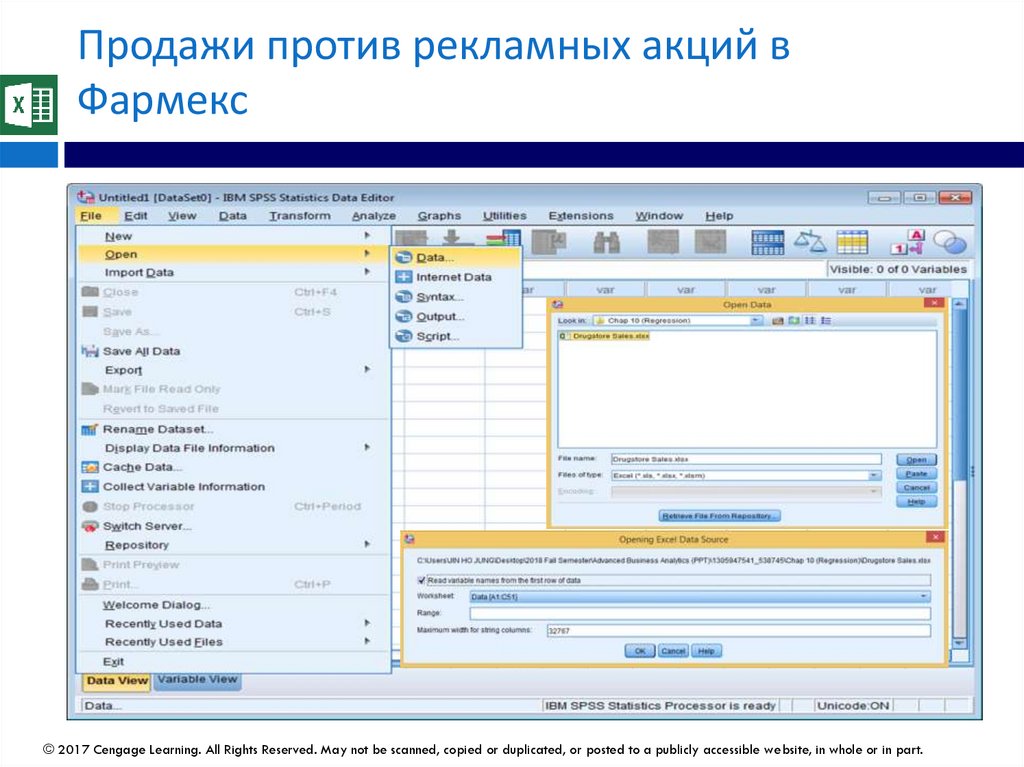
Sales versus Promotions at PharmexTo generate scatterplot to examine the relationship
between promotional expenditures and sales
First, open SPSS software
Second, open dataset (Drugstore Sales)
File, Open, Data, from the SPSS menu
Select type of file you want to open, Excel (*.xls *.xlsx, *.xlsm)
Select file name (Drugstore Sales)
Click ‘Read variable names’ if the first row of the spreadsheet
contains column headings
Click Open
© 2017 Cengage Learning. All Rights Reserved. May not be scanned, copied or duplicated, or posted to a publicly accessible website, in whole or in part.
17.
Продажи против рекламных акций вФармекс
© 2017 Cengage Learning. All Rights Reserved. May not be scanned, copied or duplicated, or posted to a publicly accessible website, in whole or in part.
18.
Sales versus Promotions at Pharmex© 2017 Cengage Learning. All Rights Reserved. May not be scanned, copied or duplicated, or posted to a publicly accessible website, in whole or in part.
19.
Продажи против рекламных акций вФармекс
Первые 20 строк данных
© 2017 Cengage Learning. All Rights Reserved. May not be scanned, copied or duplicated, or posted to a publicly accessible website, in whole or in part.
20.
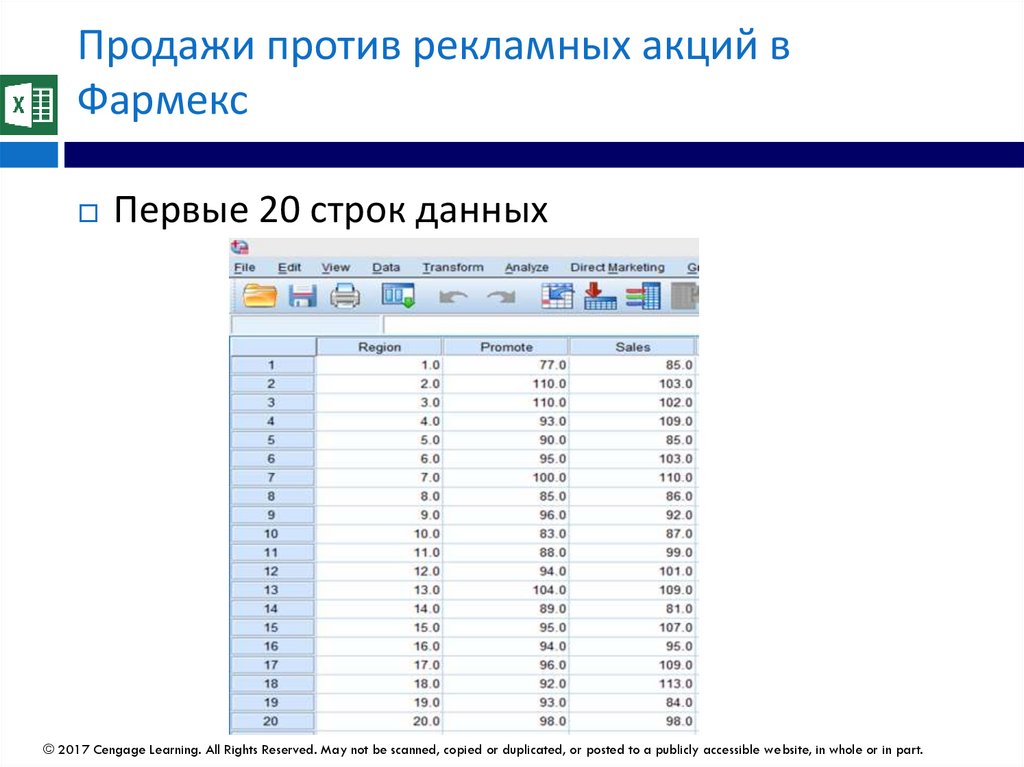
Sales versus Promotions at PharmexThe first 20 rows of data
© 2017 Cengage Learning. All Rights Reserved. May not be scanned, copied or duplicated, or posted to a publicly accessible website, in whole or in part.
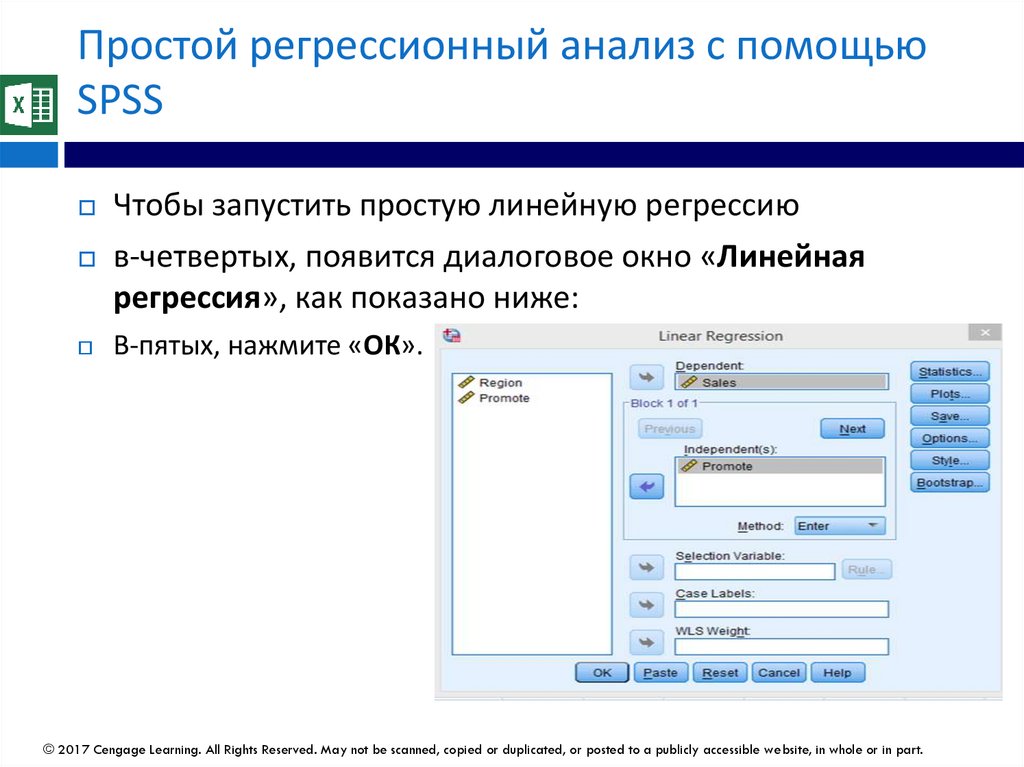
21.
Продажи против рекламных акций вФармекс
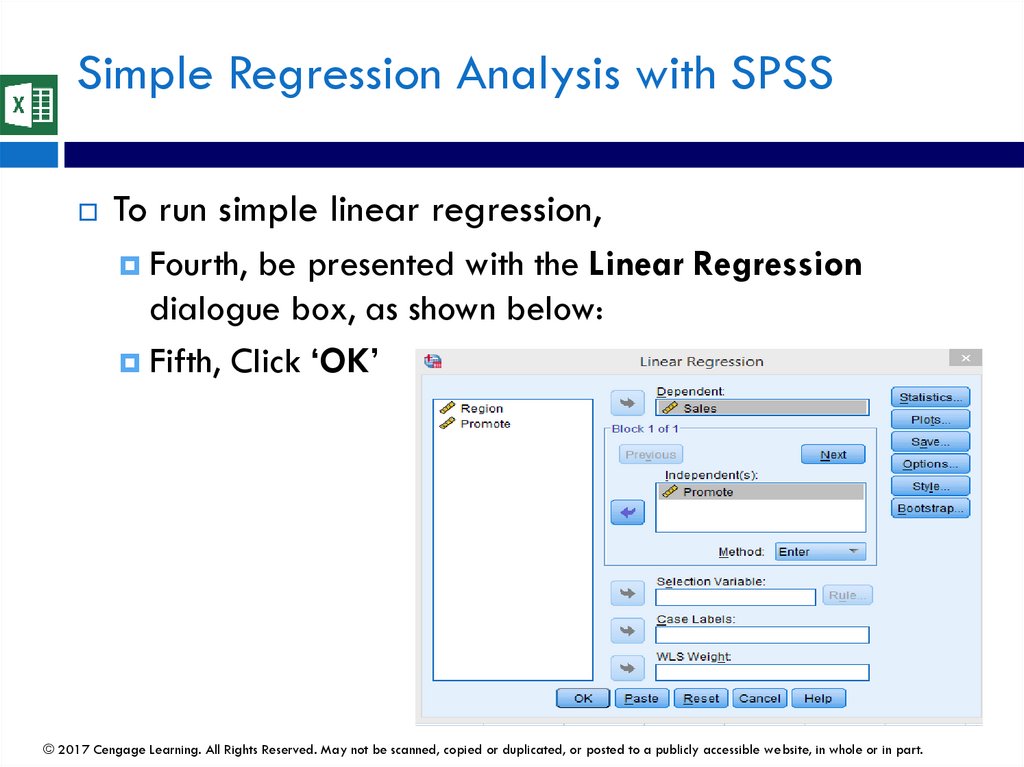
Чтобы создать диаграмму рассеяния,
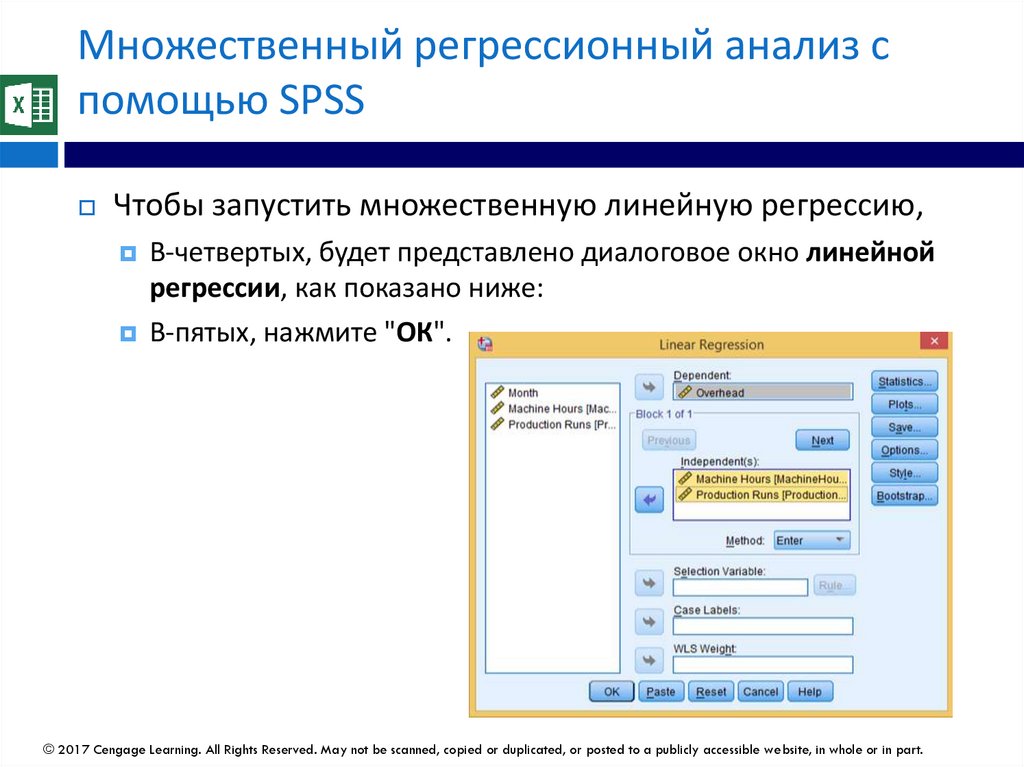
Во-вторых, представьте диалоговое окно построителя
диаграмм, как показано ниже:
Выберите «Точечный / Точечный» в разделе «Галерея».
Перетащите переменную «Продвигать» на «Ось X» и «Продажи» на
«Ось Y».
Нажмите "ОК"
© 2017 Cengage Learning. All Rights Reserved. May not be scanned, copied or duplicated, or posted to a publicly accessible website, in whole or in part.
22.
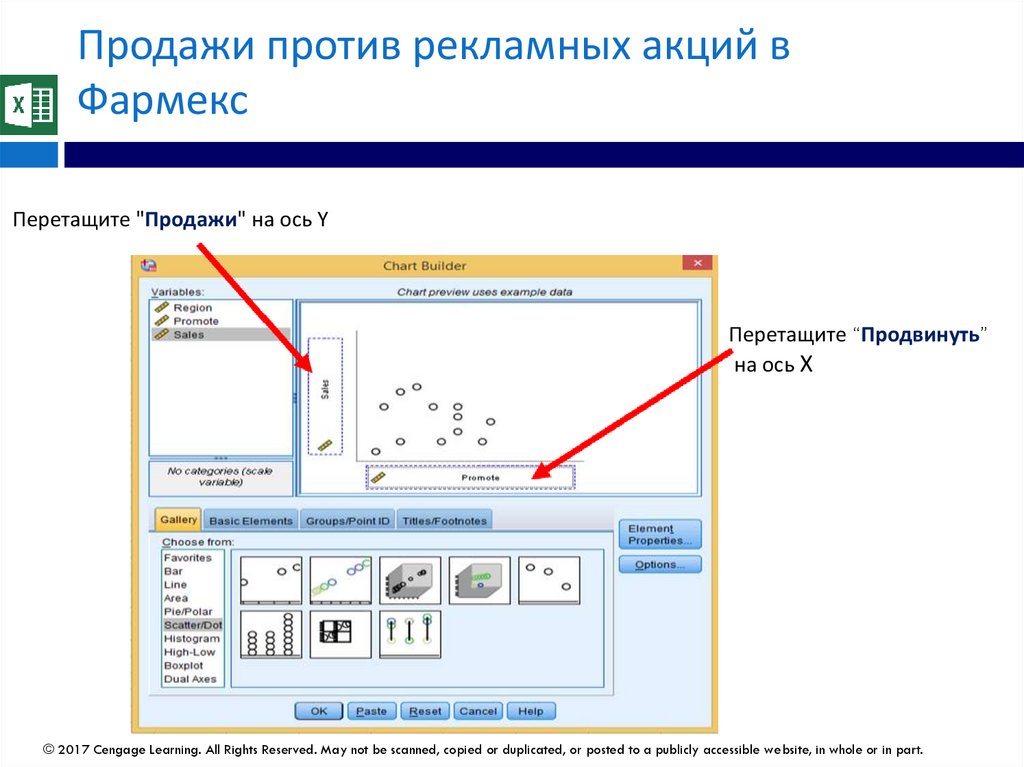
Sales versus Promotions at PharmexTo generate scatterplot,
Second, be presented with the Chart Builder dialogue box,
as shown below:
Select ‘Scatter/Dot’ under Gallery
Drag a variable ‘Promote’ to ‘X Axis’ and ‘Sales’ to ‘Y Axis’
Click ‘OK’
© 2017 Cengage Learning. All Rights Reserved. May not be scanned, copied or duplicated, or posted to a publicly accessible website, in whole or in part.
23.
Продажи против рекламных акций вФармекс
Перетащите "Продажи" на ось Y
Перетащите “Продвинуть”
на ось X
© 2017 Cengage Learning. All Rights Reserved. May not be scanned, copied or duplicated, or posted to a publicly accessible website, in whole or in part.
24.
Sales versus Promotions at PharmexDrag ‘Sales’ to Y-axis
Drag ‘Promote’ to X-axis
Продажи против рекламных акций в
Фармекс
© 2017 Cengage Learning. All Rights Reserved. May not be scanned, copied or duplicated, or posted to a publicly accessible website, in whole or in part.
25.
Продажи против рекламных акций вФармекс
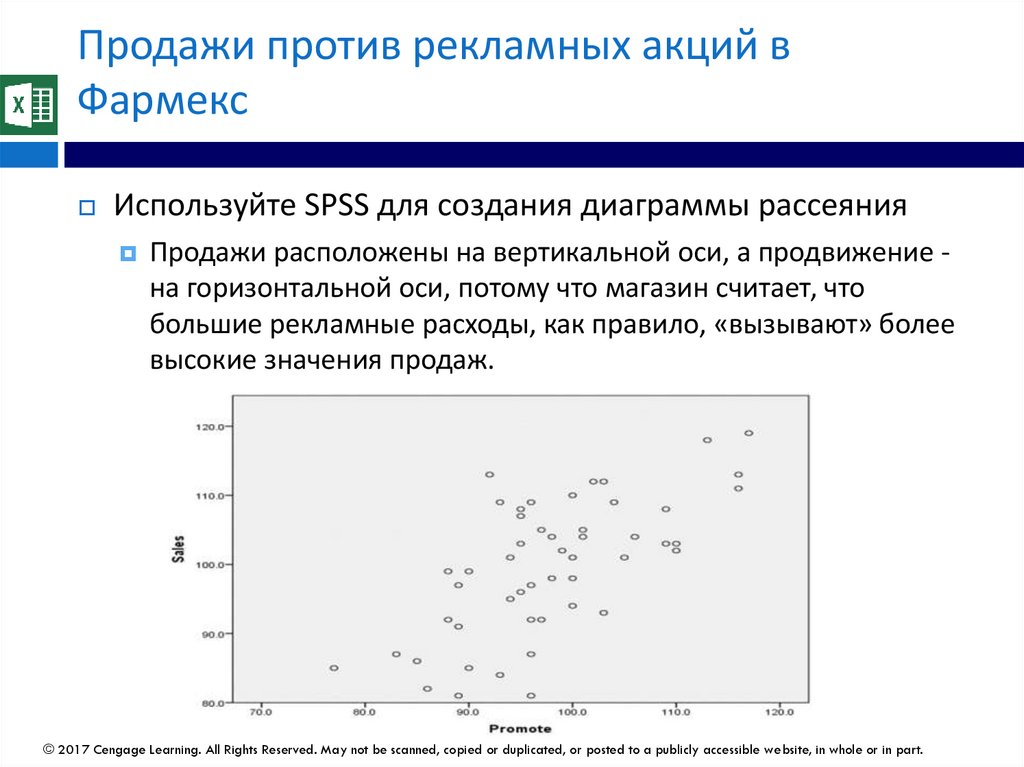
Используйте SPSS для создания диаграммы рассеяния
Продажи расположены на вертикальной оси, а продвижение -
на горизонтальной оси, потому что магазин считает, что
большие рекламные расходы, как правило, «вызывают» более
высокие значения продаж.
© 2017 Cengage Learning. All Rights Reserved. May not be scanned, copied or duplicated, or posted to a publicly accessible website, in whole or in part.
26.
Sales versus Promotions at PharmexUse SPSS to create scatterplot
Sales is on the vertical axis and Promote is on the horizontal
axis because the store believes that large promotional
expenditures tend to “cause” larger values of sales
© 2017 Cengage Learning. All Rights Reserved. May not be scanned, copied or duplicated, or posted to a publicly accessible website, in whole or in part.
27.
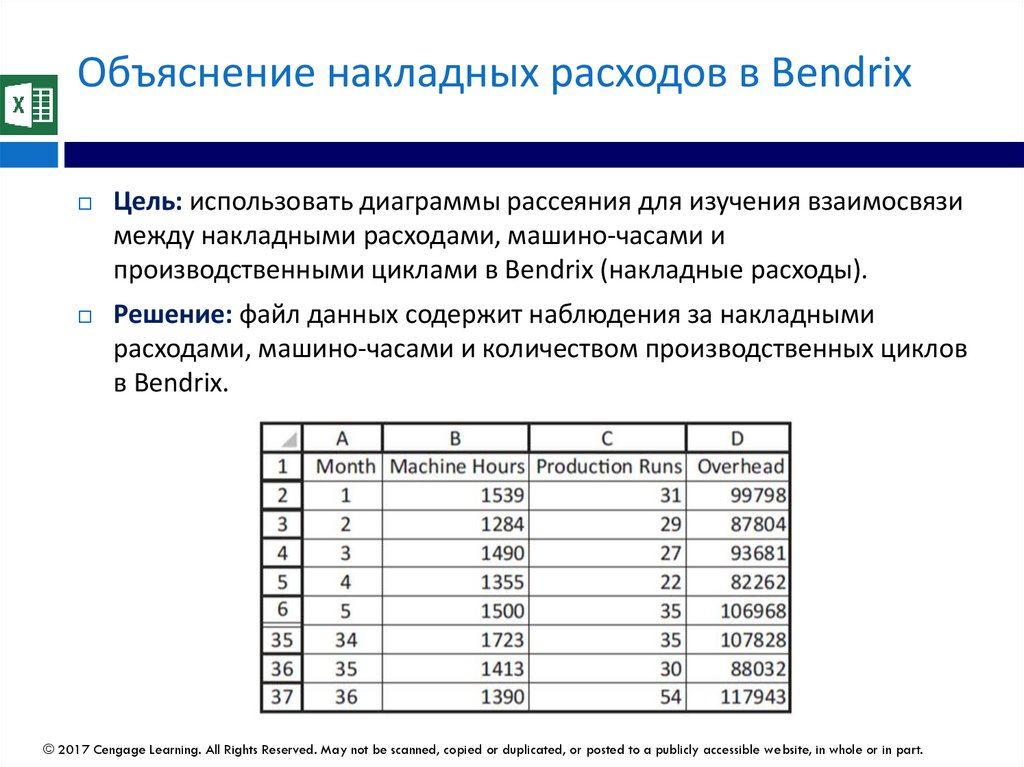
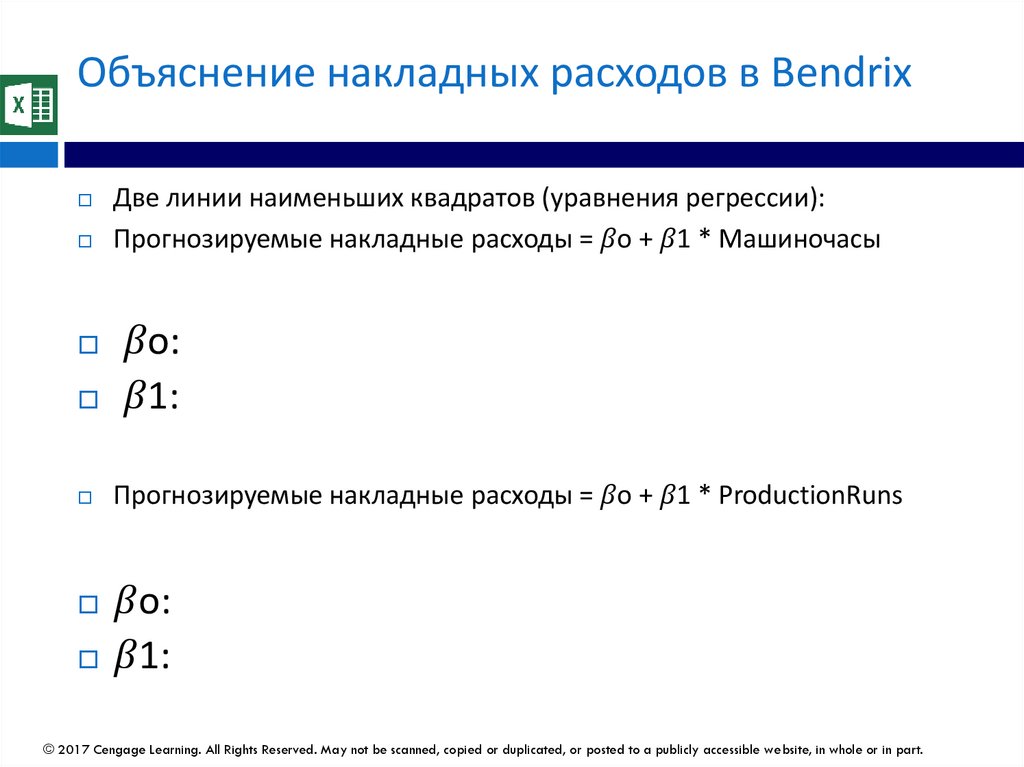
Объяснение накладных расходов в BendrixЦель: использовать диаграммы рассеяния для изучения взаимосвязи
между накладными расходами, машино-часами и
производственными циклами в Bendrix (накладные расходы).
Решение: файл данных содержит наблюдения за накладными
расходами, машино-часами и количеством производственных циклов
в Bendrix.
© 2017 Cengage Learning. All Rights Reserved. May not be scanned, copied or duplicated, or posted to a publicly accessible website, in whole or in part.
28.
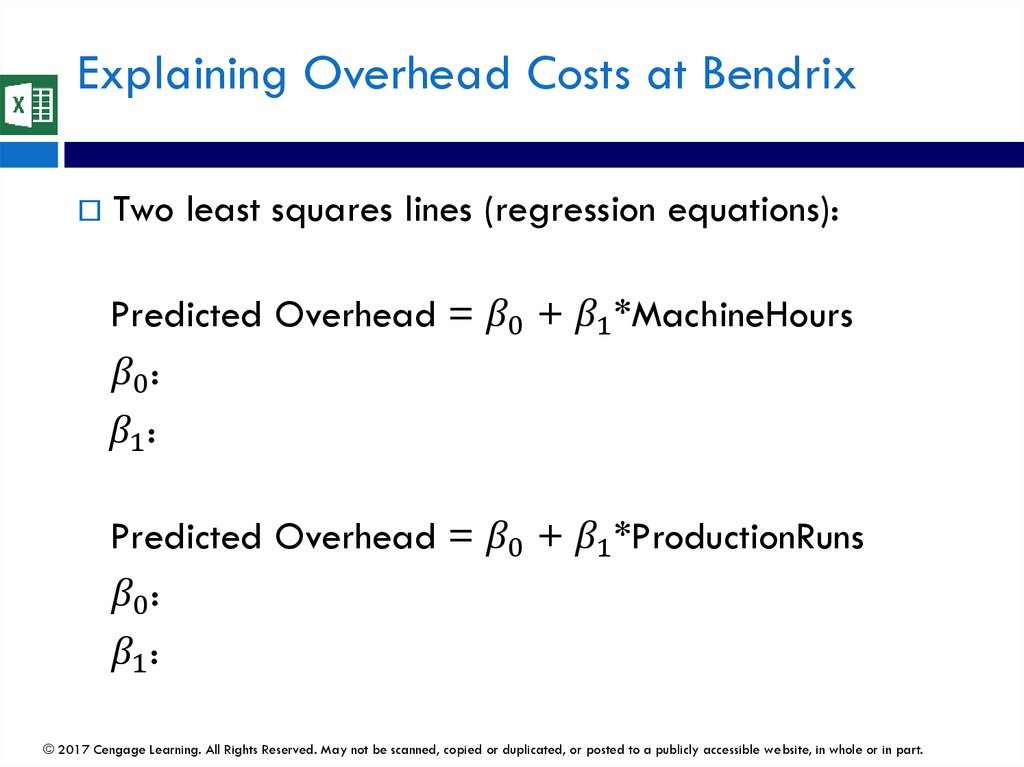
Explaining Overhead Costs at BendrixObjective: Use scatterplots to examine the relationships among
overhead, machine hours, and production runs at Bendrix
(Overhead Costs)
Solution: Data file contains observations of overhead costs,
machine hours, and number of production runs at Bendrix
© 2017 Cengage Learning. All Rights Reserved. May not be scanned, copied or duplicated, or posted to a publicly accessible website, in whole or in part.
29.
Объяснение накладных расходов в BendrixИспользуя предыдущий подход, изучите диаграммы
рассеяния между каждой независимой переменной
(количество машинных часов и производственные циклы)
и зависимой переменной (накладные расходы)
© 2017 Cengage Learning. All Rights Reserved. May not be scanned, copied or duplicated, or posted to a publicly accessible website, in whole or in part.
30.
Explaining Overhead Costs at BendrixWith the previous approach, examine scatterplots between
each explanatory variable (Machine Hours and Production
Runs) and dependent variable (Overhead)
© 2017 Cengage Learning. All Rights Reserved. May not be scanned, copied or duplicated, or posted to a publicly accessible website, in whole or in part.
31.
Линейные и нелинейные отношенияДиаграммы рассеяния полезны для выявления взаимосвязей,
которые могут быть неочевидными.
Типичные отношения, которые вы надеетесь увидеть, - это
прямолинейные (линейные) отношения.
Это не означает, что все точки лежат на прямой линии, это не означает, что
точки имеют тенденцию группироваться вокруг прямой линии.
Диаграмма рассеяния ниже иллюстрирует нелинейную зависимость
© 2017 Cengage Learning. All Rights Reserved. May not be scanned, copied or duplicated, or posted to a publicly accessible website, in whole or in part.
32.
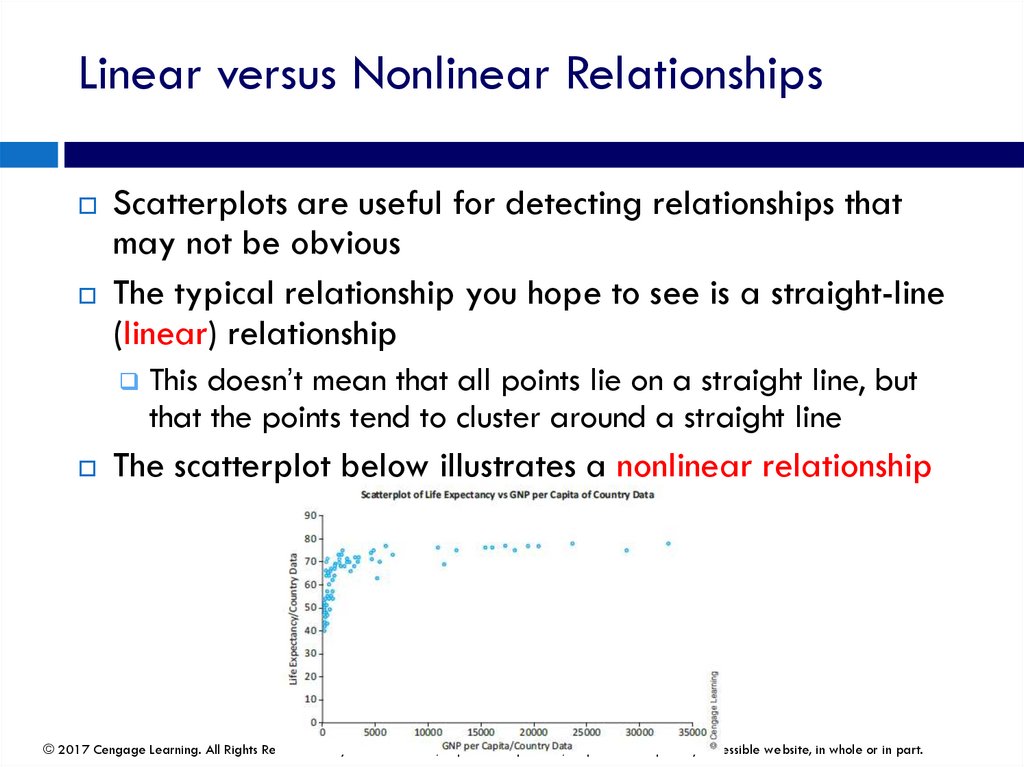
Linear versus Nonlinear RelationshipsScatterplots are useful for detecting relationships that
may not be obvious
The typical relationship you hope to see is a straight-line
(linear) relationship
This doesn’t mean that all points lie on a straight line, but
that the points tend to cluster around a straight line
The scatterplot below illustrates a nonlinear relationship
© 2017 Cengage Learning. All Rights Reserved. May not be scanned, copied or duplicated, or posted to a publicly accessible website, in whole or in part.
33.
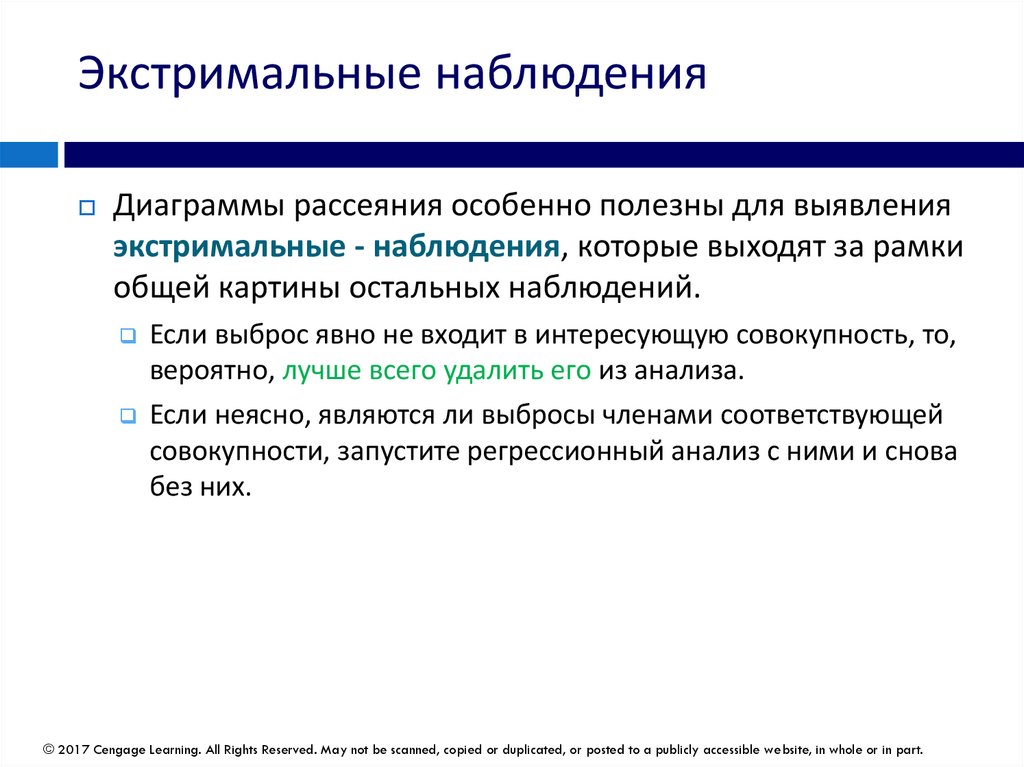
Экстримальные наблюденияДиаграммы рассеяния особенно полезны для выявления
экстримальные - наблюдения, которые выходят за рамки
общей картины остальных наблюдений.
Если выброс явно не входит в интересующую совокупность, то,
вероятно, лучше всего удалить его из анализа.
Если неясно, являются ли выбросы членами соответствующей
совокупности, запустите регрессионный анализ с ними и снова
без них.
© 2017 Cengage Learning. All Rights Reserved. May not be scanned, copied or duplicated, or posted to a publicly accessible website, in whole or in part.
34.
OutliersScatterplots are especially useful for identifying
outliers—observations that fall outside of the
general pattern of the rest of the observations
If an outlier is clearly not a member of the population of
interest, then it is probably best to delete it from the
analysis
If it isn’t clear whether outliers are members of the relevant
population, run the regression analysis with them and again
without them
© 2017 Cengage Learning. All Rights Reserved. May not be scanned, copied or duplicated, or posted to a publicly accessible website, in whole or in part.
35.
Экстримальные наблюденияНа рисунке ниже выброс (точка в правом верхнем углу) это генеральный директор компании(CEO), чья зарплата
намного выше, чем у всех других сотрудников.
Экстрим
© 2017 Cengage Learning. All Rights Reserved. May not be scanned, copied or duplicated, or posted to a publicly accessible website, in whole or in part.
36.
OutliersIn the figure below, the outlier (the point at the top right) is the
company CEO, whose salary is well above that of all of the
other employees
Outlier!
© 2017 Cengage Learning. All Rights Reserved. May not be scanned, copied or duplicated, or posted to a publicly accessible website, in whole or in part.
37.
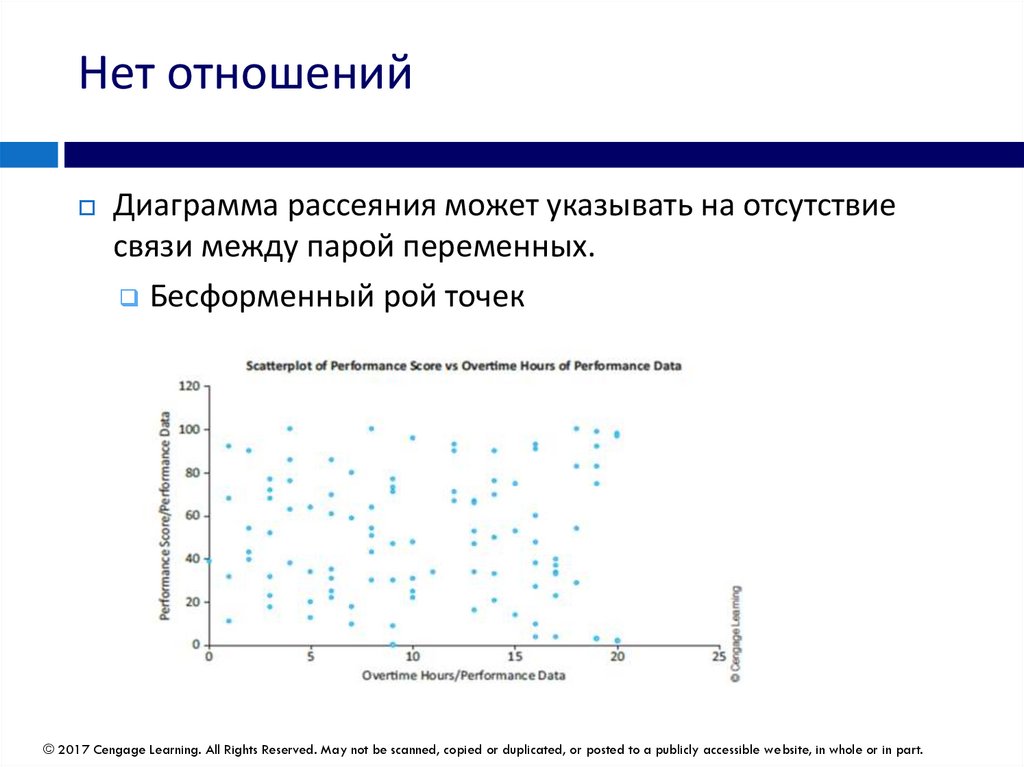
Нет отношенийДиаграмма рассеяния может указывать на отсутствие
связи между парой переменных.
Бесформенный рой точек
© 2017 Cengage Learning. All Rights Reserved. May not be scanned, copied or duplicated, or posted to a publicly accessible website, in whole or in part.
38.
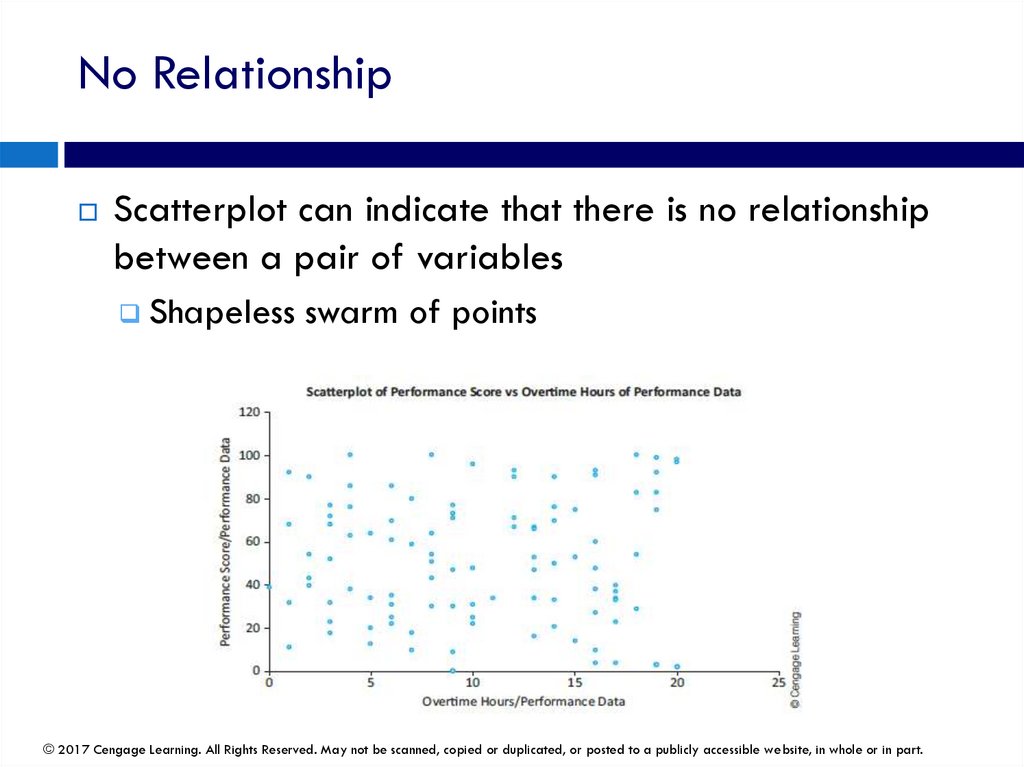
No RelationshipScatterplot can indicate that there is no relationship
between a pair of variables
Shapeless swarm of points
© 2017 Cengage Learning. All Rights Reserved. May not be scanned, copied or duplicated, or posted to a publicly accessible website, in whole or in part.
39.
Корреляции: индикаторы линейныхотношений
Корреляции - это числовые сводные меры,
которые указывают на силу линейных отношений
между парами переменных (непрерывные
переменные).
Он измеряет только силу линейных отношений.
Обычное обозначение корреляции между
переменными X и Y - rxy.
© 2017 Cengage Learning. All Rights Reserved. May not be scanned, copied or duplicated, or posted to a publicly accessible website, in whole or in part.
40.
Correlations: Indicators of Linear RelationshipsCorrelations are numerical summary measures that
indicate the strength of linear relationships between
pairs of variables (continuous variables)
It measures the strength of linear relationships only
The usual notation for a correlation between variables
X and Y is rxy
© 2017 Cengage Learning. All Rights Reserved. May not be scanned, copied or duplicated, or posted to a publicly accessible website, in whole or in part.
41.
Корреляции: индикаторы линейныхотношений
По знаку корреляции можно определить, связаны
ли две переменные: положительно или
отрицательно.
Корреляция, равная 0 или близкая к 0, означает
практически отсутствие линейной зависимости.
Корреляция с величиной, близкой к 1, указывает на
сильную линейную зависимость.
Корреляция, равная -1 (отрицательная корреляция) или
+1 (положительная корреляция), возникает только
тогда, когда линейная связь между двумя
переменными идеальна.
© 2017 Cengage Learning. All Rights Reserved. May not be scanned, copied or duplicated, or posted to a publicly accessible website, in whole or in part.
42.
Correlations: Indicators of Linear RelationshipsBy looking at the sign of correlation, you can tell
whether two variables are positively or negatively
related
Correlation equal to 0 or near 0 indicates practically no linear
relationship
Correlation with magnitude close to 1 indicates a strong linear
relationship
Correlation equal to -1 (negative correlation) or
+1 (positive correlation) occurs only when the linear relationship
between two variables is perfect
© 2017 Cengage Learning. All Rights Reserved. May not be scanned, copied or duplicated, or posted to a publicly accessible website, in whole or in part.
43.
корреляцияКорреляционный анализ измеряет силу
линейной связи между двумя непрерывными
переменными.
Но нет различия между независимыми и
зависимыми переменными.
Корреляция между двумя переменными всегда
составляет от -1 до 1
© 2017 Cengage Learning. All Rights Reserved. May not be scanned, copied or duplicated, or posted to a publicly accessible website, in whole or in part.
44.
CorrelationCorrelation analysis measures the strength of the linear
association between two continuous variables
But, there is no distinction between independent and
dependent variables
Correlation between two variables are always between
-1 and 1
© 2017 Cengage Learning. All Rights Reserved. May not be scanned, copied or duplicated, or posted to a publicly accessible website, in whole or in part.
45.
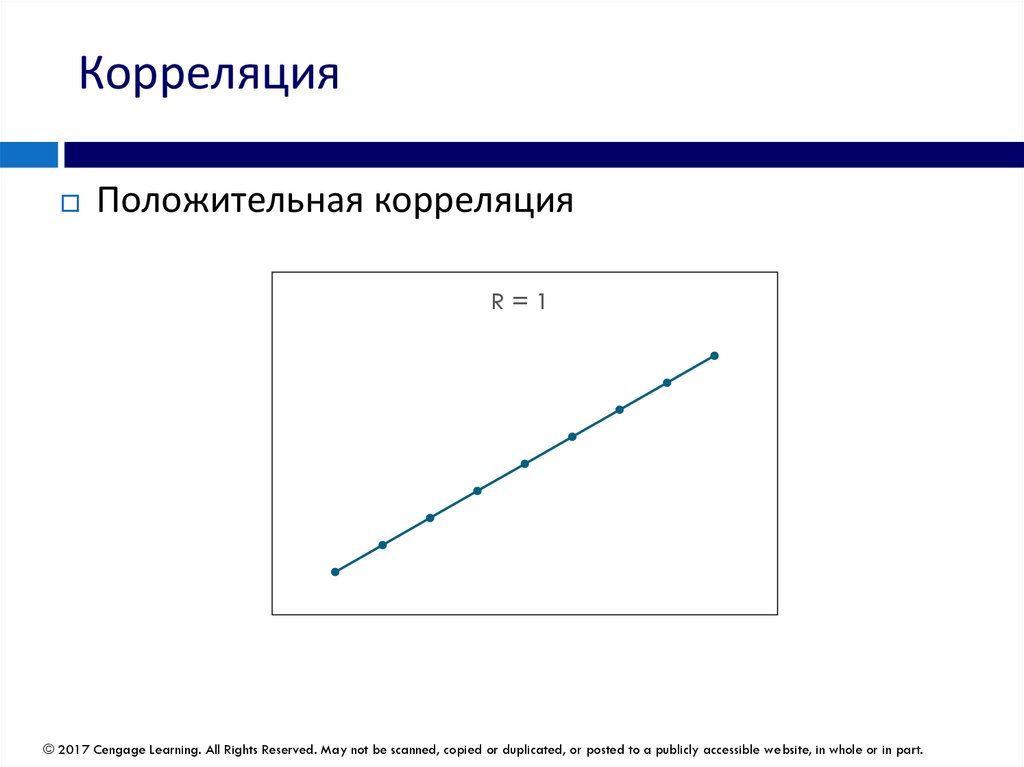
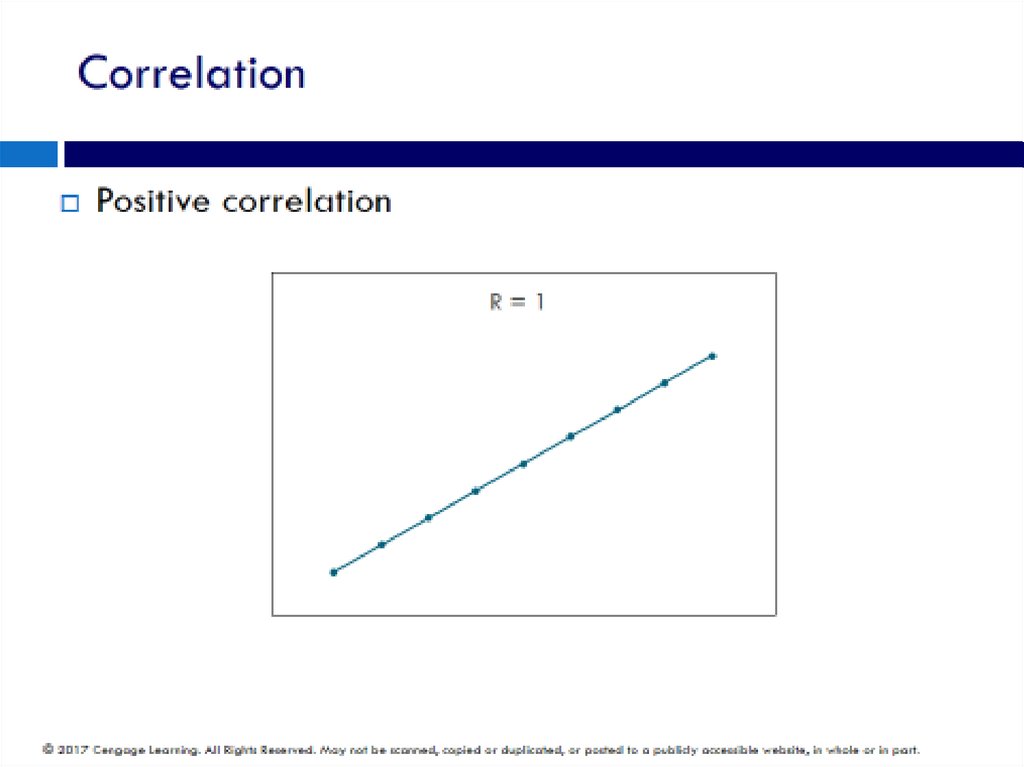
КорреляцияПоложительная корреляция
R=1
© 2017 Cengage Learning. All Rights Reserved. May not be scanned, copied or duplicated, or posted to a publicly accessible website, in whole or in part.
46.
© 2017 Cengage Learning. All Rights Reserved. May not be scanned, copied or duplicated, or posted to a publicly accessible website, in whole or in part.47.
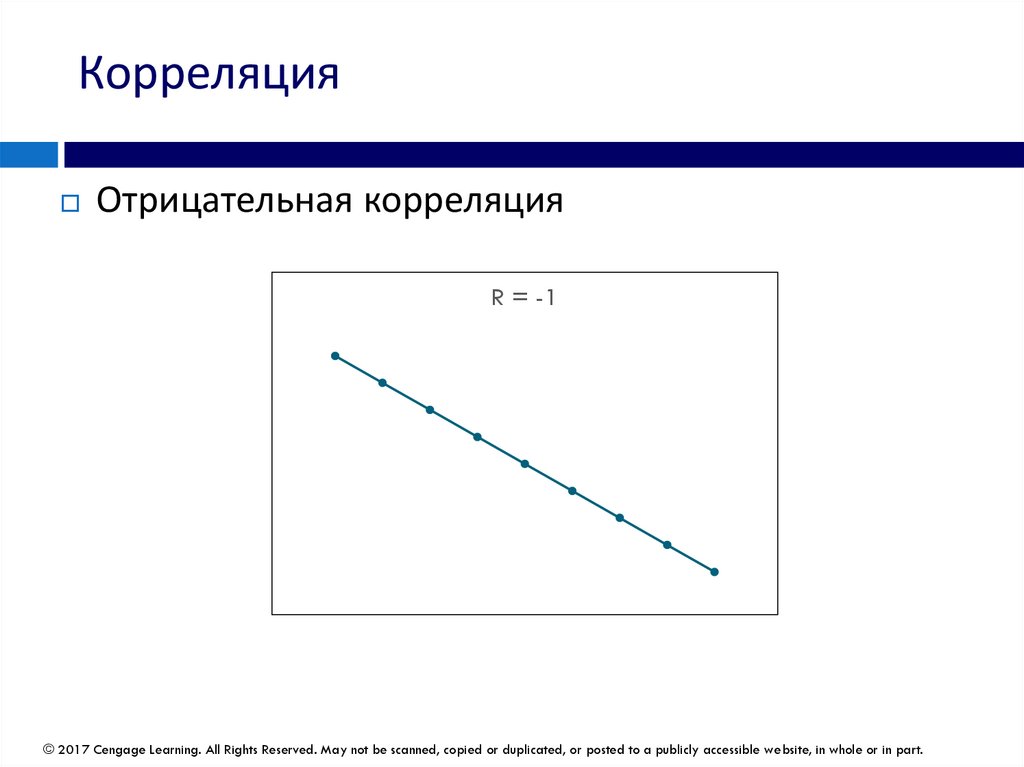
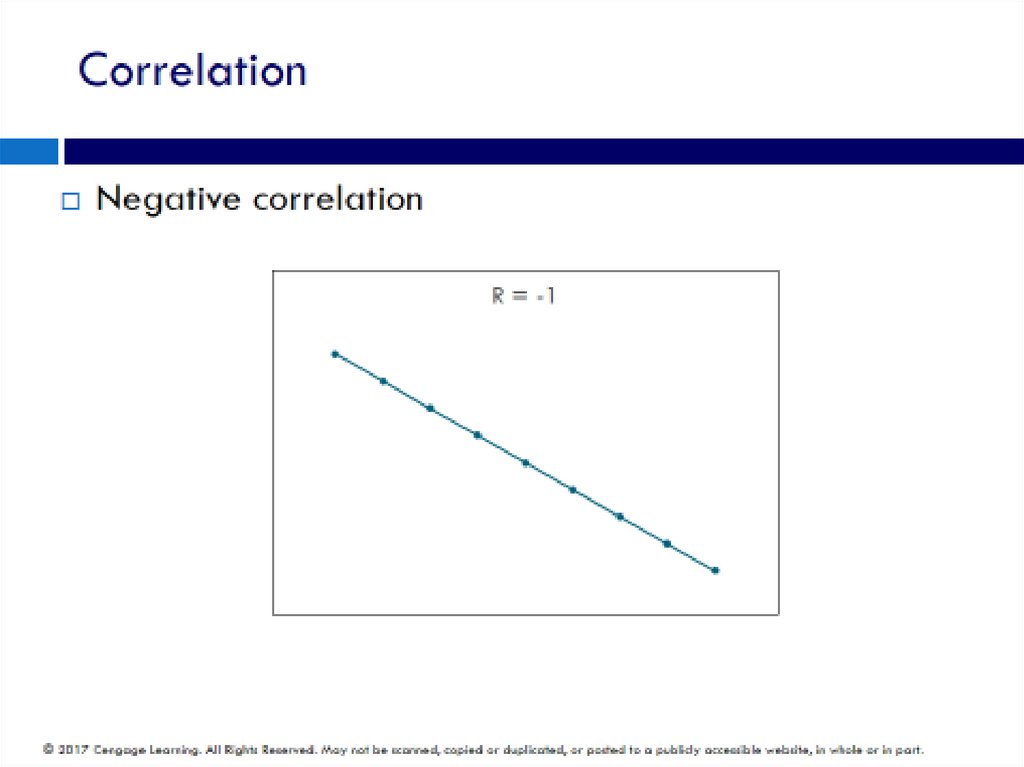
КорреляцияОтрицательная корреляция
R = -1
© 2017 Cengage Learning. All Rights Reserved. May not be scanned, copied or duplicated, or posted to a publicly accessible website, in whole or in part.
48.
© 2017 Cengage Learning. All Rights Reserved. May not be scanned, copied or duplicated, or posted to a publicly accessible website, in whole or in part.49.
© 2017 Cengage Learning. All Rights Reserved. May not be scanned, copied or duplicated, or posted to a publicly accessible website, in whole or in part.50.
КорреляцияНет коррляции
R=0
© 2017 Cengage Learning. All Rights Reserved. May not be scanned, copied or duplicated, or posted to a publicly accessible website, in whole or in part.
51.
Корреляционный анализ с SPSSДавайте обнаружим корреляции между переменными с
предыдущим примером (например, количество
машинных часов, производственные циклы, накладные
расходы).
© 2017 Cengage Learning. All Rights Reserved. May not be scanned, copied or duplicated, or posted to a publicly accessible website, in whole or in part.
52.
Correlation Analysis with SPSSLet’s discover correlations among variables with
previous example (i.e., Mechanic Hours, Production
Runs, Overhead)
© 2017 Cengage Learning. All Rights Reserved. May not be scanned, copied or duplicated, or posted to a publicly accessible website, in whole or in part.
53.
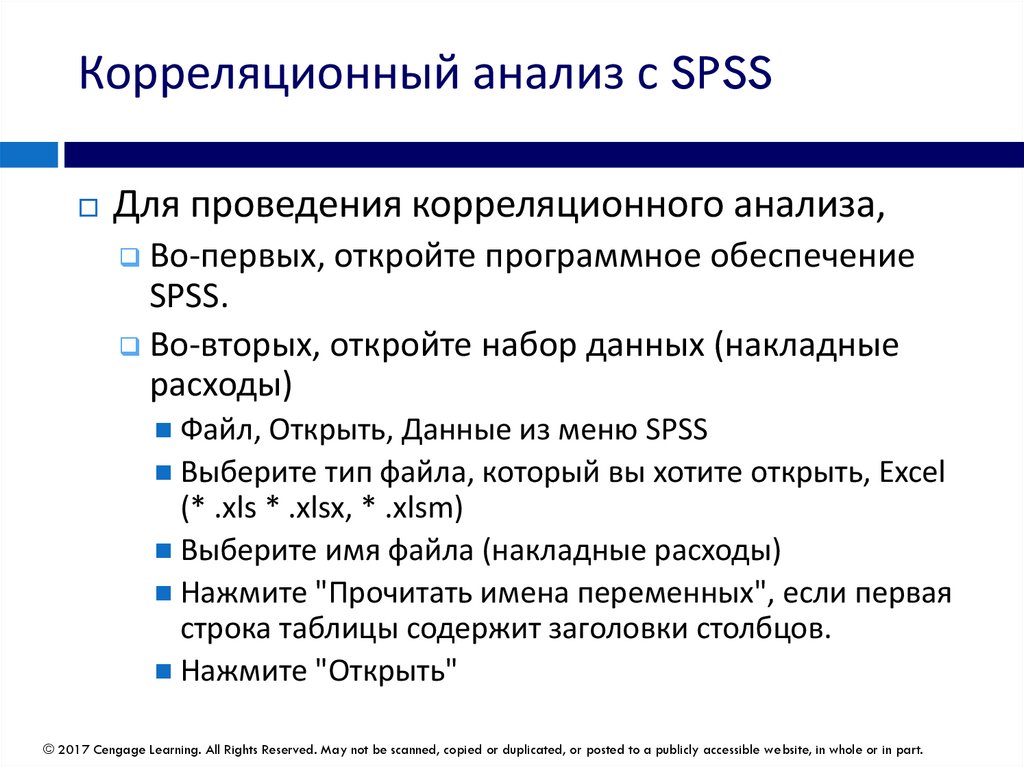
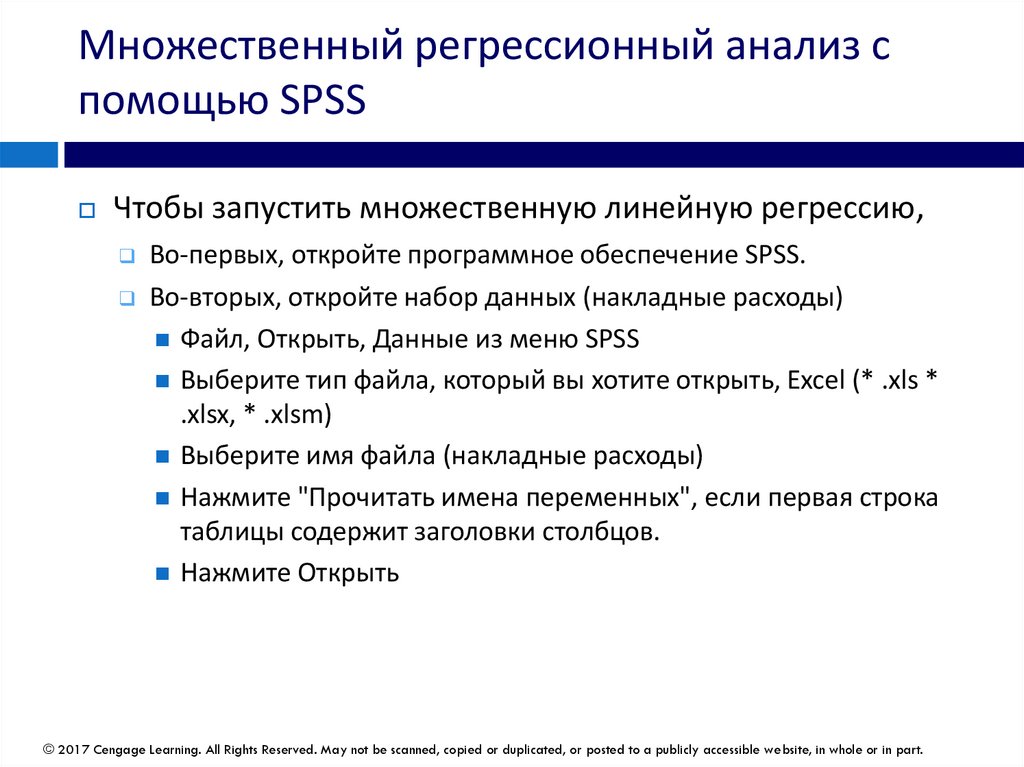
Корреляционный анализ с SPSSДля проведения корреляционного анализа,
Во-первых, откройте программное обеспечение
SPSS.
Во-вторых, откройте набор данных (накладные
расходы)
Файл, Открыть, Данные из меню SPSS
Выберите тип файла, который вы хотите открыть, Excel
(* .xls * .xlsx, * .xlsm)
Выберите имя файла (накладные расходы)
Нажмите "Прочитать имена переменных", если первая
строка таблицы содержит заголовки столбцов.
Нажмите "Открыть"
© 2017 Cengage Learning. All Rights Reserved. May not be scanned, copied or duplicated, or posted to a publicly accessible website, in whole or in part.
54.
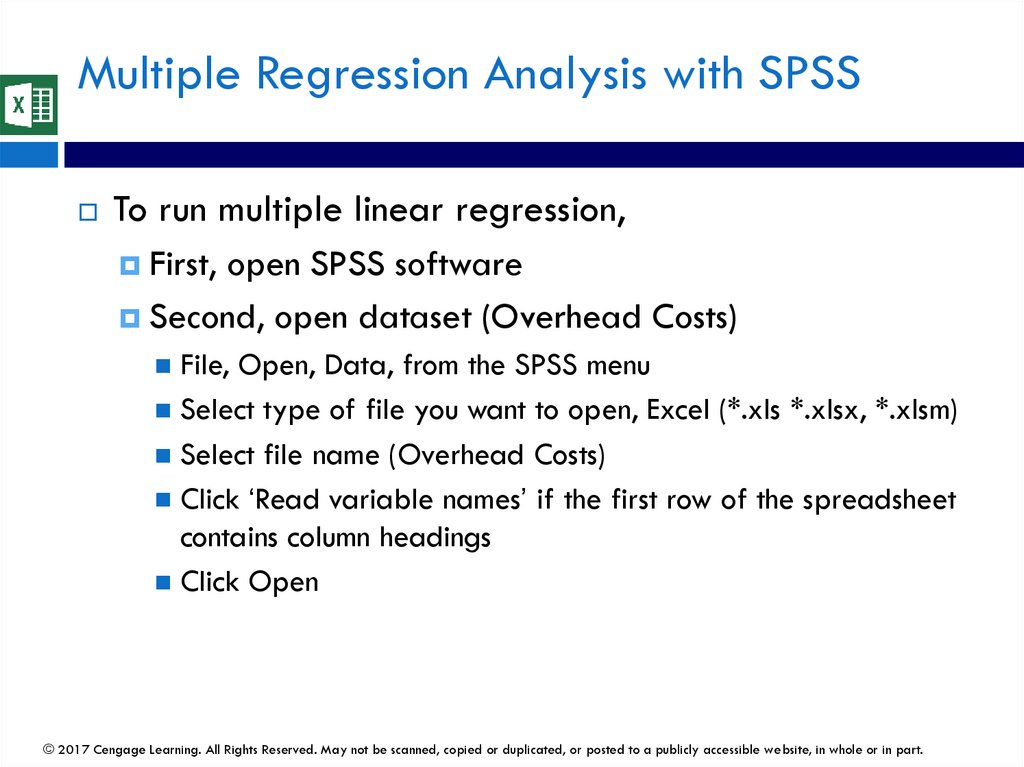
Correlation Analysis with SPSSTo conduct correlation analysis,
First, open SPSS software
Second, open dataset (Overhead Costs)
File, Open, Data, from the SPSS menu
Select type of file you want to open, Excel (*.xls *.xlsx, *.xlsm)
Select file name (Overhead Costs)
Click ‘Read variable names’ if the first row of the spreadsheet
contains column headings
Click Open
© 2017 Cengage Learning. All Rights Reserved. May not be scanned, copied or duplicated, or posted to a publicly accessible website, in whole or in part.
55.
Корреляционный анализ с SPSSДля проведения корреляционного анализа,
В-третьих, щелкните Анализировать> Коррелировать>
Двумерно ... в главном меню, как показано ниже:
© 2017 Cengage Learning. All Rights Reserved. May not be scanned, copied or duplicated, or posted to a publicly accessible website, in whole or in part.
56.
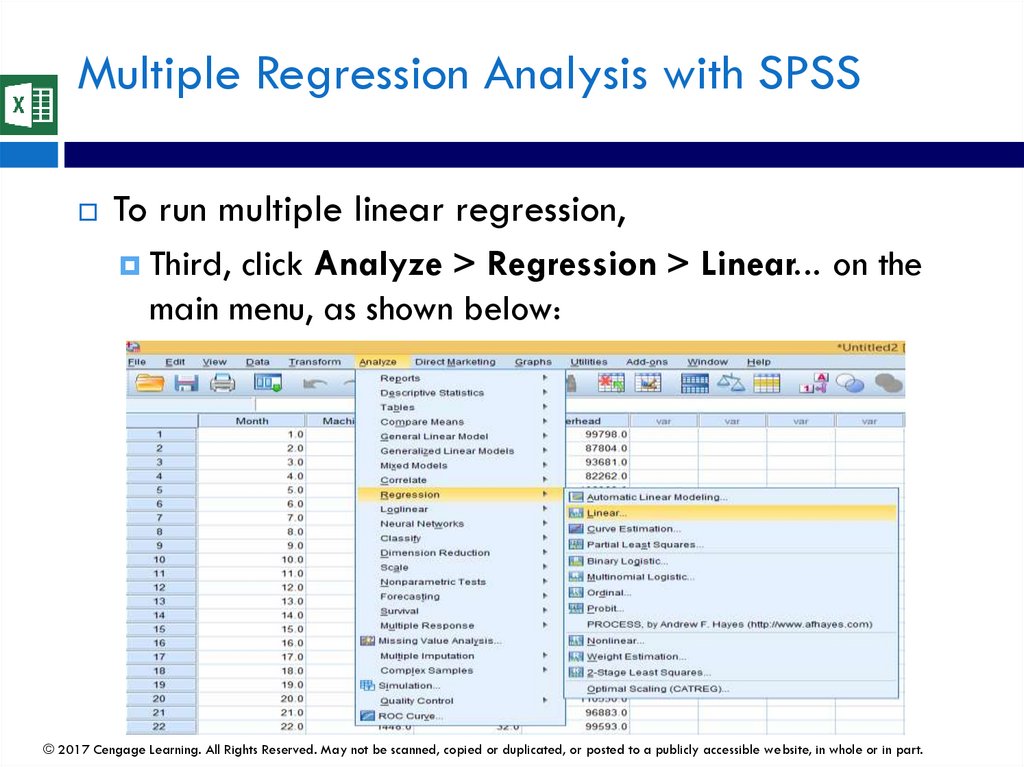
Correlation Analysis with SPSSTo conduct correlation analysis,
Third, click Analyze > Correlate > Bivariate... on the
main menu, as shown below:
© 2017 Cengage Learning. All Rights Reserved. May not be scanned, copied or duplicated, or posted to a publicly accessible website, in whole or in part.
57.
Корреляционный анализ с SPSSДля проведения корреляционного анализа,
В-четвертых, представьте диалоговое окно «Двумерные
корреляции», как показано ниже:
В-пятых, нажмите "ОК".
© 2017 Cengage Learning. All Rights Reserved. May not be scanned, copied or duplicated, or posted to a publicly accessible website, in whole or in part.
58.
Correlation Analysis with SPSSTo conduct correlation analysis,
Fourth, be presented with the Bivariate Correlations
dialogue box, as shown below:
Fifth, Click ‘OK’
© 2017 Cengage Learning. All Rights Reserved. May not be scanned, copied or duplicated, or posted to a publicly accessible website, in whole or in part.
59.
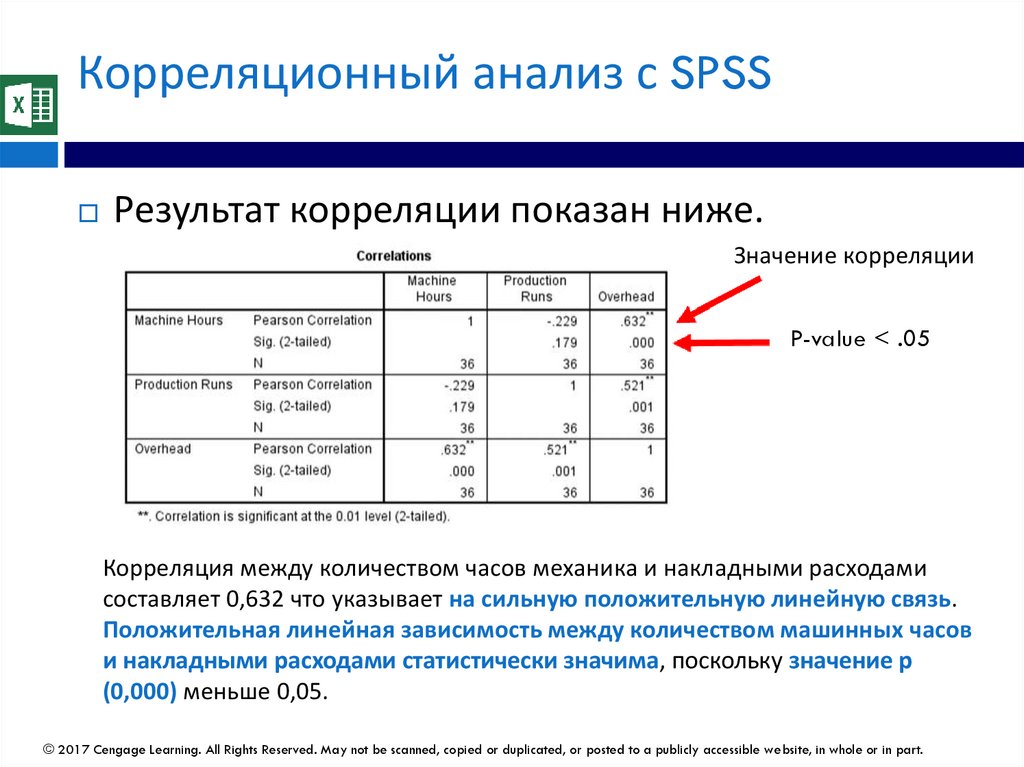
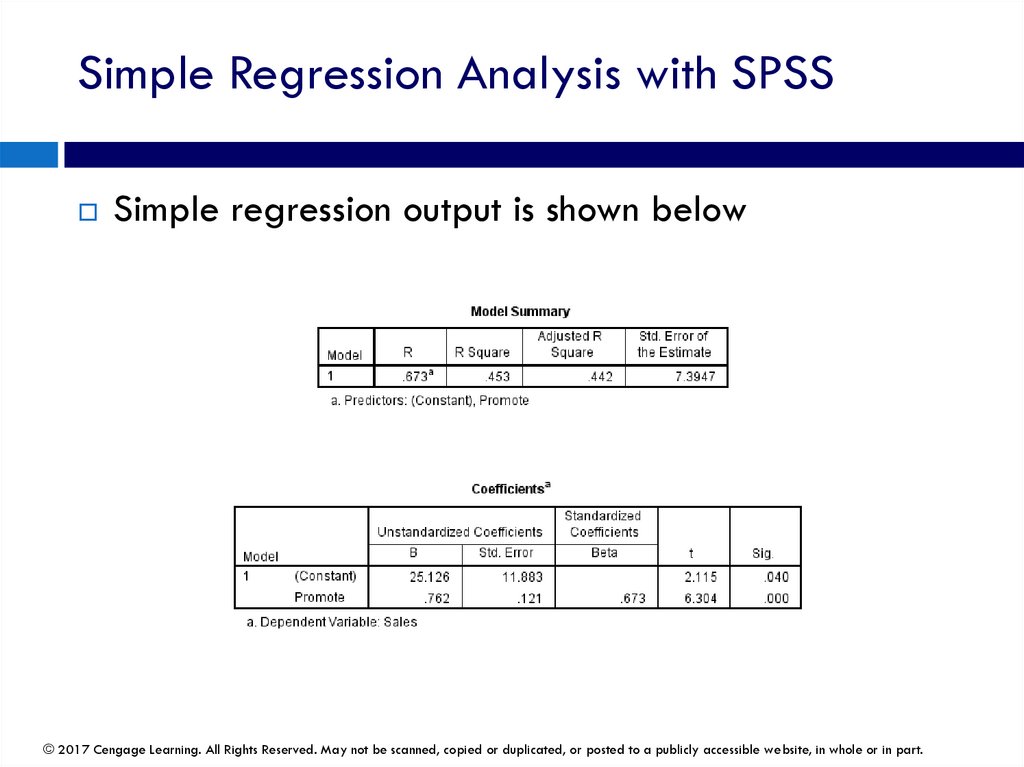
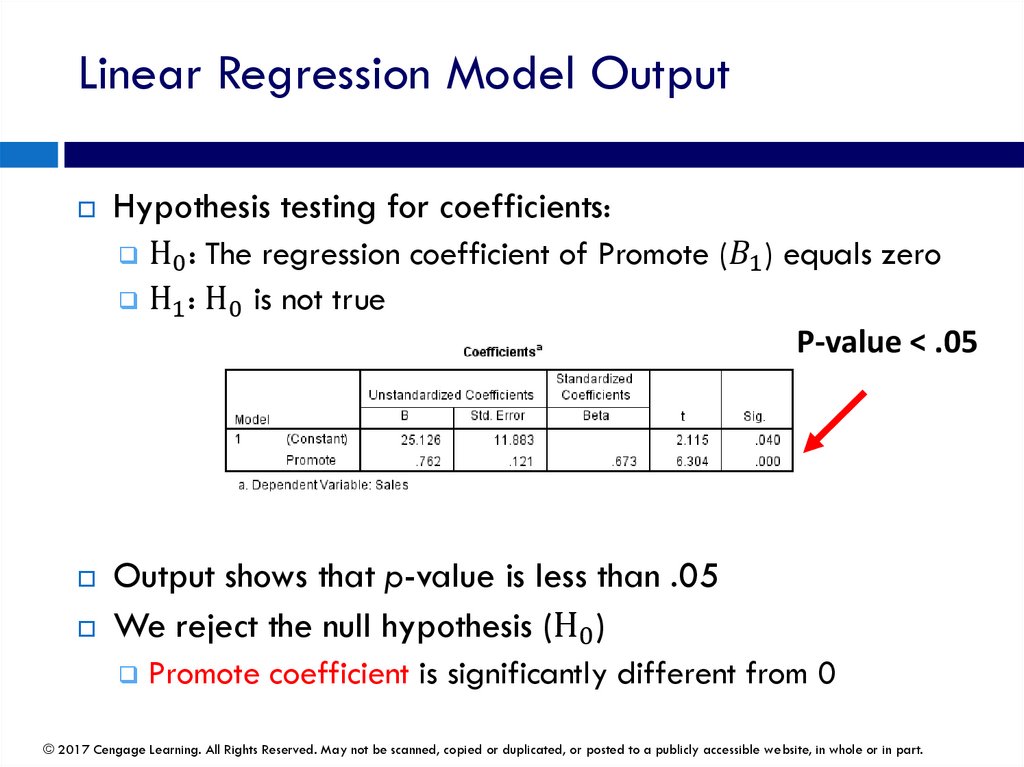
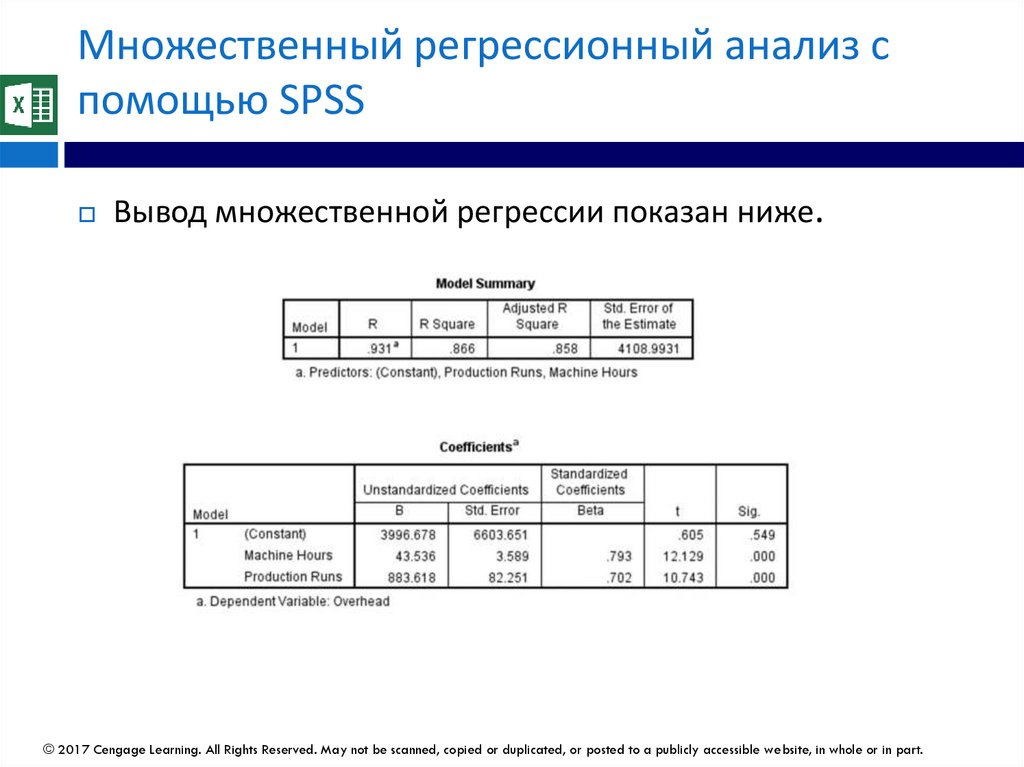
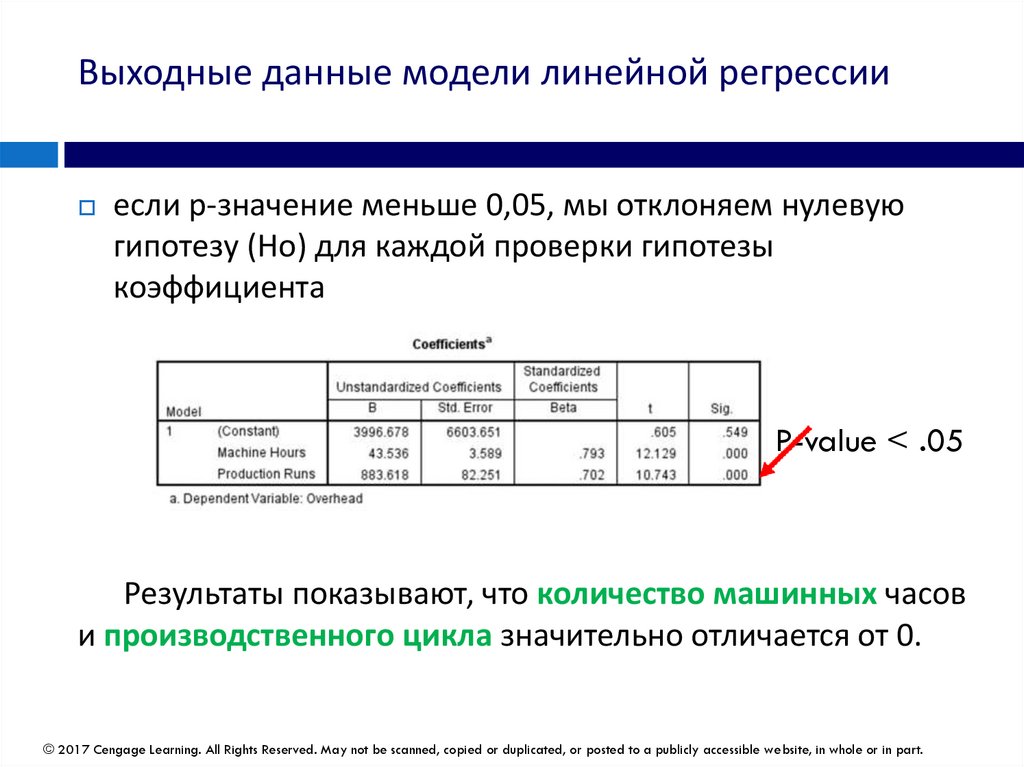
Корреляционный анализ с SPSSРезультат корреляции показан ниже.
Значение корреляции
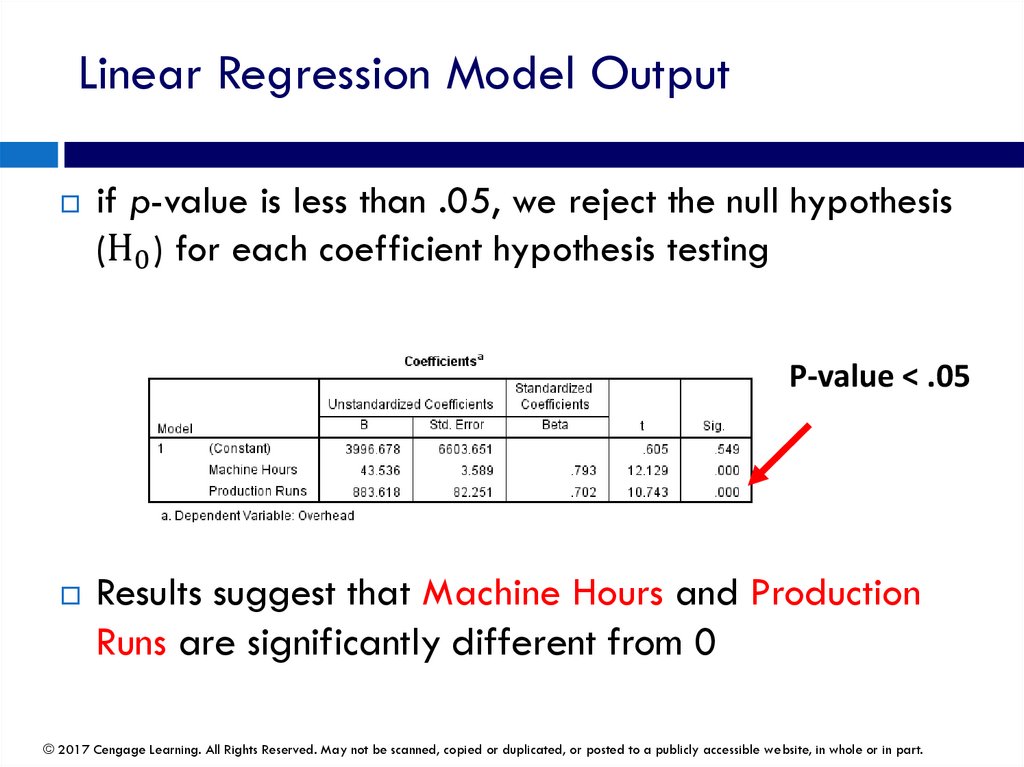
P-value < .05
Корреляция между количеством часов механика и накладными расходами
составляет 0,632 что указывает на сильную положительную линейную связь.
Положительная линейная зависимость между количеством машинных часов
и накладными расходами статистически значима, поскольку значение p
(0,000) меньше 0,05.
© 2017 Cengage Learning. All Rights Reserved. May not be scanned, copied or duplicated, or posted to a publicly accessible website, in whole or in part.
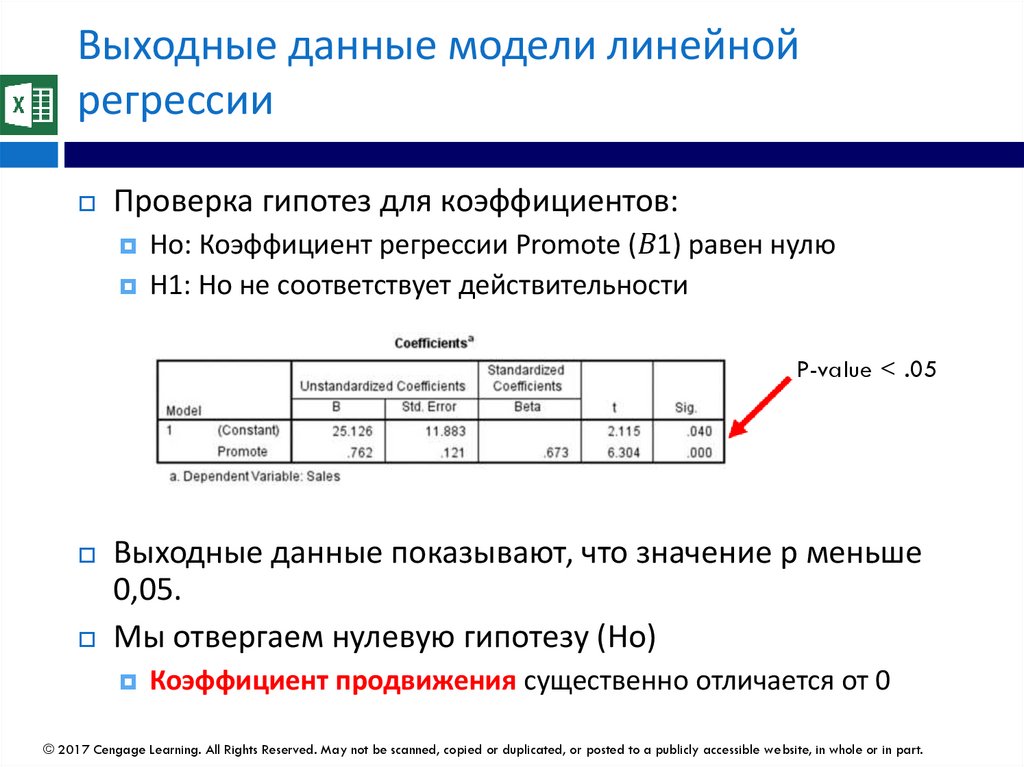
60.
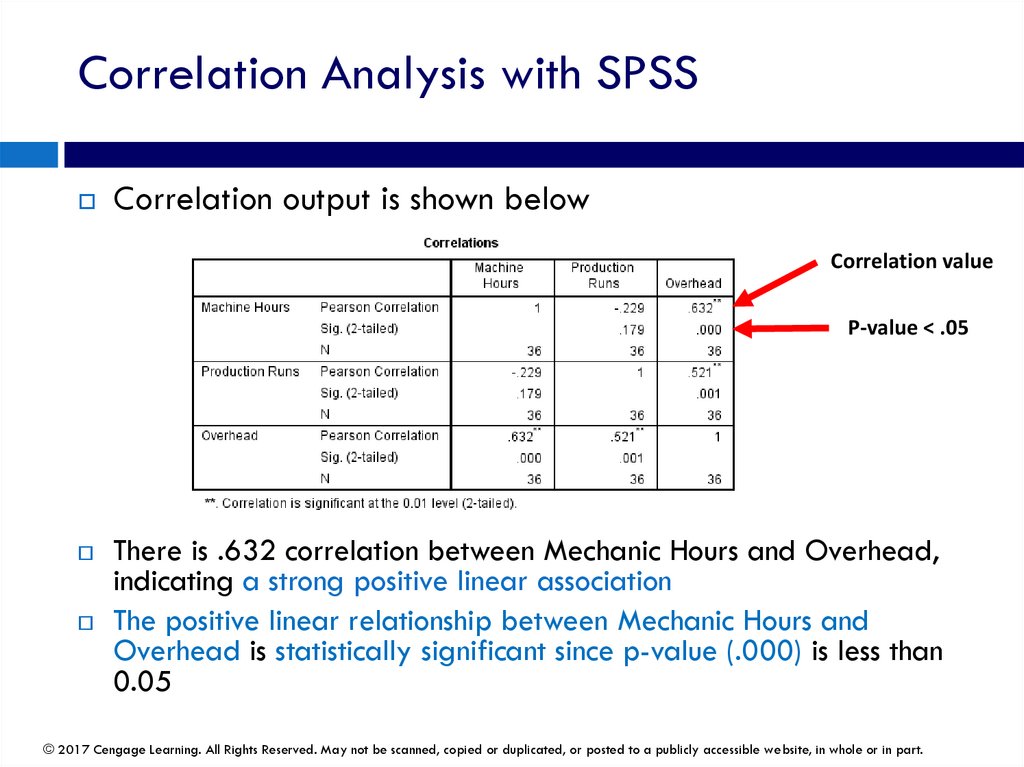
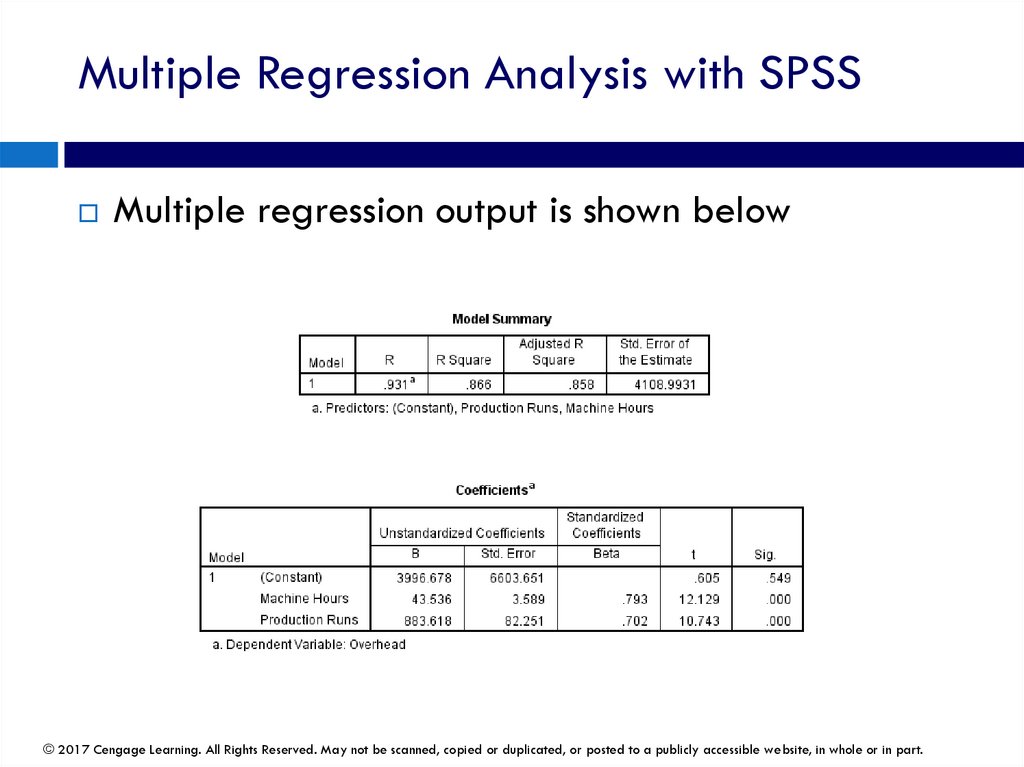
Correlation Analysis with SPSSCorrelation output is shown below
Correlation value
P-value < .05
There is .632 correlation between Mechanic Hours and Overhead,
indicating a strong positive linear association
The positive linear relationship between Mechanic Hours and
Overhead is statistically significant since p-value (.000) is less than
0.05
© 2017 Cengage Learning. All Rights Reserved. May not be scanned, copied or duplicated, or posted to a publicly accessible website, in whole or in part.
61.
ЗадачаПожалуйста, интерпретируйте соотношение 1)
между производственными циклами и
накладными расходами и 2) между количеством
рабочих часов механика и производственными
циклами.
© 2017 Cengage Learning. All Rights Reserved. May not be scanned, copied or duplicated, or posted to a publicly accessible website, in whole or in part.
62.
ExercisePlease interpret the correlation 1) between Production
Runs and Overhead, and 2) between Mechanic Hours
and Production Runs
© 2017 Cengage Learning. All Rights Reserved. May not be scanned, copied or duplicated, or posted to a publicly accessible website, in whole or in part.
63.
Простая линейная регрессияДиаграммы рассеяния и корреляции указывают на
линейные отношения и сильные стороны этих отношений,
но не дают их количественной оценки.
Простая линейная регрессия позволяет количественно
оценить взаимосвязь, если есть одна независимая
переменная.
Прямая линия проходит через диаграмму рассеяния
зависимой переменной (Y) по сравнению с независимой
переменной (X).
© 2017 Cengage Learning. All Rights Reserved. May not be scanned, copied or duplicated, or posted to a publicly accessible website, in whole or in part.
64.
Simple Linear RegressionScatterplots and correlations indicate linear
relationships and the strengths of these relationships,
but they do not quantify them
Simple linear regression quantifies the relationship
where there is a single explanatory variable
A straight line is fitted through the scatterplot of
dependent variable (Y) versus explanatory variable
(X)
© 2017 Cengage Learning. All Rights Reserved. May not be scanned, copied or duplicated, or posted to a publicly accessible website, in whole or in part.
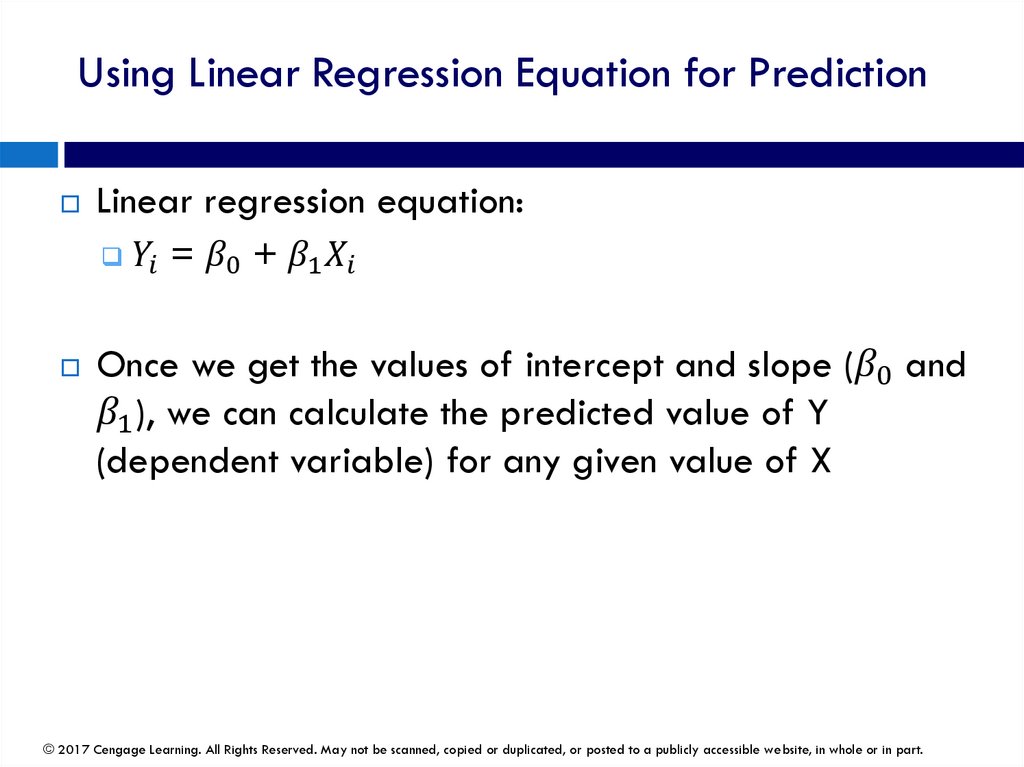
65.
Простая регрессияЦель простой линейной регрессии:
Оцените значимость независимой переменной в
объяснении поведения зависимой переменной.
Предсказать значения зависимой переменной на
основе значений независимой переменной
© 2017 Cengage Learning. All Rights Reserved. May not be scanned, copied or duplicated, or posted to a publicly accessible website, in whole or in part.
66.
Simple RegressionThe purpose of simple linear regression is to:
Evaluate the significance of independent variable in
explaining the behavior of dependent variable
Predict the values of dependent variable based on the
values of independent variable
© 2017 Cengage Learning. All Rights Reserved. May not be scanned, copied or duplicated, or posted to a publicly accessible website, in whole or in part.
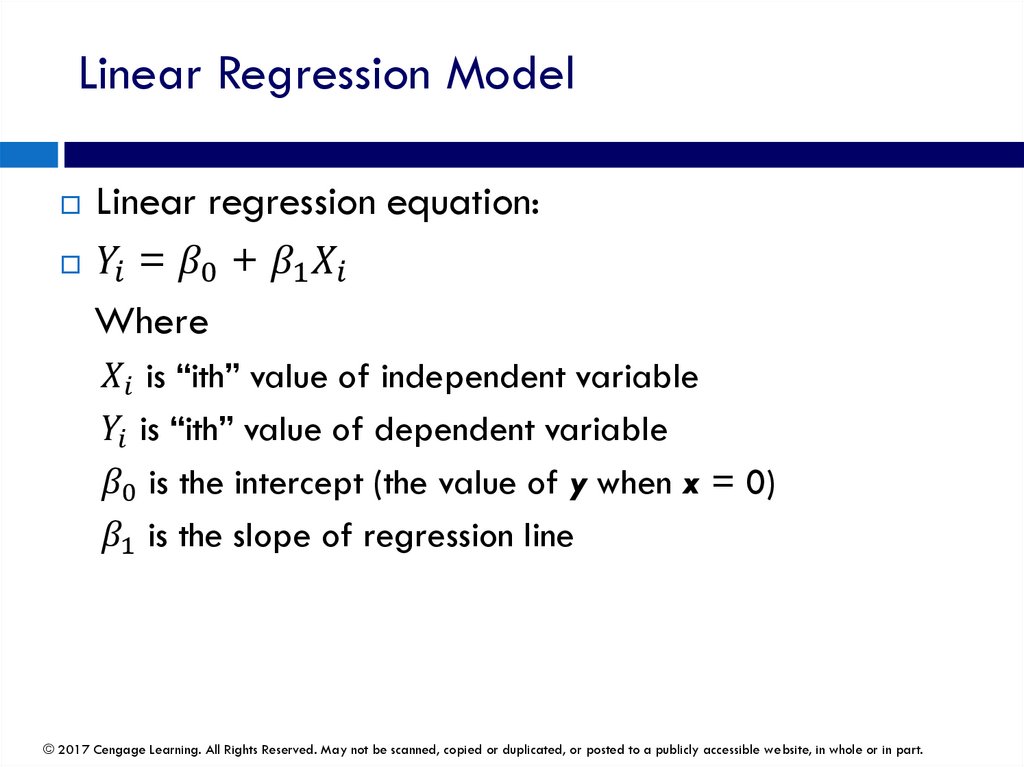
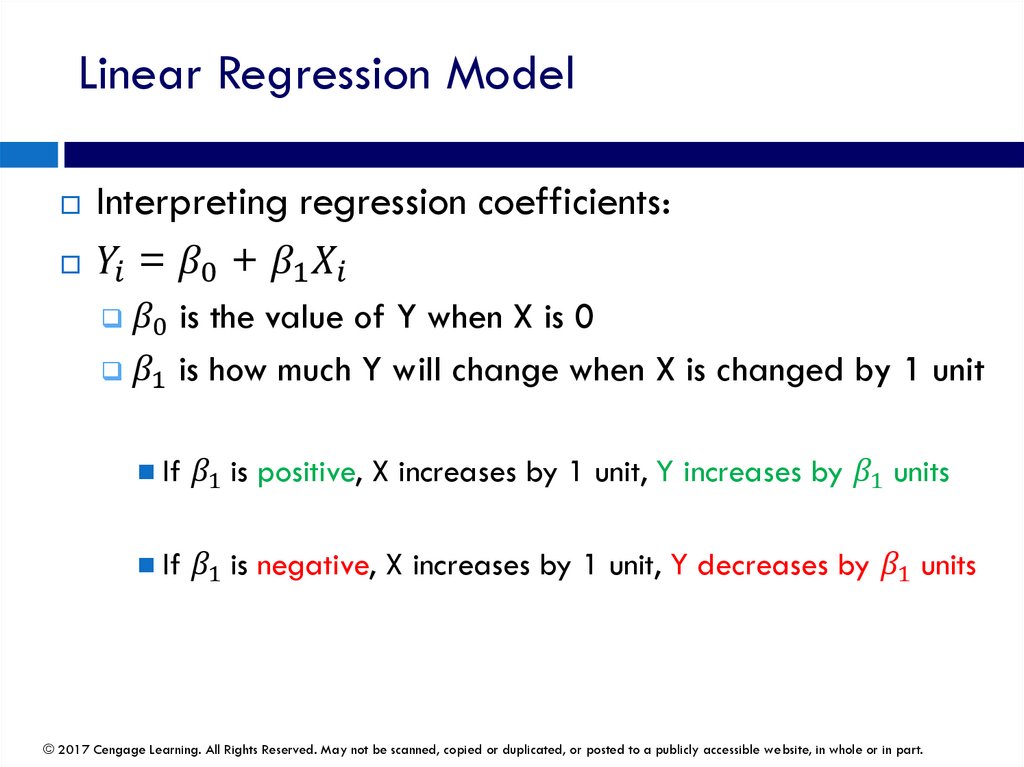
67.
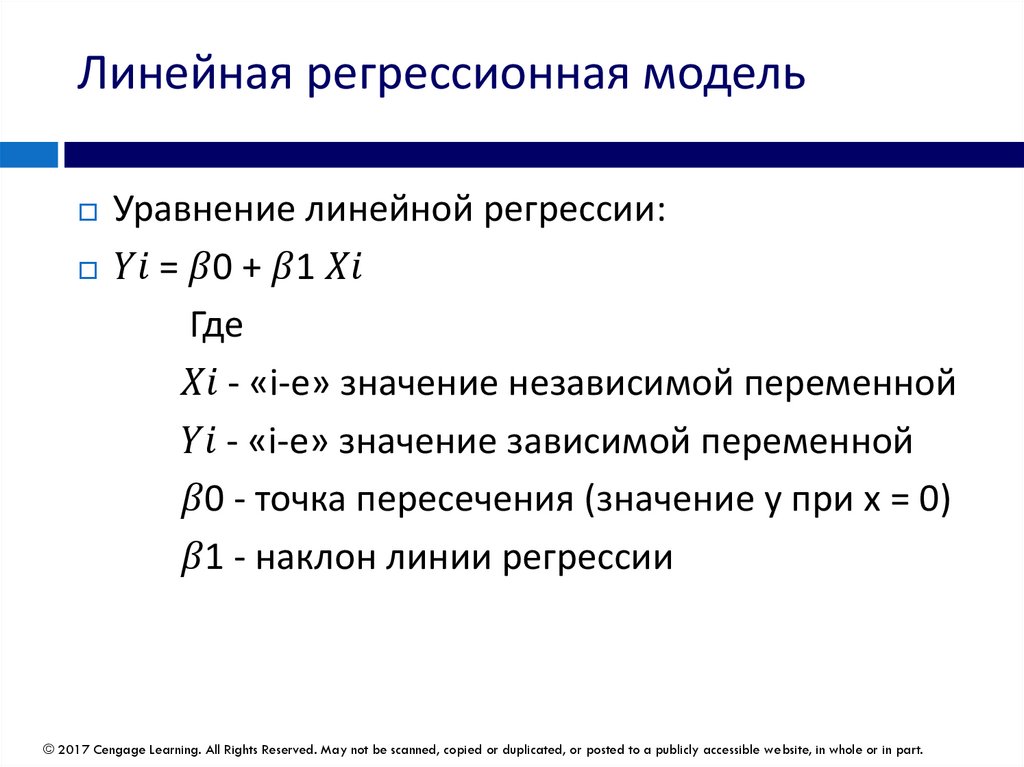
Линейная регрессионная модельУравнение линейной регрессии: