 Информатика
Похожие презентации:


Computer Organization and Architecture
1.
#Click to edit Master title style
Computer Organization and
Architecture
LECTURE1 INTRODUCTION (III)
COST & PERFORMANCE METRICS
Jianfeng An, Meng Zhang, Danghui Wang
Lu Zhang
anjf,zhangm,wangdh@nwpu.edu.cn
zhanglu@nwpu.edu.cn
2.
#How
the Performance
Clickto
toDefine
edit Master
title style
The goal of performance evaluation in
this chapter is to be able to compare, for
example.
Different architectures
Different implementations of an architecture
Different compilers for a given architecture
General Sense:
How well the computer performs?
COaA, LEC03 Intro III
Northwestern Polytechnical University
8
3.
#Defining
Performance
Click to edit
Master title style
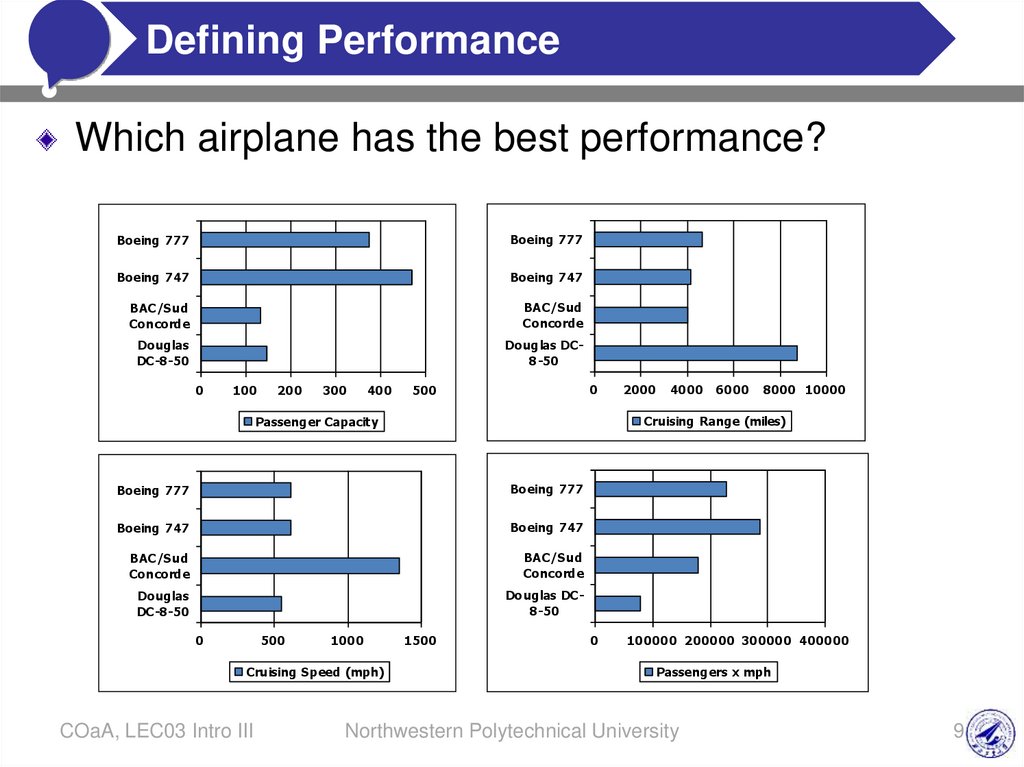
Which airplane has the best performance?
Boeing 777
Boeing 777
Boeing 747
Boeing 747
BAC/Sud
Concorde
BAC/Sud
Concorde
Douglas
DC-8-50
Douglas DC8-50
0
100
200
300
400
0
500
Boeing 777
Boeing 777
Boeing 747
Boeing 747
BAC/Sud
Concorde
BAC/Sud
Concorde
Douglas
DC-8-50
Douglas DC8-50
500
1000
Cruising Speed (mph)
COaA, LEC03 Intro III
4000
6000
8000 10000
Cruising Range (miles)
Passenger Capacity
0
2000
1500
0
100000 200000 300000 400000
Passengers x mph
Northwestern Polytechnical University
9
4.
#Performance
and cost
Click to edit Master
title style
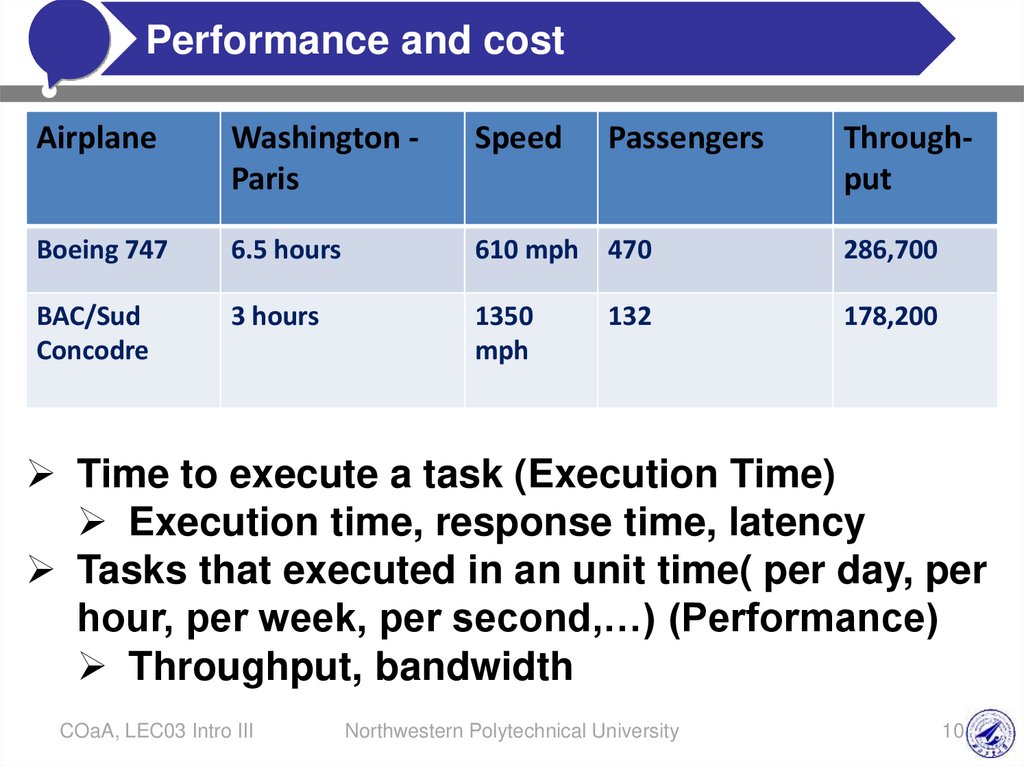
Airplane
Washington Paris
Speed
Passengers
Throughput
Boeing 747
6.5 hours
610 mph
470
286,700
BAC/Sud
Concodre
3 hours
1350
mph
132
178,200
Time to execute a task (Execution Time)
Execution time, response time, latency
Tasks that executed in an unit time( per day, per
hour, per week, per second,…) (Performance)
Throughput, bandwidth
COaA, LEC03 Intro III
Northwestern Polytechnical University
10
5.
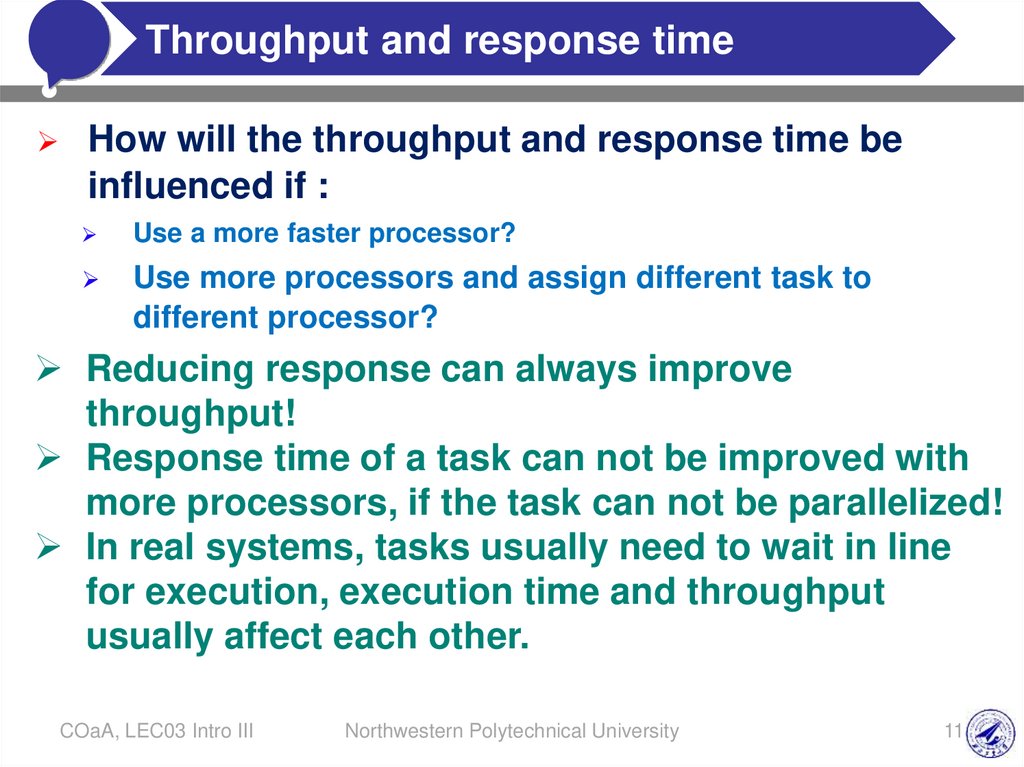
Throughputresponse
time
Click to edit and
Master
title style
#
How will the throughput and response time be
influenced if :
Use a more faster processor?
Use more processors and assign different task to
different processor?
Reducing response can always improve
throughput!
Response time of a task can not be improved with
more processors, if the task can not be parallelized!
In real systems, tasks usually need to wait in line
for execution, execution time and throughput
usually affect each other.
COaA, LEC03 Intro III
Northwestern Polytechnical University
11
6.
Defining(Speed)
Performance
Click to edit
Master
title style
#
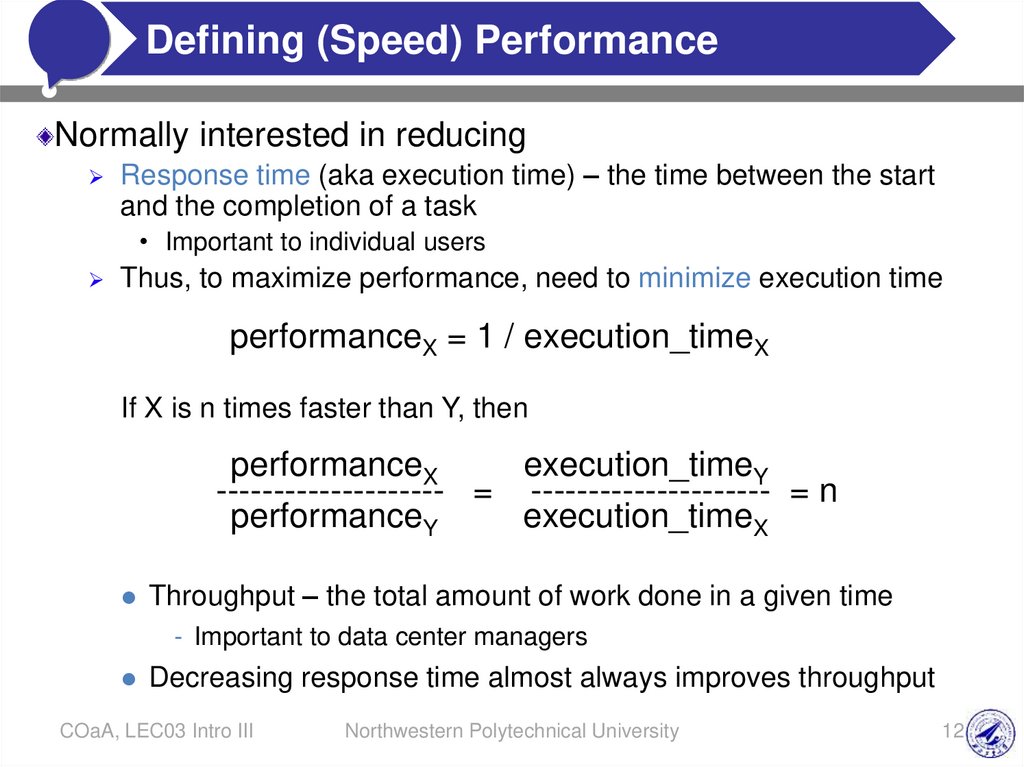
Normally interested in reducing
Response time (aka execution time) – the time between the start
and the completion of a task
• Important to individual users
Thus, to maximize performance, need to minimize execution time
performanceX = 1 / execution_timeX
If X is n times faster than Y, then
performanceX
execution_timeY
-------------------- = --------------------- = n
performanceY
execution_timeX
Throughput – the total amount of work done in a given time
- Important to data center managers
Decreasing response time almost always improves throughput
COaA, LEC03 Intro III
Northwestern Polytechnical University
12
7.
#Metrics
performance
Click to of
edit
Master title style
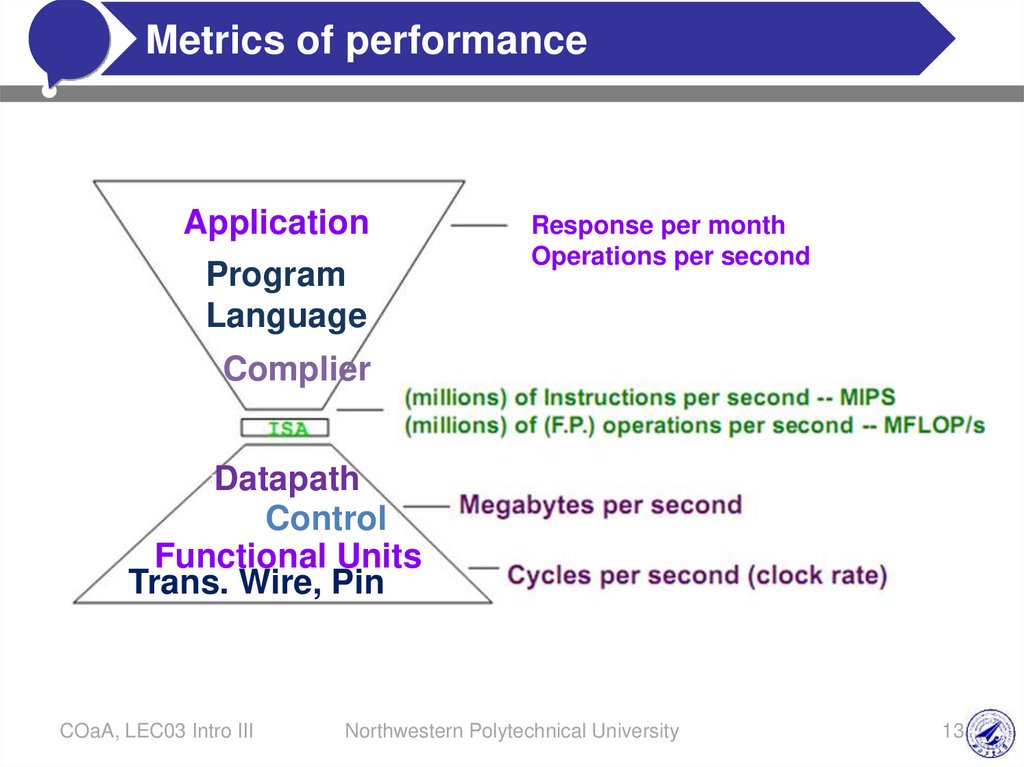
Application
Program
Language
Response per month
Operations per second
Complier
Datapath
Control
Functional Units
Trans. Wire, Pin
COaA, LEC03 Intro III
Northwestern Polytechnical University
13
8.
#The
Time title style
ClickNature
to editofMaster
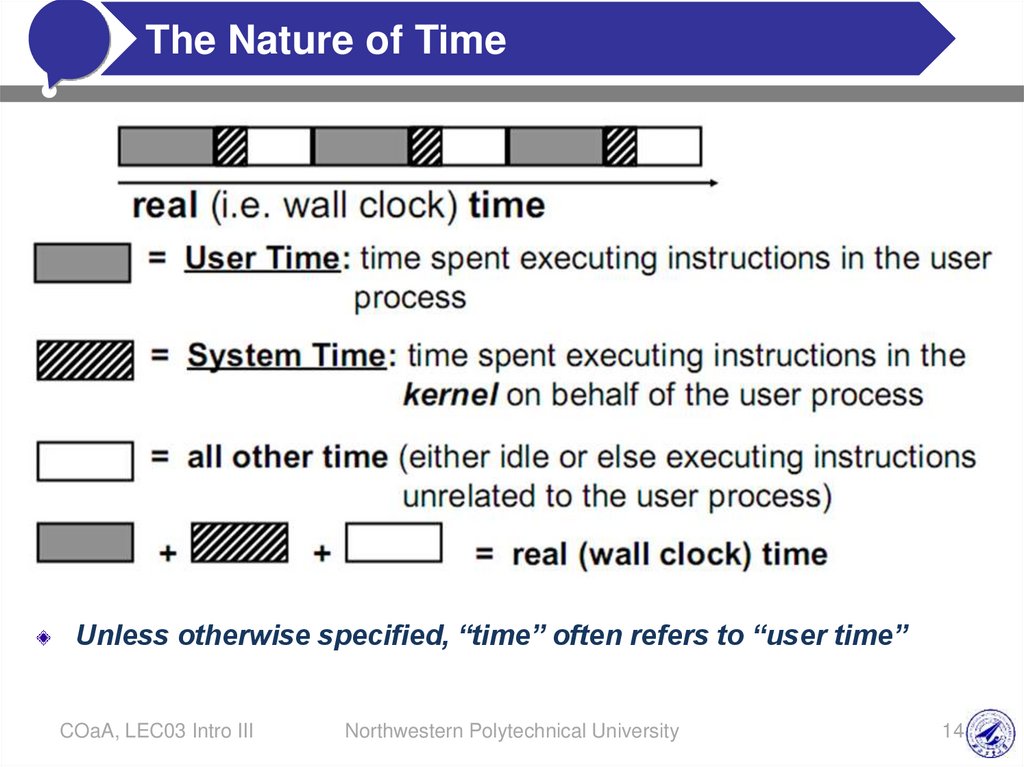
Unless otherwise specified, “time” often refers to “user time”
COaA, LEC03 Intro III
Northwestern Polytechnical University
14
9.
#Executing
Time
Click to edit
Master title style
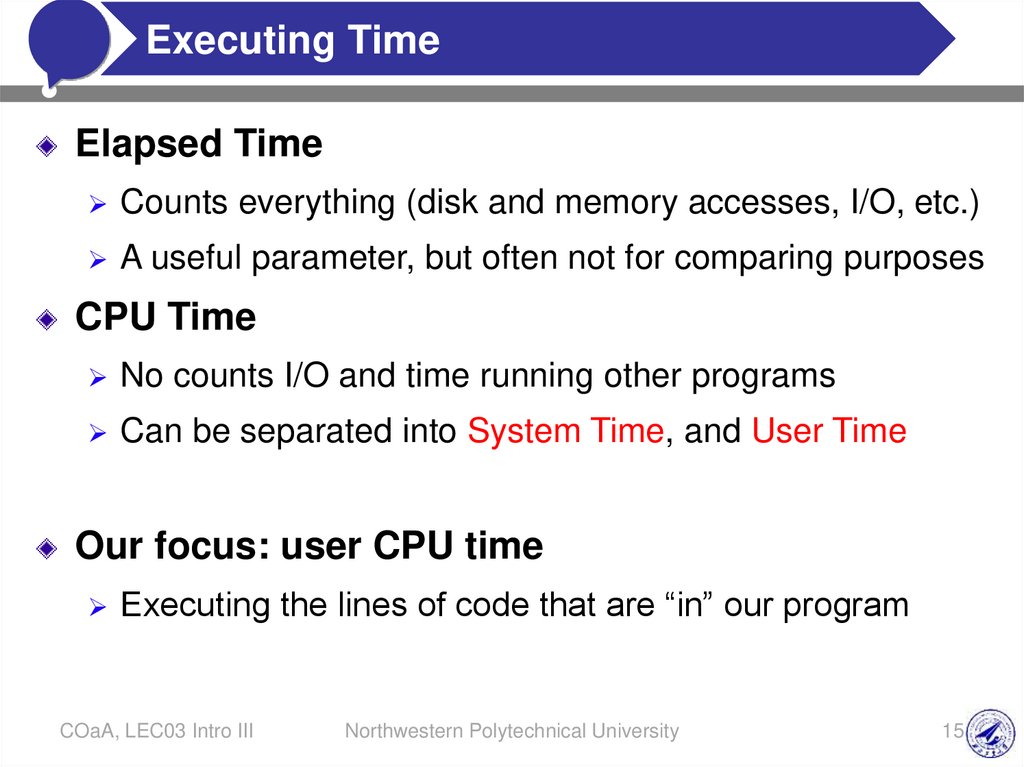
Elapsed Time
Counts everything (disk and memory accesses, I/O, etc.)
A useful parameter, but often not for comparing purposes
CPU Time
No counts I/O and time running other programs
Can be separated into System Time, and User Time
Our focus: user CPU time
Executing the lines of code that are “in” our program
COaA, LEC03 Intro III
Northwestern Polytechnical University
15
10.
#Time
Click to edit Master title style
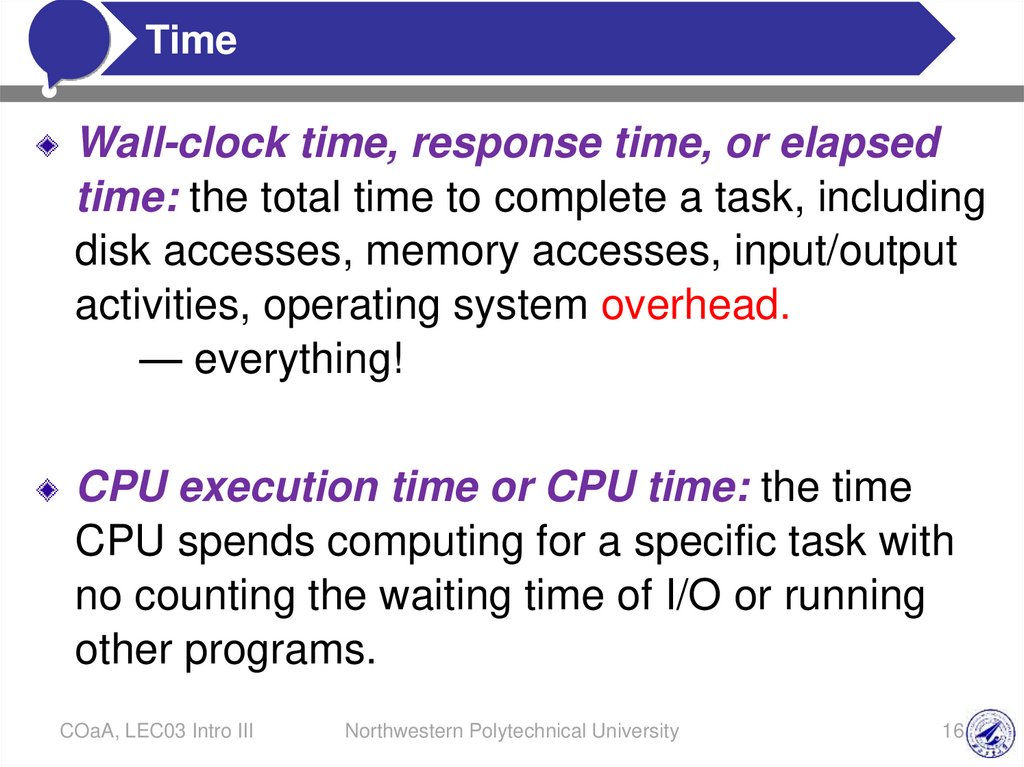
Wall-clock time, response time, or elapsed
time: the total time to complete a task, including
disk accesses, memory accesses, input/output
activities, operating system overhead.
— everything!
CPU execution time or CPU time: the time
CPU spends computing for a specific task with
no counting the waiting time of I/O or running
other programs.
COaA, LEC03 Intro III
Northwestern Polytechnical University
16
11.
##
Review
system
Click to of
edit
Masterstack
title style
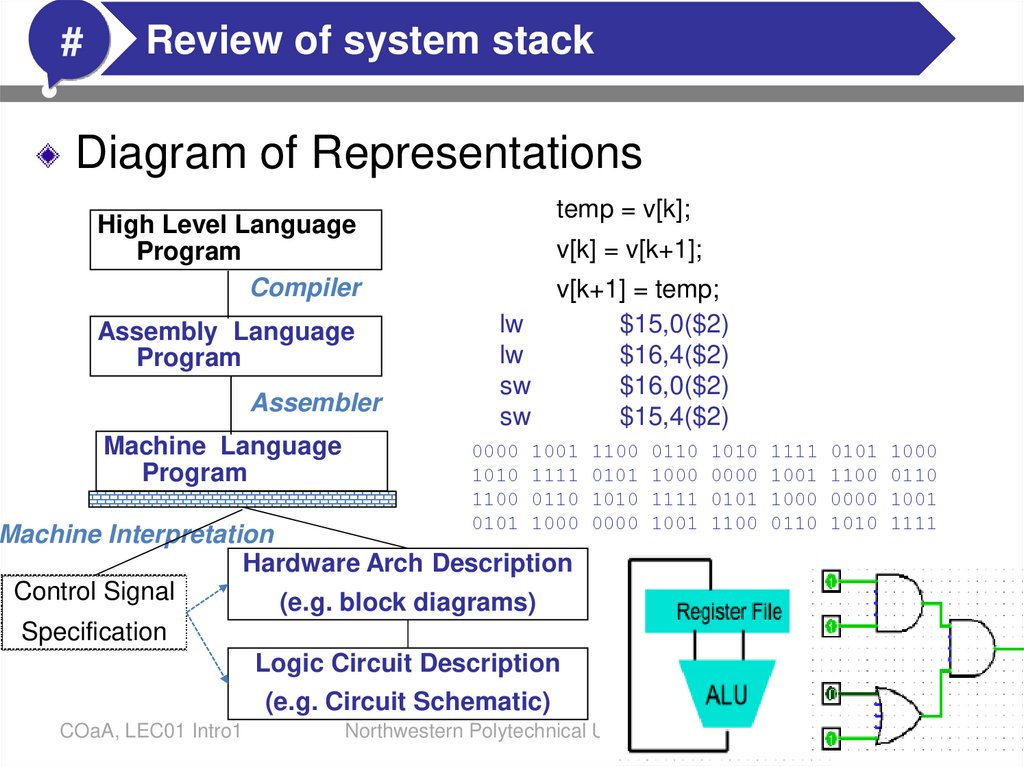
Diagram of Representations
High Level Language
Program
Compiler
Assembly Language
Program
Assembler
Machine Language
Program
temp = v[k];
v[k] = v[k+1];
v[k+1] = temp;
lw
$15,0($2)
lw
$16,4($2)
sw
$16,0($2)
sw
$15,4($2)
0000 1001 1100 0110 1010 1111 0101 1000
1010 1111 0101 1000 0000 1001 1100 0110
1100 0110 1010 1111 0101 1000 0000 1001
0101 1000 0000 1001 1100 0110 1010 1111
Machine Interpretation
Hardware Arch Description
Control Signal
(e.g. block diagrams)
Specification
Logic Circuit Description
(e.g. Circuit Schematic)
COaA, LEC01 Intro1
Northwestern Polytechnical University
17
12.
#CPU
ClickTime
to edit Master title style
If we know # of CPU clock cycles for a
program
CPU time for a program
= # of CPU cycles for a program X Clock cycle time
(period per cycle)
= # of CPU cycles for a program / Frequency
COaA, LEC03 Intro III
Northwestern Polytechnical University
18
13.
PerformanceFactors
Click to edit Master
title style
#
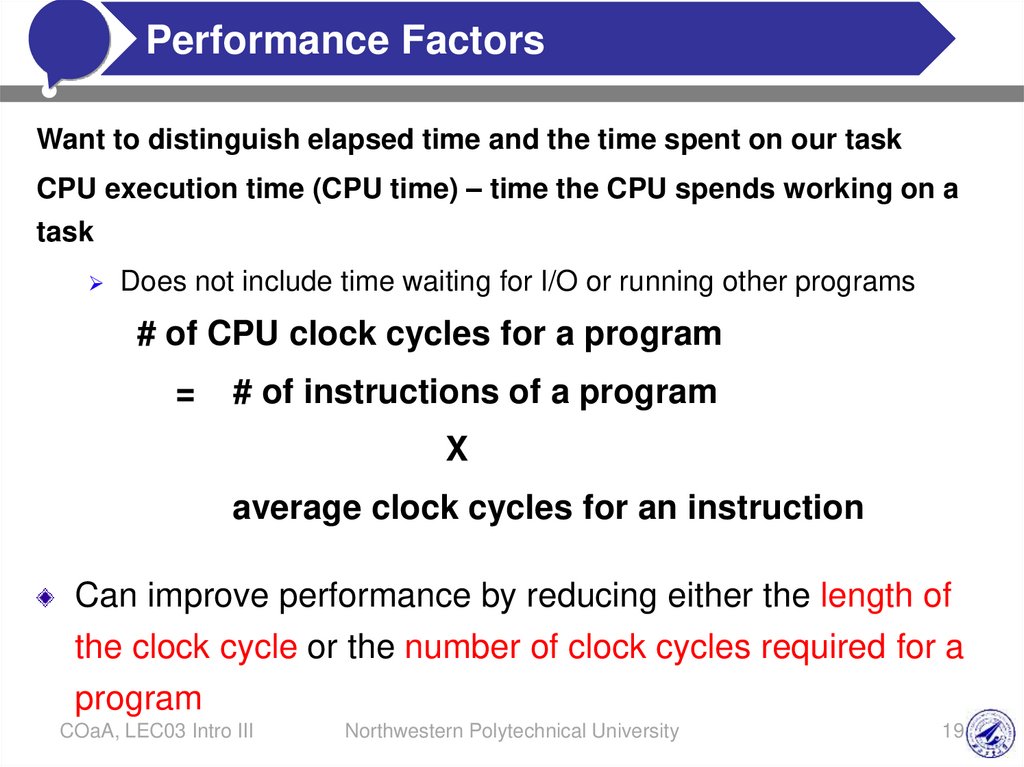
Want to distinguish elapsed time and the time spent on our task
CPU execution time (CPU time) – time the CPU spends working on a
task
Does not include time waiting for I/O or running other programs
# of CPU clock cycles for a program
=
# of instructions of a program
X
average clock cycles for an instruction
Can improve performance by reducing either the length of
the clock cycle or the number of clock cycles required for a
program
COaA, LEC03 Intro III
Northwestern Polytechnical University
19
14.
#Clock
Cycles
per Instruction
Click to
edit Master
title style
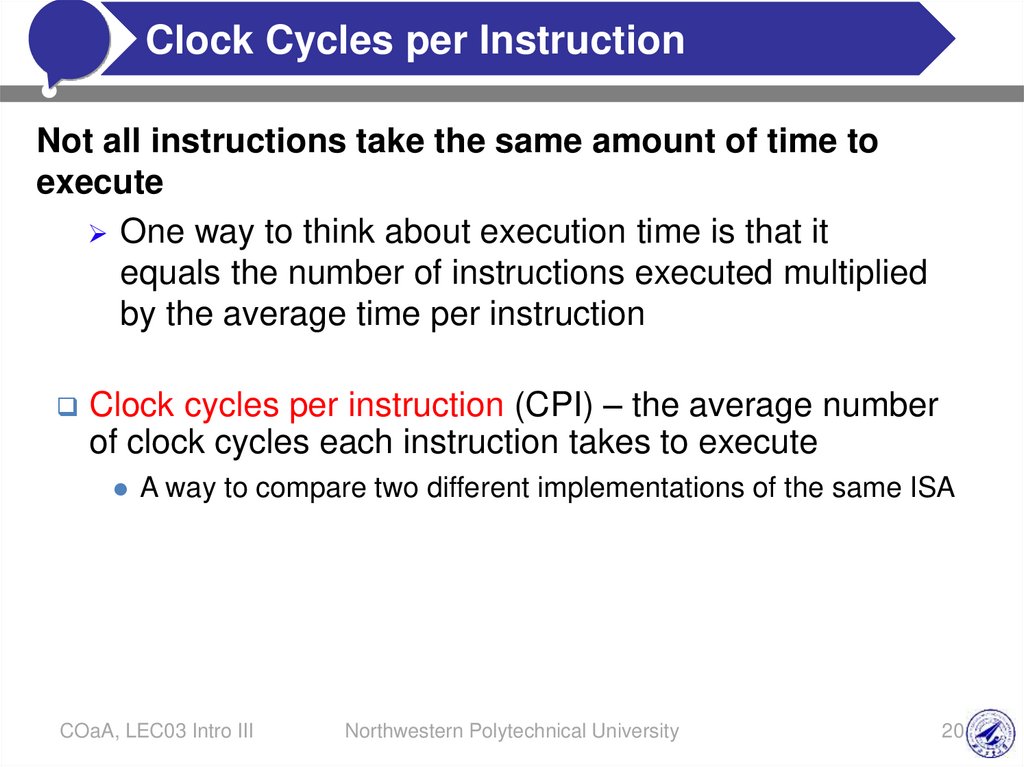
Not all instructions take the same amount of time to
execute
One way to think about execution time is that it
equals the number of instructions executed multiplied
by the average time per instruction
Clock cycles per instruction (CPI) – the average number
of clock cycles each instruction takes to execute
A way to compare two different implementations of the same ISA
COaA, LEC03 Intro III
Northwestern Polytechnical University
20
15.
QuizClick to edit Master title style
#
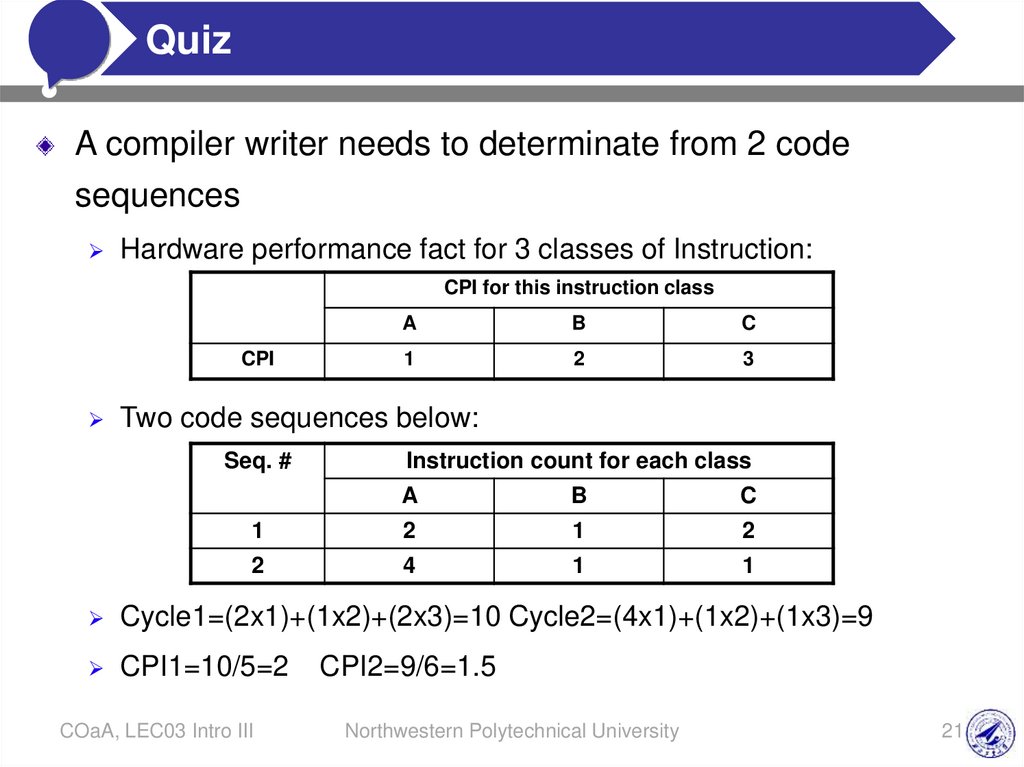
A compiler writer needs to determinate from 2 code
sequences
Hardware performance fact for 3 classes of Instruction:
CPI for this instruction class
CPI
A
B
C
1
2
3
Two code sequences below:
Seq. #
Instruction count for each class
A
B
C
1
2
1
2
2
4
1
1
Cycle1=(2x1)+(1x2)+(2x3)=10 Cycle2=(4x1)+(1x2)+(1x3)=9
CPI1=10/5=2
COaA, LEC03 Intro III
CPI2=9/6=1.5
Northwestern Polytechnical University
21
16.
#The
Equation
ClickPerformance
to edit Master
title style
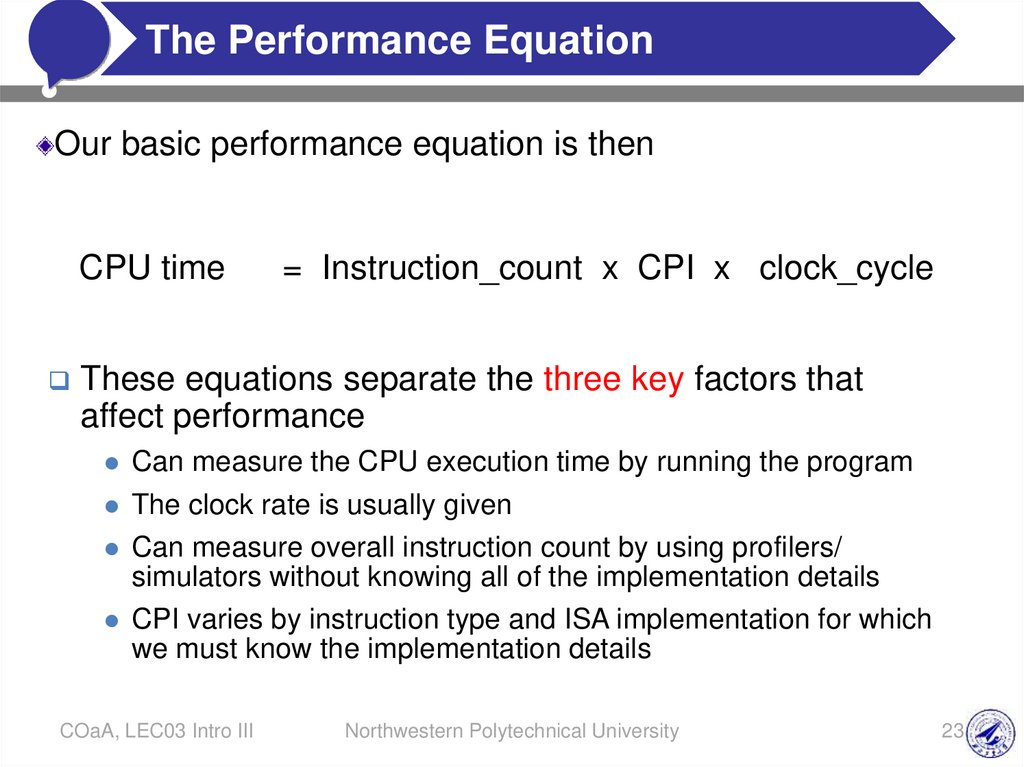
Our basic performance equation is then
CPU time
= Instruction_count x CPI x clock_cycle
These equations separate the three key factors that
affect performance
Can measure the CPU execution time by running the program
The clock rate is usually given
Can measure overall instruction count by using profilers/
simulators without knowing all of the implementation details
CPI varies by instruction type and ISA implementation for which
we must know the implementation details
COaA, LEC03 Intro III
Northwestern Polytechnical University
23
17.
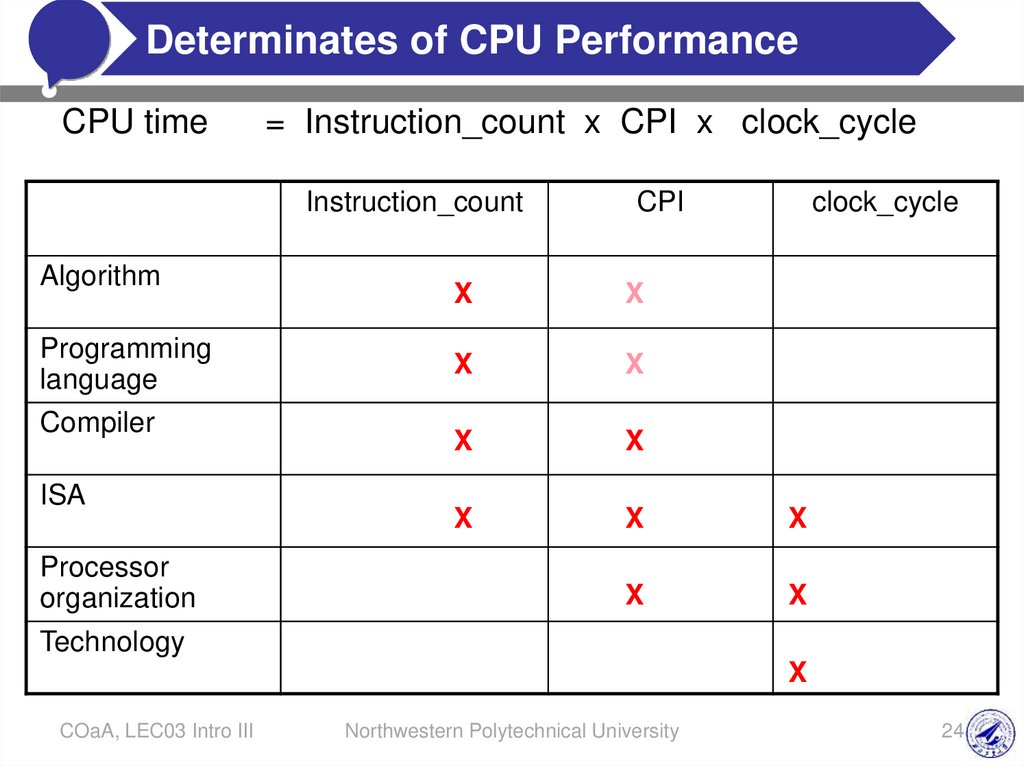
#Determinates
of CPU
Performance
Click to edit Master
title
style
CPU time
= Instruction_count x CPI x clock_cycle
Instruction_count
Algorithm
Programming
language
Compiler
ISA
Processor
organization
CPI
clock_cycle
X
X
X
X
X
X
X
X
X
X
X
Technology
X
COaA, LEC03 Intro III
Northwestern Polytechnical University
24
18.
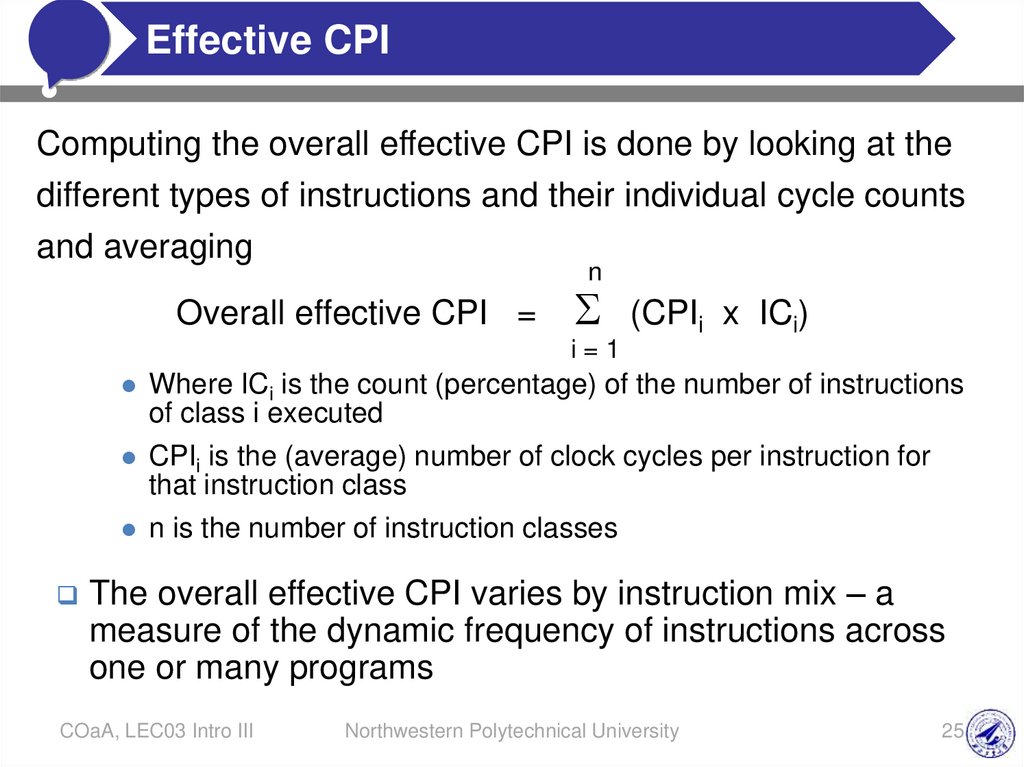
#Effective
CPIMaster title style
Click to edit
Computing the overall effective CPI is done by looking at the
different types of instructions and their individual cycle counts
and averaging
n
Overall effective CPI =
(CPIi x ICi)
i=1
Where ICi is the count (percentage) of the number of instructions
of class i executed
CPIi is the (average) number of clock cycles per instruction for
that instruction class
n is the number of instruction classes
The overall effective CPI varies by instruction mix – a
measure of the dynamic frequency of instructions across
one or many programs
COaA, LEC03 Intro III
Northwestern Polytechnical University
25
19.
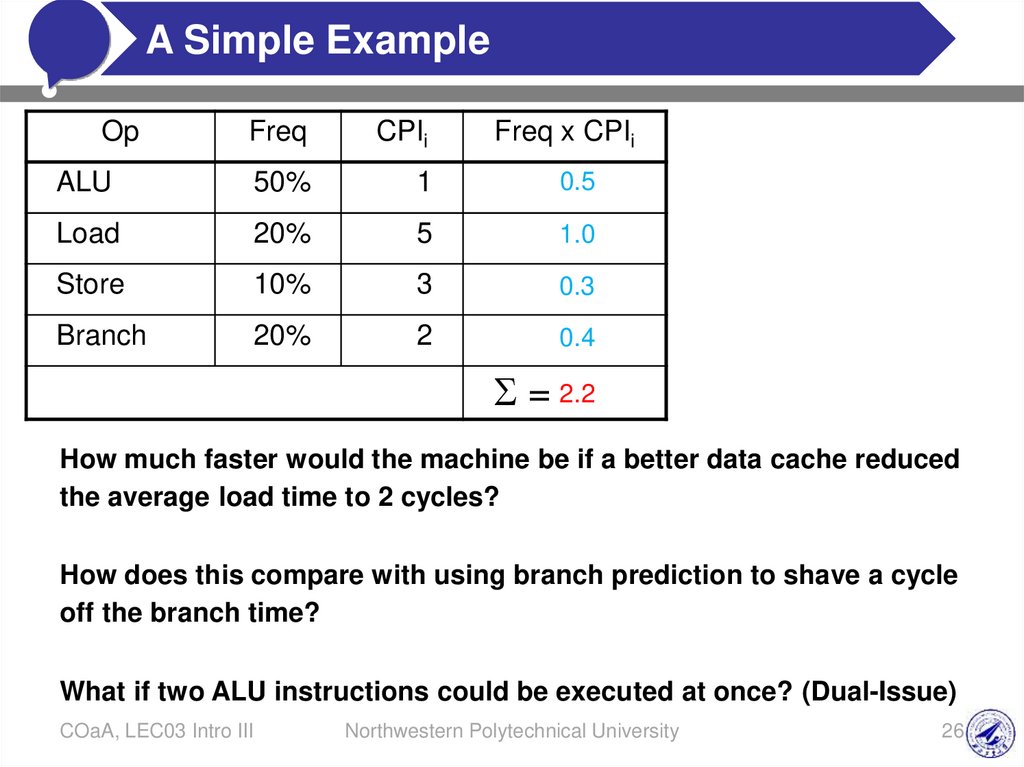
ASimple
Example
Click
to edit
Master title style
#
Op
Freq
CPIi
Freq x CPIi
ALU
50%
1
0.5
Load
20%
5
1.0
Store
10%
3
0.3
Branch
20%
2
0.4
= 2.2
How much faster would the machine be if a better data cache reduced
the average load time to 2 cycles?
How does this compare with using branch prediction to shave a cycle
off the branch time?
What if two ALU instructions could be executed at once? (Dual-Issue)
COaA, LEC03 Intro III
Northwestern Polytechnical University
26
20.
#Benchmark
Click to edit Suites
Master title style
Each vendor announces a SPEC rating for their
system
a measure of execution time for a fixed collection of
programs
is a function of a specific CPU, memory system, IO
system, operating system, compiler
enables easy comparison of different systems
The key is coming up with a collection of relevant
programs
COaA, LEC03 Intro III
Northwestern Polytechnical University
28
21.
#Click
to edit Master title style
Benchmarks
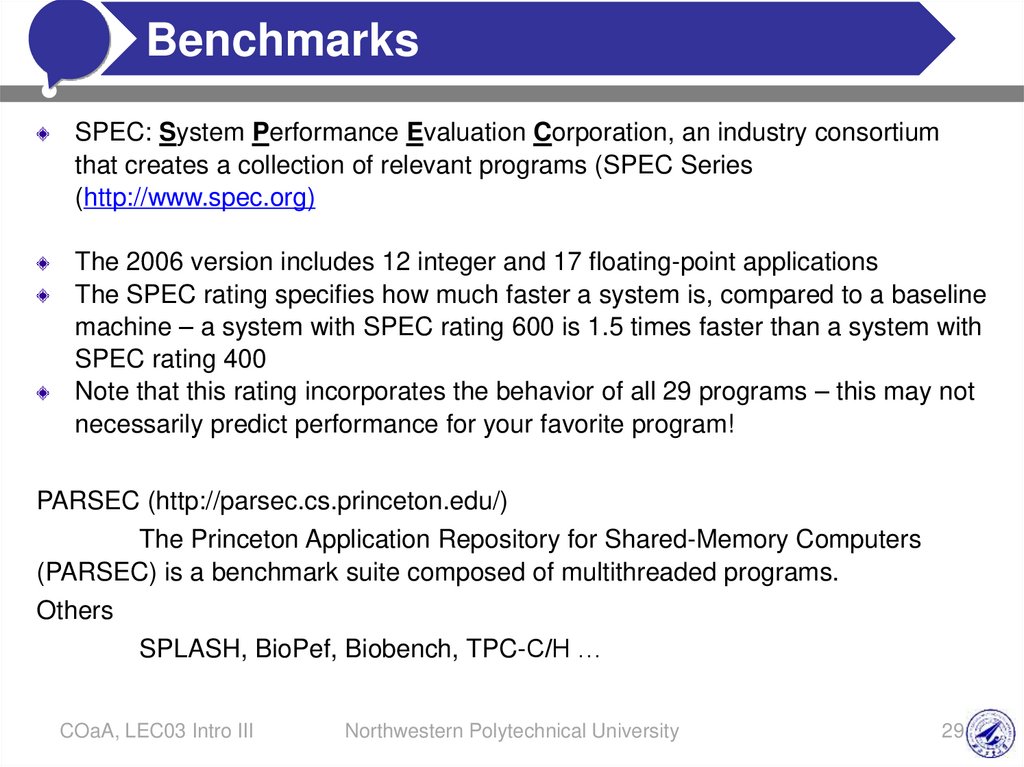
SPEC: System Performance Evaluation Corporation, an industry consortium
that creates a collection of relevant programs (SPEC Series
(http://www.spec.org)
The 2006 version includes 12 integer and 17 floating-point applications
The SPEC rating specifies how much faster a system is, compared to a baseline
machine – a system with SPEC rating 600 is 1.5 times faster than a system with
SPEC rating 400
Note that this rating incorporates the behavior of all 29 programs – this may not
necessarily predict performance for your favorite program!
PARSEC (http://parsec.cs.princeton.edu/)
The Princeton Application Repository for Shared-Memory Computers
(PARSEC) is a benchmark suite composed of multithreaded programs.
Others
SPLASH, BioPef, Biobench, TPC-C/H …
COaA, LEC03 Intro III
Northwestern Polytechnical University
29
22.
#Comparing
andMaster
Summarizing
Performance
Click to edit
title style
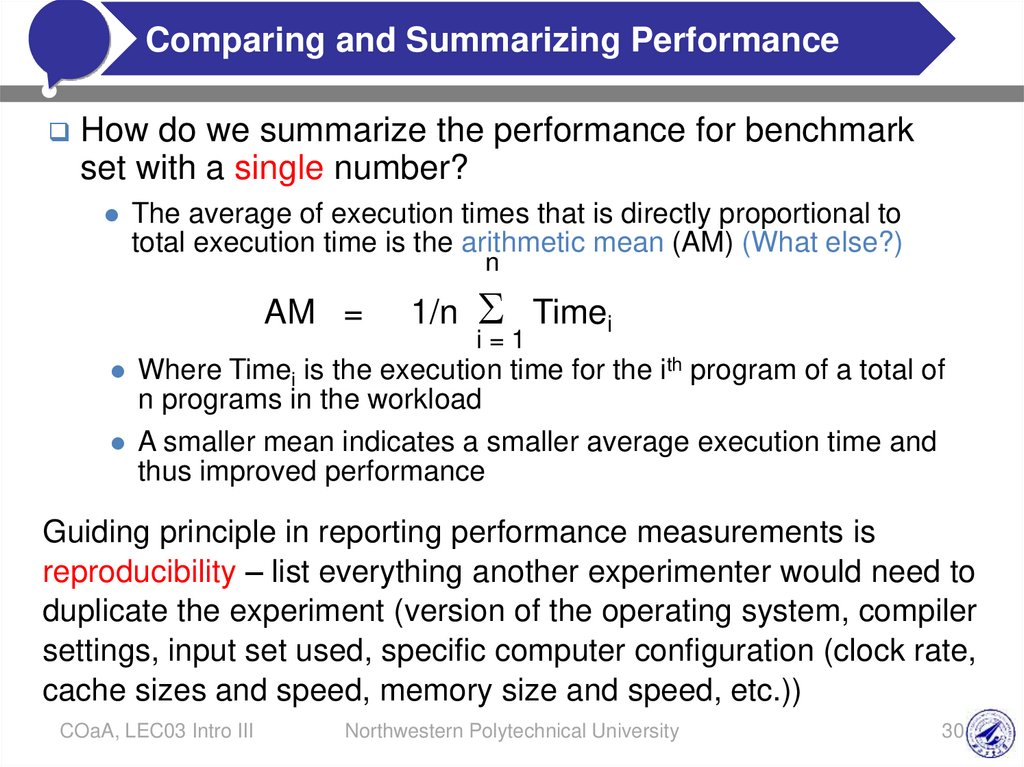
How do we summarize the performance for benchmark
set with a single number?
The average of execution times that is directly proportional to
total execution time is the arithmetic mean (AM) (What else?)
n
AM =
1/n Timei
i=1
Where Timei is the execution time for the ith program of a total of
n programs in the workload
A smaller mean indicates a smaller average execution time and
thus improved performance
Guiding principle in reporting performance measurements is
reproducibility – list everything another experimenter would need to
duplicate the experiment (version of the operating system, compiler
settings, input set used, specific computer configuration (clock rate,
cache sizes and speed, memory size and speed, etc.))
COaA, LEC03 Intro III
Northwestern Polytechnical University
30
23.
#Evaluating
Click to editISAs
Master title style
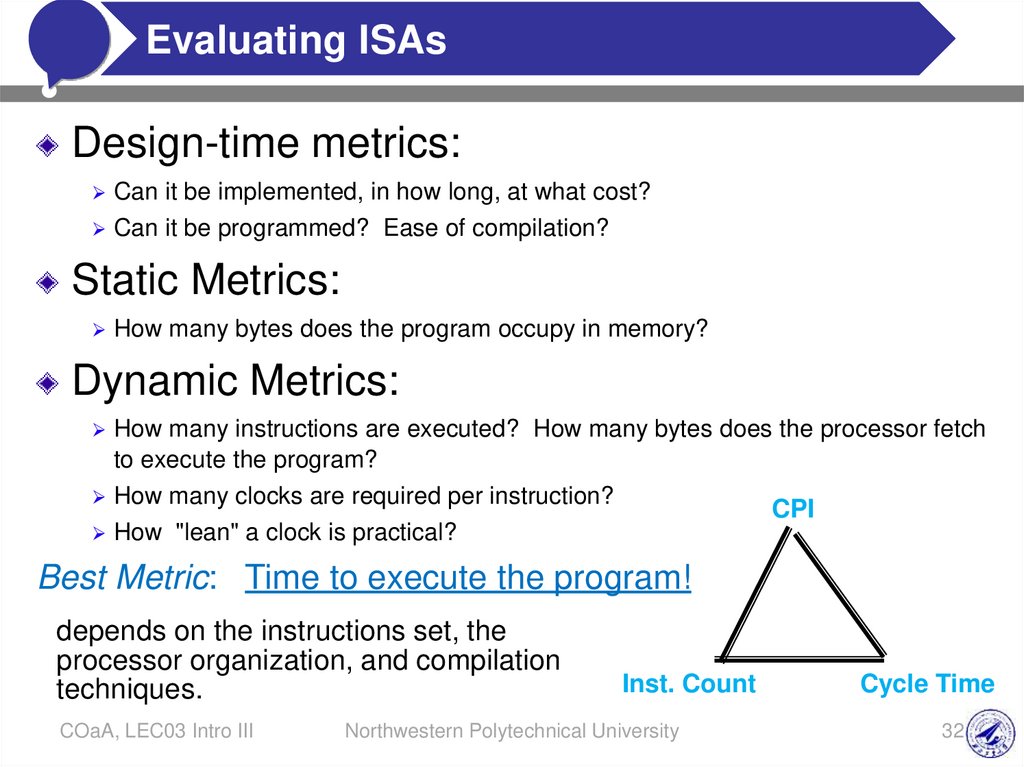
Design-time metrics:
Can it be implemented, in how long, at what cost?
Can it be programmed?
Ease of compilation?
Static Metrics:
How many bytes does the program occupy in memory?
Dynamic Metrics:
How many instructions are executed?
How many bytes does the processor fetch
to execute the program?
How many clocks are required per instruction?
How "lean" a clock is practical?
CPI
Best Metric: Time to execute the program!
depends on the instructions set, the
processor organization, and compilation
techniques.
COaA, LEC03 Intro III
Inst. Count
Northwestern Polytechnical University
Cycle Time
32
24.
#Amdahl’s
Law
Click to edit
Master title style
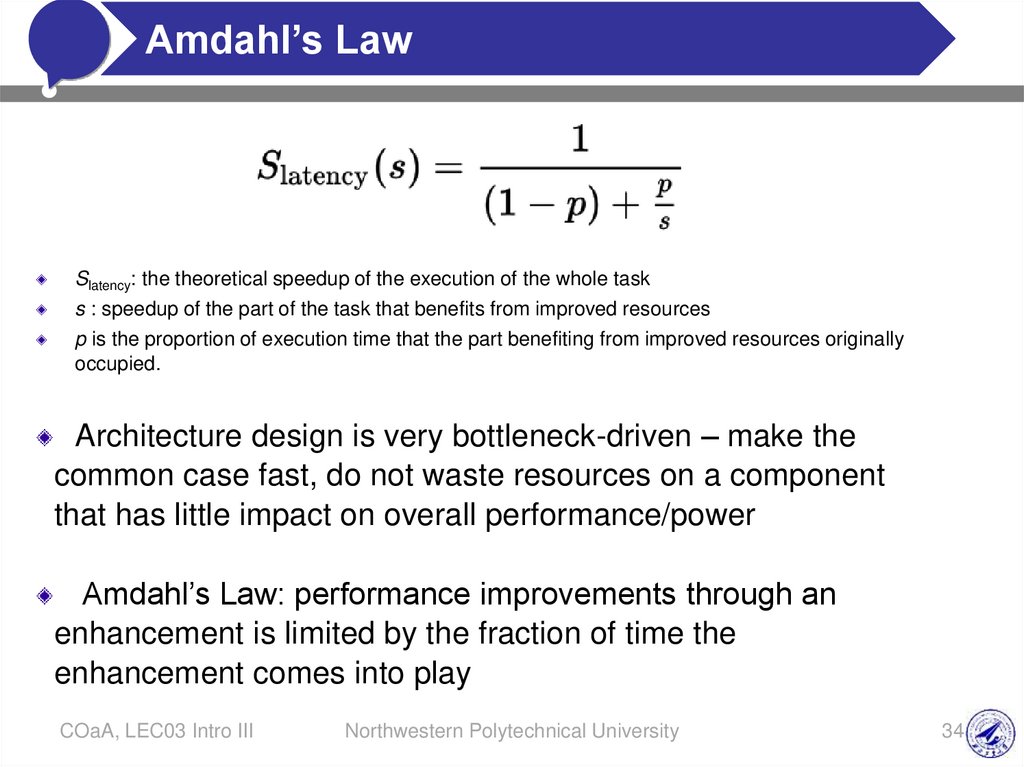
Slatency: the theoretical speedup of the execution of the whole task
s : speedup of the part of the task that benefits from improved resources
p is the proportion of execution time that the part benefiting from improved resources originally
occupied.
Architecture design is very bottleneck-driven – make the
common case fast, do not waste resources on a component
that has little impact on overall performance/power
Amdahl’s Law: performance improvements through an
enhancement is limited by the fraction of time the
enhancement comes into play
COaA, LEC03 Intro III
Northwestern Polytechnical University
34
25.
#Amdahl’s
Law
Click to edit
Master title style
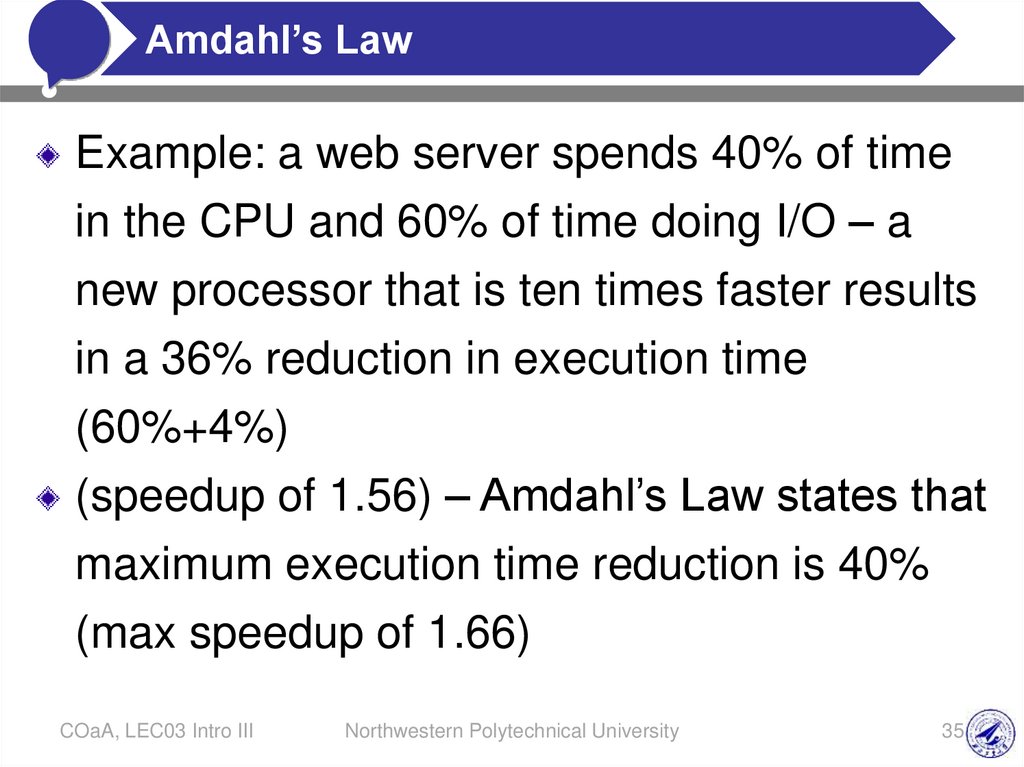
Example: a web server spends 40% of time
in the CPU and 60% of time doing I/O – a
new processor that is ten times faster results
in a 36% reduction in execution time
(60%+4%)
(speedup of 1.56) – Amdahl’s Law states that
maximum execution time reduction is 40%
(max speedup of 1.66)
COaA, LEC03 Intro III
Northwestern Polytechnical University
35
26.
#Other
Metrics:
Power
Consumption
Click to
edit Master
title
style
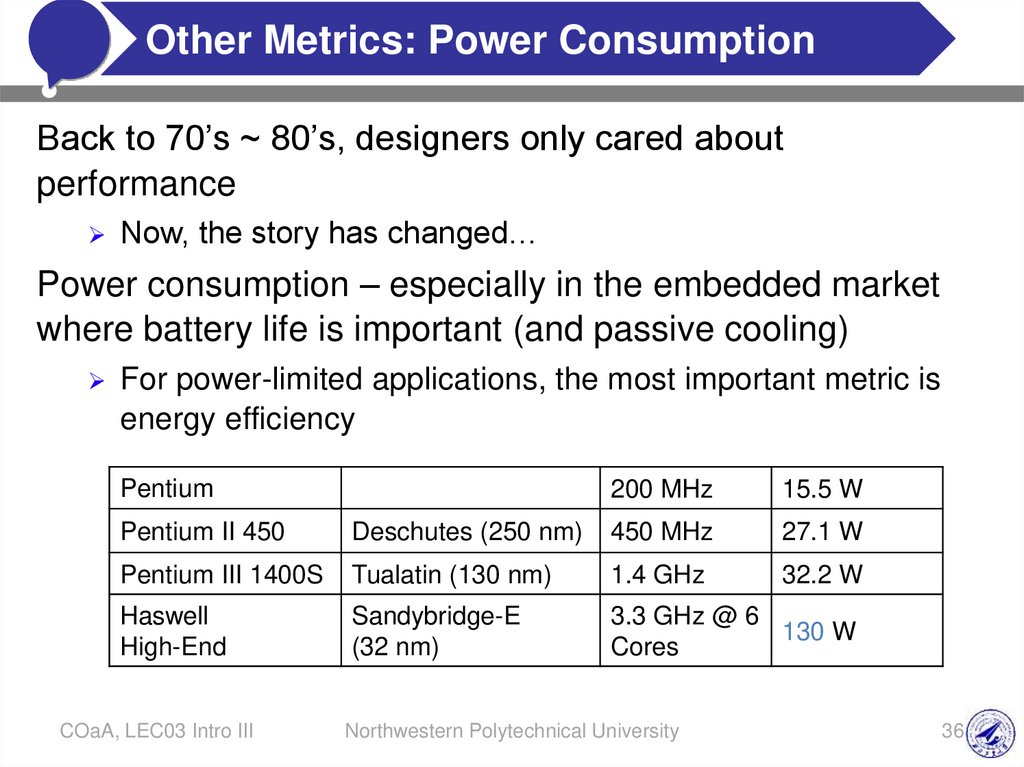
Back to 70’s ~ 80’s, designers only cared about
performance
Now, the story has changed…
Power consumption – especially in the embedded market
where battery life is important (and passive cooling)
For power-limited applications, the most important metric is
energy efficiency
Pentium
200 MHz
15.5 W
Pentium II 450
Deschutes (250 nm)
450 MHz
27.1 W
Pentium III 1400S
Tualatin (130 nm)
1.4 GHz
32.2 W
Haswell
High-End
Sandybridge-E
(32 nm)
3.3 GHz @ 6
130 W
Cores
COaA, LEC03 Intro III
Northwestern Polytechnical University
36
27.
#Example
Problem
Click to edit
Master title style
A 1 GHz processor takes 100 seconds to execute a
program, while consuming 70 W of dynamic power and 30
W of leakage power. Does the program consume less
energy in Turbo boost mode when the frequency is
increased to 1.2 GHz?
COaA, LEC03 Intro III
Northwestern Polytechnical University
43
28.
#Example
Problem
Click to edit
Master title style
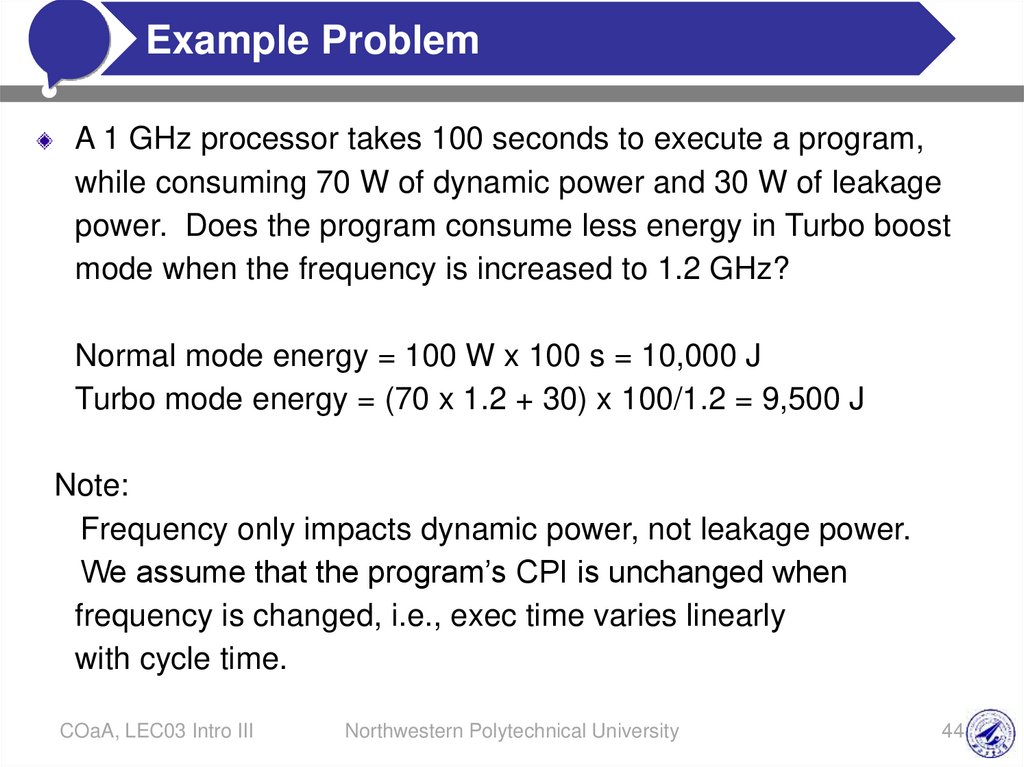
A 1 GHz processor takes 100 seconds to execute a program,
while consuming 70 W of dynamic power and 30 W of leakage
power. Does the program consume less energy in Turbo boost
mode when the frequency is increased to 1.2 GHz?
Normal mode energy = 100 W x 100 s = 10,000 J
Turbo mode energy = (70 x 1.2 + 30) x 100/1.2 = 9,500 J
Note:
Frequency only impacts dynamic power, not leakage power.
We assume that the program’s CPI is unchanged when
frequency is changed, i.e., exec time varies linearly
with cycle time.
COaA, LEC03 Intro III
Northwestern Polytechnical University
44