


 Английский язык
Похожие презентации:


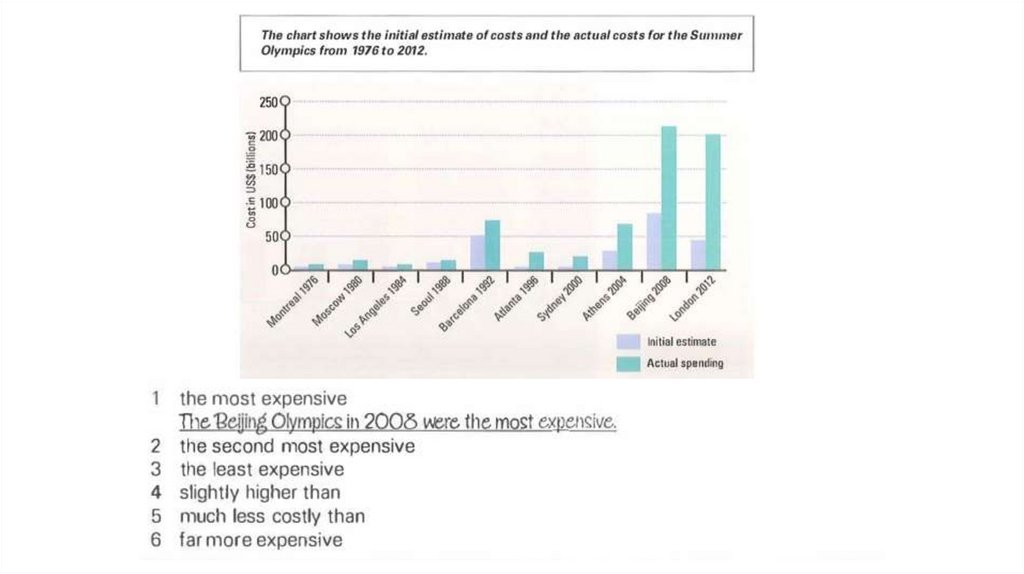
Bar charts. Writing Task 1
1. Bar charts
Writing Task 12.
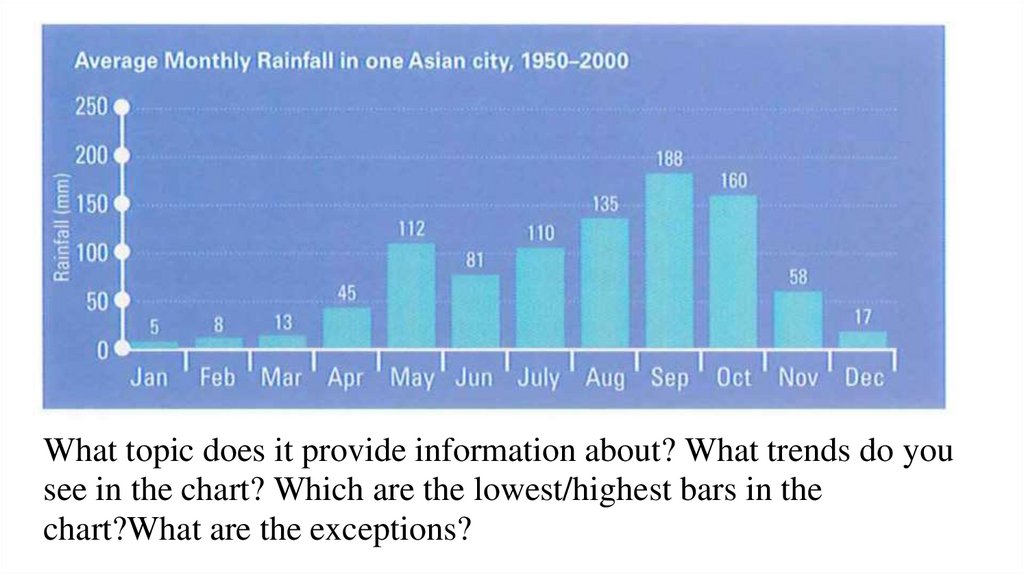
What topic does it provide information about? What trends do yousee in the chart? Which are the lowest/highest bars in the
chart?What are the exceptions?
3. Bar chart
4. Let’s write an Introduction
The graph shows the number of boys and girls playing sport in an English town in2012.
❏ Graph =>
❏ Shows =>
❏ the number of boys and girls=>
❏ playing sport =>
❏ an English town =>
How else can we say about boys and girls? Is there a common word?
Can we take information from the graph itself?
Can we change grammar?
5. Introduction
The graph shows the number of boys and girls playing sport in an English townin 2012.
The bar chart illustrates how many children, divided by gender, played six kinds
of sports (tennis, badminton, cycling, swimming, football and hockey) in a town in
England in 2012.
❏ Graph =>
❏ Shows =>
❏ the number of boys and girls=>
❏ playing sport =>
❏ an English town =>
6. Let’s write an Overview
❏ What are we comparing? Are thereany significant/the most catchy
data?
❏ What is the general comparison
between girls and boys playing
sport?
❏ Who played sport more in general?
❏ Which sport was the most popular
among boys/girls?
❏ Which sport was the least popular
among boys/girls?
7. Overview
Overall, the number of boys playingsport exceeded that of girls in the given
period and the sport with the most
significant difference between the
genders was football. Football was also
the most popular sport for boys while
the majority of girls preferred
swimming. Furthermore, both males
and females least preferred playing
hockey.
8. Body paragraphs
❏ How can we groupinformation?
❏ By girls/by boys?
❏ By kinds of sports?
❏ What would be more
convenient and logical to
compare with each other?
9. Body paragraph 1
There were four sports in which boysparticipated more than girls. While 60 boys
played football, the number of girls playing
the sport was considerably lower (around
20). With regards to tennis, the figure for
boys who played that sport was 50 as
opposed to just under 40 for girls. Similarly,
more boys cycled than girls (approximately
35 and 20 respectively). The difference, in
terms of hockey, was minimal with only
about 5 more boys playing that sport than
girls.
10. Body paragraph 2
On the other hand, more girls tookpart in the two remaining sports
which both showed a difference of
about 10 between the genders. As
many as 50 girls preferred
swimming in comparison to 40 girls
for badminton.
11. Useful phrases/comparison
❏ There were ….❏ With regards to tennis…
❏ The figure for boys…
❏ The difference was minimal…
❏ In terms of…
❏ Similarly…
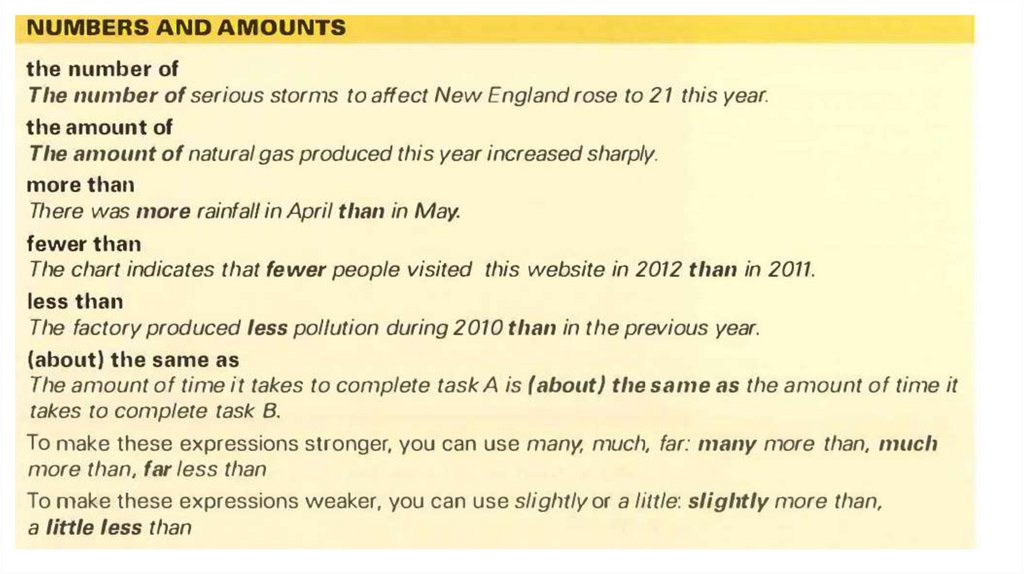
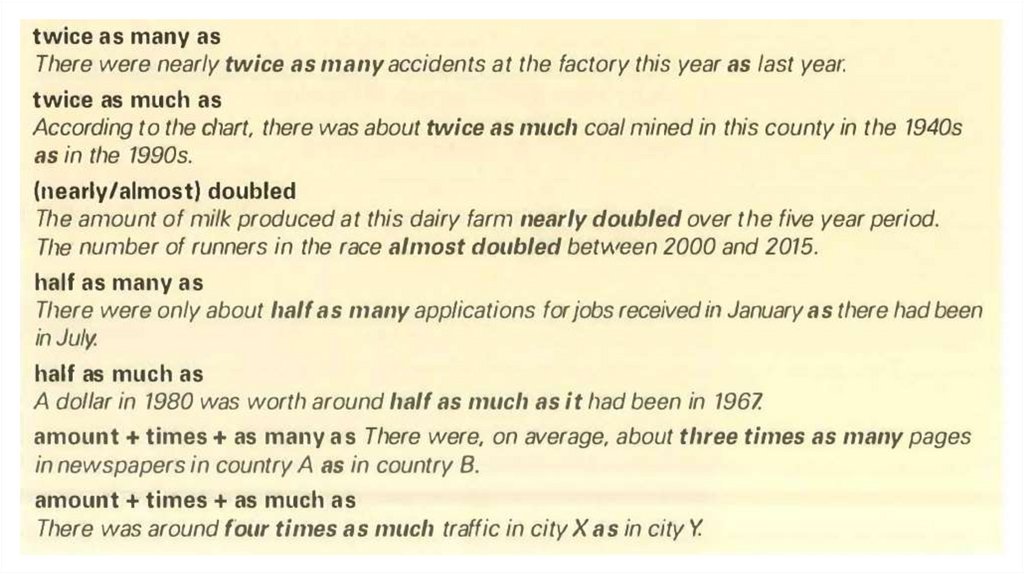
12. Grammar for Bar charts/Approximation
13.
14.
15.
16.
17.
18. Homework
What is the overall idea of thechart?
What are the key features of a
bar chart
What are two important points
about undergraduate student
accommodation?
What are two important points
about graduate student
accommodation?
What points of comparison can
you make between
undergraduate and graduate
student accommodation?