


 Финансы
Похожие презентации:


")

Analyzing financial statements: analysis techniques
1. Analyzing Financial Statements:
Analysis Techniques2. Liquidity Ratios
Liquidity reflects the ability of a company to meet itsshort-term obligations using assets that are most readily
converted into cash.
Assets that may be converted into cash in a short period
of time are referred to as liquid assets; they are listed in
financial statements as current assets.
3. Liquidity Ratios
Current assets are often referred to as working capitalbecause these assets represent the resources needed for
the day-to-day operations of the company's long-term,
capital investments.
Current assets are used to satisfy short-term obligations,
or current liabilities. The amount by which current
assets exceed current liabilities is referred to as the net
working capital
4. Measures of liquidity
Liquidity is the ability to satisfy the company’s short-term obligations using assets that can be most readily
converted into cash.
Liquidity ratios:
Current ratio =
Current assets
Current liabilities
Cash +
Quick ratio =
Short−term
+ Receivables
investments
Current liabilities
Short−term
investments
Cash ratio =
Current liabilities
Cash +
Ability to satisfy current
liabilities using current assets.
Ability to satisfy current
liabilities using the most liquid
of current assets.
Ability to satisfy current
liabilities using only cash and
cash equivalents.
4
5. Measures of liquidity
Generally, the larger these liquidity ratios, the better theability of the company to satisfy its immediate obligations.
Is there a magic number that defines good or bad?
Not really.
Consider the current ratio. A large amount of current assets
relative to current liabilities provides assurance that the
company will be able to satisfy its immediate obligations.
However, if there are more current assets than the company
needs to provide this assurance, the company may be
investing too heavily in these non- or low-earning assets and
therefore not putting the assets to the most productive use.
6. Measures of liquidity
The net working capital to sales ratio is the ratio ofnet working capital (current assets minus current
liabilities) to sales;
Indicates a company's liquid assets (after meeting shortterm obligations) relative to its need for liquidity
(represented by sales)
Curren tassets - Current l iabilities
Net working capital to sales ratio =
Sales
7. Measures of liquidity
Microsoft Liquidity Ratios -- 2004Current ratio = $70,566 million / $14,696 million = 4.8017
Quick ratio = ($70,566-421) / $14,696 = 4.7731
Net working capital-to-sales = ($70,566-14,969) / $36,835 =
1.5515
Source of data: Balance Sheet and Income Statement, Microsoft
Corporation Annual Report 2005
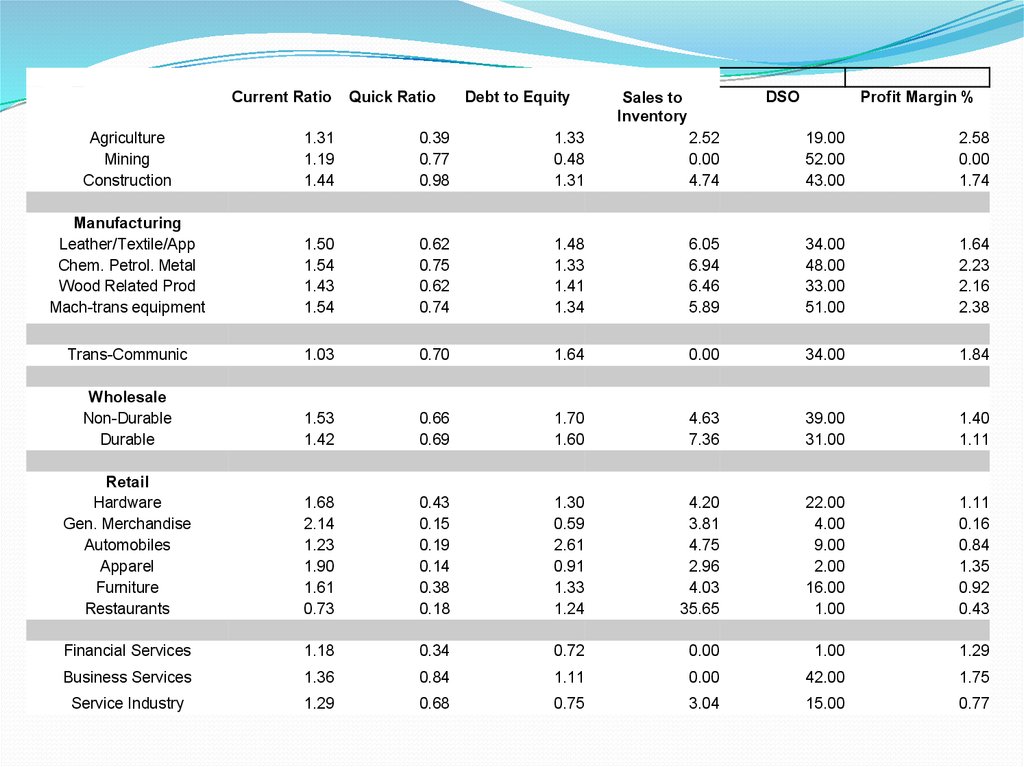
8.
Current RatioQuick Ratio
Debt to Equity
DSO
Sales to
Inventory
Profit Margin %
Agriculture
Mining
Construction
1.31
1.19
1.44
0.39
0.77
0.98
1.33
0.48
1.31
2.52
0.00
4.74
19.00
52.00
43.00
2.58
0.00
1.74
Manufacturing
Leather/Textile/App
Chem. Petrol. Metal
Wood Related Prod
Mach-trans equipment
1.50
1.54
1.43
1.54
0.62
0.75
0.62
0.74
1.48
1.33
1.41
1.34
6.05
6.94
6.46
5.89
34.00
48.00
33.00
51.00
1.64
2.23
2.16
2.38
Trans-Communic
1.03
0.70
1.64
0.00
34.00
1.84
Wholesale
Non-Durable
Durable
1.53
1.42
0.66
0.69
1.70
1.60
4.63
7.36
39.00
31.00
1.40
1.11
Retail
Hardware
Gen. Merchandise
Automobiles
Apparel
Furniture
Restaurants
1.68
2.14
1.23
1.90
1.61
0.73
0.43
0.15
0.19
0.14
0.38
0.18
1.30
0.59
2.61
0.91
1.33
1.24
4.20
3.81
4.75
2.96
4.03
35.65
22.00
4.00
9.00
2.00
16.00
1.00
1.11
0.16
0.84
1.35
0.92
0.43
Financial Services
1.18
0.34
0.72
0.00
1.00
1.29
Business Services
1.36
0.84
1.11
0.00
42.00
1.75
Service Industry
1.29
0.68
0.75
3.04
15.00
0.77
9. The role of the operating cycle
How much liquidity a company needs depends on itsoperating cycle. The operating cycle is the duration
between the time cash is invested in goods and services
to the time that investment produces cash.
For example, a company that produces and sells goods has an
operating cycle comprising four phases:
purchase raw material and produce goods, investing in
inventory;
sell goods, generating sales, which may or may not be
for cash;
extend credit, creating accounts receivables, and
collect accounts receivables, generating cash.
10. The role of the operating cycle
A company with a long operating cycle may have moreneed to liquid assets
than a company with
a
short operating cycle. That's because a long operating
cycle indicate that money is tied up in inventory (and
then receivables) for a longer length of time.
11. Solvency Analysis
A company’s business riskis determined, in large part,
from the company’s line of
business.
Financial risk is the risk
resulting from a company’s
choice of how to finance
the business using debt or
equity.
We use solvency ratios to
assess a company’s
financial risk.
Risk
Business
Risk
Financial
Risk
Sales Risk
Operating
Risk
11
12. Solvency Analysis
There are two types of solvency ratios: componentpercentages and coverage ratios.
Component percentages involve comparing the
elements in the capital structure.
Coverage ratios measure the ability to meet
interest and other fixed financing costs.
13. Solvency ratios
Component-PercentageSolvency Ratios
Solvency ratios
Total debt
Total assets
Long−term debt
Long−term debt−to−assets ratio =
Total assets
Debt−to−assets ratio =
Debt−to−equity ratio =
Financial leverage =
Total debt
Total shareholders′ equity
Total assets
Total shareholders′ equity
Coverage Ratios
Interest coverage ratio =
EBIT
Interest payments
Proportion of assets financed with debt.
Proportion of assets financed with longterm debt.
Debt financing relative to equity
financing.
Reliance on debt financing.
Ability to satisfy interest obligations.
EBIT + Lease payments
Fixed charge
=
coverage ratio Interest payments + Lease payments
Ability to satisfy interest and lease
obligations.
CFO + Interest payments + Tax payments
Cash flow
=
coverage ratio
Interest payments
Ability to satisfy interest obligations with
cash flows.
CFO
Cash−flow−to−
=
debt ratio
Total debt
Length of time needed to pay off debt
with cash flows.
Copyright © 2013 CFA Institute
13